Article

Estimation of the Effects of Achilles Tendon Geometry on the Magnitude and Distribution of Local Strain: A Finite Element Analysis

1
Institute for Promotion of Education and Campus Life, Okayama University, 2-1-1 Tsushima-naka, Kita-ku, Okayama 700-8530, Japan
2
Graduate School of Education, Hyogo University of Teacher Education, 942-1, Shimokume, Kato 673-1494, Japan
*
Author to whom correspondence should be addressed.
Biomechanics 2023, 3(4), 583-595; https://doi.org/10.3390/biomechanics3040047
Submission received: 28 October 2023 / Revised: 25 November 2023 / Accepted: 28 November 2023 / Published: 4 December 2023
(This article belongs to the Section Tissue and Vascular Biomechanics)

Abstract

:
We investigated the influence of Achilles tendon (AT) geometry on local-strain magnitude and distribution during loading, using finite element analysis. We calculated the following eight AT parameters for 18 healthy men: thickness and width of the most distal part, minimum cross-sectional area (mCSA), and most proximal part; length; and position of the mCSA. To investigate the effect of AT geometry on the magnitude and distribution of local strain, we created three-dimensional numerical models by changing the AT parameter values for every one standard deviation (SD) in the range of ±2 SD. A 4000 N lengthening force was applied to the proximal surface of all the models. The mean first principal strain (FPS) was determined every 3% of the length. The highest FPS in each model was mainly observed in the proximal regions; the 86–89% site (the most proximal site was set at 100%) had the highest number of models with the highest FPS (nine models). The highest FPS was observed in the model with a distal thickness of −2 SD, which was 27.1% higher than that of the standard model observed in the 2–5% site. Therefore, the AT geometry influences local-strain magnitude and distribution during loading.

1. Introduction

The Achilles tendon (AT) is the largest and strongest tendon in the human body. It has spring-like properties involved in the storage and release of mechanical energy as well as in the transmission of the force generated by the triceps surae muscles to the calcaneus, thereby contributing to an efficient execution of body movements [1,2]. However, the AT is continuously exposed to mechanical loads during locomotion and sports activities, which can increase the likelihood of rupture and tendinopathy.
Previous studies have reported that the incidence of AT rupture ranges from approximately 4.7 [3] to 37.3 [4] per 100,000 individuals. More than half of elite runners experience Achilles tendinopathy during their lifetime [5]. After AT rupture, patients may return to work and play after 59–108 days [6] and an average of 6 months [7], respectively, depending on the treatment approach. Similarly, Achilles tendinopathy can restrict patient participation in sports for a prolonged period [8] and decrease the quality of life because of pain; therefore, it is important to identify the risk factors for rupture and tendinopathy of the AT as well as prevention strategies.
Rupture and tendinopathy of the AT do not occur uniformly throughout the tendon; they reportedly occur preferentially at a distance of approximately 2–6 cm above the AT insertion on the calcaneus [9,10]. Therefore, it is predicted that high tissue deformation occurs in this region during physical activity. Thus, evaluating the strain within the AT during physical activity is important for understanding the mechanism of onset of AT rupture and tendinopathy.
Therefore, recent studies have extensively investigated local AT strain [11,12,13] using finite element analysis (FEA). For example, Oda et al. reported that the peak strain within the AT was observed in the part with a small cross-sectional area (CSA) during loading [11]. Furthermore, Hisano et al. estimated local strain during loading using a finite element model of the AT created from individual magnetic resonance imaging (MRI) findings and analyzed the correlation with geometric parameters [12]. Their findings revealed a positive correlation between local strain and the length of the AT, indicating that a longer AT results in higher local strain. In contrast, they did not control for parameters other than the tendon length owing to the experimental setting, in which the model was created using MRI findings. Therefore, it is difficult to accurately quantify the effect of tendon length on local strain because the other geometry, such as thickness and width, differs as well as the length among models. Thus, experiments using models that control for parameters other than the geometry of interest should be conducted to accurately assess the impact of AT geometry on the local strain.
This study aimed to generate an artificial three-dimensional AT model to control for parameters other than the geometry of interest and to estimate the effects of AT geometry (i.e., thickness, width, and length) on the magnitude and distribution of local strains by analyzing the local strain under loading in the various geometry models generated. A previous FEA study reported that the peak strain within the AT was observed near the region with the minimum CSA (mCSA) [11]; therefore, we hypothesized that the local strain would be higher under conditions of reduced AT thickness and width, and that higher strains would be observed in regions with a smaller AT thickness and width.

2. Materials and Methods

2.1. Mesh Generation

We generated an artificial 3D AT model using data obtained from a previous experimental study [12], in which cross-sectional MRI measurement of the AT was performed in 18 healthy men without an AT-related medical history (age, 26.9 years; standard deviation [SD], 3.7 years). MRI measurement was performed using a 1.5 T magnetic resonance system (SIGNA, GE Medical Systems, Milwaukee, WI, USA) (repetition time, 600 ms; echo time, 11.32 ms; slice thickness, 3 mm; within-slice resolution, 0.312 × 0.312 mm/pixel). AT was defined as the region from the soleus muscle muscle–tendon junction to the calcaneal insertion. Eighteen 3D models were generated from the trace image.
We calculated the following eight AT parameters from these 18 3D models using a computer-aided design software (Fusion 360, Autodesk Inc., San Francisco, CA, USA): the thickness and width of the most distal, mCSA, and most proximal parts; the length; and the position of the mCSA part. We developed a standard 3D AT model using these eight parameters (Figure 1). Here, we defined the anteroposterior and mediolateral diameters of each part of the AT as the thickness and width, respectively. Some parts of the AT are attached to the calcaneus, whereas other parts are not; moreover, the abovementioned previous study conducted using FEA reported that the distal part attached to the calcaneus did not undergo large deformation when a lengthening force was applied [12]. Szaro and Ghali Gataa [14] reported the length of both the external AT that is attached to the calcaneus and that of the parts that are not; therefore, only the part of the AT with no calcaneal attachment was analyzed. Table 1 presents the mean, SD, and range of each calculated parameter. To investigate the effect of AT geometry on the magnitude and distribution of local strain by numerical simulation, we created numerical models by changing the following seven parameter values for every 1 SD in the range of ±2 SD, which theoretically includes approximately 95% of the data in a normal distribution: the thickness and width of the most distal, mCSA, and most proximal parts, as well as the length. In total, 29 models, including the standard model, were generated. The name of each model was described using an abbreviation: “d”, “mc”, “pr”, “l”, “w”, “t”, “p”, and “m” stand for distal, mCSA, proximal, length, width, thickness, plus, and minus, respectively. The number after “p” or “m” indicates the range of SD change. For example, “d_t_m2” refers to a model with a 2 SD smaller thickness in the distal part, while “l_p1” refers to a model with 1 SD longer length. Geometry for the standard model and models with +2 SD or −2 SD for each parameter are presented in Figure 2.

2.2. Mesh Convergence Test

Here, the models were meshed with tetrahedral elements using a mesh generator “TetGen” implemented in the V-Biomech version 1.0 (RIKEN VCAD system study program) FEA system [15], which is designed for biological tissues. To find the optimum element size, we conducted the mesh convergence test using three standard models with different element numbers. The element numbers of the three models were 8,678 (Mesh 1), 15,998 (Mesh 2), and 23,998 (Mesh 3). If increasing the mesh number led to a change of ≤5% in the maximum displacement, the mesh was considered adequately refined [16,17]. The results demonstrated that the difference between Mesh 1 and Mesh 2 was 6.48%; however, the difference between Mesh 2 and Mesh 3 was 0.32%. Therefore, all models in this study contained more than the element number of Mesh 3 (23,998). The models contained, on average, 9,012 (SD, 3,915) nodes and 39,257 (SD, 16,092) elements.

2.3. Setting of Material Properties

A hyperelastic model, the Mooney–Rivlin model (second order), was used to specify the mechanical properties of the AT. Here, the tendon tissue was assumed to be a nearly incompressible material with almost no deformation-induced volume change; thus, the elastic potential W was expressed as follows:
W = a 10 I 1 3 + a 01 I 2 3 + a 20 I 1 3 2 + a 11 I 1 3 I 2 3 + a 02 I 2 3 2 I 3 = 0.9999  
The coefficients a10, a01, a20, a11, and a02 indicate the length-force characteristics. I1, I2, and I3 represent the principal invariants of the right Cauchy–Green deformation tensor C. The five coefficients in the constitutive formula were referenced from the values calculated by Yamamura et al. [18], based on the mechanical properties of human ATs reported by Louis–Ugbo et al. [19] (Table 2). Notably, we assumed that (1) the material properties of the tissue were isotropic, and (2) there were no regional differences in the material properties.

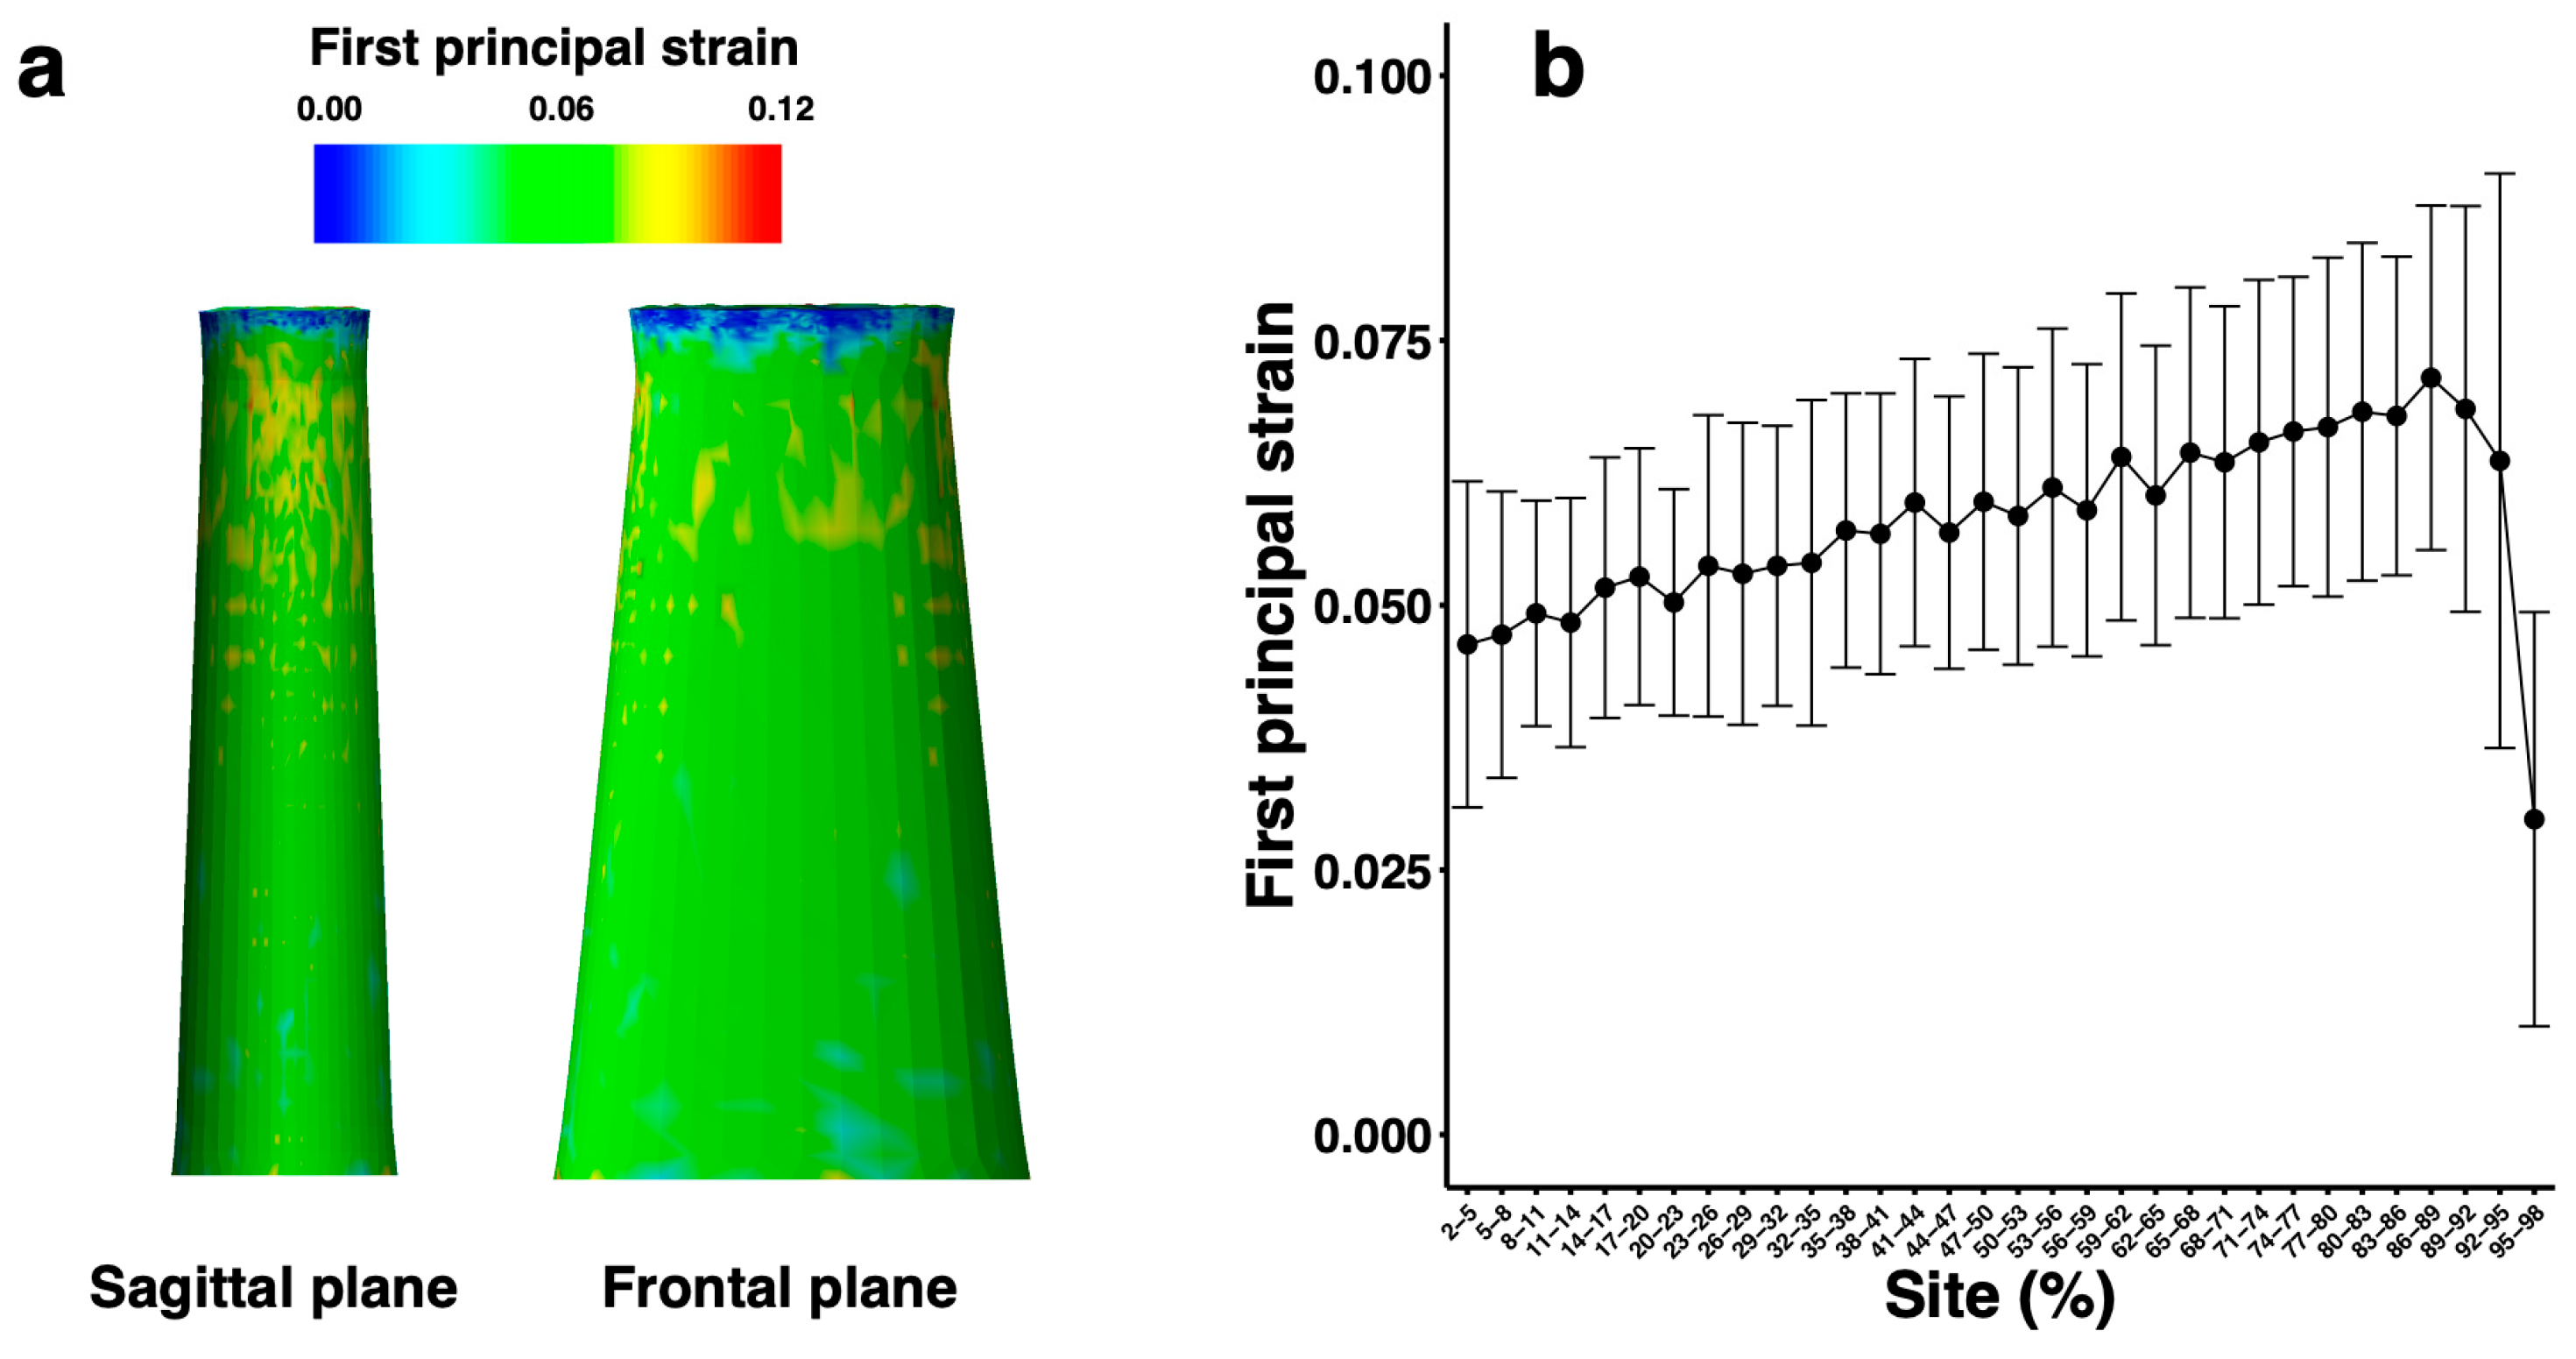
2.4. Finite Element Analysis and Calculation of First Principal Strain

The proximal surfaces of the models were displaced only in the long-axis direction (Figure 3a), and a 4000 N lengthening force (which corresponds to an approximation of the peak AT force during hopping: absolute value, 3786 N) [20] was applied to the proximal surface (Figure 3b). This 4000 N lengthening force was applied by applying a 200 N lengthening force to each of 20 proximal surface nodes. The distal surface was fully fixed (Figure 3c).
FEA was performed using V-Biomech software. V-Biomech has been used in previous FEA of muscles and tendons [18,21]. The first principal strain (FPS) in each finite mesh was calculated to quantify the strain distribution in the AT during loading. The mean and SD of the FPS for 96% of the range, except for the top and bottom 2% of the length of the model, were determined every 3% in the length. The top and bottom 2% were excluded from the analysis because the boundary conditions might have affected them.

2.5. Validation of the Finite Element Model
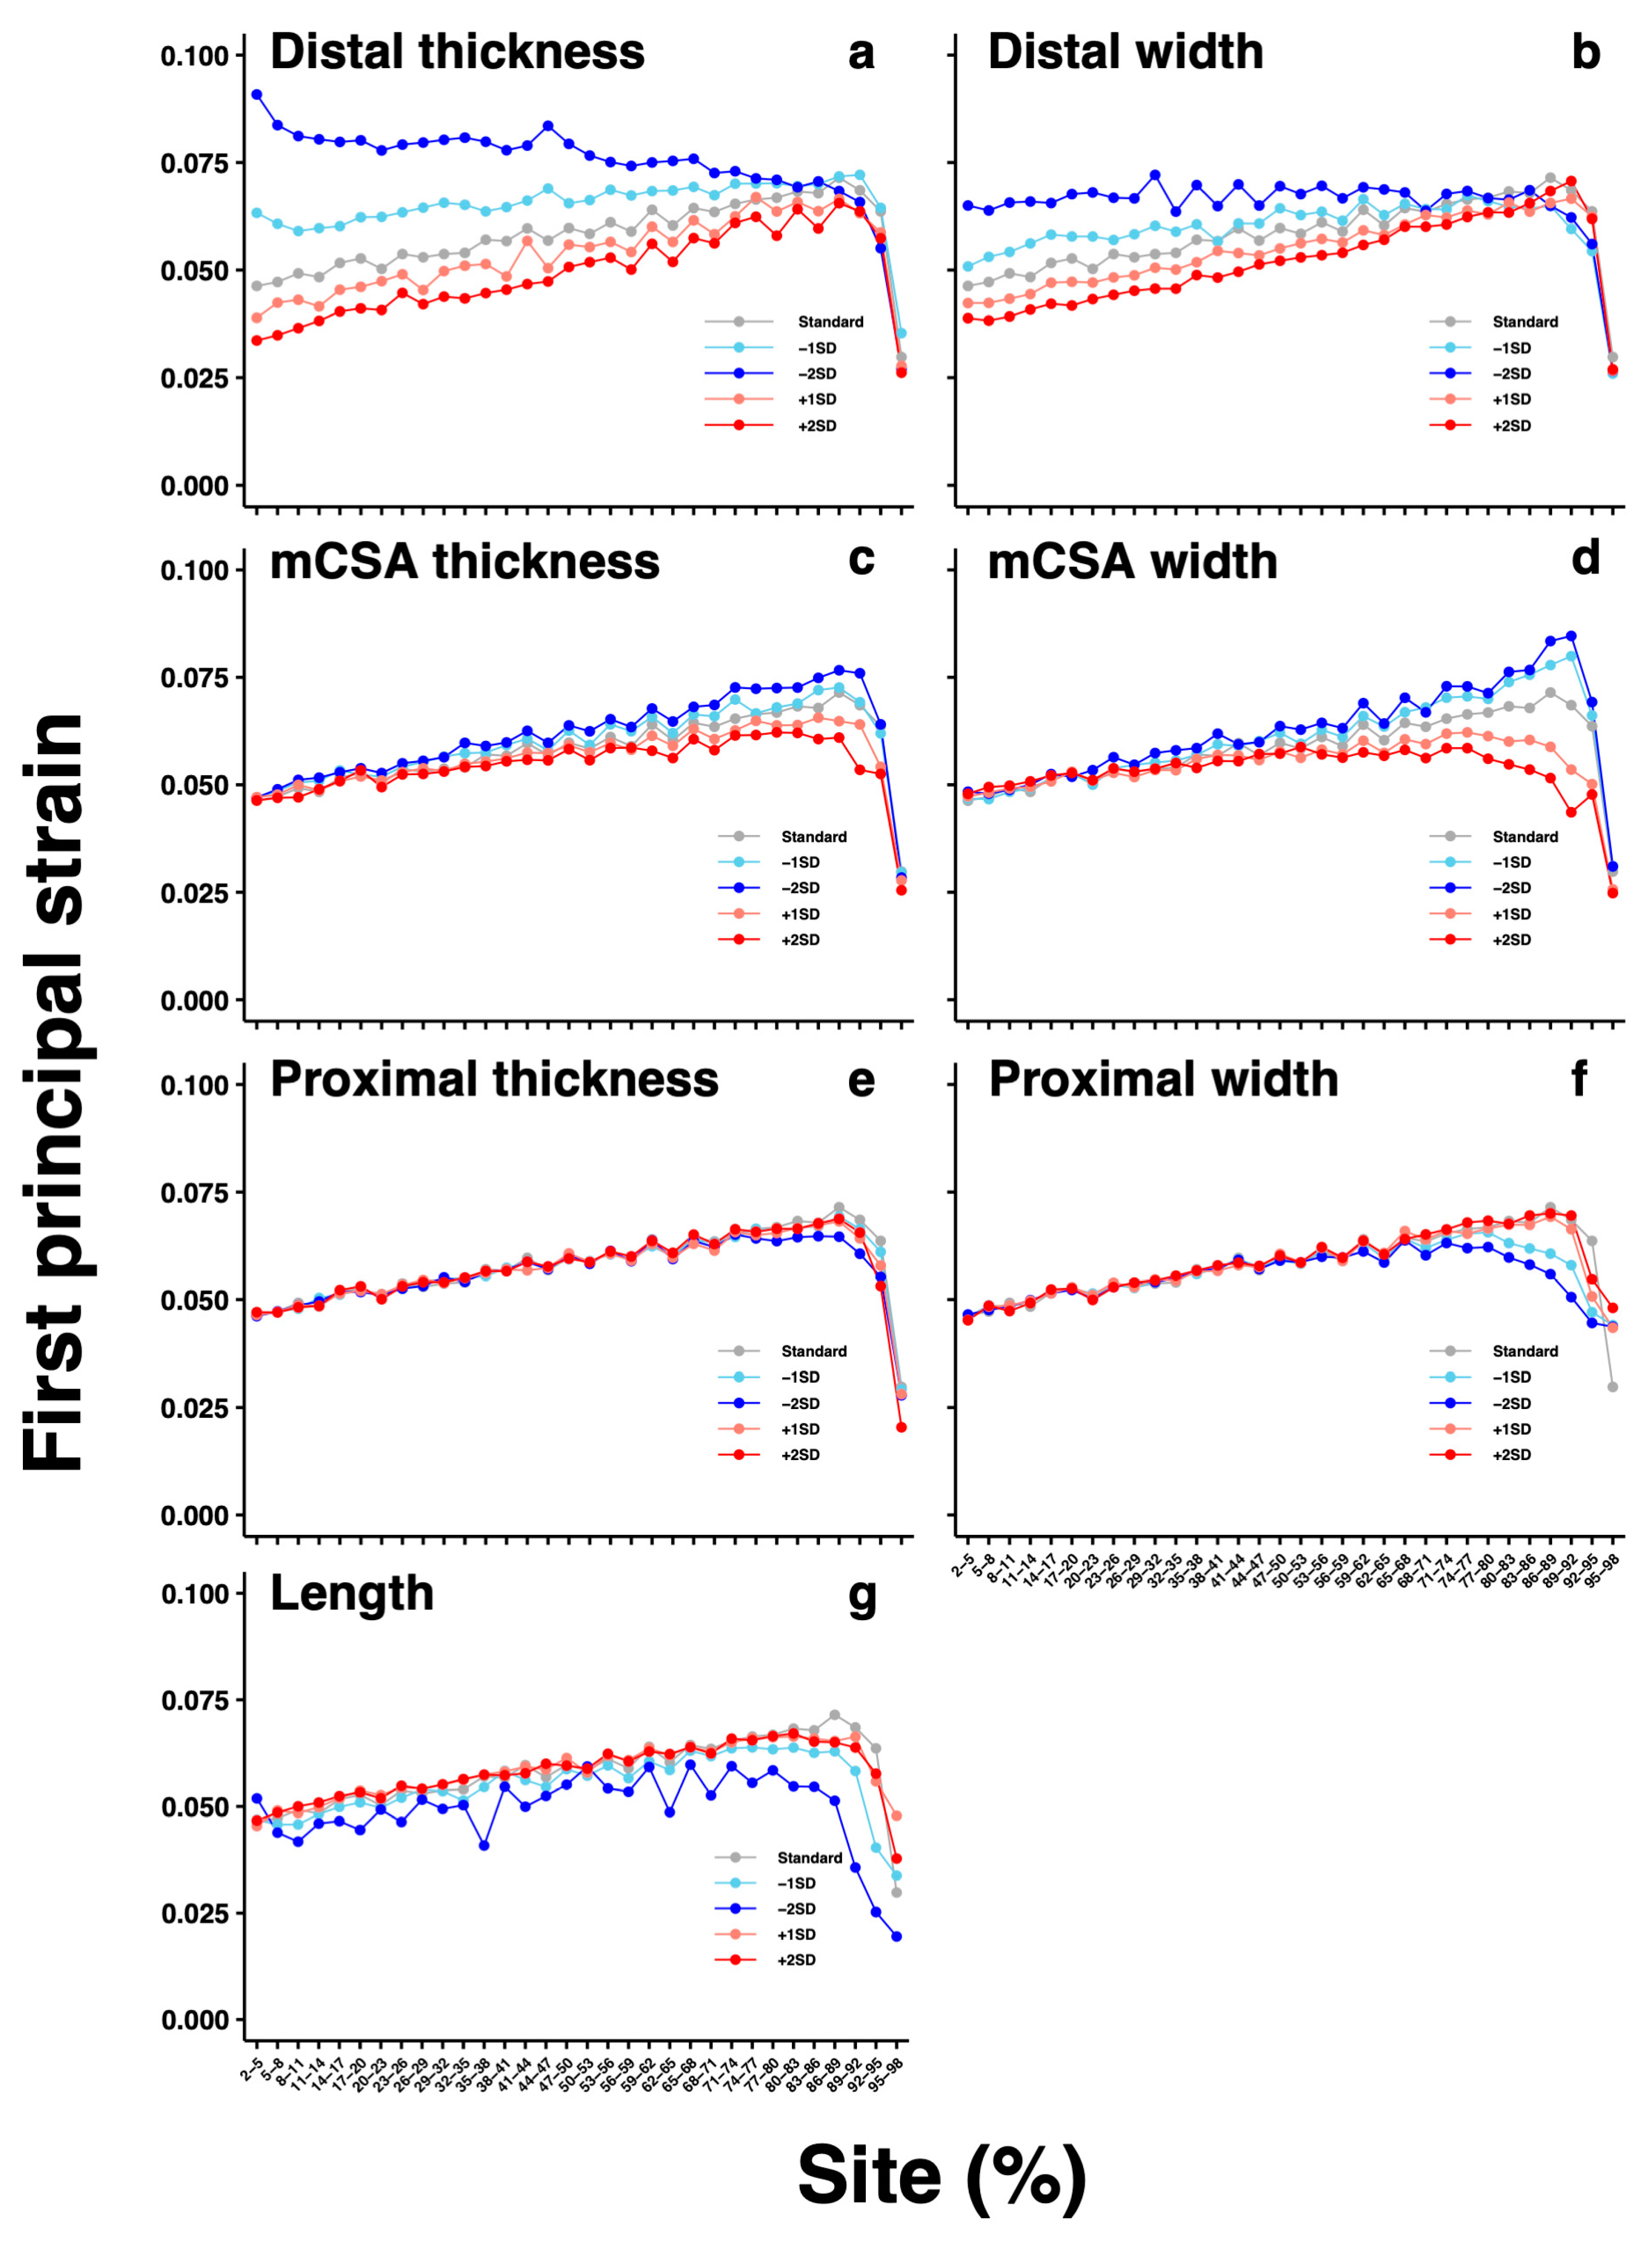
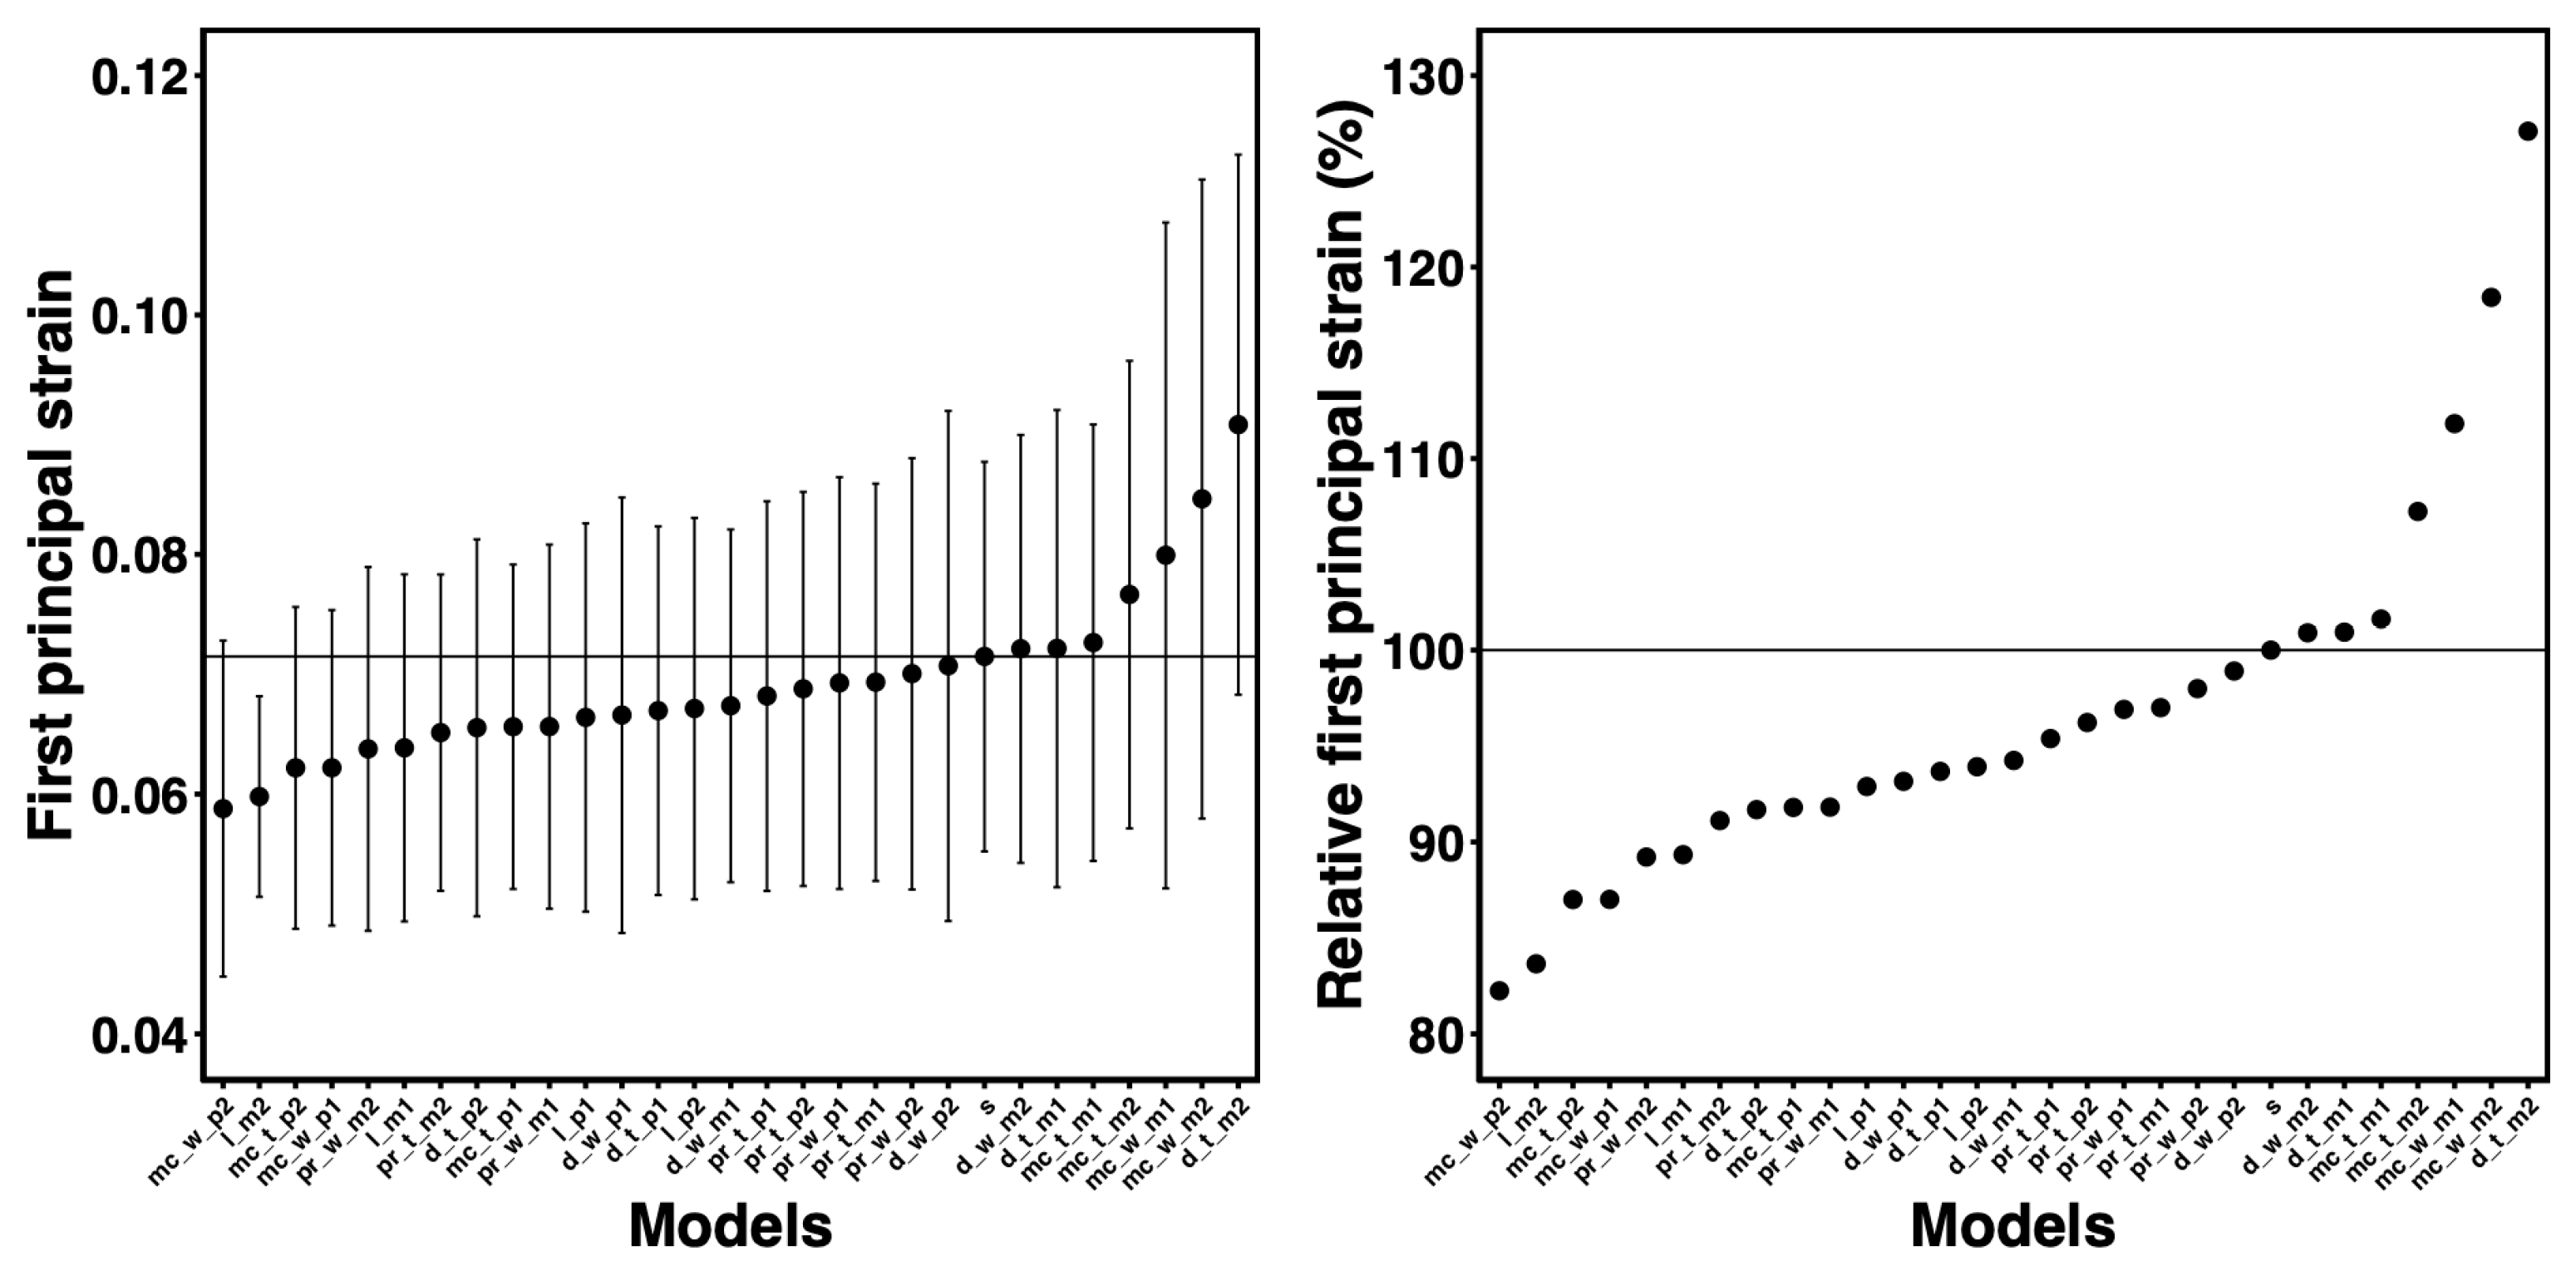
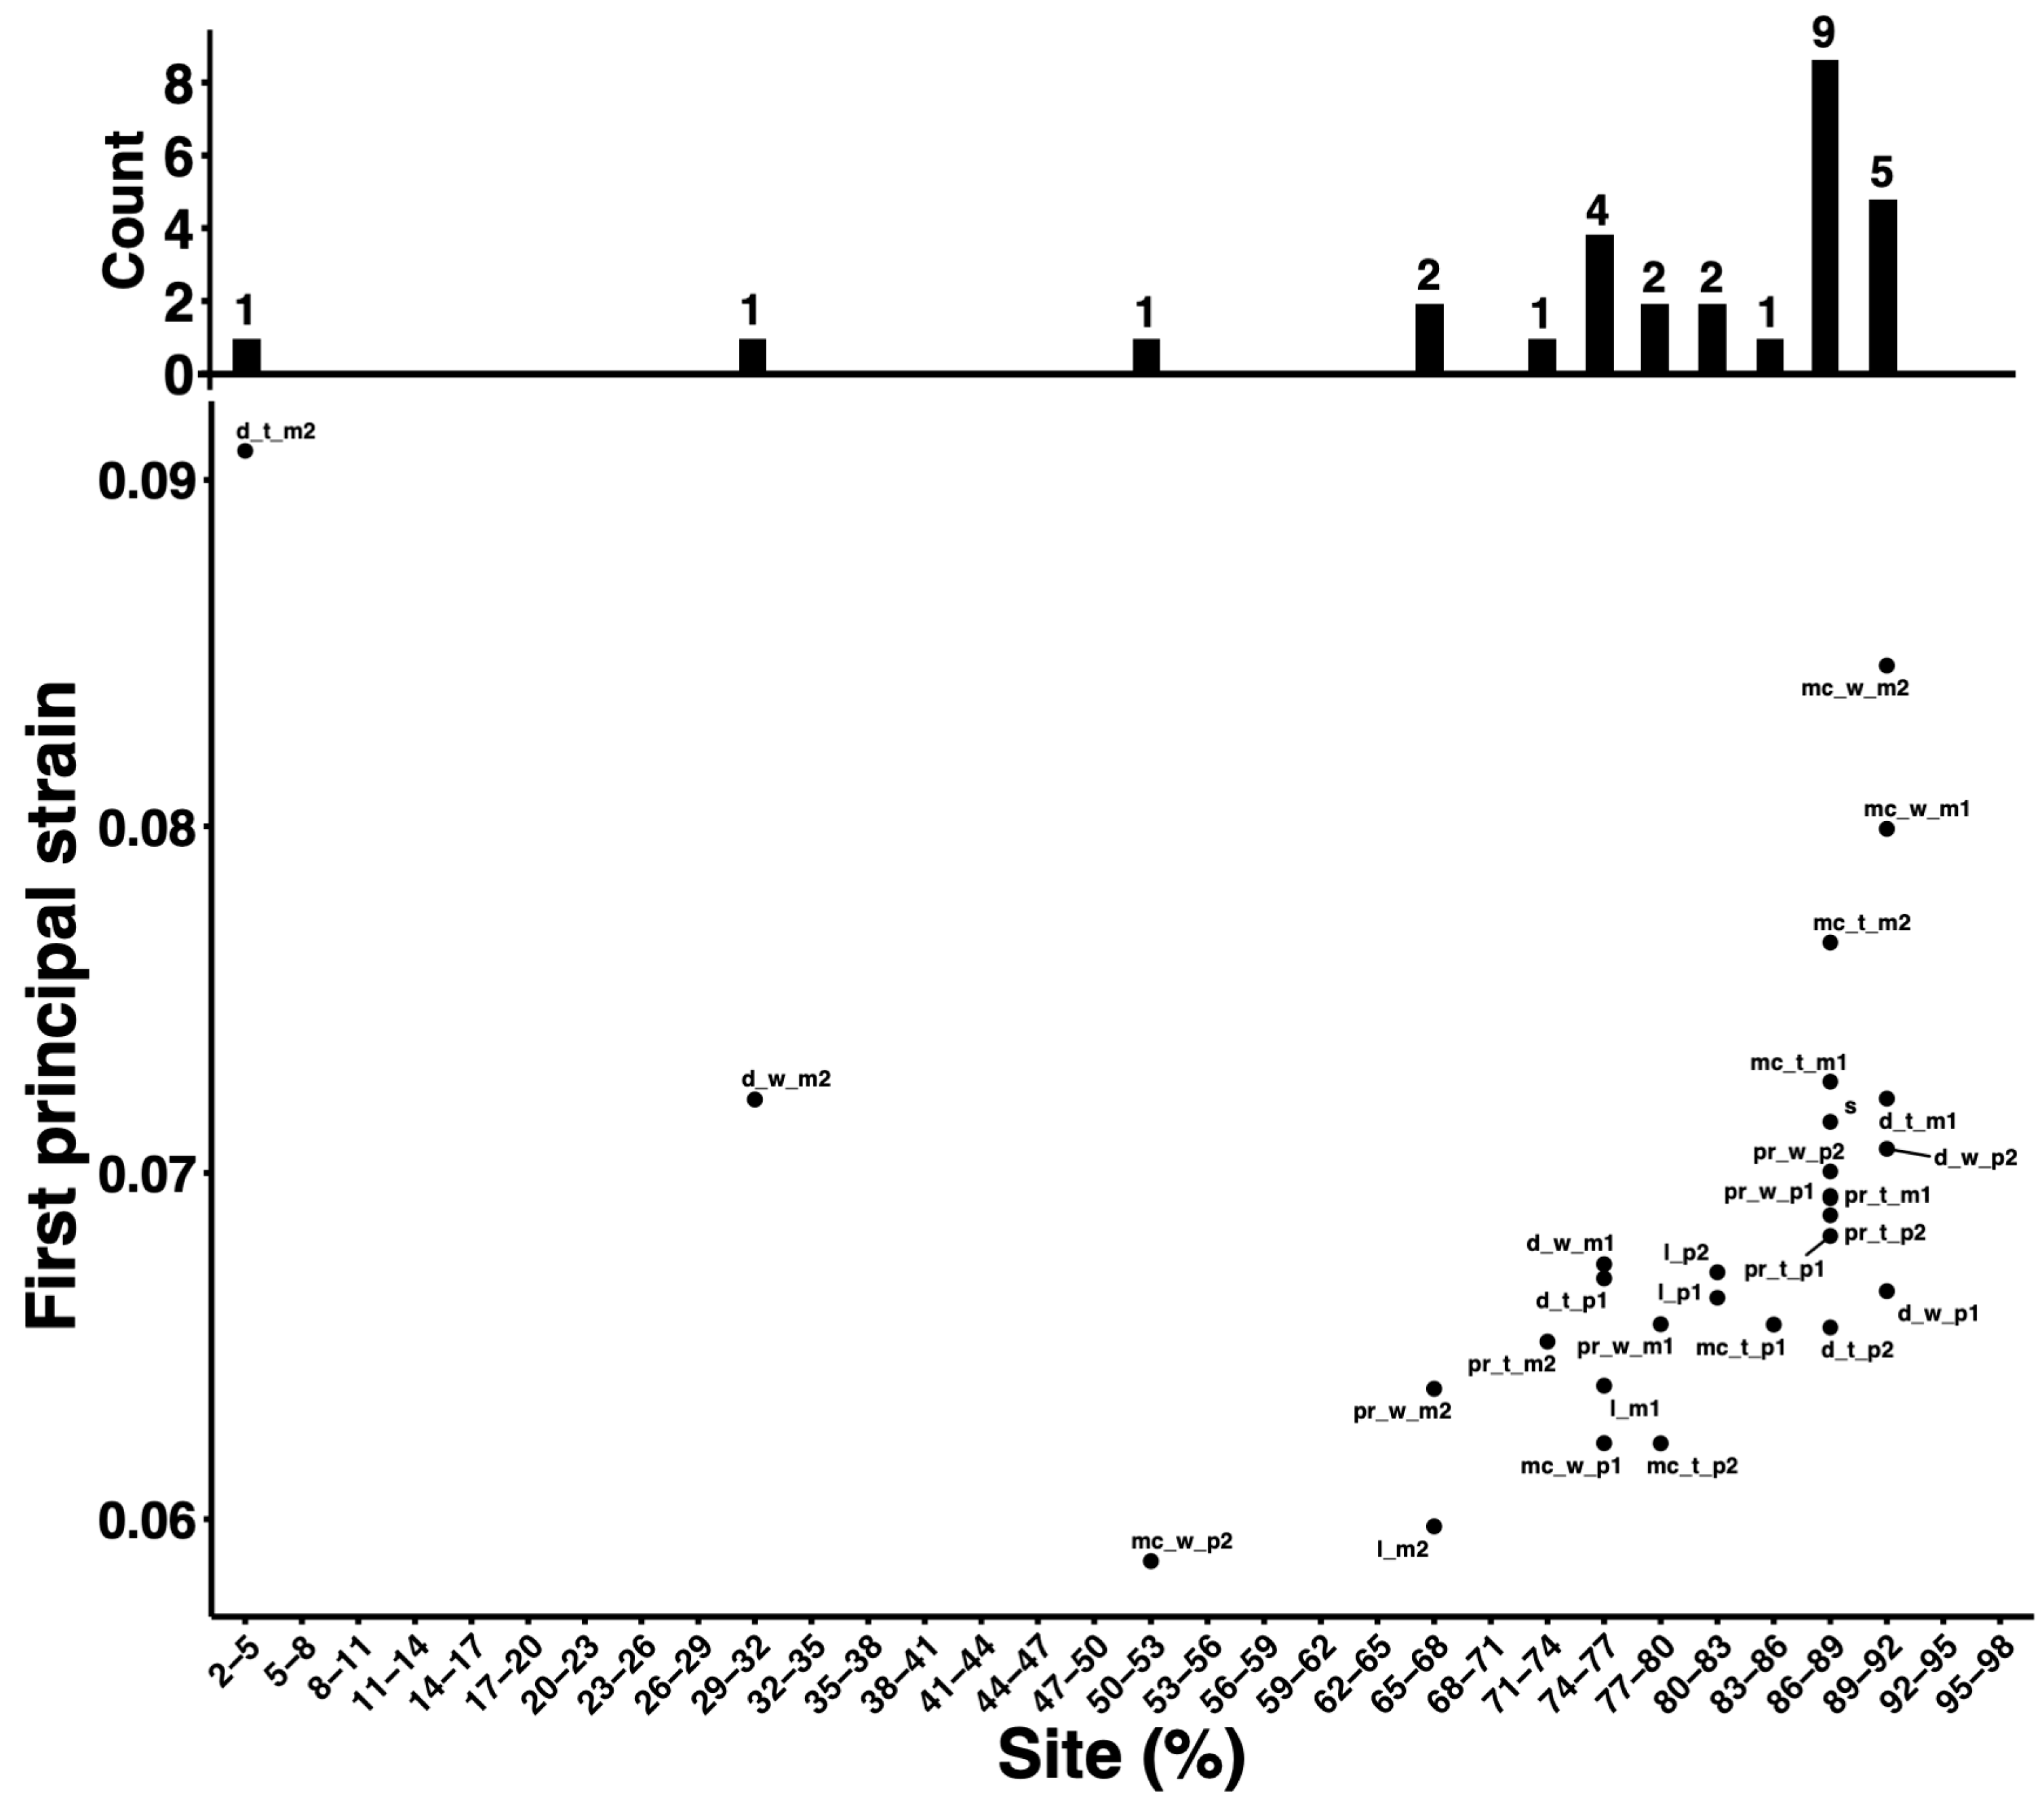
We assessed the validity of our model by comparing the elongation of the standard model with that in a previous experiment [22]. Figure 4 shows the force-elongation relationship when a 4000 N force was gradually applied to the standard model. In the previous study, free AT elongation was reported to be 2.2–2.4 mm when an approximately 2000 N force was applied [22]. In this study, the elongation when a 2000 N force applied was 2.0 mm, which was approximately the same as that reported in the previous study [22]. Therefore, we considered that our finite element model replicated the AT behavior during loading.

3. Results

Figure 5a,b demonstrates the FEA results of the standard model and the mean and SD of the FPS every 3% in the length of the standard model, respectively. The mean FPS in the standard model increased from the distal to the proximal region, with a peak at the 86–89% site (mean, 0.071; SD, 0.016), then decreased toward the proximal region.
Figure 6 shows the mean FPS every 3% in the length for all the models; the results of the standard model are also included for comparison. When the thickness and width of the distal part were reduced, the FPS values tended to increase compared with those of the standard model, and vice versa. This trend was particularly evident in the distal region. Moreover, the site with the highest FPS varied considerably depending on the model. Reducing the thickness and width of the mCSA part tended to increase the FPS values compared with those of the standard model, particularly around the mCSA position (91.7% in the AT length). However, when the thickness of the proximal part were varied, the FPS values did not change considerably compared with those of the standard model, regardless of whether the parameter values increased or decreased; in contrast, reducing the width of the proximal part tended to decrease the values. Similarly, when the length was varied, all the models showed a tendency toward decreasing FPS values compared with those of the standard model.
Figure 7 presents the highest absolute FPS values and SDs for each model and their relative values when normalized to those of the standard model. The highest FPS value (mean, 0.091; SD, 0.023) was observed in the d_t_m2 model, which was 27.1% higher than that of the standard model. The mc_w_m2 model had the second highest FPS value (mean, 0.085; SD, 0.027), which was 18.4% higher than that of the standard model. The models with FPS values higher than those of the standard model were the d_t_m2, mc_w_m2, mc_w_m1, mc_t_m2, mc_t_m1, d_t_m1, and d_w_m2 models, in descending order of FPS values; all of these FPS values were obtained by reducing the parameter values of the distal or mCSA parts.
Figure 8 shows the highest FPS values in each model, the sites where these values were observed, and the frequencies of the sites where the values were observed. The highest FPS values in most models were observed in the proximal region. Specifically, the 86–89% and 89–92% sites had the greatest (nine models) and second greatest (five models) number of models with the highest FPS values, respectively, which coincided with or was adjacent to the position where the mCSA appeared (91.7% in the AT length). In contrast, the highest FPS values among all the models were observed at the most distal site (2–5%) in the d_t_m2 model. The highest FPS in the d_w_m2 model was also observed at the relatively distal site.

4. Discussion

In this study, we analyzed an artificially generated AT model based on the mean and SD of AT geometrical parameters obtained from human bodies using FEA to investigate the effect of geometry (thickness, width, and length) on the magnitude and distribution of local strain. The following main findings were obtained: first, the FPS tended to increase when the parameter values of the distal and mCSA parts were reduced, and the d_t_m2, mc_w_m2, and mc_w_m1 models were the top three models with the highest FPS values. Second, many models had the highest FPS values in the proximal region, particularly near the site where the mCSA appeared; however, some models had the highest FPS values in the distal region.
In the standard model, which was an average model generated based on the mean values of parameters obtained from the human bodies, the FPS value increased from the distal to the proximal region, reached its maximum at the 86–89% site, then decreased toward the proximal region. The fact that the highest FPS value was observed adjacent to the mCSA site (91.7% in the AT length) in this model was corroborated by the findings of a previous study [23]. They investigated the stress distribution within the AT using FEA and reported that the peak stress location was adjacent to the mCSA position [23]. Strain and stress are concentrated in regions with relatively small diameters, such as the neck of a bottle; thus, it is predicted that regions with a small CSA are predisposed to concentrating stress and strain.
In contrast, regarding individual differences in the parameters used in this study, the SDs of the mean length and thickness of the distal part were larger than those of the other parameters, resulting in models differing largely in geometry from the standard model when these parameter values were ±2 SD. The lengths of the l_m2 and l_p2 models were 12.9 and 58.1 mm, respectively, which were approximately within the AT length range calculated in this study (12.0–54.0 mm). Furthermore, Szaro and Ghali Gataa [14] reported the AT length using a definition similar to the one we used, with a range of 8.5–72.9 mm (mean, 39.3 mm; SD, 14.1 mm); the lengths of the l_m2 and l_p2 models also fall within the abovementioned range. However, the distal part thicknesses in the d_t_m2 and d_t_p2 models were 2.6 and 17.2 mm, respectively, which do not exceed the maximum value (23.6 mm), although they are considerably smaller than the minimum value (6.4 mm). To the best of our knowledge, no study has investigated the thickness of the distal part using a definition similar to that we used; therefore, it is not possible to compare our findings with those of previous studies. Thus, the concentration of high strains in the d_t_m2 model might have been influenced by a geometry considerably different from that of the standard model.
Regarding the variations in geometric parameters for the models in this study, the highest strain was observed in the model with a 2 SD smaller thickness in the distal part (d_t_m2). As mentioned earlier, no previous study has investigated the thickness of the distal part of the AT using a definition similar to that used in this study; thus, it was difficult to compare the variation in the geometric parameters of d_t_m2 with those in other studies. On the other hand, the model with a reduced mCSA width showed the second and third highest strain values, and it was possible to compare these variations with those in the previous study. In a study by Obst et al. [24], the average width and SD at the location corresponding to that where the mCSA was observed in the present study were 13.3 mm and 2.3 mm, respectively (extracted using WebPlotDigitizer [25] from Figure 3b in the study by Obst et al. [24]; data were obtained from the 90% position of the normalized tendon length under resting conditions), resulting in a coefficient of variation of 17.3%. In contrast, the coefficient of variation for the width of the mCSA in the present study was 10.8%, which is smaller than that in the previous study. This suggests that the widths of mCSA in mc_w_m2 and mc_w_m1 in the present study were not excessively small. However, the samples sizes in the present study (n = 18) as well as the study by Obst et al. [24] (n = 8) were small. In order to provide more detailed information about the relationship between the geometry of the AT and local strain, future studies should evaluate the geometry of the AT using larger samples and various cohorts and subsequently develop and simulate models based on the findings.
Previous studies have investigated the differences in the geometric properties of the AT because of exercise habits and the AT adaptation to training; runners had significantly larger AT CSAs compared with non-runners [26,27]. Additionally, the AT CSA is known to increase with training [28,29]. Assuming no differences in the material properties, a larger CSA would decrease the stress and strain. Our study findings demonstrated that the small distal part thickness and the mCSA part thickness and width resulted in a high local strain, which was consistent with the abovementioned study findings.
Regarding the magnitude of strain, it has been reported that fiber breakage in tendons begins with the application of strains greater than 0.03 [30], with rupture at strains of 0.07–0.1 [30,31]. In the present study, the highest FPS values every 3% of the length were 0.059, 0.071, and 0.091 for the lowest (mc_w_p2), standard, and highest (d_t_m2) models, respectively. This indicates that the study conditions produced strains that could lead to fiber breakage or rupture. Regarding strain distribution, the FPS values increased from the distal to the proximal part, peaked at the 86–89% site, then decreased toward the proximal end in the standard model. This trend was also observed in many other models. Moreover, the highest FPS values were observed in the proximal region for most models; the 86–89% and 89–92% sites had the greatest (nine models) and second greatest (five models) number of models with the highest FPS values, respectively. This was consistent with the finding of a previous study, which reported that the location of the peak stress within the AT during loading was adjacent to the position of the mCSA part [23]. Nevertheless, the highest FPS value here was observed in the d_t_m2 model, located at the 2–5% site, which differed considerably from the region wherein the highest FPS value was observed in many other models. As aforementioned, the strains tend to be concentrated in regions with relatively small diameters. The distal part of the d_t_m2 model had the smallest CSA of all models analyzed. Figure 6 shows the varying parameters for the distal and mCSA parts; the FPS values tended to be higher in the parts where the parameter values of the distal and mCSA parts were reduced. Based on our study findings, in conjunction with previous study findings, local strain is higher in the proximal region, particularly around the mCSA part; however, the distribution of local strain may vary depending on tendon geometry.
With regard to the clinical implications of our findings, we found that the AT geometry influences the magnitude and distribution of local AT strains during loading. The AT geometry can be measured via ultrasonography [32] or MRI [32,33] in vivo. Therefore, by using these techniques to measure the geometry of the AT, it may be possible to predict the magnitude and distribution of the local-strain occurring within the AT.
This study had several limitations. First, the model we used assumes the absence of regional differences in material properties. Recent studies have indicated the possibility of evaluating the distribution of AT mechanical properties via ultrasound elastography [34,35,36]. Thus, the distribution of the mechanical properties can be incorporated into the simulation model to obtain more detailed data. Second, the model we used did not consider the twisted structure of the AT. Recent studies have suggested that the twisted structure of the AT may be related to the occurrence of rupture or tendinopathy [37]. Furthermore, FEA studies have reported that the twisted structure and the degree of twisting are related to local stress [38,39,40] or strain [13]. Future studies should consider both the AT geometry and twisted structure.

5. Conclusions

In conclusion, we used FEA to investigate the influence of AT geometry on the magnitude and distribution of local AT strain during loading. A small AT thickness in the distal and mCSA parts and a small AT width in the mCSA part resulted in high local strain. Additionally, the proximal region, particularly around the mCSA part, exhibited the highest strain in many models. However, some models exhibited the highest strain in the distal region. These findings suggest that the AT geometry influences the magnitude and distribution of local AT strains during loading.

Author Contributions

Conceptualization, S.E. and T.O.; methodology, S.E. and T.O.; software, S.E. and T.O.; validation, S.E. and T.O.; formal analysis, S.E.; investigation, S.E.; resources, S.E. and T.O.; data curation, S.E. and T.O.; writing—original draft preparation, S.E.; writing—review and editing, T.O.; visualization, S.E.; supervision, T.O.; project administration, S.E.; funding acquisition, S.E. All authors have read and agreed to the published version of the manuscript.

Funding

This research was funded by JSPS KAKENHI, grant number JP 22K17719.

Institutional Review Board Statement

The study was conducted in accordance with the Declaration of Helsinki, and was approved by the Institutional Review Board of Okayama University (protocol code 22-002, approved on 11 November 2022).

Informed Consent Statement

Not applicable.

Data Availability Statement

The data for this study are available from the corresponding author, upon reasonable request.

Acknowledgments

The authors would like to thank Akemi Nanda, Hisao Suzuki, Naoto Yamamura, Rui Yokoyama, and Takayuki Hisano for their support.

Conflicts of Interest

The authors declare no conflict of interest.

References

  1. Alexander, R.M.; Bennet-Clark, H.C. Storage of elastic strain energy in muscle and other tissues. Nature 1977, 265, 114117. [Google Scholar] [CrossRef]
  2. Kawakami, Y.; Muraoka, T.; Ito, S.; Kanehisa, H.; Fukunaga, T. In vivo muscle fibre behaviour during counter-movement exercise in humans reveals a significant role for tendon elasticity. J. Physiol. 2002, 540, 635–646. [Google Scholar] [CrossRef]
  3. Maffulli, N.; Waterston, S.W.; Squair, J.; Reaper, J.; Douglas, A.S. Changing incidence of Achilles tendon rupture in Scotland: A 15-year study. Clin. J. Sport. Med. 1999, 9, 157–160. [Google Scholar] [CrossRef]
  4. Houshian, S.; Tscherning, T.; Riegels-Nielsen, P. The epidemiology of Achilles tendon rupture in a Danish county. Injury 1998, 29, 651–654. [Google Scholar] [CrossRef]
  5. Kujala, U.M.; Sarna, S.; Kaprio, J. Cumulative incidence of achilles tendon rupture and tendinopathy in male former elite athletes. Clin. J. Sport. Med. 2005, 15, 133–135. [Google Scholar] [CrossRef]
  6. Metz, R.; Verleisdonk, E.J.; van der Heijden, G.J.; Clevers, G.J.; Hammacher, E.R.; Verhofstad, M.H.; van der Werken, C. Acute Achilles tendon rupture: Minimally invasive surgery versus nonoperative treatment with immediate full weightbearing—A randomized controlled trial. Am. J. Sports Med. 2008, 36, 1688–1694. [Google Scholar] [CrossRef]
  7. Zellers, J.A.; Carmont, M.R.; Grävare Silbernagel, K. Return to play post-Achilles tendon rupture: A systematic review and meta-analysis of rate and measures of return to play. Br. J. Sports Med. 2016, 50, 1325–1332. [Google Scholar] [CrossRef]
  8. Habets, B.; van den Broek, A.G.; Huisstede, B.M.A.; Backx, F.J.G.; van Cingel, R.E.H. Return to Sport in Athletes with Midportion Achilles Tendinopathy: A Qualitative Systematic Review Regarding Definitions and Criteria. Sports Med. 2018, 48, 705–723. [Google Scholar] [CrossRef]
  9. Maffulli, N.; Sharma, P.; Luscombe, K.L. Achilles tendinopathy: Aetiology and management. J. R. Soc. Med. 2004, 97, 472–476. [Google Scholar] [CrossRef]
  10. Theobald, P.; Benjamin, M.; Nokes, L.; Pugh, N. Review of the vascularisation of the human Achilles tendon. Injury 2005, 36, 1267–1272. [Google Scholar] [CrossRef]
  11. Oda, T.; Kawakami, Y.; Kataoka, H.; Yokota, H.; Himeno, R. Estimation of local strain and stress in human Achilles tendon tissue during jumping. Jpn. J. Biomech. Sport Exerc. 2012, 16, 54–63. (In Japanese) [Google Scholar]
  12. Hisano, T.; Kusumoto, K.; Kurihara, T.; Ishikawa, M.; Kawakami, Y.; Oda, T. Estimation of local strain of Achilles tendon during exercise with individual structure geometry and tendon force date by finite element analysis. Jpn. J. Biomech. Sport Exerc. 2015, 19, 2–10. (In Japanese) [Google Scholar]
  13. Funaro, A.; Shim, V.; Crouzier, M.; Mylle, I.; Vanwanseele, B. Subject-Specific 3D Models to Investigate the Influence of Rehabilitation Exercises and the Twisted Structure on Achilles Tendon Strains. Front. Bioeng. Biotechnol. 2022, 10, 914137. [Google Scholar] [CrossRef]
  14. Szaro, P.; Ghali Gataa, K. The correlations between dimensions of the normal tendon and tendinopathy changed Achilles tendon in routine magnetic resonance imaging. Sci. Rep. 2021, 11, 6131. [Google Scholar] [CrossRef]
  15. Alves, J.L.; Yamamura, N.; Oda, T.; Teodosiu, C. Numerical simulation of musculoskeletal systems by V-Biomech. In Proceedings of the CMBBE2010, Valencia, Spain, 24–27 February 2010. [Google Scholar]
  16. Jones, A.C.; Wilcox, R.K. Finite element analysis of the spine: Towards a framework of verification, validation and sensitivity analysis. Med. Eng. Phys. 2008, 30, 1287–1304. [Google Scholar] [CrossRef]
  17. Yang, Z.; Xu, G.; Yang, J.; Lin, X. Finite element study of the biomechanical effects on the rotator cuff under load. Front. Bioeng. Biotechnol. 2023, 11, 1193376. [Google Scholar] [CrossRef]
  18. Yamamura, N.; Alves, J.L.; Oda, T.; Kinugasa, R.; Takagi, S. Effect of tendon stiffness on the generated force at the Achilles tendon-3D finite element simulation of a human triceps surae muscle during isometric contraction. J. Biomech. Sci. Eng. 2014, 9, 13–00294. [Google Scholar] [CrossRef]
  19. Louis-Ugbo, J.; Leeson, B.; Hutton, W.C. Tensile properties of fresh human calcaneal (Achilles) tendons. Clin. Anat. 2004, 17, 30–35. [Google Scholar] [CrossRef]
  20. Fukashiro, S.; Komi, P.V.; Järvinen, M.; Miyashita, M. In vivo Achilles tendon loading during jumping in humans. Eur. J. Appl. Physiol. Occup. Physiol. 1995, 71, 453–458. [Google Scholar] [CrossRef]
  21. Kinugasa, R.; Yamamura, N.; Sinha, S.; Takagi, S. Influence of intramuscular fiber orientation on the Achilles tendon curvature using three-dimensional finite element modeling of contracting skeletal muscle. J. Biomech. 2016, 49, 3592–3595. [Google Scholar] [CrossRef]
  22. Kongsgaard, M.; Nielsen, C.H.; Hegnsvad, S.; Aagaard, P.; Magnusson, S.P. Mechanical properties of the human Achilles tendon, in vivo. Clin. Biomech. 2011, 26, 772–777. [Google Scholar] [CrossRef]
  23. Hansen, W.; Shim, V.B.; Obst, S.; Lloyd, D.G.; Newsham-West, R.; Barrett, R.S. Achilles tendon stress is more sensitive to subject-specific geometry than subject-specific material properties: A finite element analysis. J. Biomech. 2017, 56, 26–31. [Google Scholar] [CrossRef]
  24. Obst, S.J.; Renault, J.B.; Newsham-West, R.; Barrett, R.S. Three-dimensional deformation and transverse rotation of the human free Achilles tendon in vivo during isometric plantarflexion contraction. J. Appl. Physiol. 2014, 116, 376–384. [Google Scholar] [CrossRef]
  25. Rohatgi, A. WebPlotDigitizer. Available online: https://automeris.io/WebPlotDigitizer (accessed on 24 October 2023).
  26. Rosager, S.; Aagaard, P.; Dyhre-Poulsen, P.; Neergaard, K.; Kjaer, M.; Magnusson, S.P. Load-displacement properties of the human triceps surae aponeurosis and tendon in runners and non-runners. Scand. J. Med. Sci. Sports 2002, 12, 90–98. [Google Scholar] [CrossRef]
  27. Devaprakash, D.; Obst, S.J.; Lloyd, D.G.; Barrett, R.S.; Kennedy, B.; Ball, I.; Adams, K.L.; Collings, T.J.; Davico, G.; Hunter, A.; et al. The Free Achilles Tendon Is Shorter, Stiffer, Has Larger Cross-Sectional Area and Longer T2* Relaxation Time in Trained Middle-Distance Runners Compared to Healthy Controls. Front. Physiol. 2020, 11, 965. [Google Scholar] [CrossRef]
  28. Milgrom, Y.; Milgrom, C.; Altaras, T.; Globus, O.; Zeltzer, E.; Finestone, A.S. Achilles tendons hypertrophy in response to high loading training. Foot Ankle Int. 2014, 35, 1303–1308. [Google Scholar] [CrossRef]
  29. Geremia, J.M.; Baroni, B.M.; Bobbert, M.F.; Bini, R.R.; Lanferdini, F.J.; Vaz, M.A. Effects of high loading by eccentric triceps surae training on Achilles tendon properties in humans. Eur. J. Appl. Physiol. 2018, 118, 1725–1736. [Google Scholar] [CrossRef]
  30. Butler, D.L.; Grood, E.S.; Noyes, F.R.; Zernicke, R.F. Biomechanics of ligaments and tendons. Exerc. Sport. Sci. Rev. 1978, 6, 125–181. [Google Scholar]
  31. Wren, T.A.; Yerby, S.A.; Beaupré, G.S.; Carter, D.R. Mechanical properties of the human achilles tendon. Clin. Biomech. 2001, 16, 245–251. [Google Scholar] [CrossRef]
  32. Kruse, A.; Stafilidis, S.; Tilp, M. Ultrasound and magnetic resonance imaging are not interchangeable to assess the Achilles tendon cross-sectional-area. Eur. J. Appl. Physiol. 2017, 117, 73–82. [Google Scholar] [CrossRef]
  33. Magnusson, S.P.; Beyer, N.; Abrahamsen, H.; Aagaard, P.; Neergaard, K.; Kjaer, M. Increased cross-sectional area and reduced tensile stress of the Achilles tendon in elderly compared with young women. J. Gerontol. A Biol. Sci. Med. Sci. 2003, 58, B123–B127. [Google Scholar] [CrossRef]
  34. Slane, L.C.; Martin, J.; DeWall, R.; Thelen, D.; Lee, K. Quantitative ultrasound mapping of regional variations in shear wave speeds of the aging Achilles tendon. Eur. Radiol. 2017, 27, 474–482. [Google Scholar] [CrossRef]
  35. Coombes, B.K.; Tucker, K.; Vicenzino, B.; Vuvan, V.; Mellor, R.; Heales, L.; Nordez, A.; Hug, F. Achilles and patellar tendinopathy display opposite changes in elastic properties: A shear wave elastography study. Scand. J. Med. Sci. Sports 2018, 28, 1201–1208. [Google Scholar] [CrossRef]
  36. Crawford, S.K.; Thelen, D.; Yakey, J.M.; Heiderscheit, B.C.; Wilson, J.J.; Lee, K.S. Regional shear wave elastography of Achilles tendinopathy in symptomatic versus contralateral Achilles tendons. Eur. Radiol. 2023, 33, 720–729. [Google Scholar] [CrossRef]
  37. Edama, M.; Kubo, M.; Onishi, H.; Takabayashi, T.; Inai, T.; Yokoyama, E.; Hiroshi, W.; Satoshi, N.; Kageyama, I. The twisted structure of the human Achilles tendon. Scand. J. Med. Sci. Sports 2015, 25, e497–e503. [Google Scholar] [CrossRef]
  38. Handsfield, G.G.; Greiner, J.; Madl, J.; Rog-Zielinska, E.A.; Hollville, E.; Vanwanseele, B.; Shim, V. Achilles Subtendon Structure and Behavior as Evidenced From Tendon Imaging and Computational Modeling. Front. Sports Act. Living 2020, 2, 70. [Google Scholar] [CrossRef]
  39. Knaus, K.R.; Blemker, S.S. 3D Models Reveal the Influence of Achilles Subtendon Twist on Strain and Energy Storage. Front. Bioeng. Biotechnol. 2021, 5, 539135. [Google Scholar] [CrossRef]
  40. Shim, V.B.; Handsfield, G.G.; Fernandez, J.W.; Lloyd, D.G.; Besier, T.F. Combining in silico and in vitro experiments to characterize the role of fascicle twist in the Achilles tendon. Sci. Rep. 2018, 8, 13856. [Google Scholar] [CrossRef]
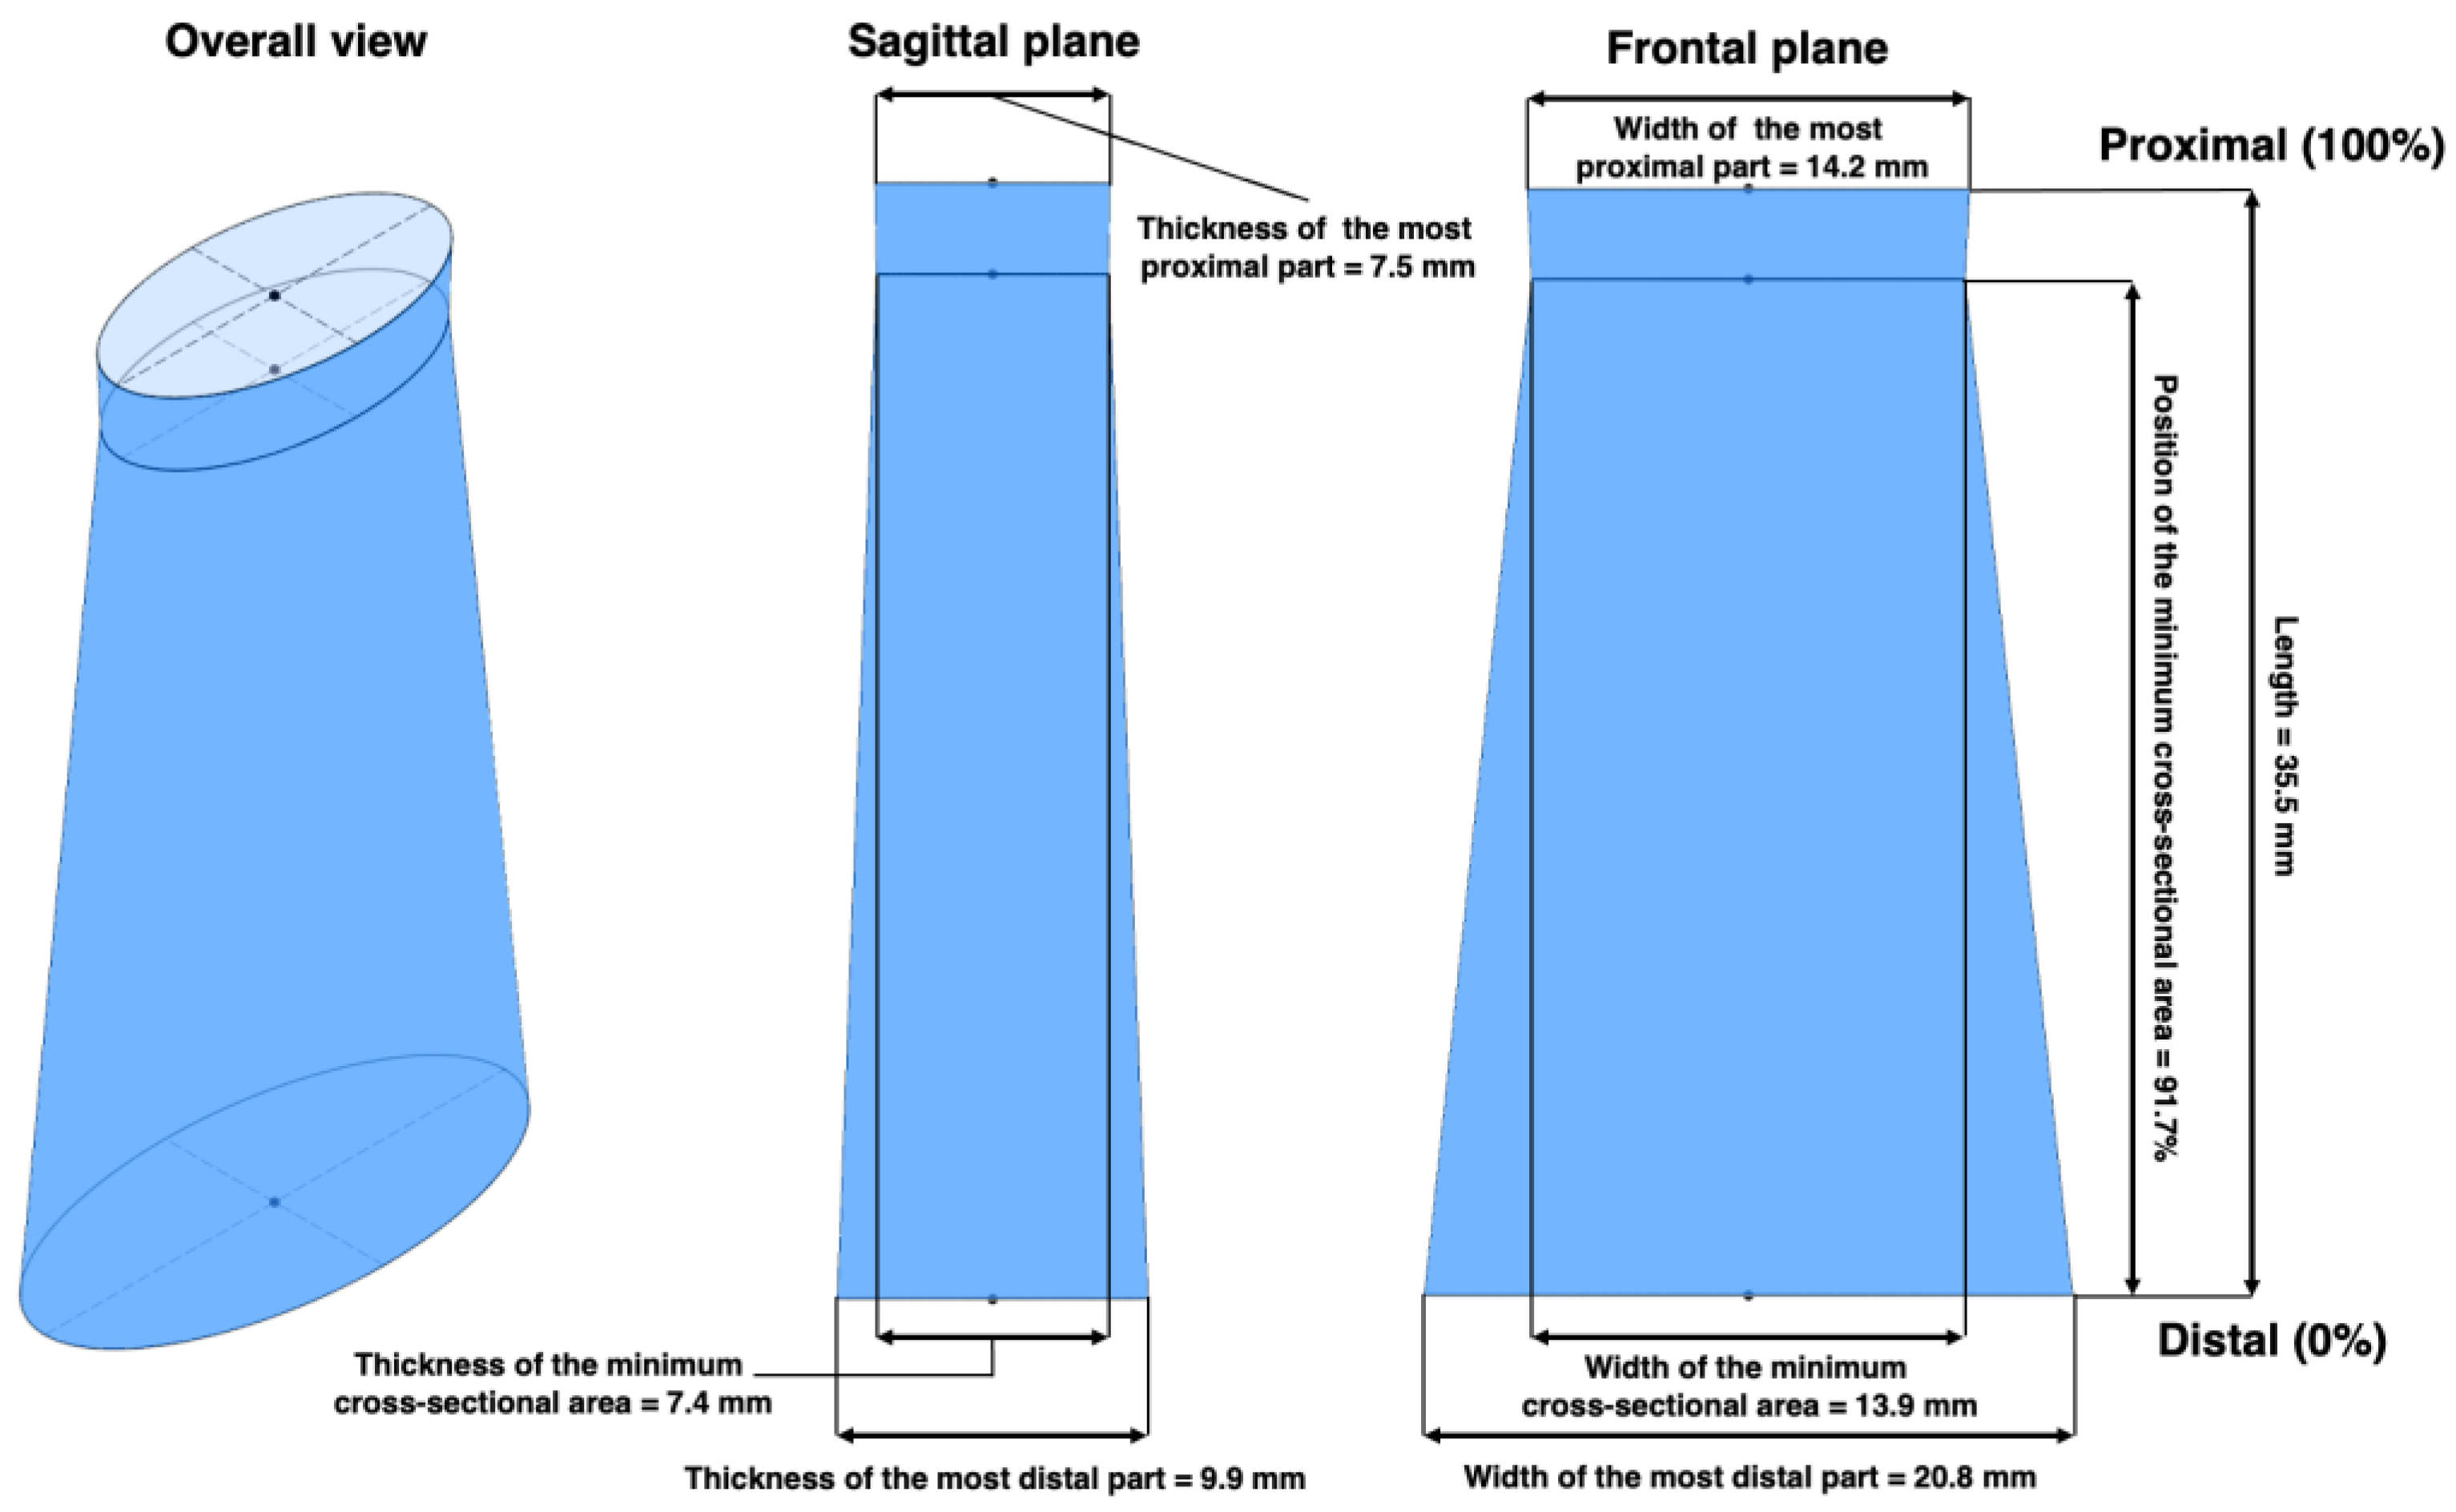
Figure 1. Artificially generated Achilles tendon model based on parameters obtained from the three-dimensional model used in a previous study [12].
Biomechanics 03 00047 g001
Figure 2. Geometry for the standard model and models with +2 standard deviation (SD) or −2 SD for each parameter. In each model, the sagittal plane is shown on the left and the frontal plane on the right. The “d”, “mc”, “pr”, “l”, “w”, “t”, “p”, and “m” in the model name stand for distal, minimum cross-sectional area, proximal, length, width, thickness, plus, and minus, respectively; moreover, the number after “p” or “m” indicates the range of the SD change.
Biomechanics 03 00047 g002
Figure 3. Boundary conditions. (a) The proximal surface allowed for only longitudinal (Z) axis displacement. (b) A 200 N lengthening force was applied to 20 proximal surface nodes. (c) The distal surface was fully fixed.
Biomechanics 03 00047 g003
Figure 4. Force-elongation relationship when a 4000 N force was gradually applied to the standard model.
Biomechanics 03 00047 g004
Figure 5. (a) Analysis results for the standard model and (b) mean and standard deviation of first principal strain for the standard model every 3% of the length.
Biomechanics 03 00047 g005
Figure 6. Distribution of the first principal strain when values for the following seven parameters were changed every 1 standard deviation (SD) in the range of ±2 SD: distal thickness (a) and width (b), minimum cross-sectional area (mCSA) thickness (c) and width (d), proximal thickness (e) and width (f), and length (g).
Biomechanics 03 00047 g006
Figure 7. Absolute value and standard deviation of the highest first principal strain within each model (left) and relative to the standard model (right). The “s”, “d”, “mc”, “pr”, “l”, “w”, “t”, “p”, and “m” in the model name stand for standard, distal, minimum cross-sectional area, proximal, length, width, thickness, plus, and minus, respectively; furthermore, the number after “p” or “m” indicates the range of the standard deviation change. The thin horizontal lines in the figure indicate absolute (0.071) and relative (100%) values in the standard model.
Biomechanics 03 00047 g007
Figure 8. Value and site of the highest first principal strain within each model. The histogram at the top shows, for each site, the number of models for which the highest first principal strain was observed. The “s”, “d”, “mc”, “pr”, “l”, “w”, “t”, “p”, and “m” in the model name stand for standard, distal, minimum cross-sectional area, proximal, length, width, thickness, plus, and minus, respectively; furthermore, the number after “p” or “m” indicates the range of the standard deviation change.
Biomechanics 03 00047 g008
Table 1. Achilles tendon parameters.
ParameterMeanStandard DeviationMinimumMaximumUnit
ProximalWidth14.21.412.216.9mm
Thickness7.50.86.29.1mm
Minimum cross-
sectional area
Width13.91.511.516.9mm
Thickness7.40.76.28.9mm
DistalWidth20.84.98.030.6mm
Thickness9.93.76.423.6mm
Length35.511.312.054.0mm
Position of minimum
cross-sectional area
91.716.744.6100.0%
Table 2. Achilles tendon properties determined by the Mooney–Rivlin model (MPa).
a10 a01a20a11a02
1.24E13.62E05.83E21.80E33.11E3
Disclaimer/Publisher’s Note: The statements, opinions and data contained in all publications are solely those of the individual author(s) and contributor(s) and not of MDPI and/or the editor(s). MDPI and/or the editor(s) disclaim responsibility for any injury to people or property resulting from any ideas, methods, instructions or products referred to in the content.

