
Segmental and Intersegmental Coordination Characteristics of a Cognitive Movement Control Test: Quantifying Loss of Movement Choices

Abstract
:1. Introduction
2. Materials and Methods
2.1. Participants
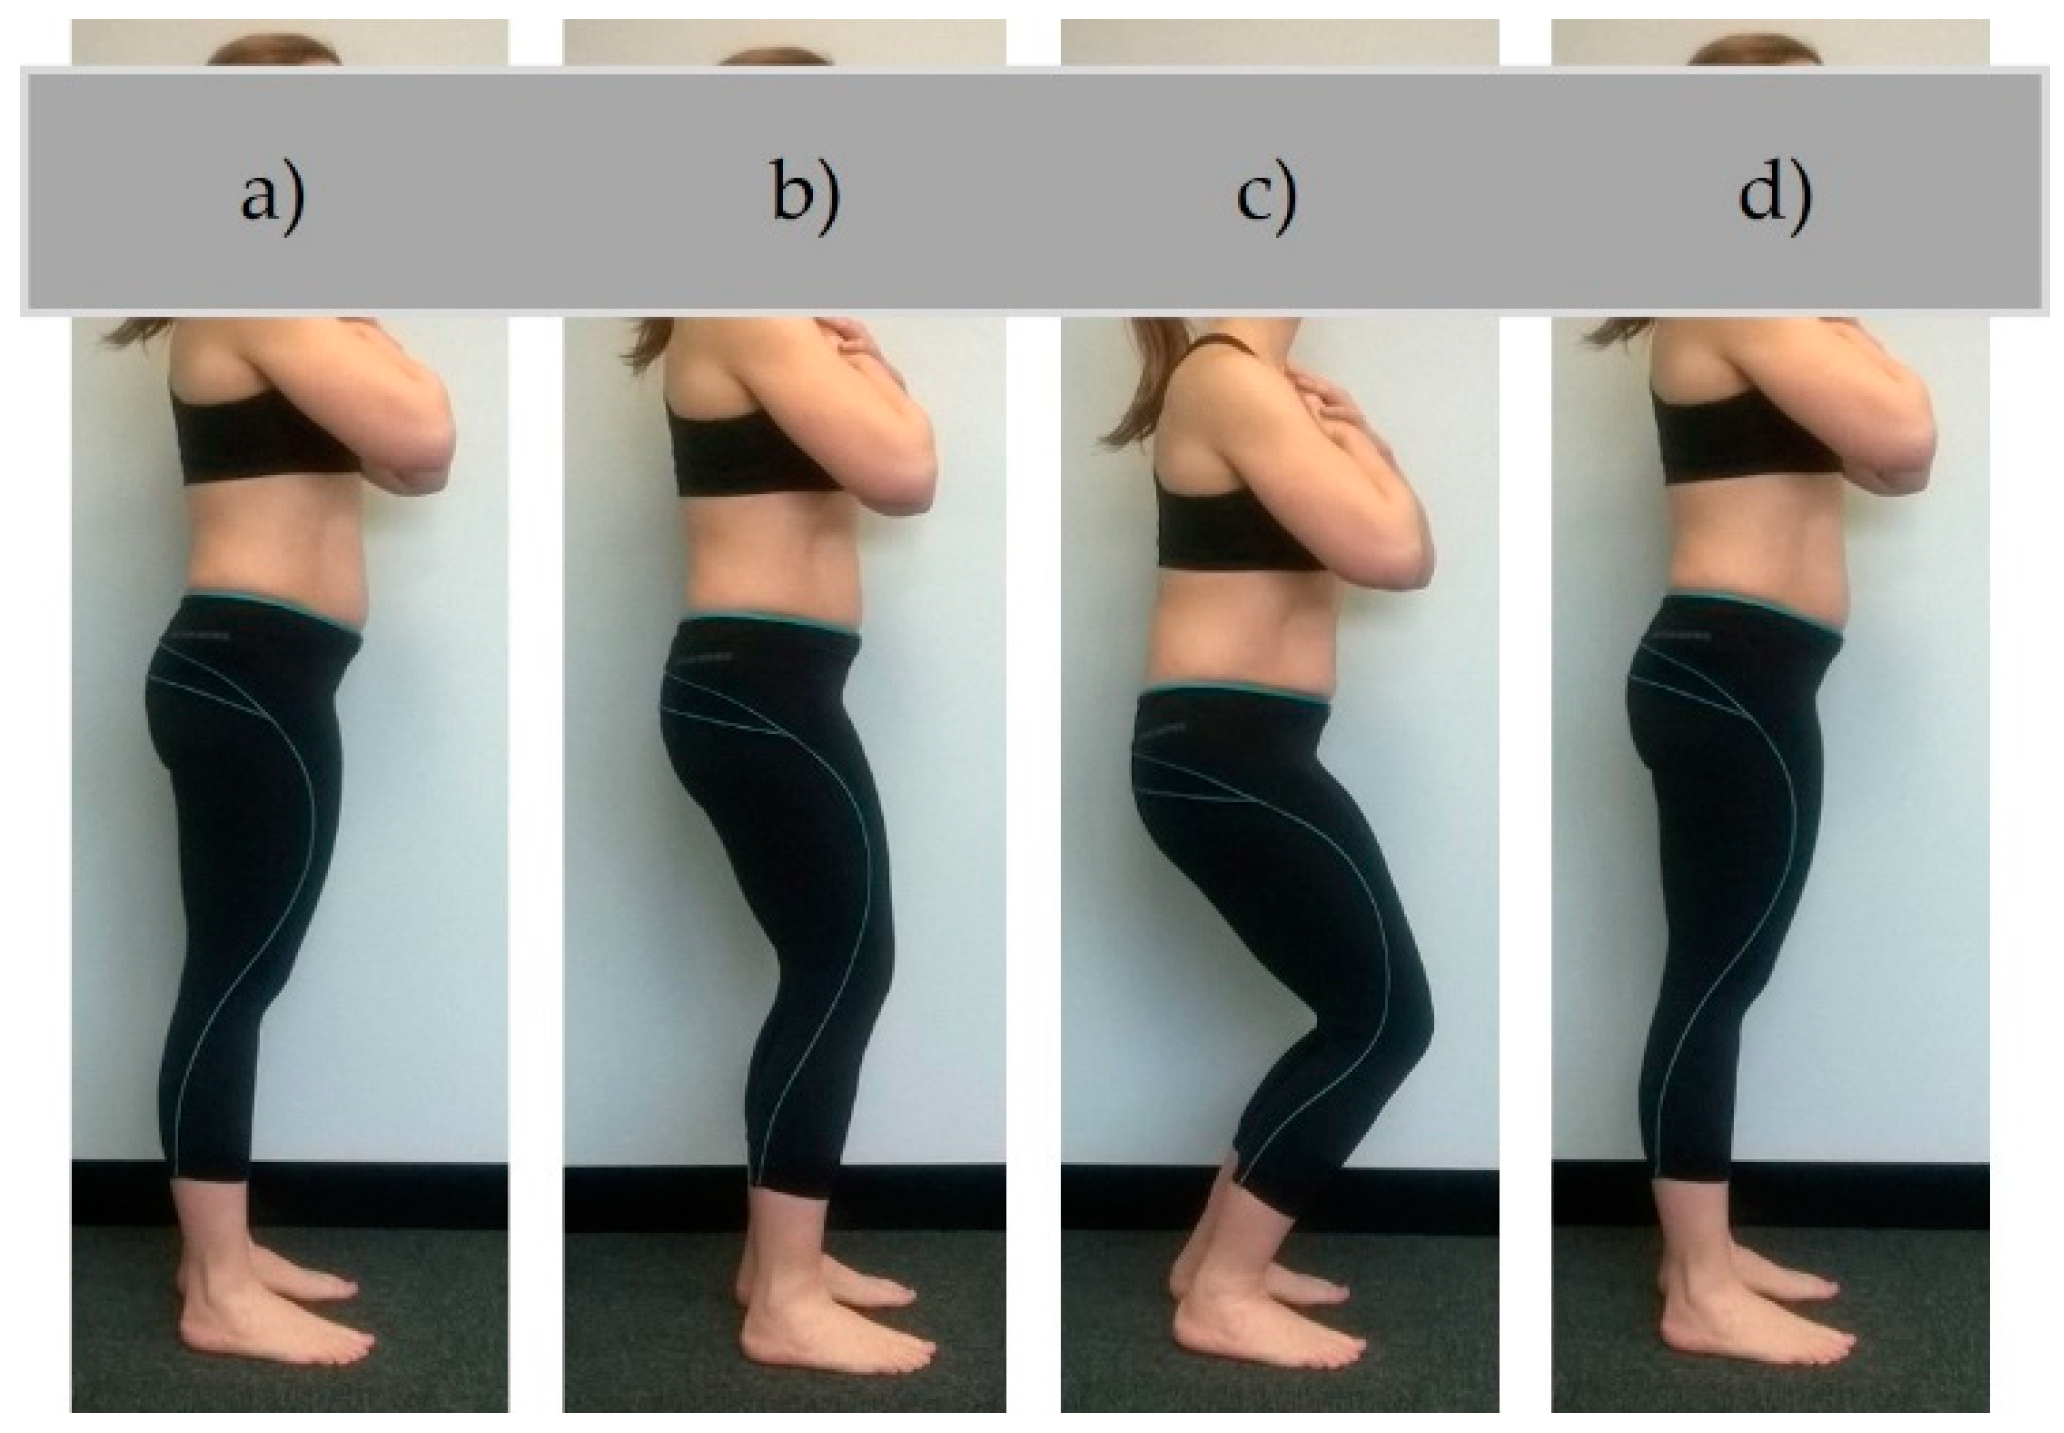
2.2. Testing Procedure
2.3. Data Collection
2.4. Data Processing
2.5. Data Analysis
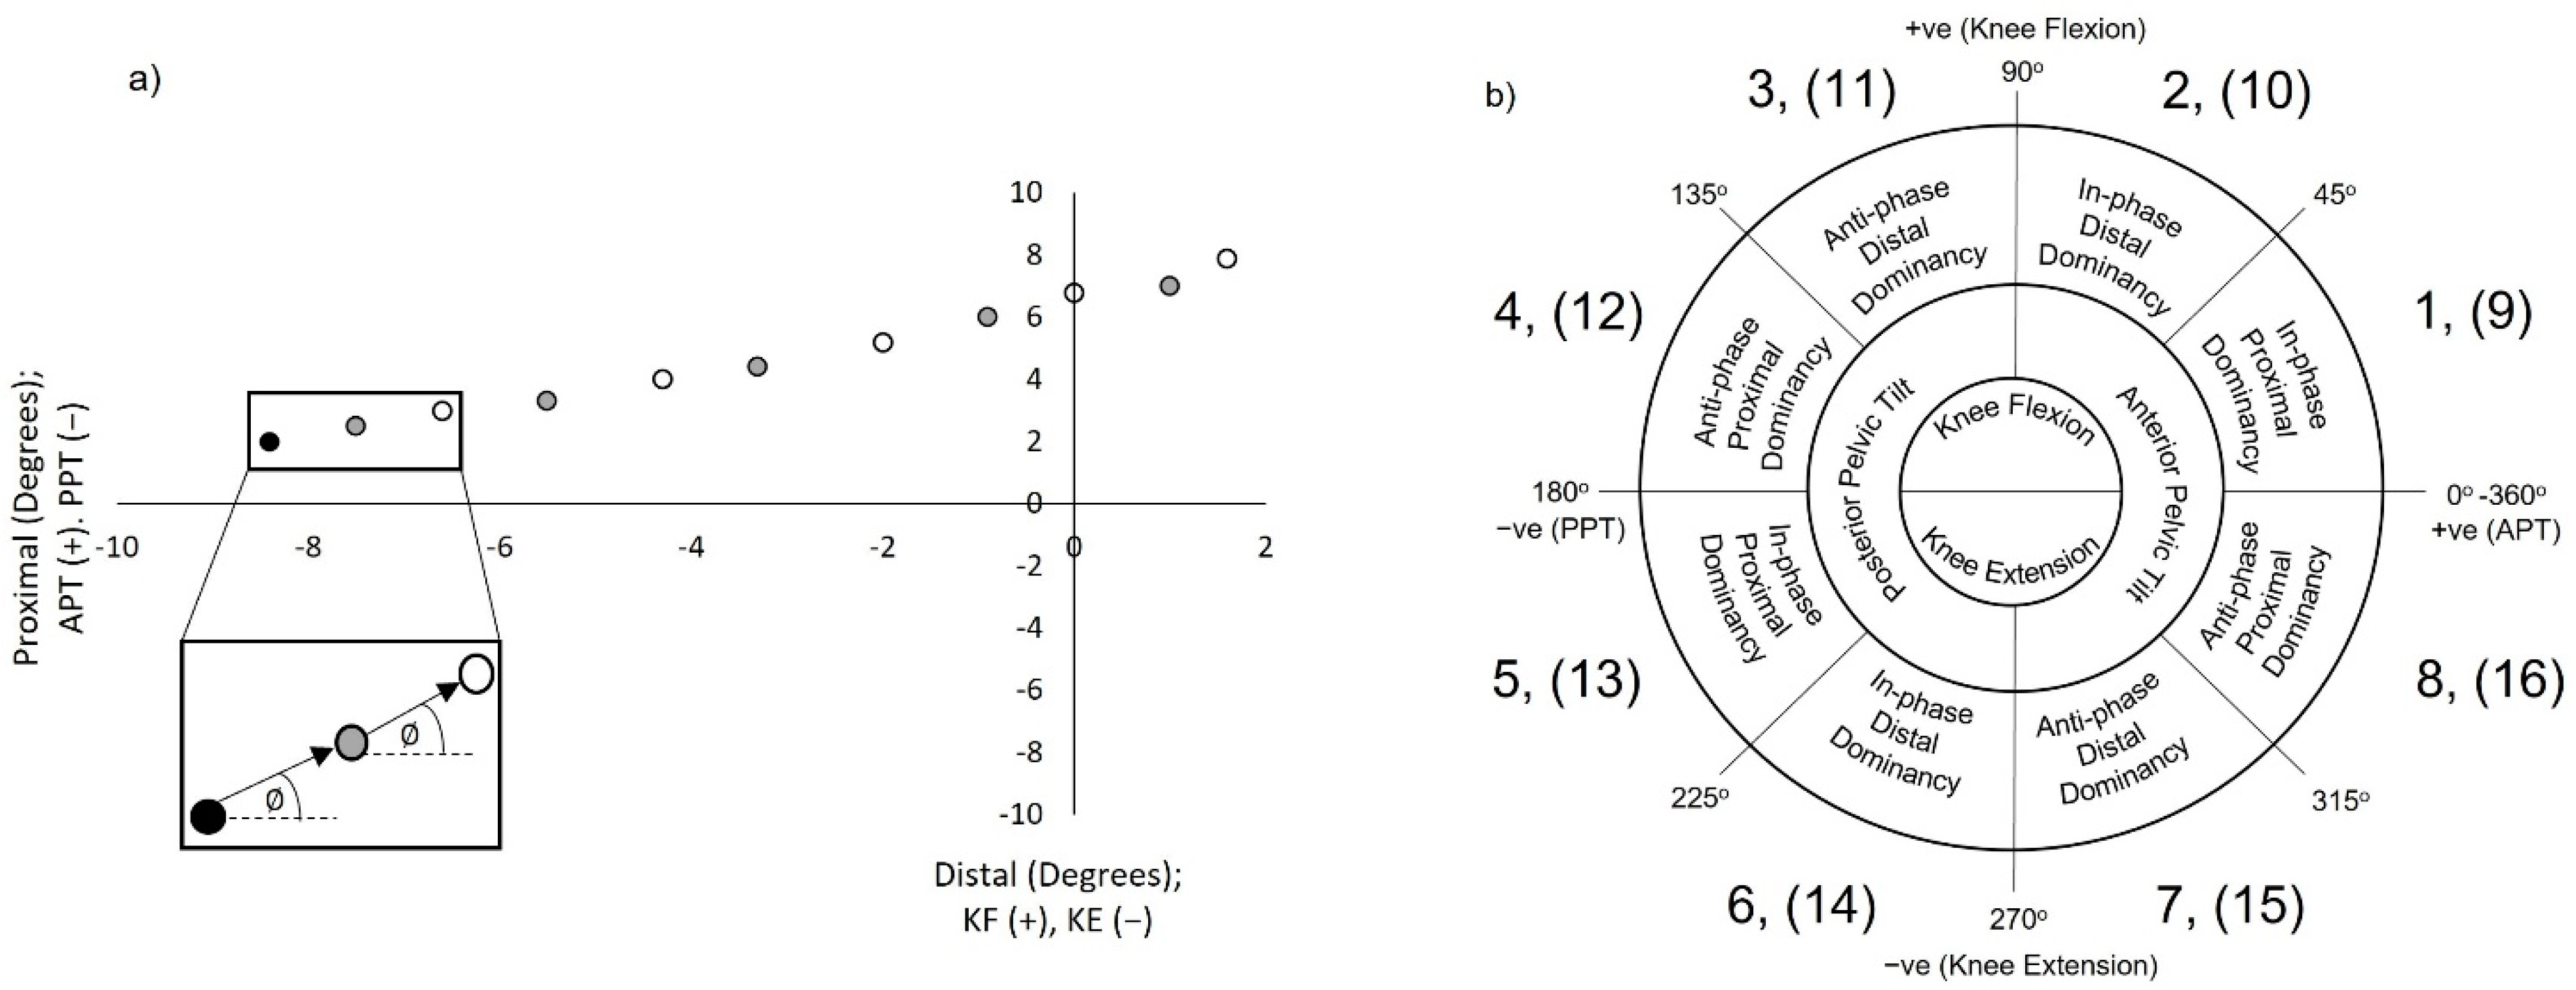
2.5.1. Vector Coding Techniques
2.5.2. Establishing Mean Coupling Angles and Coordination Strategy Classification
2.5.3. Establishing Coordination Variability (CoV)
2.5.4. Target Alignment Vector Coding (TAVC)
2.6. Statistical Analysis
3. Results
3.1. Descriptive Statistics
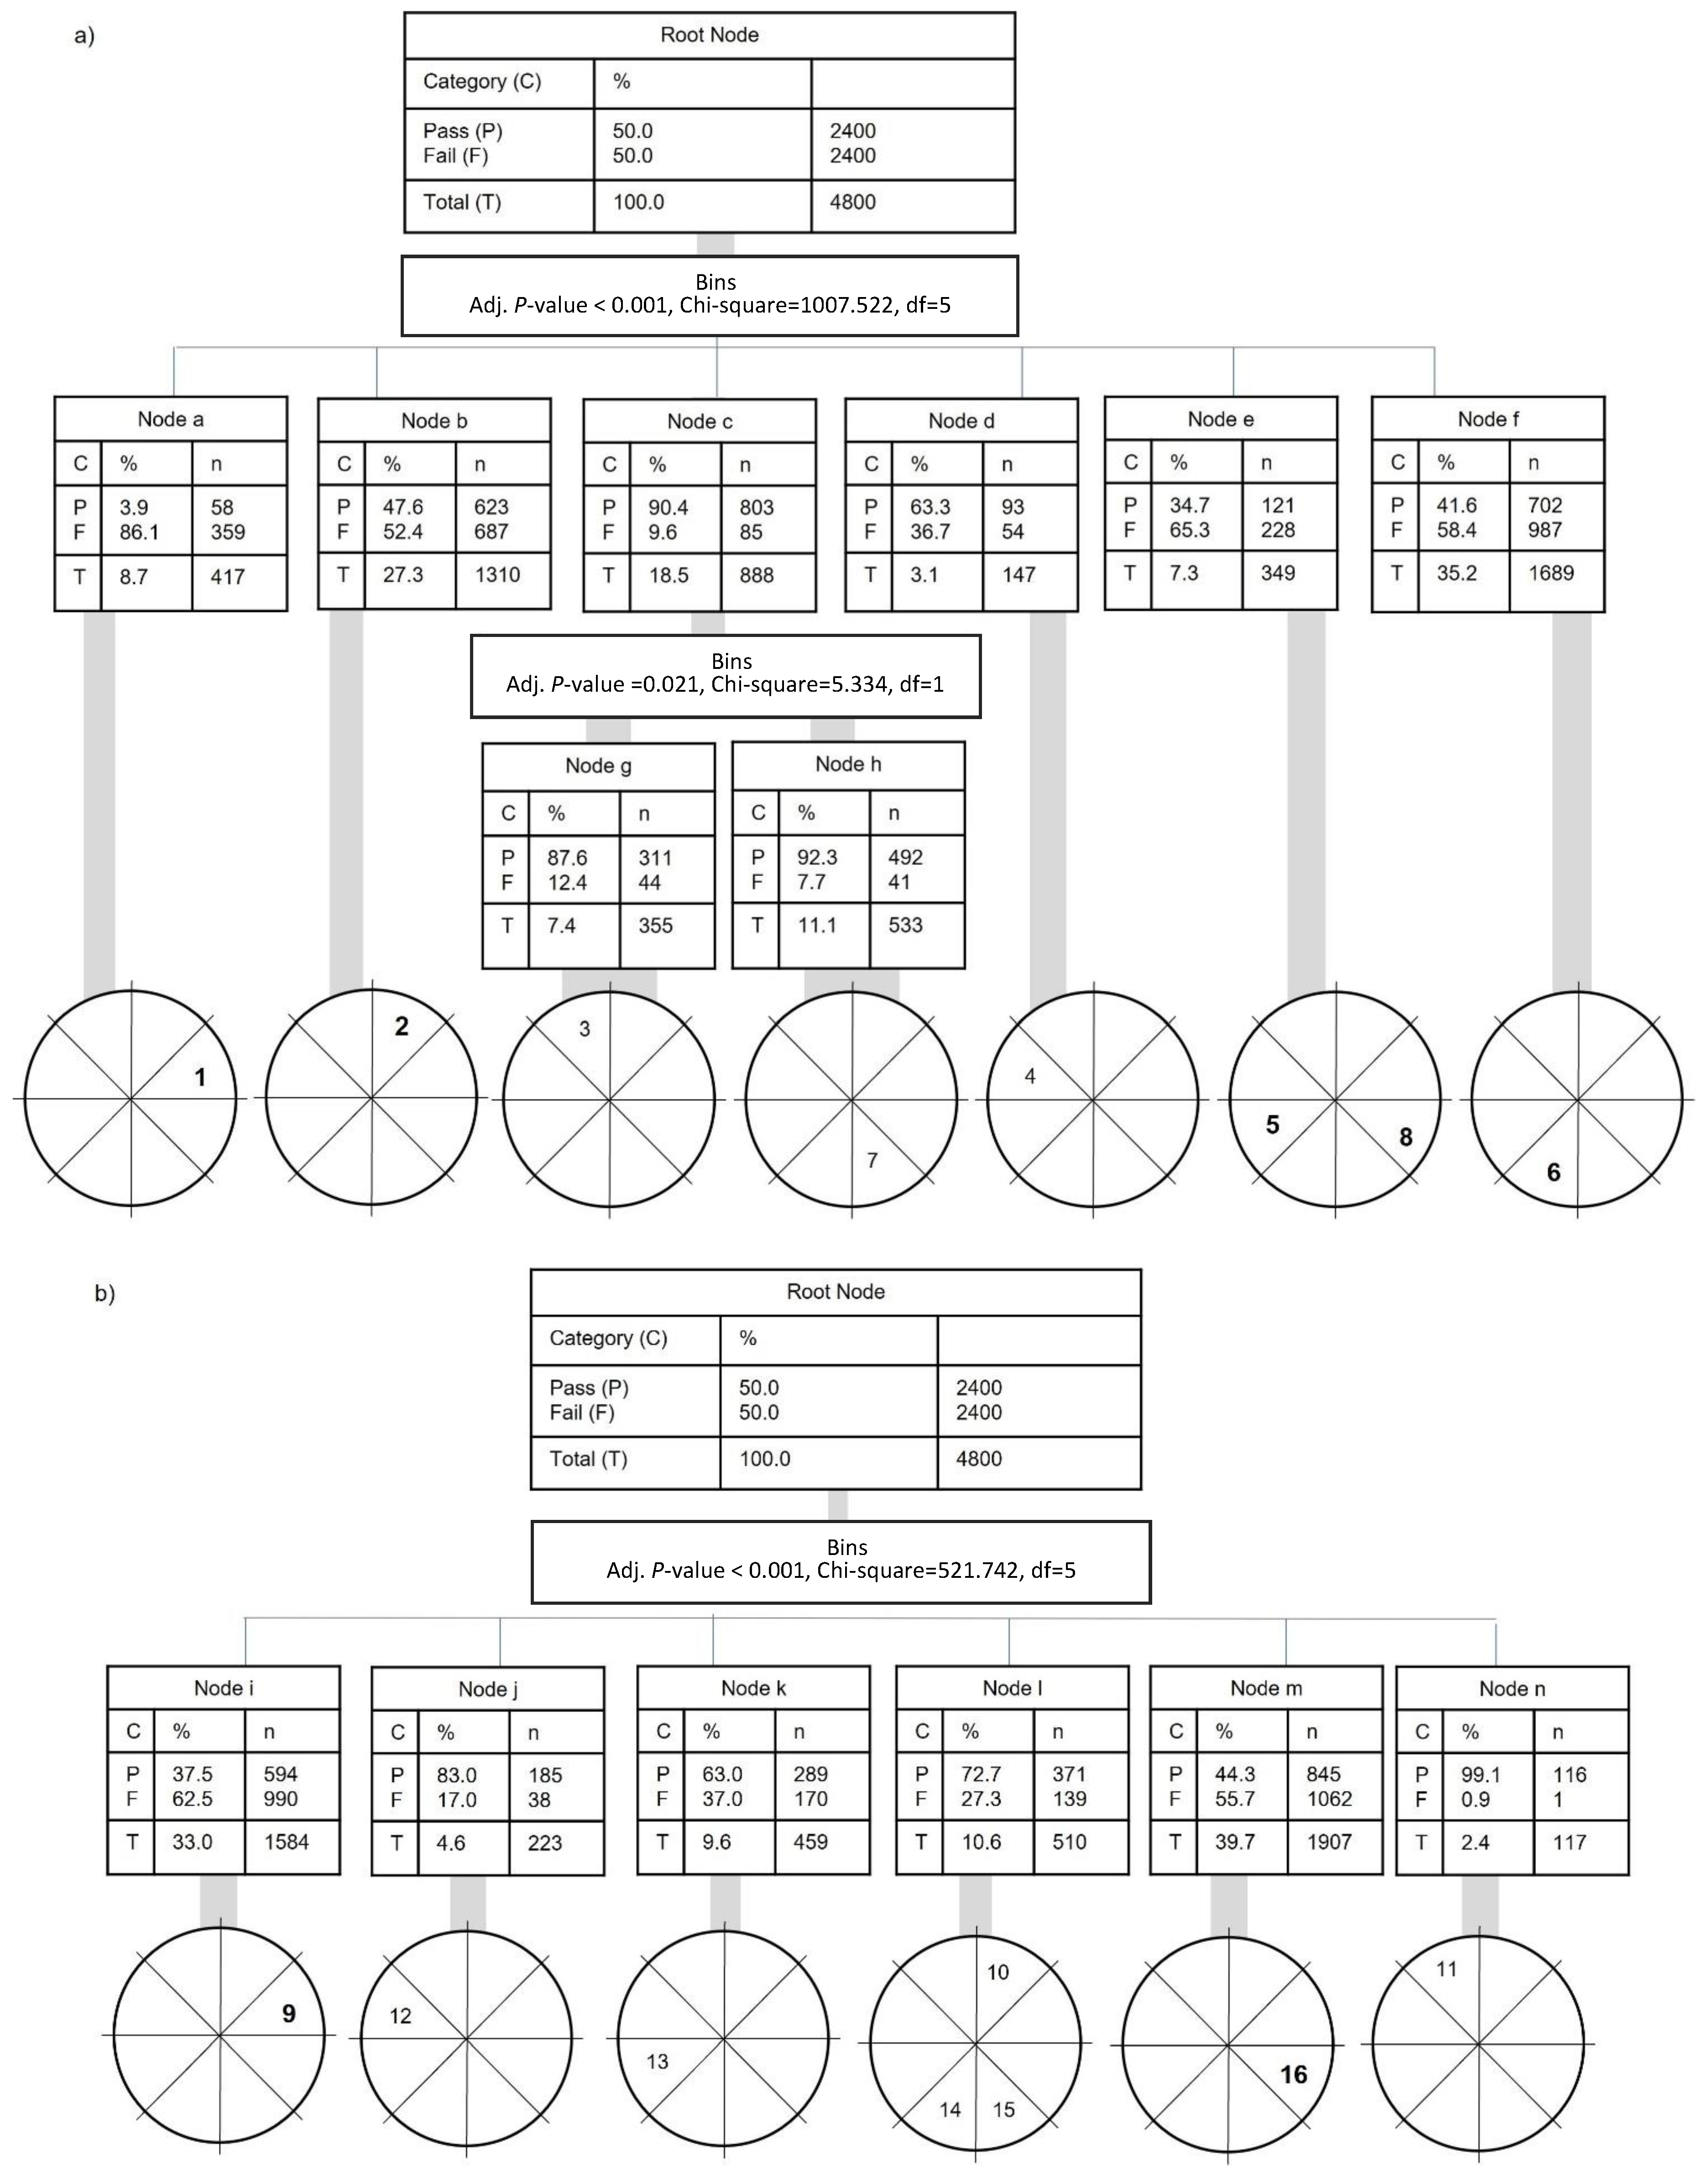
3.2. Participant Anthropometric/Demographic Characteristics and Segmental Coordination: Inferential Statistics (Discrete and Continuous Analysis)
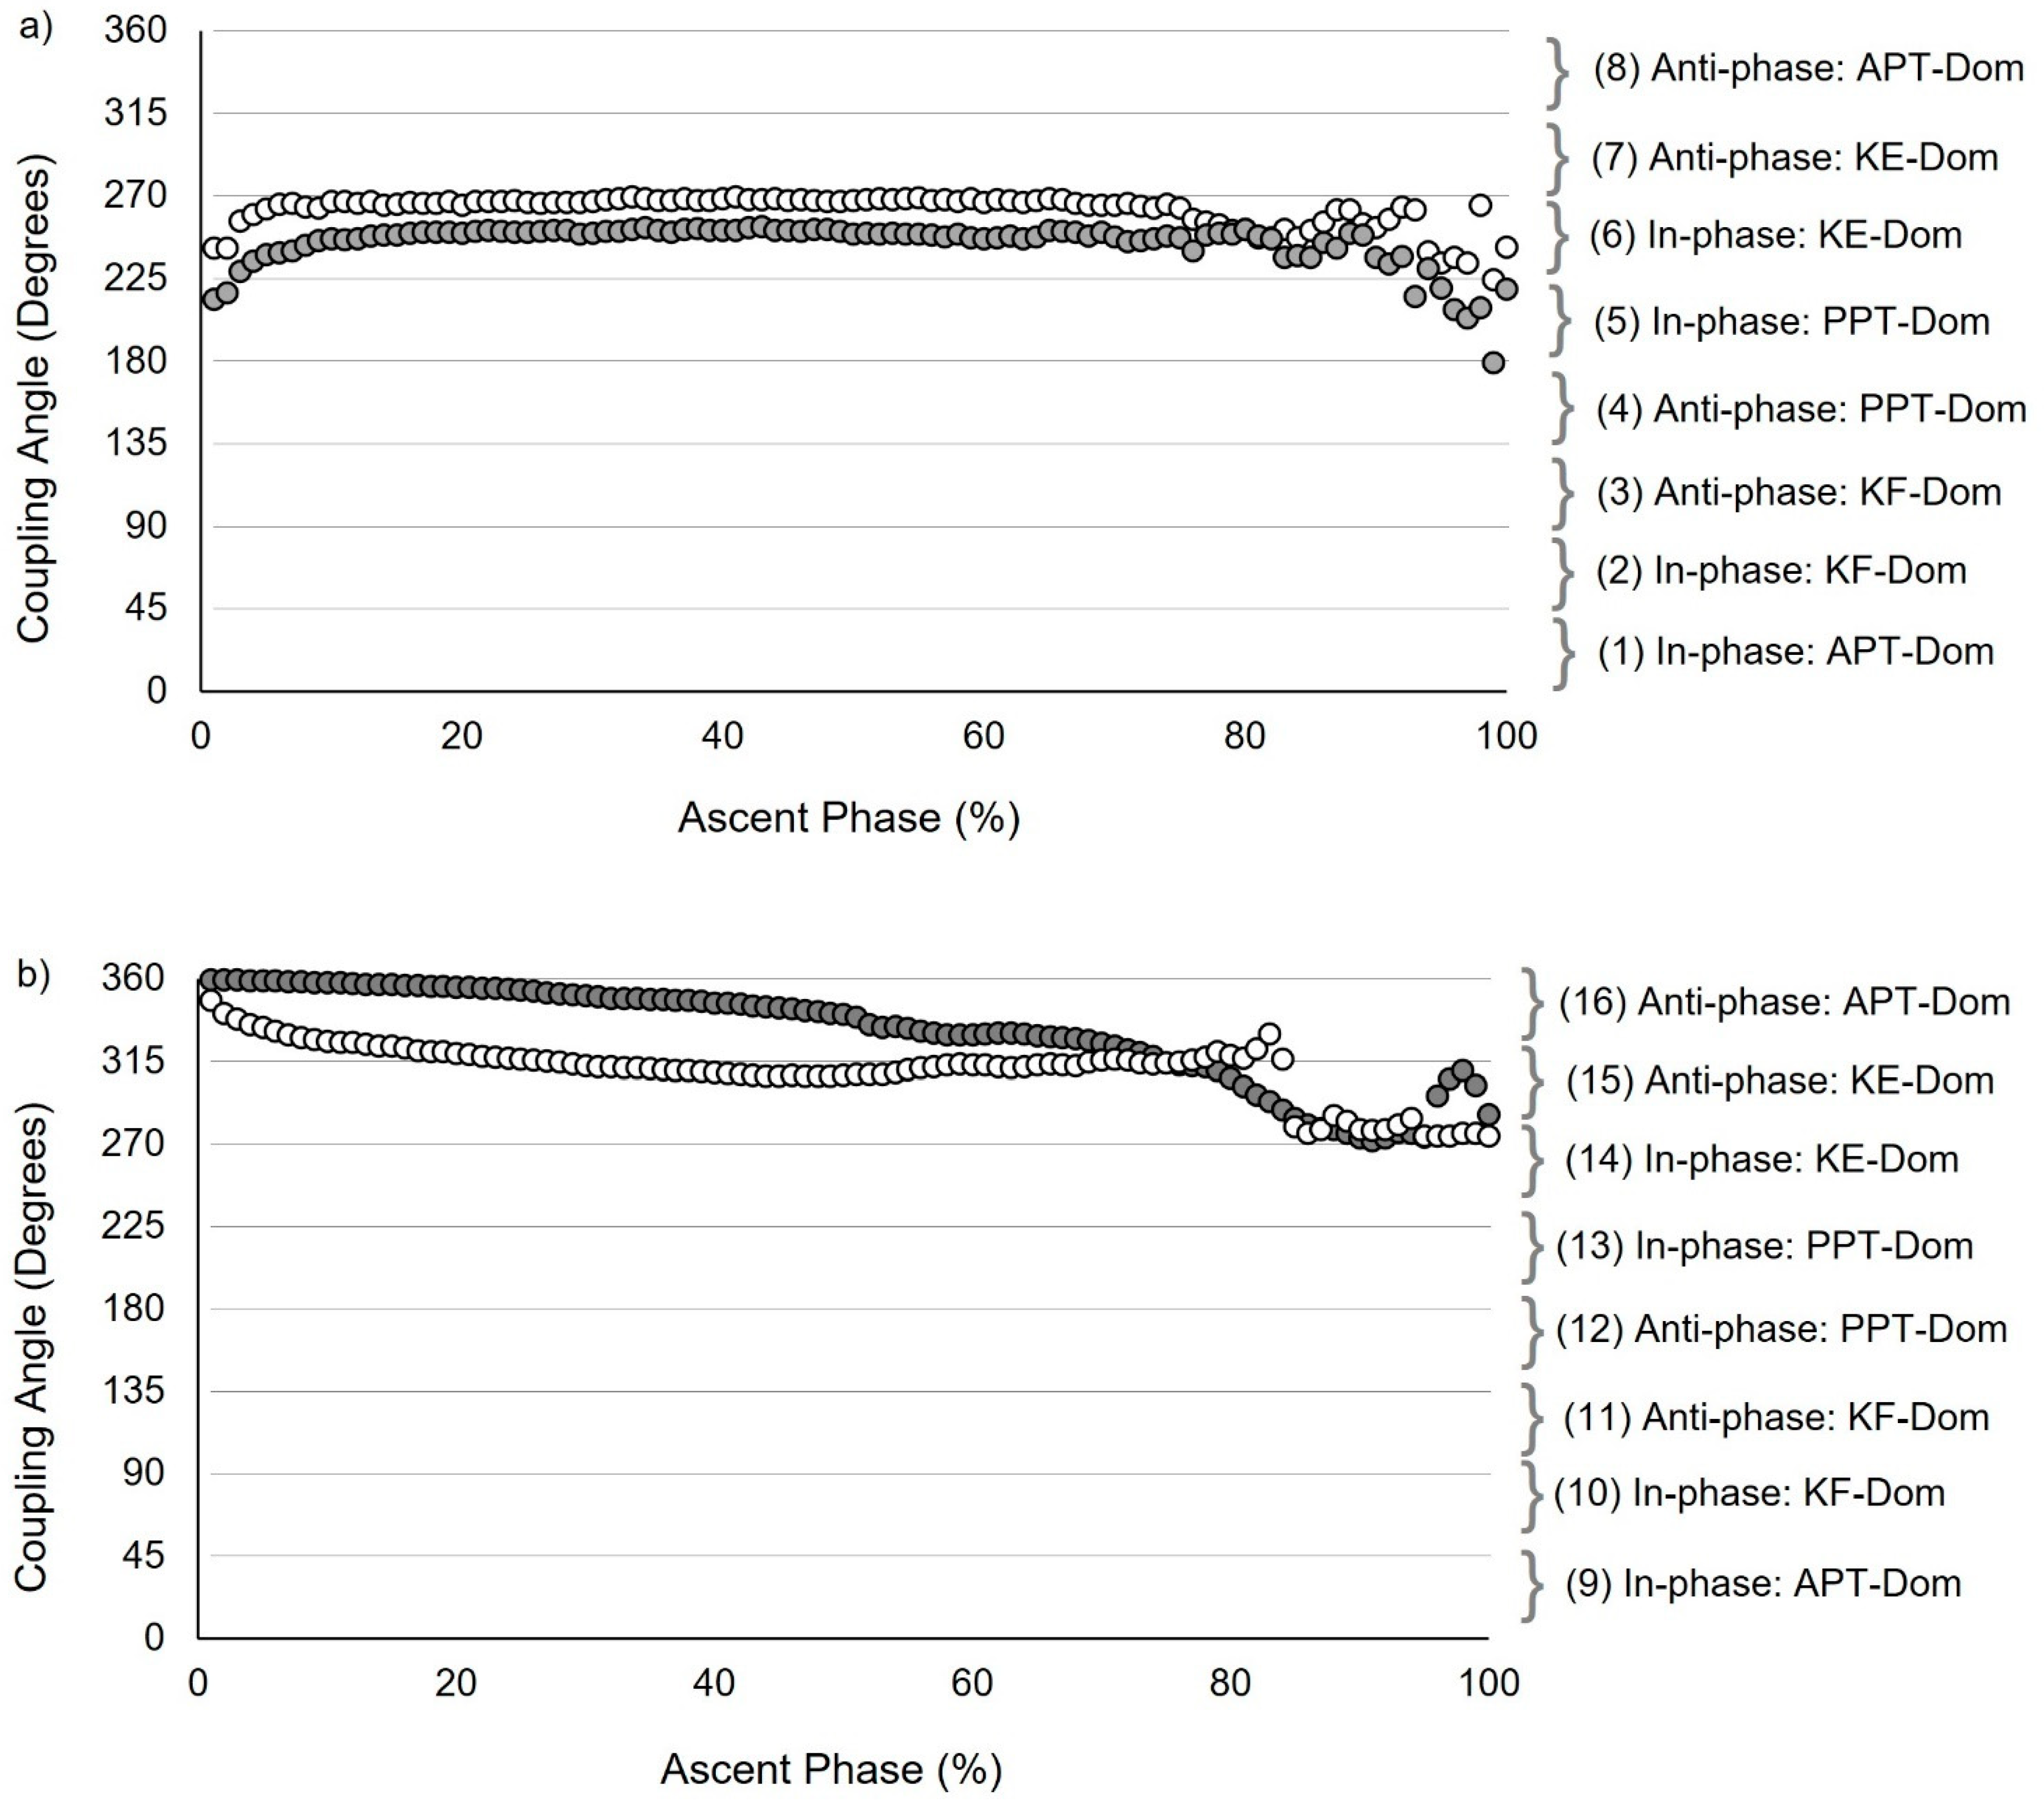
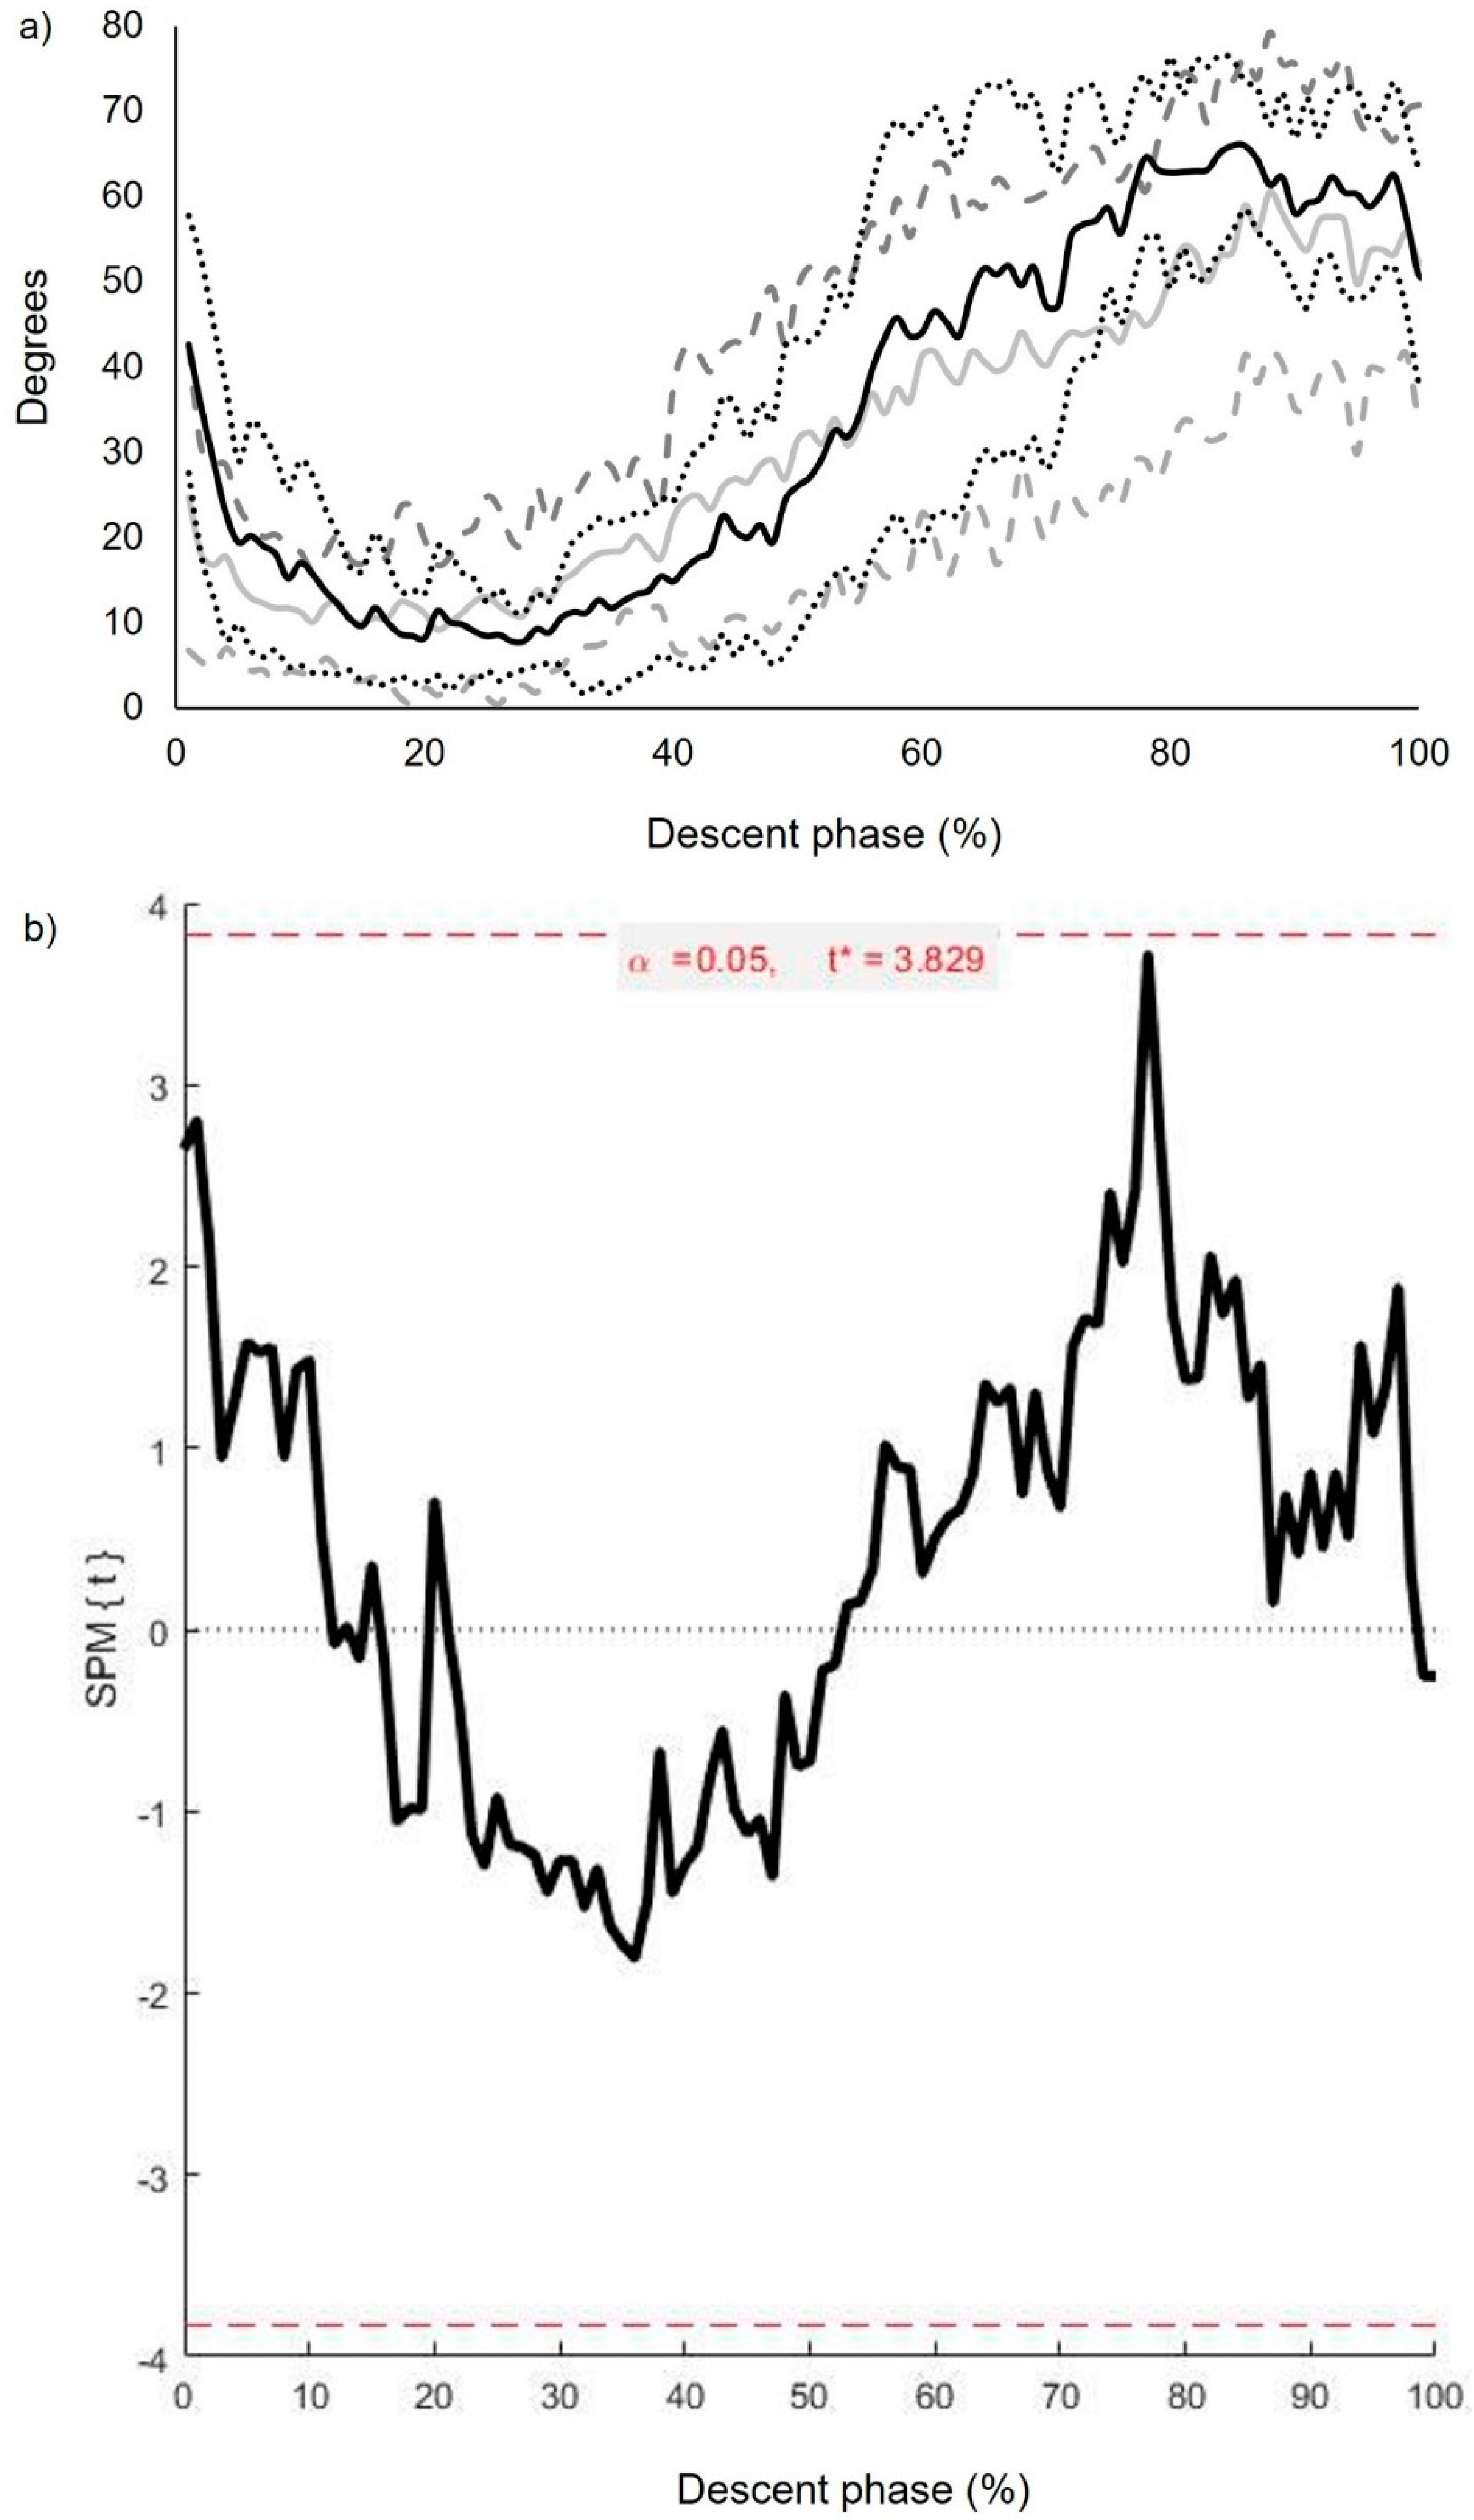
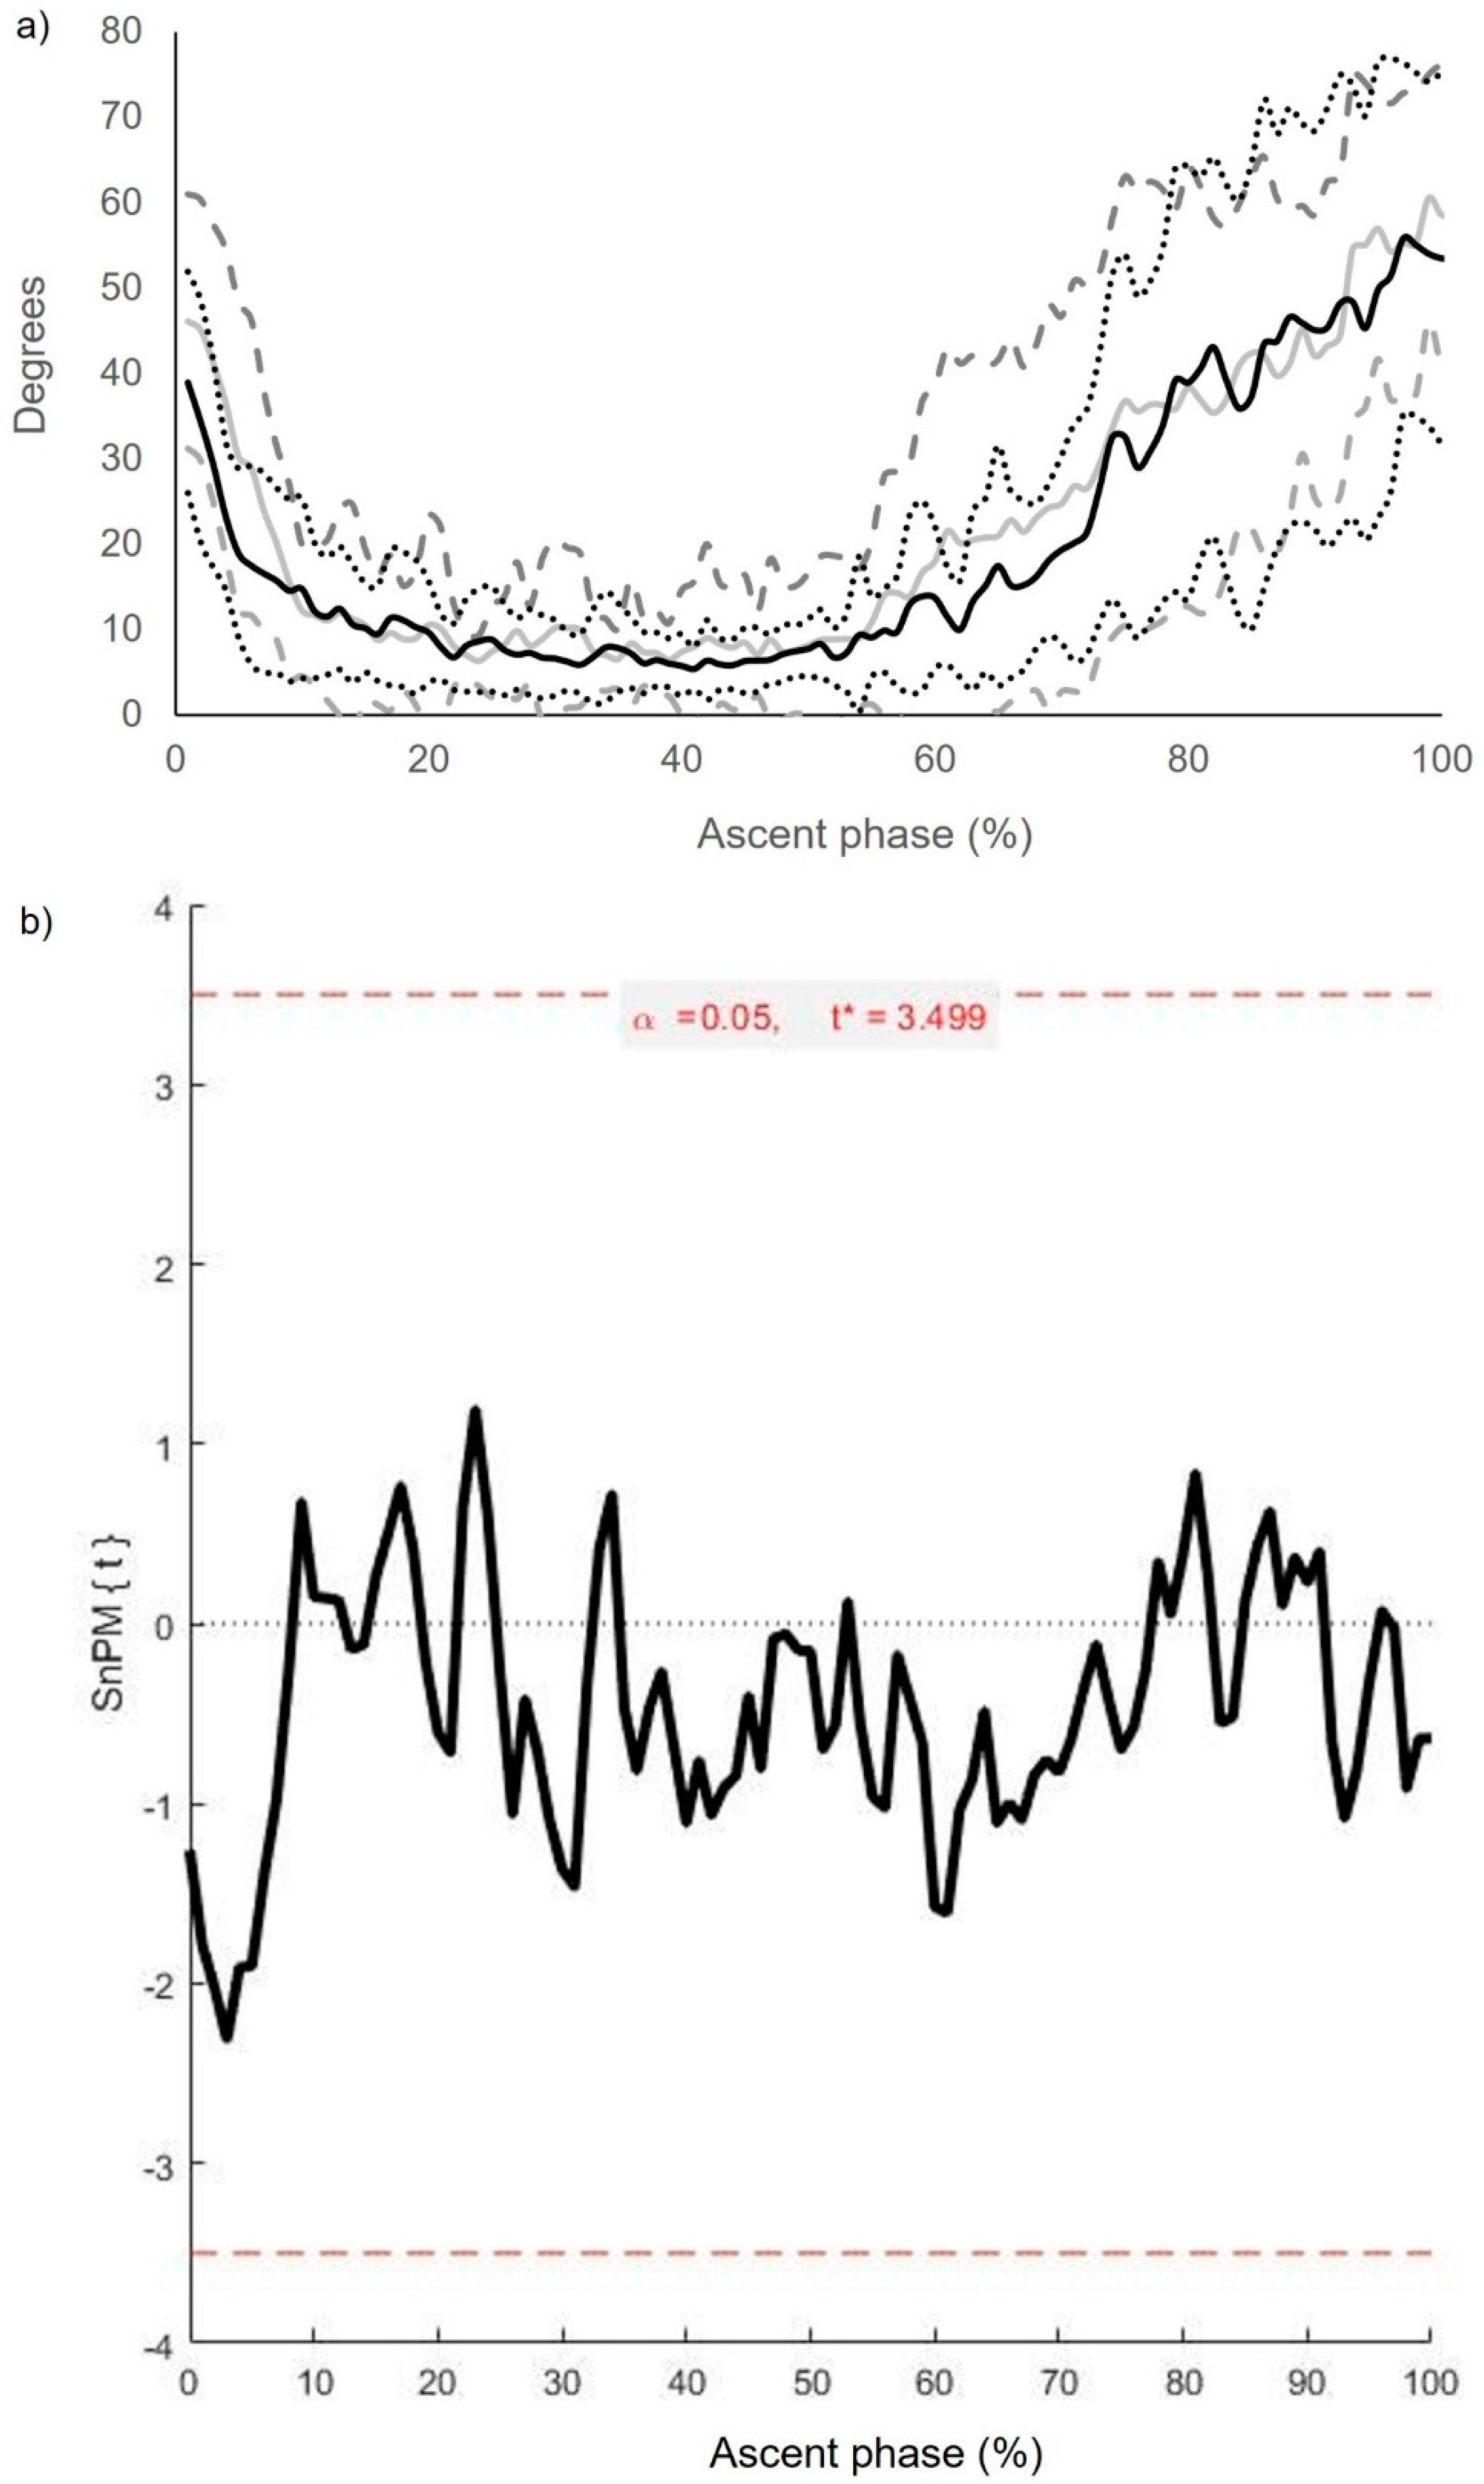
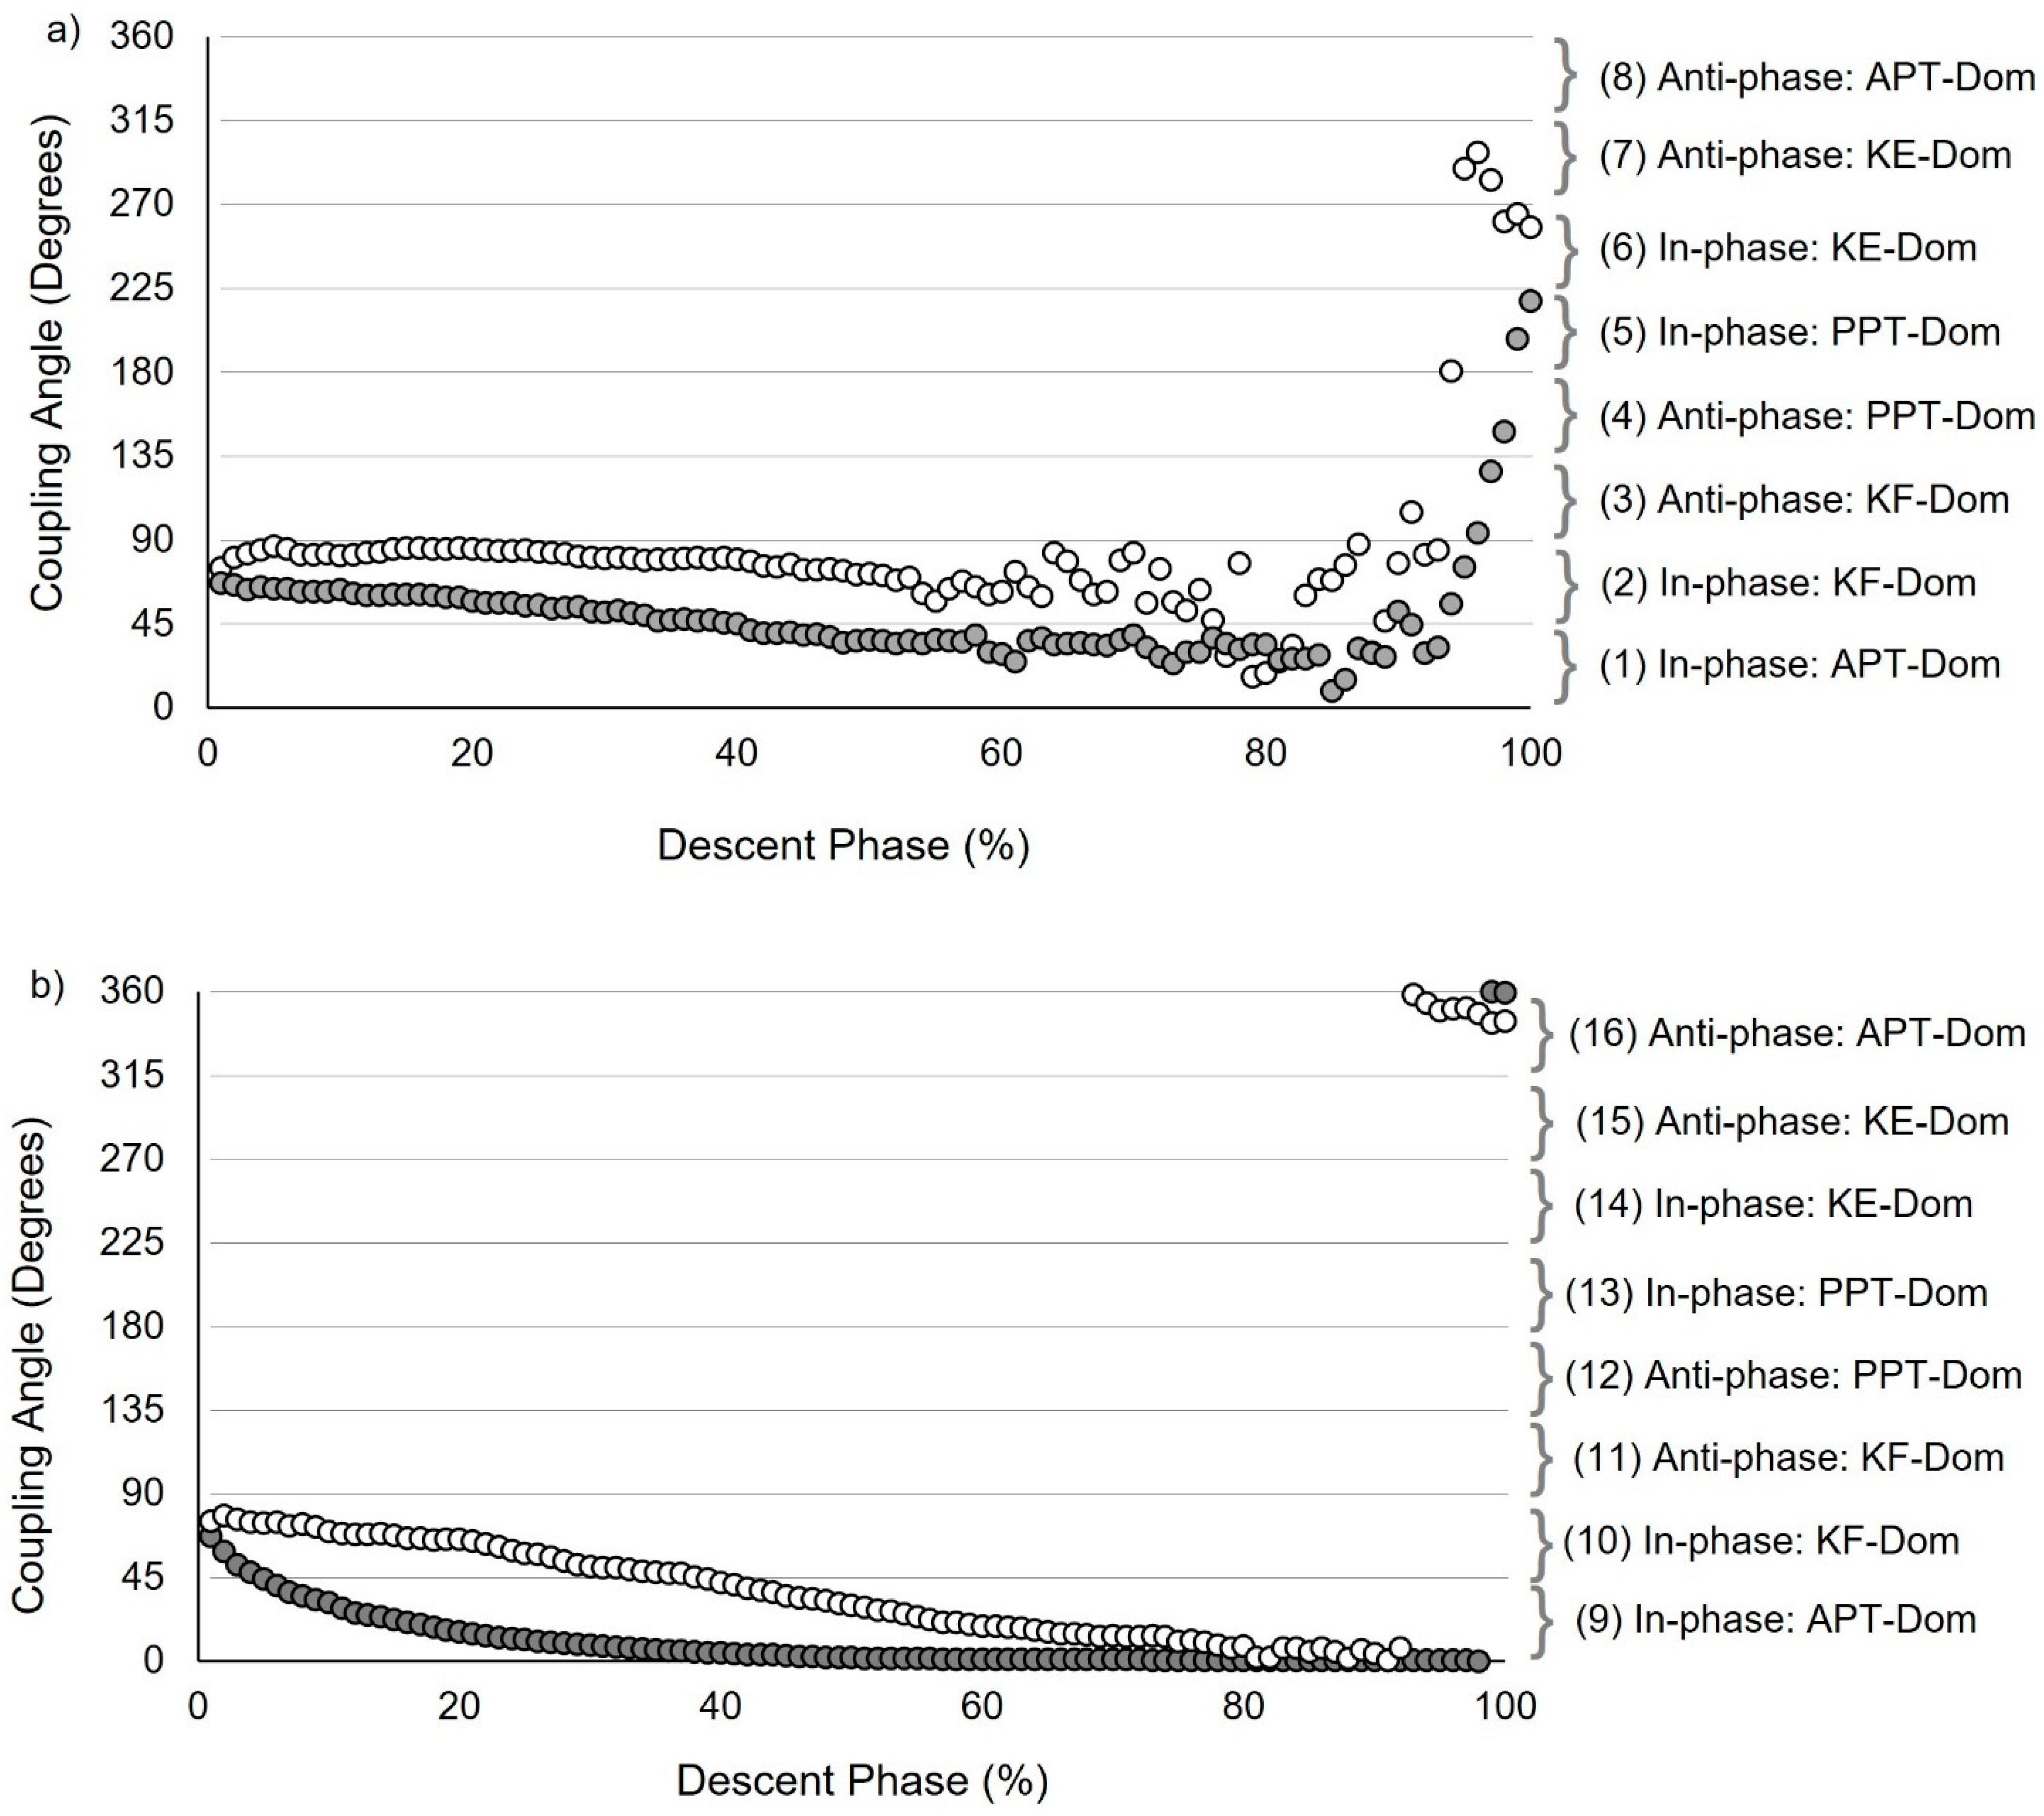
3.3. Intersegmental Coordination: Descriptive and Inferential Statistics (Continuous Analysis)
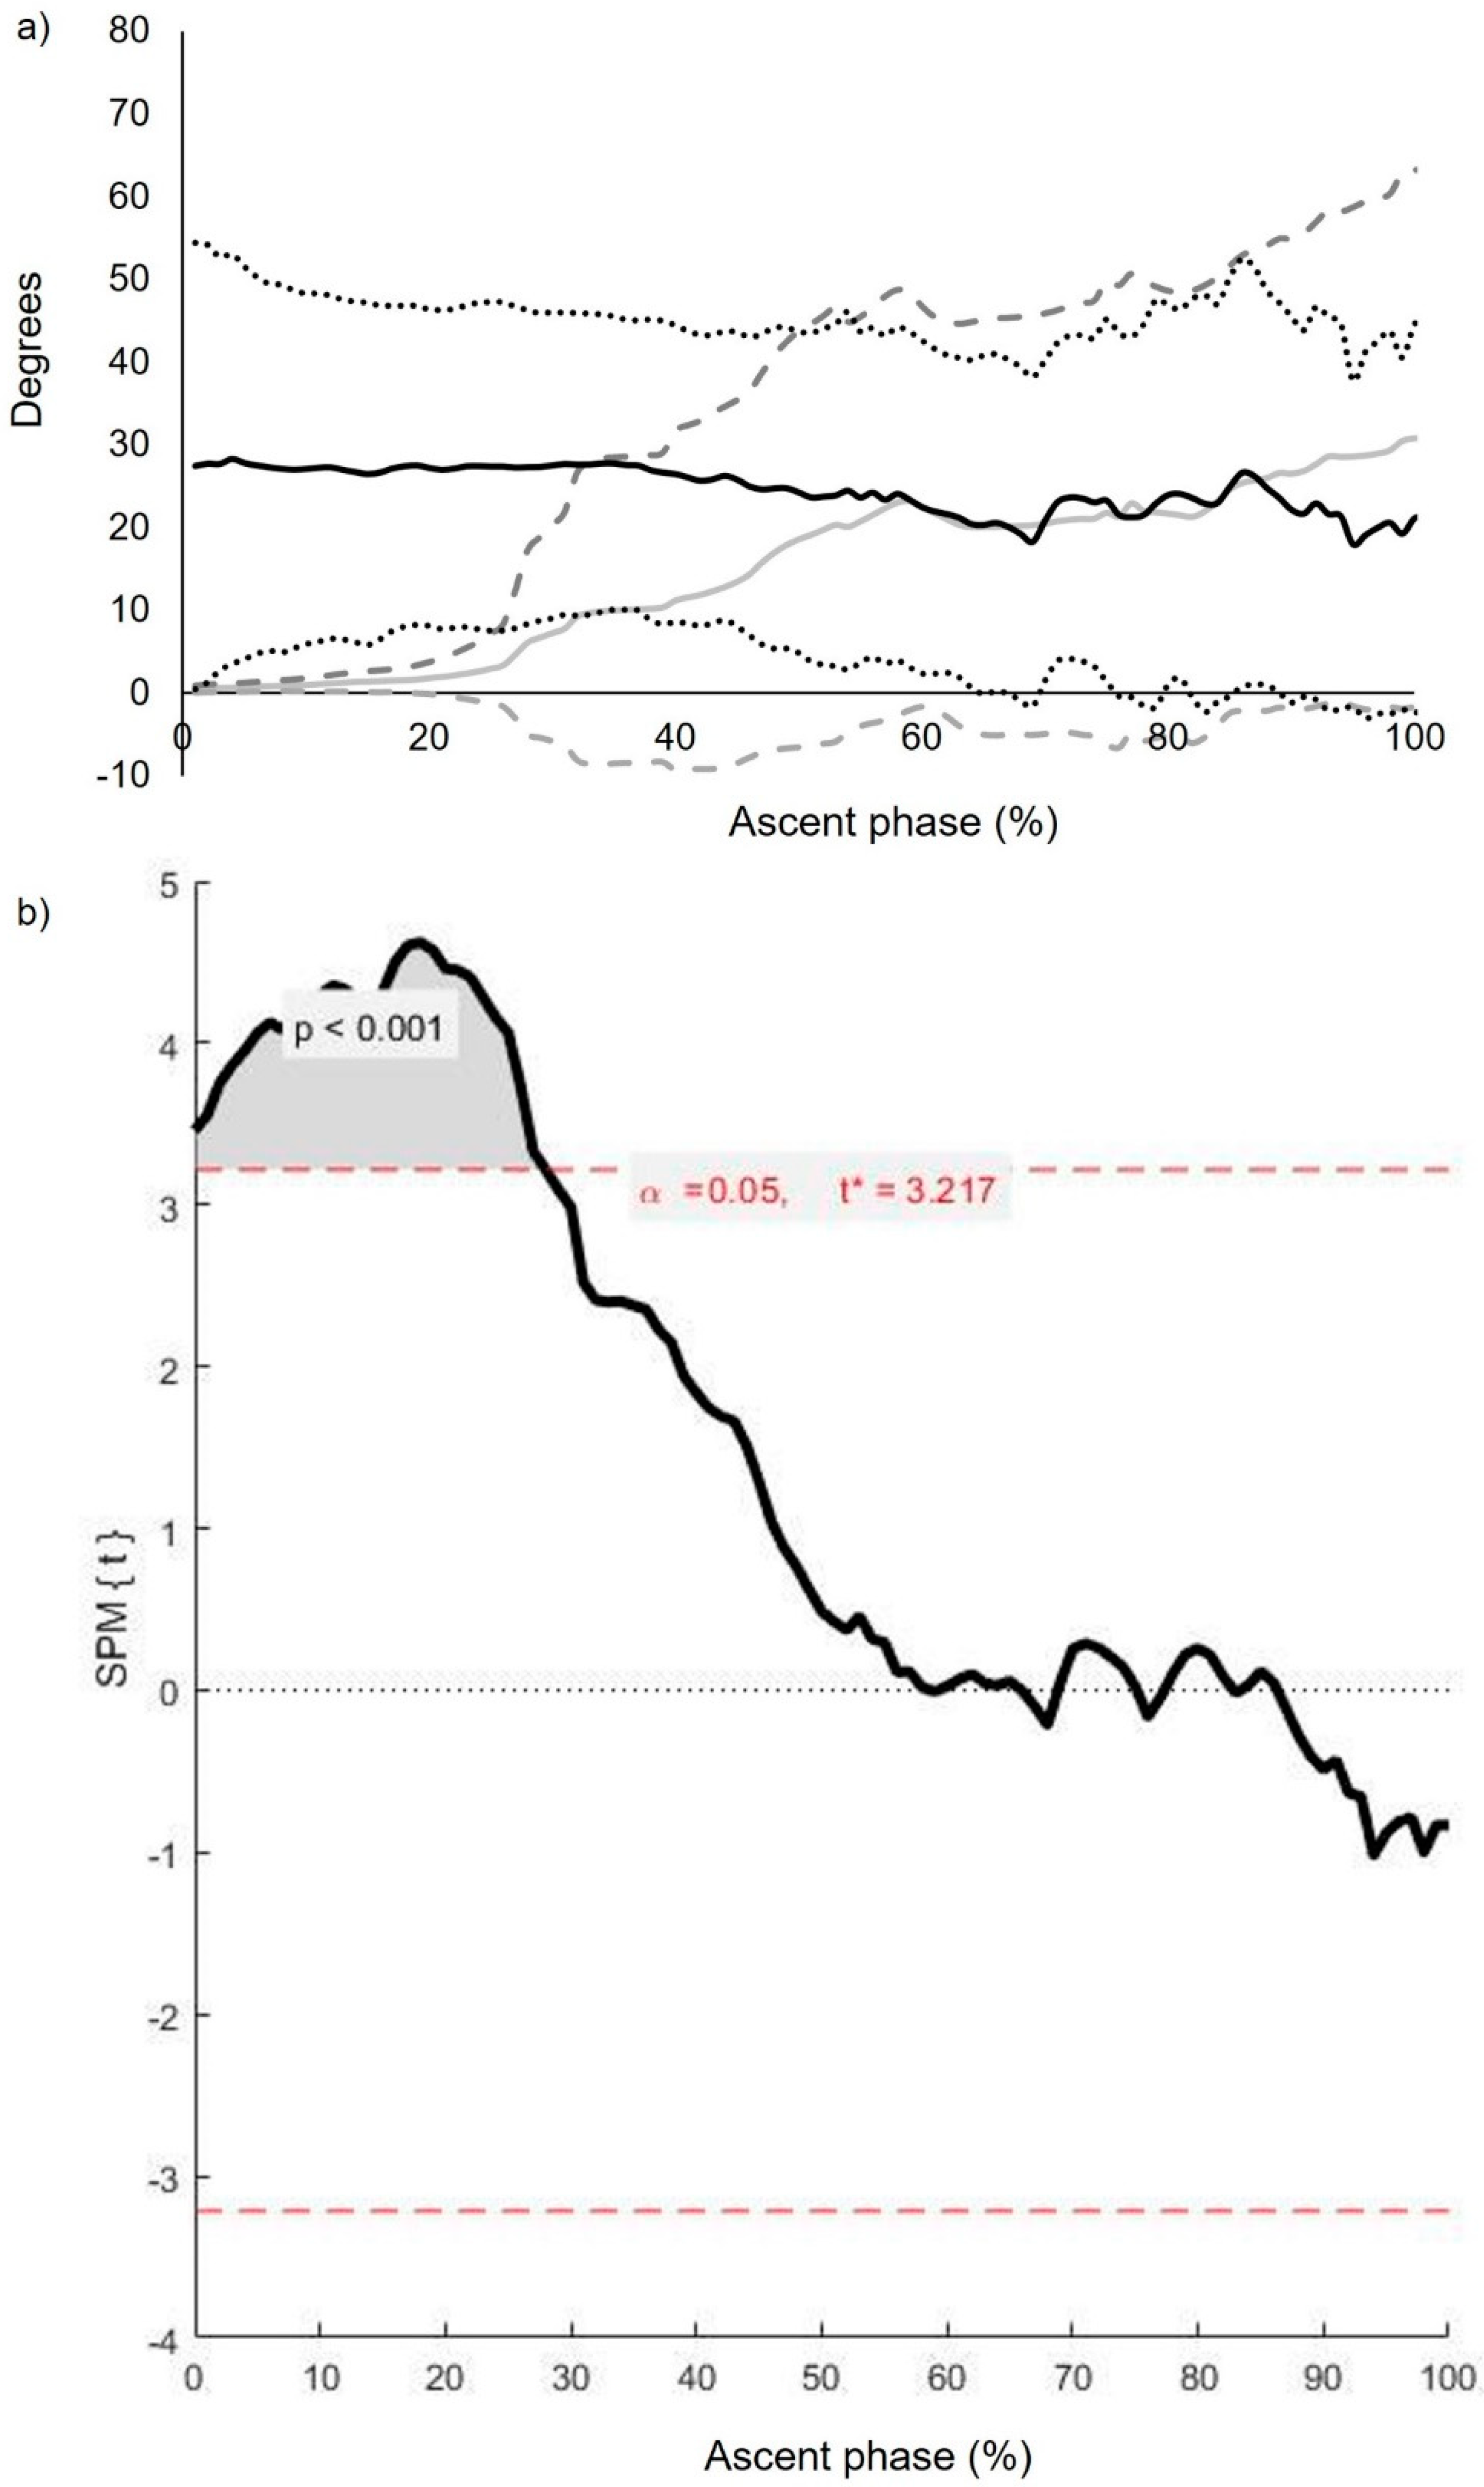
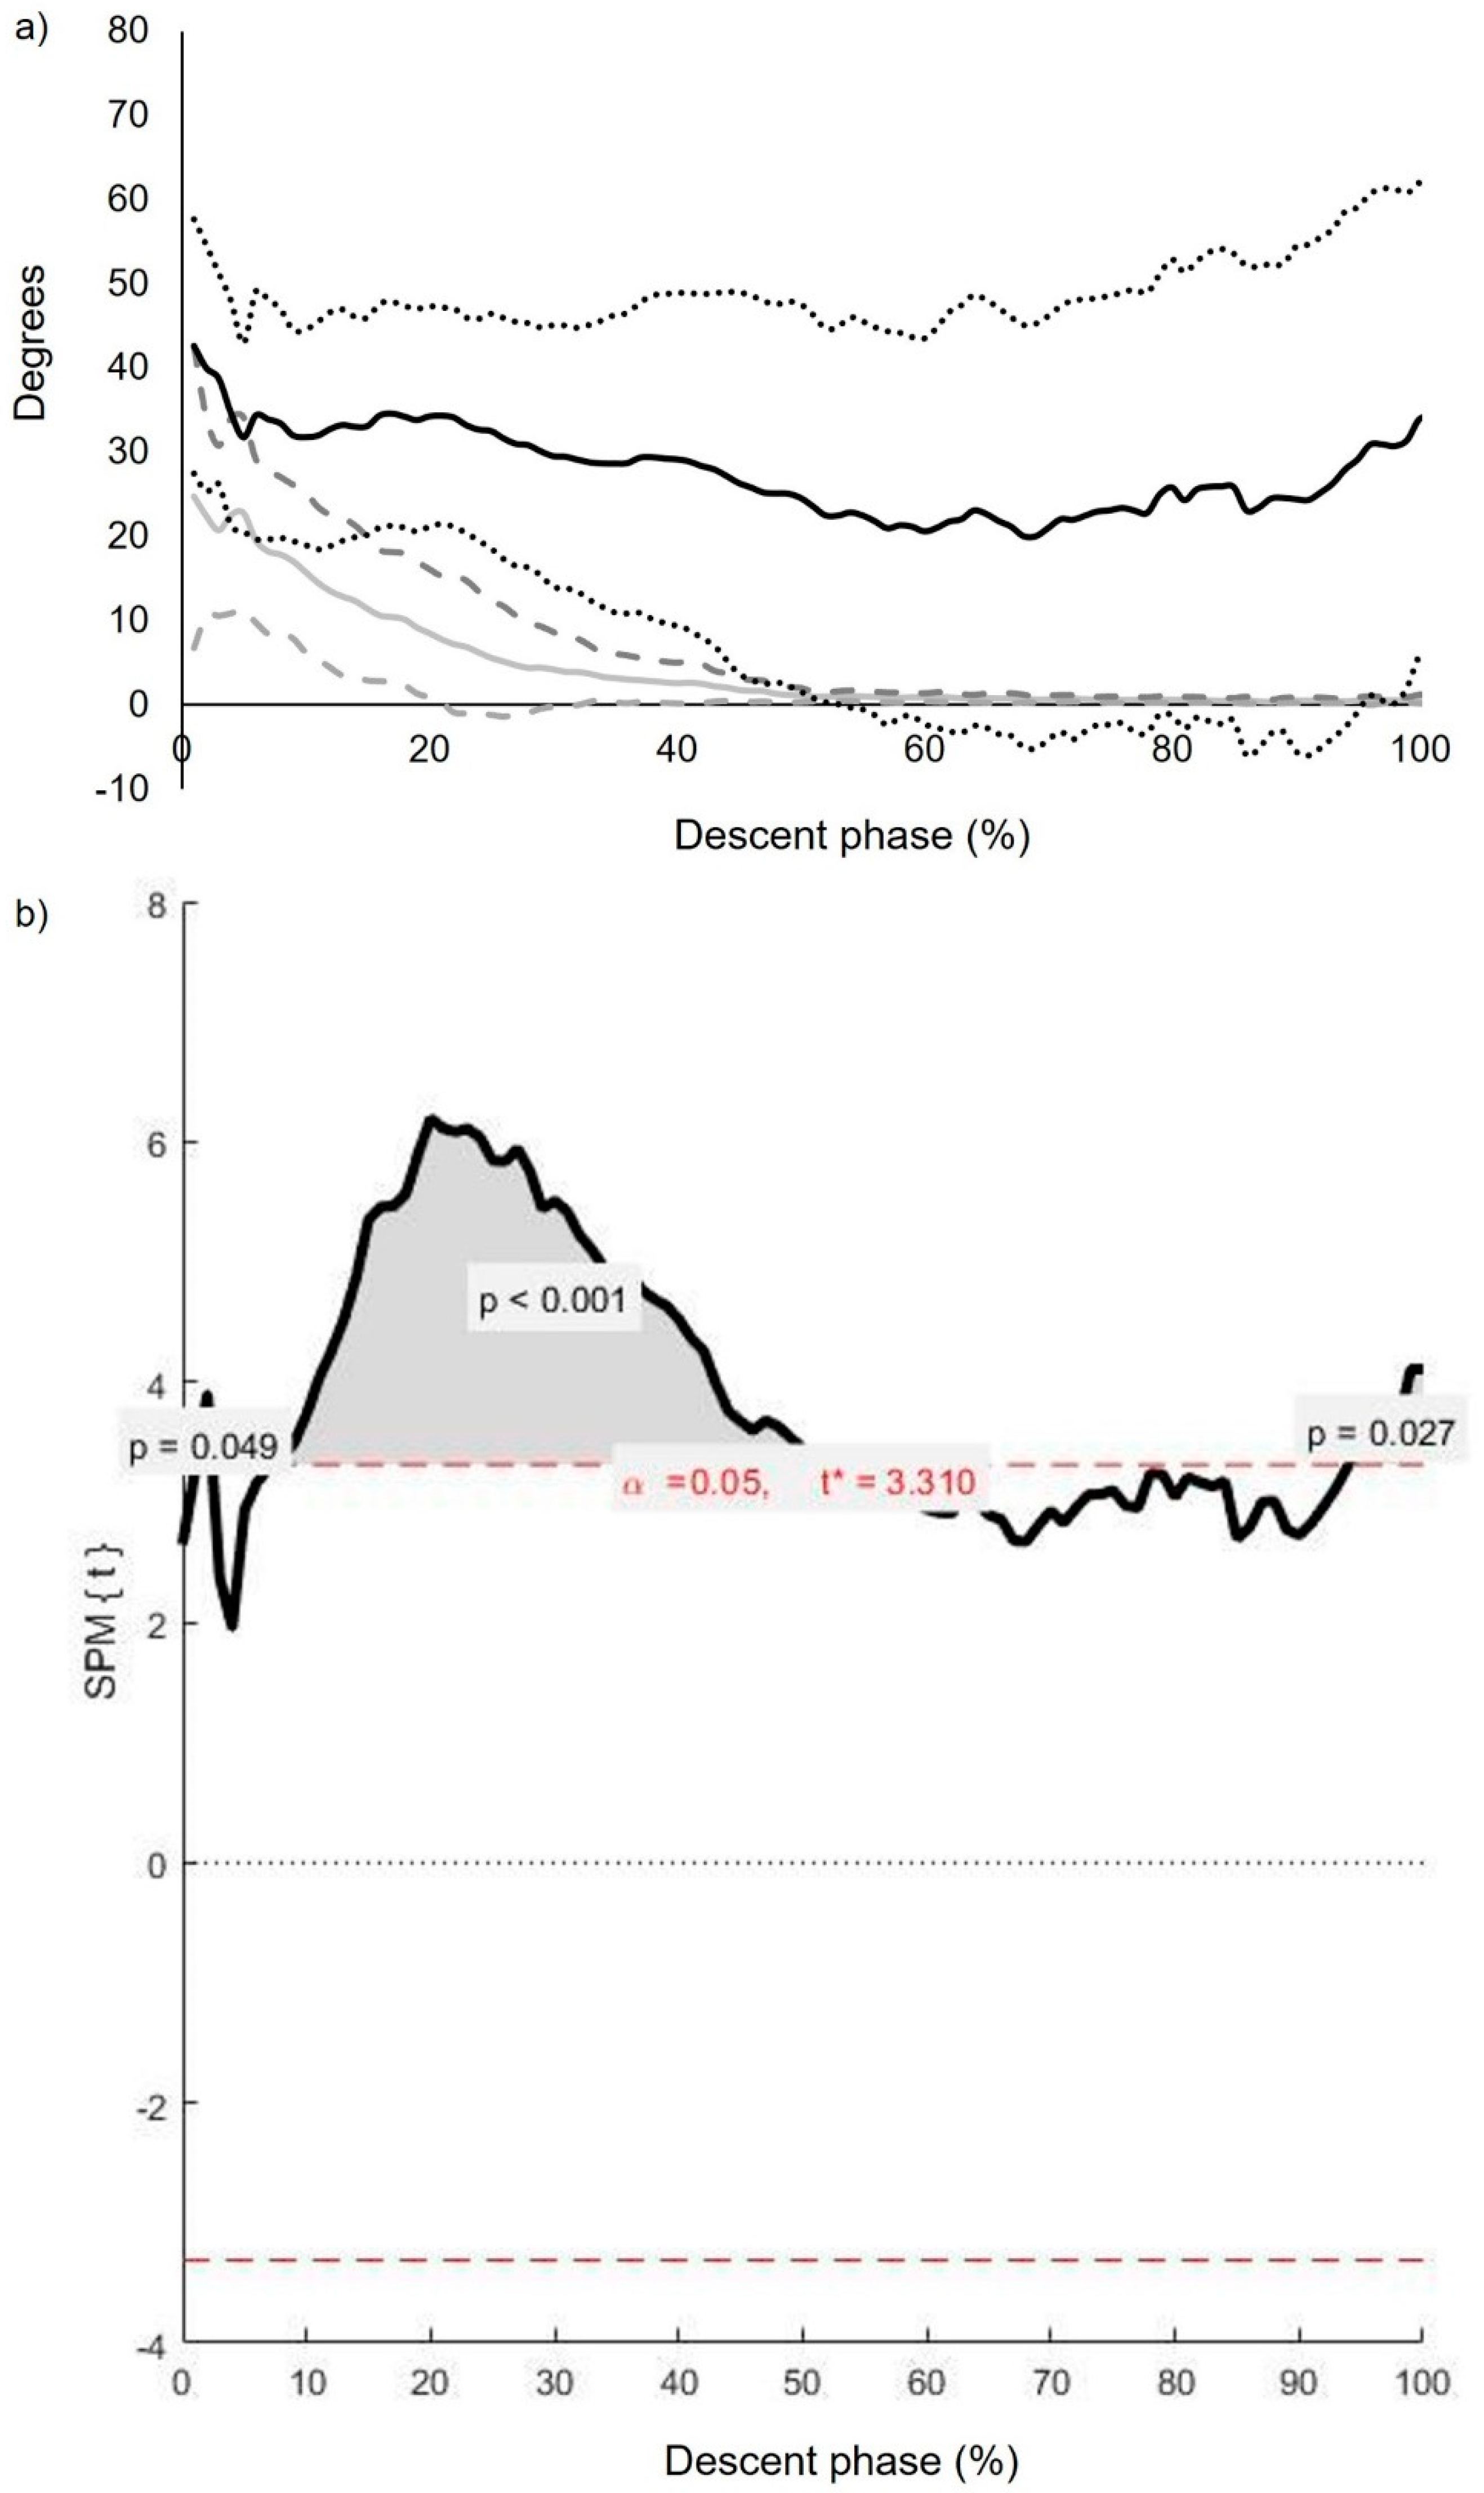
3.4. Inter-Segmental CoV (): Inferential Statistics (Continuous Analysis)
4. Discussion
5. Conclusions
Author Contributions
Funding
Institutional Review Board Statement
Informed Consent Statement
Data Availability Statement
Acknowledgments
Conflicts of Interest
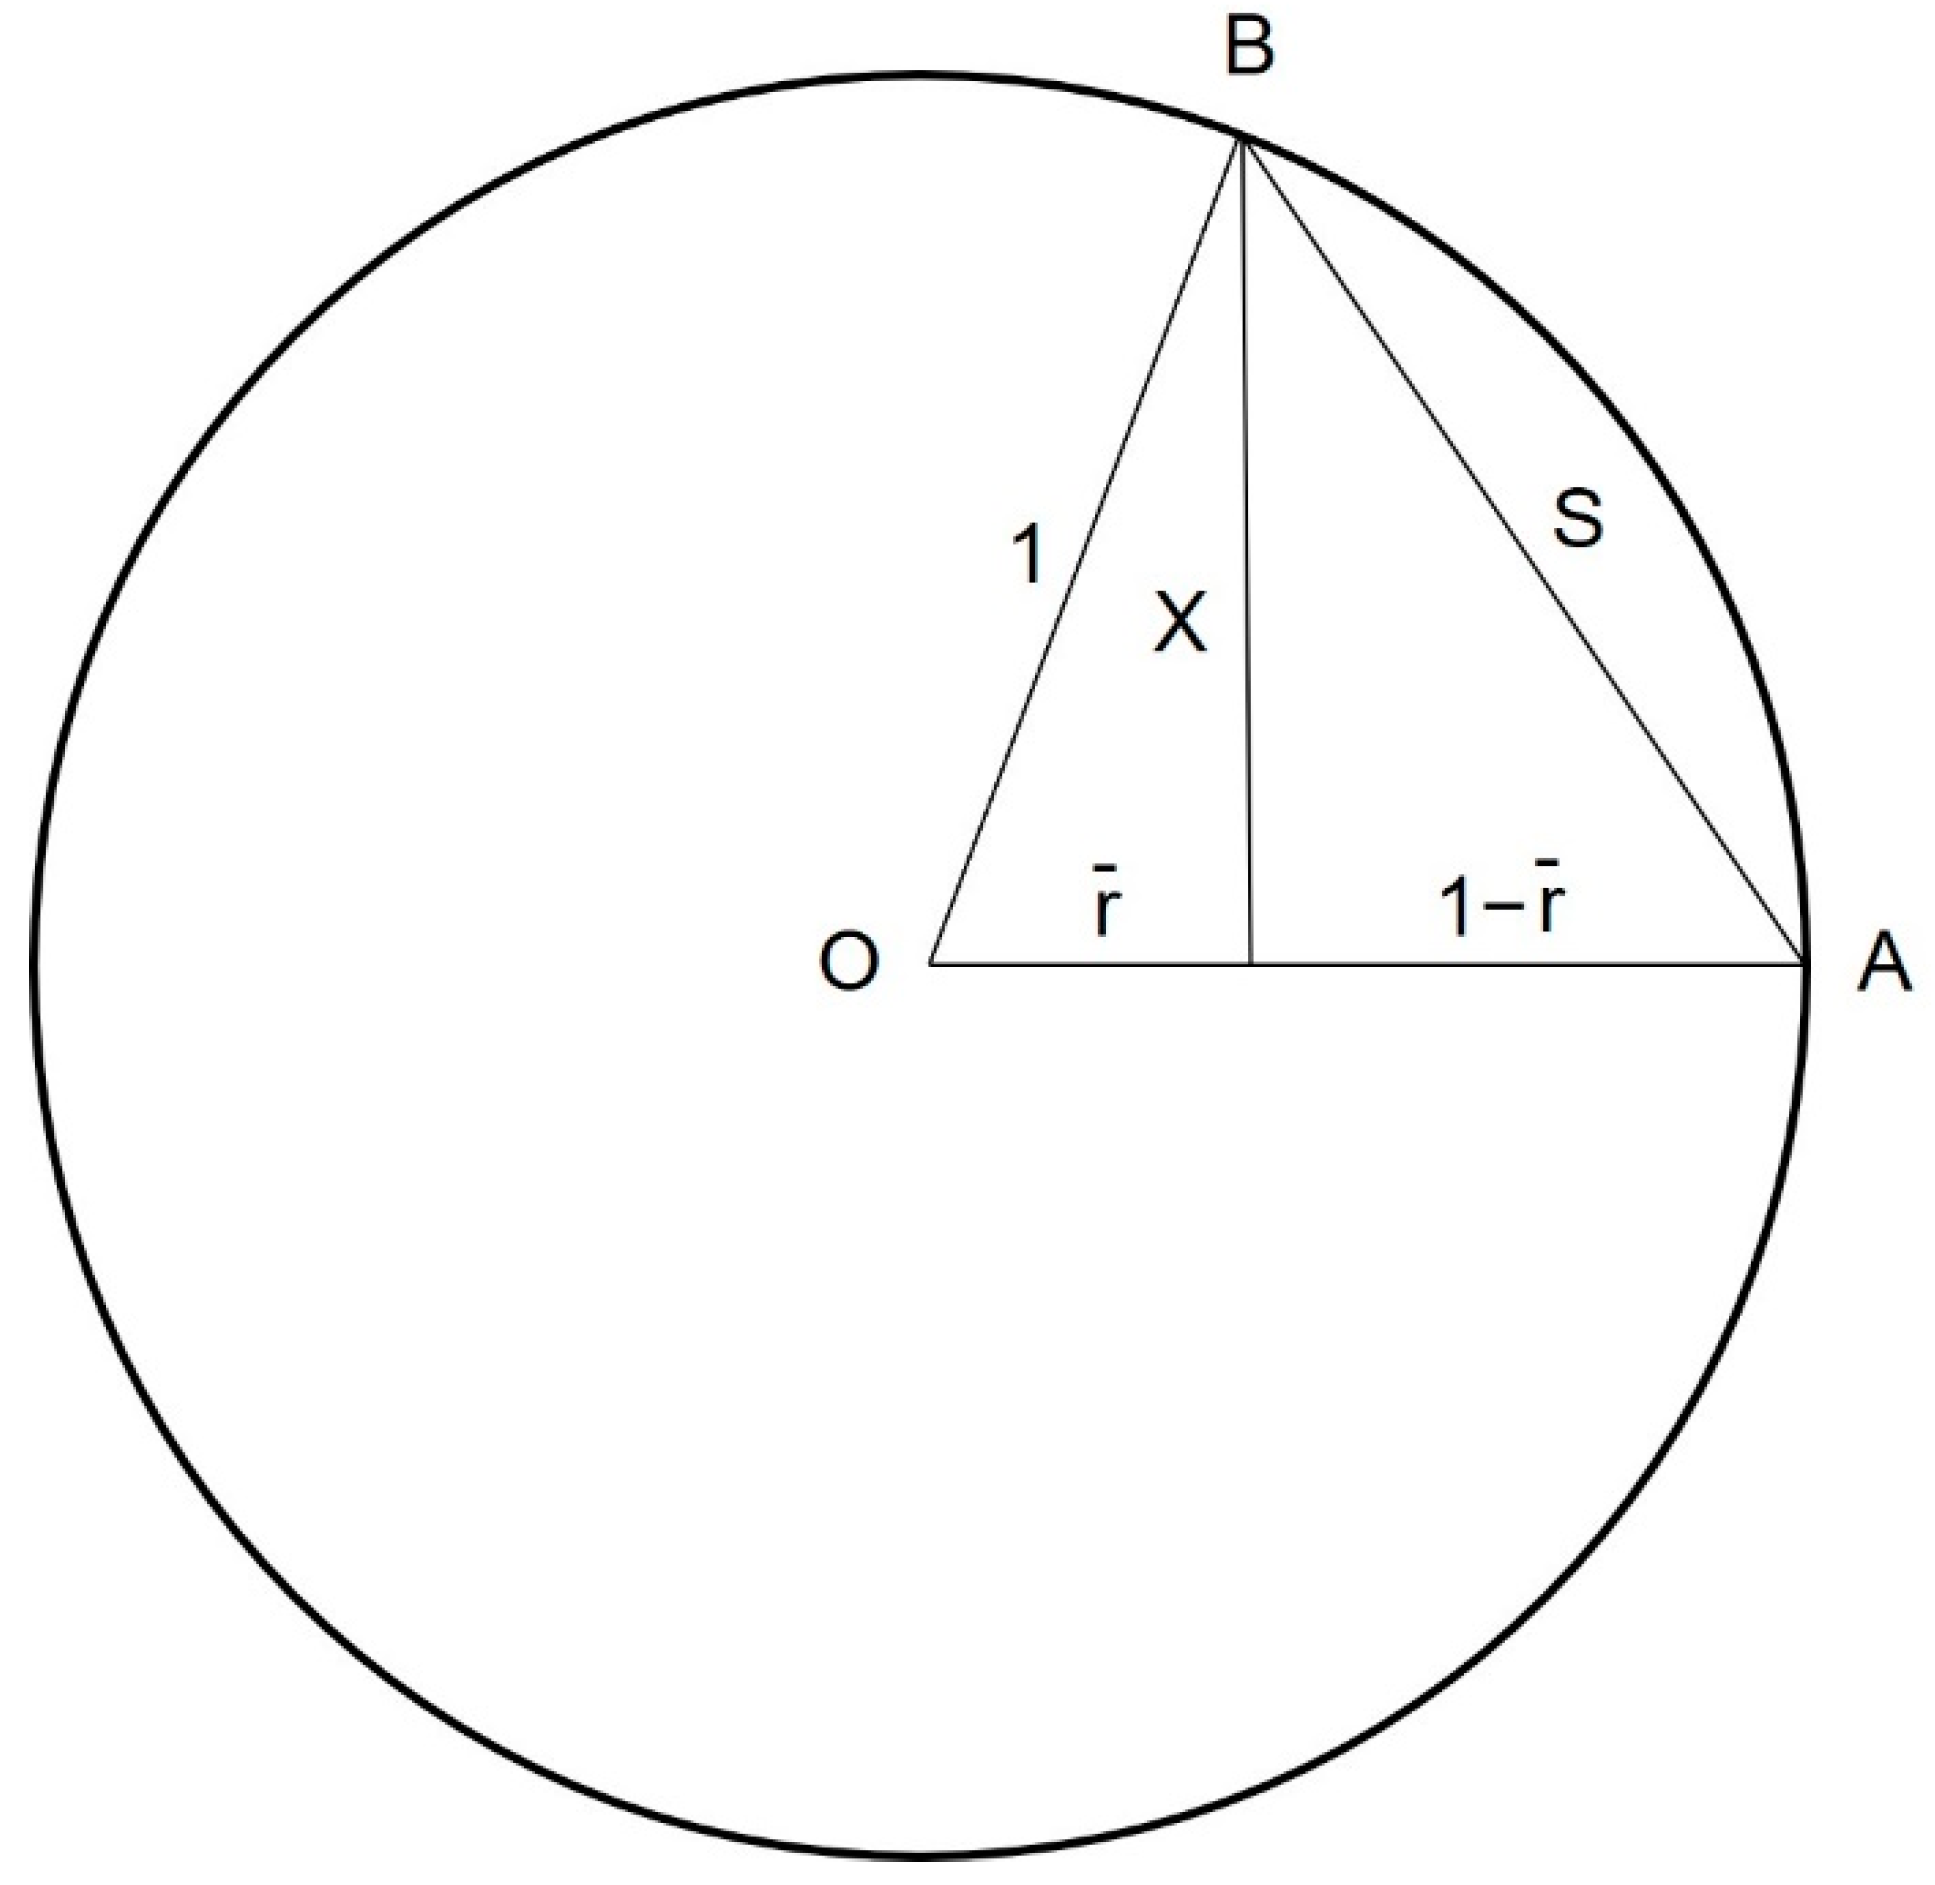
Appendix A. Calculation of Coupling Angle Variability (CoV) via Geometric Principles

References
- American Physical Therapy Association. Vision Statement for the Physical Therapy profession and Guiding Principles to Achieve the Vision. Available online: http://www.apta.org/Vision/ (accessed on 8 October 2020).
- Dingenen, B.; Blandford, L.; Comerford, M.; Staes, F.; Mottram, S. The assessment of movement health in clinical practice: A multidimensional perspective. Phys. Ther. Sport 2018, 32, 282–292. [Google Scholar] [CrossRef] [PubMed]
- Ludewig, P.M.; Saini, G.; Hellem, A.; Kahnert, E.K.; Rezvanifar, S.C.; Braman, J.P.; Staker, J.L. Changing our diagnostic paradigm part II: Movement system diagnostic classification. Int. J. Sports Phys. Ther. 2022, 17, 7–17. [Google Scholar] [CrossRef] [PubMed]
- Sahrmann, S.A. Diagnosis and Treatment of Movement Impairment Syndromes; Mosby Publishers: Maryland Heights, MO, USA, 2002; pp. 268–270. [Google Scholar]
- Whatman, C.; Hume, P.; Hing, W. The reliability and validity of visual rating of dynamic alignment during lower extremity functional screening tests: A review of the literature. Phys. Ther. Rev. 2015, 20, 210–224. [Google Scholar] [CrossRef]
- Herrington, L.; Munro, A. A preliminary investigation to establish the criterion validity of a qualitative scoring system of limb alignment during single-leg squat and landing. J. Exerc. Sports Orthop. 2014, 1, 1–6. [Google Scholar] [CrossRef] [Green Version]
- Bennett, H.; Davison, K.; Arnold, J.; Slattery, F.; Martin, M.; Norton, K. Multicomponent musculoskeletal movement assessment tools: A systematic review and critical appraisal of their development and applicability to professional practice. J. Strength Cond. Res. 2017, 31, 2903–2919. [Google Scholar] [CrossRef]
- Warner, M.B.; Wilson, D.A.; Herrington, L.; Dixon, S.; Power, C.; Jones, R.; Lewis, C.L. A systematic review of the discriminating biomechanical parameters during the single leg squat. Phys. Ther. Sport 2019, 36, 78–91. [Google Scholar] [CrossRef]
- Mottram, S.; Warner, M.; Booysen, N.; Bahain-Steenman, K.; Stokes, M. Retraining in a female elite rower with persistent symptoms post-arthroscopy for femoroacetabular impingement syndrome: A proof-of-concept case report. J. Funct. Morphol. Kinesiol. 2019, 4, 24. [Google Scholar] [CrossRef] [Green Version]
- Van Dillen, L.R.; Lanier, V.M.; Steger-May, K.; Wallendorf, M.; Norton, B.J.; Civello, J.M.; Lang, C.E. Effect of motor skill training in functional activities vs strength and flexibility exercise on function in people with chronic low Back pain: A randomized clinical trial. JAMA Neurol. 2021, 78, 385–395. [Google Scholar] [CrossRef]
- Wilson, D.A.; Booysen, N.; Dainese, P.; Heller, M.O.; Stokes, M.; Warner, M.B. Accuracy of movement quality screening to document effects of neuromuscular control retraining exercises in a young ex-footballer with hip and groin symptoms: A proof of concept case study. Med. Hypotheses 2018, 120, 116–120. [Google Scholar] [CrossRef] [Green Version]
- Comerford, M.; Mottram, S. Kinetic Control: The Management of Uncontrolled Movement; Elsevier Health Sciences: Melbourne, Australia, 2012; pp. 43–62. [Google Scholar]
- Luomajoki, H.; Kool, J.; De Bruin, E.D.; Airaksinen, O. Movement control tests of the low back; evaluation of the difference between patients with low back pain and healthy controls. BMC Musculoskelet. Disord. 2008, 9, 170. [Google Scholar] [CrossRef] [Green Version]
- Mottram, S.; Blandford, L. Assessment of movement coordination strategies to inform health of movement and guide retraining interventions. Musculoskelet. Sci. Pract. 2020, 45, 102100. [Google Scholar] [CrossRef] [PubMed]
- Hamill, J.; van Emmerik, R.E.; Heiderscheit, B.C.; Li, L. A dynamical systems approach to lower extremity running injuries. Clin. Biomech. 1999, 14, 297–308. [Google Scholar] [CrossRef]
- Hamill, J.; Palmer, C.; Van Emmerik, R.E. Coordinative variability and overuse injury. Sports Med. Arthrosc. Rehabil. Ther. Technol. 2012, 4, 45. [Google Scholar] [CrossRef] [PubMed] [Green Version]
- Nordin, A.D.; Dufek, J.S. Reviewing the variability-overuse injury hypothesis: Does movement variability relate to landing injuries? Res. Q. Exerc. Sport 2019, 90, 190–205. [Google Scholar] [CrossRef] [PubMed]
- Harbourne, R.T.; Stergiou, N. Movement variability and the use of nonlinear tools: Principles to guide physical therapist practice. Phys. Ther. 2009, 89, 267–282. [Google Scholar] [CrossRef] [PubMed] [Green Version]
- Blandford, L.; Pedersen, C.; Mottram, S. Above and beyond biceps femoris. In Football Medicine Strategies Return to Play; Roi, G.S., Della Villa, S., Eds.; Isokinetic: London, UK, 2016; pp. 390–391. [Google Scholar]
- Roussel, N.A.; Nijs, J.; Mottram, S.; Van Moorsel, A.; Truijen, S.; Stassijns, G. Altered lumbopelvic movement control but not generalized joint hypermobility is associated with increased injury in dancers. A prospective study. Man. Ther. 2009, 14, 630–635. [Google Scholar] [CrossRef]
- Mottram, S.; Comerford, M. A new perspective on risk assessment. Phys. Ther. Sport 2008, 9, 40–51. [Google Scholar] [CrossRef]
- Mischiati, C.R.; Comerford, M.; Gosford, E.; Swart, J.; Ewings, S.; Botha, N.; Stokes, M.; Mottram, S.L. Intra and inter-rater reliability of screening for movement impairments: Movement control tests from the foundation matrix. J. Sports Sci. Med. 2015, 14, 427–440. [Google Scholar]
- Monnier, A.; Larsson, H.; Nero, H.; Djupsjöbacka, M.; Äng, B.O. A longitudinal observational study of back pain incidence, risk factors and occupational physical activity in Swedish marine trainees. BMJ Open 2019, 9, e025150. [Google Scholar] [CrossRef]
- Wójcik, M.; Siatkowski, I. The usefulness of performance matrix tests in locomotor system evaluation of girls attending a ballet school—Preliminary observation. J. Phys. Ther. Sci. 2014, 26, 41–44. [Google Scholar] [CrossRef] [Green Version]
- McNeill, W. The double knee swing test—A practical example of the performance matrix movement screen. J. Bodyw. Mov. Ther. 2014, 18, 477–481. [Google Scholar] [CrossRef] [PubMed]
- Chumanov, E.S.; Heiderscheit, B.C.; Thelen, D.G. The effect of speed and influence of individual muscles on hamstring mechanics during the swing phase of sprinting. J. Biomech. 2007, 40, 3555–3562. [Google Scholar] [CrossRef] [PubMed]
- Mendiguchia, J.; Castaño-Zambudio, A.; Jiménez-Reyes, P.; Morin, J.B.; Edouard, P.; Conceição, F.; Colyer, S.L. Can We Modify Maximal Speed Running Posture? Implications for Performance and Hamstring Injury Management. Int. J. Sports Physiol. Perform. 2021, 17, 374–383. [Google Scholar] [CrossRef]
- Mendiguchia, J.; Gonzalez De la Flor, A.; Mendez-Villanueva, A.; Morin, J.B.; Edouard, P.; Garrues, M.A. Training-induced changes in anterior pelvic tilt: Potential implications for hamstring strain injuries management. J. Sports Sci. 2021, 39, 760–767. [Google Scholar] [CrossRef] [PubMed]
- Schuermans, J.; Van Tiggelen, D.; Palmans, T.; Danneels, L.; Witvrouw, E. Deviating running kinematics and hamstring injury susceptibility in male soccer players: Cause or consequence? Gait Posture 2017, 57, 270–277. [Google Scholar] [CrossRef] [PubMed]
- Bagwell, J.J.; Snibbe, J.; Gerhardt, M.; Powers, C.M. Hip kinematics and kinetics in persons with and without cam femoroacetabular impingement during a deep squat task. Clin. Biomech. 2016, 31, 87–92. [Google Scholar] [CrossRef]
- Cannon, J.; Weber, A.E.; Park, S.; Mayer, E.N.; Powers, C.M. Pathomechanics underlying femoroacetabular impingement syndrome: Theoretical framework to inform clinical practice. Phys. Ther. 2020, 100, 788–797. [Google Scholar] [CrossRef]
- Lamontagne, M.; Kennedy, M.J.; Beaulé, P.E. The effect of cam FAI on hip and pelvic motion during maximum squat. Clin. Orthop. Relat. Res. 2009, 467, 645–650. [Google Scholar] [CrossRef] [Green Version]
- Whatman, C.; Hume, P.; Hing, W. The reliability and validity of physiotherapist visual rating of dynamic pelvis and knee alignment in young athletes. Phys. Ther. Sport 2013, 14, 168–174. [Google Scholar] [CrossRef]
- Perrott, M.A.; Pizzari, T.; Opar, M.S.; Cook, J. Athletes with a clinical rating of good and poor lumbopelvic stability have different kinematic variables during single leg squat and dip test. Physiother. Theory Pract. 2021, 37, 906–915. [Google Scholar] [CrossRef]
- Leardini, A.; Sawacha, Z.; Paolini, G.; Ingrosso, S.; Nativo, R.; Benedetti, M.G. A new anatomically based protocol for gait analysis in children. Gait Posture 2007, 26, 560–571. [Google Scholar] [CrossRef] [PubMed]
- Cappozzo, A.; Catani, F.; Della Croce, U.; Leardini, A. Position and orientation in space of bones during movement: Anatomical frame definition and determination. Clin. Biomech. 1995, 10, 171–178. [Google Scholar] [CrossRef]
- Baker, R. Pelvic angles: A mathematically rigorous definition which is consistent with a conventional clinical understanding of the terms. Gait Posture 2001, 13, 1–6. [Google Scholar] [CrossRef]
- Needham, R.; Naemi, R.; Chockalingam, N. Quantifying lumbar–pelvis coordination during gait using a modified vector coding technique. J. Biomech. 2014, 47, 1020–1026. [Google Scholar] [CrossRef] [PubMed]
- King, A.C.; Hannan, K.B. Segment coordination variability during double leg bodyweight squats at different tempos. Int. J. Sports Med. 2019, 40, 725–731. [Google Scholar] [CrossRef]
- Hamill, J.; Haddad, J.M.; McDermott, W.J. Issues in quantifying variability from a dynamical systems perspective. J. Appl. Biomech. 2000, 16, 407–418. [Google Scholar] [CrossRef] [Green Version]
- Sparrow, W.A.; Donovan, E.; Van Emmerik, R.; Barry, E.B. Using relative motion plots to measure changes in intra-limb and inter-limb coordination. J. Mot. Behav. 1987, 19, 115–129. [Google Scholar] [CrossRef]
- Heiderscheit, B.C.; Hamill, J.; van Emmerik, R.E. Variability of stride characteristics and joint coordination among individuals with unilateral patellofemoral pain. J. Appl. Biomech. 2002, 18, 110–121. [Google Scholar] [CrossRef]
- Fisher, N.I. Statistical Analysis of Circular Data; Cambridge University Press: Cambridge, UK, 1995; pp. 30–35. [Google Scholar]
- Needham, R.A.; Naemi, R.; Chockalingam, N. A new coordination pattern classification to assess gait kinematics when utilising a modified vector coding technique. J. Biomech. 2015, 48, 3506–3511. [Google Scholar] [CrossRef]
- Biggs, D.; De Ville, B.; Suen, E. A method of choosing multiway partitions for classification and decision trees. J. Appl. Stat. 1991, 18, 49–62. [Google Scholar] [CrossRef]
- Kass, G.V. An exploratory technique for investigating large quantities of categorical data. J. R. Stat. Soc. Ser. C Appl. Stat. 1980, 29, 119–127. [Google Scholar] [CrossRef]
- Lin, C.L.; Fan, C.L. Evaluation of CART, CHAID, and QUEST algorithms: A case study of construction defects in Taiwan. J. Asian Archit. Build. 2019, 18, 539–553. [Google Scholar] [CrossRef] [Green Version]
- James, G.; Witten, D.; Hastie, T.; Tibshirani, R. An Introduction to Statistical Learning; Springer: Berlin, Germany, 2013; p. 183. [Google Scholar]
- McNeill, W.; Blandford, L. Movement health. J. Bodyw. Mov. Ther. 2015, 19, 150–159. [Google Scholar] [CrossRef] [Green Version]
- Khuu, A.; Lewis, C.L. Position of the non-stance leg during the single leg squat affects females and males differently. Hum. Mov. Sci. 2019, 67, 102506. [Google Scholar] [CrossRef] [PubMed]
- Vasiljevic, D.; Salsich, G.B.; Snozek, D.; Aubin, B.; Foster, S.N.; Mueller, M.J.; Clohisy, J.C.; Harris-Hayes, M. Three-dimensional kinematics of visually classified lower extremity movement patterns during a single leg squat among people with chronic hip joint pain. Physiother. Theory Pract. 2020, 36, 598–606. [Google Scholar] [CrossRef]
- Bernstein, N.A. The Co-Ordination and Regulation of Movements; Pergamon Press: Oxford, UK, 1967; pp. 15–59. [Google Scholar]
- Guccione, A.A.; Neville, B.T.; George, S.Z. Optimization of movement: A dynamical systems approach to movement systems as emergent phenomena. Phys. Ther. 2019, 99, 3–9. [Google Scholar] [CrossRef]
- van Emmerik, R.E.; Ducharme, S.W.; Amado, A.C.; Hamill, J. Comparing dynamical systems concepts and techniques for biomechanical analysis. J. Sport Health Sci. 2016, 5, 3–13. [Google Scholar] [CrossRef]
- Maddox, E.; Sievert, Z.A.; Bennett, H.J. Modified vector coding analysis of trunk and lower extremity kinematics during maximum and sub-maximum back squats. J. Biomech. 2020, 106, 109830. [Google Scholar] [CrossRef]
- Takabayashi, T.; Edama, M.; Inai, T.; Kubo, M. Gender differences in coordination variability between shank and rearfoot during running. Hum. Mov. Sci. 2019, 66, 91–97. [Google Scholar] [CrossRef]
- Arutyunyan, G.A.; Gurfinkel, V.S.; Mirskii, M.L. Investigation of aiming at a target. Biofizika 1968, 13, 536–538. [Google Scholar]
- Verrel, J.; Pologe, S.; Manselle, W.; Lindenberger, U.; Woollacott, M. Coordination of degrees of freedom and stabilization of task variables in a complex motor skill: Expertise-related differences in cello bowing. Exp. Brain Res. 2013, 224, 323–334. [Google Scholar] [CrossRef] [PubMed] [Green Version]
- DiCesare, C.A.; Montalvo, A.; Foss, K.D.B.; Thomas, S.M.; Hewett, T.E.; Jayanthi, N.A.; Myer, G.D. Sport Specialization and Coordination Differences in Multisport Adolescent Female Basketball, Soccer, and Volleyball Athletes. J. Athl. Train. 2019, 54, 1105–1114. [Google Scholar] [CrossRef] [PubMed] [Green Version]
- Baida, S.R.; Gore, S.J.; Franklyn-Miller, A.D.; Moran, K.A. Does the amount of lower extremity movement variability differ between injured and uninjured populations? A systematic review. Scand. J. Med. Sci. Sports 2018, 28, 1320–1338. [Google Scholar] [CrossRef] [PubMed]
- Desai, G.A.; Gruber, A.H. Segment coordination and variability among prospectively injured and uninjured runners. J. Sports Sci. 2021, 39, 38–47. [Google Scholar] [CrossRef]
- Stergiou, N.; Harbourne, R.T.; Cavanaugh, J.T. Optimal movement variability: A new theoretical perspective for neurologic physical therapy. J. Neurol. Phys. Ther. 2006, 30, 120–129. [Google Scholar] [CrossRef] [Green Version]


| Segment and Joint Rotations (Degrees) | Pass (n = 12) | Fail (n = 12) | Mean Difference (95% CI) |
|---|---|---|---|
| Knee flexion at termination of descent phase (ii) | 60.84 (6.31) | 63.14 (7.18) | 2.33 (−0.7–5.3) |
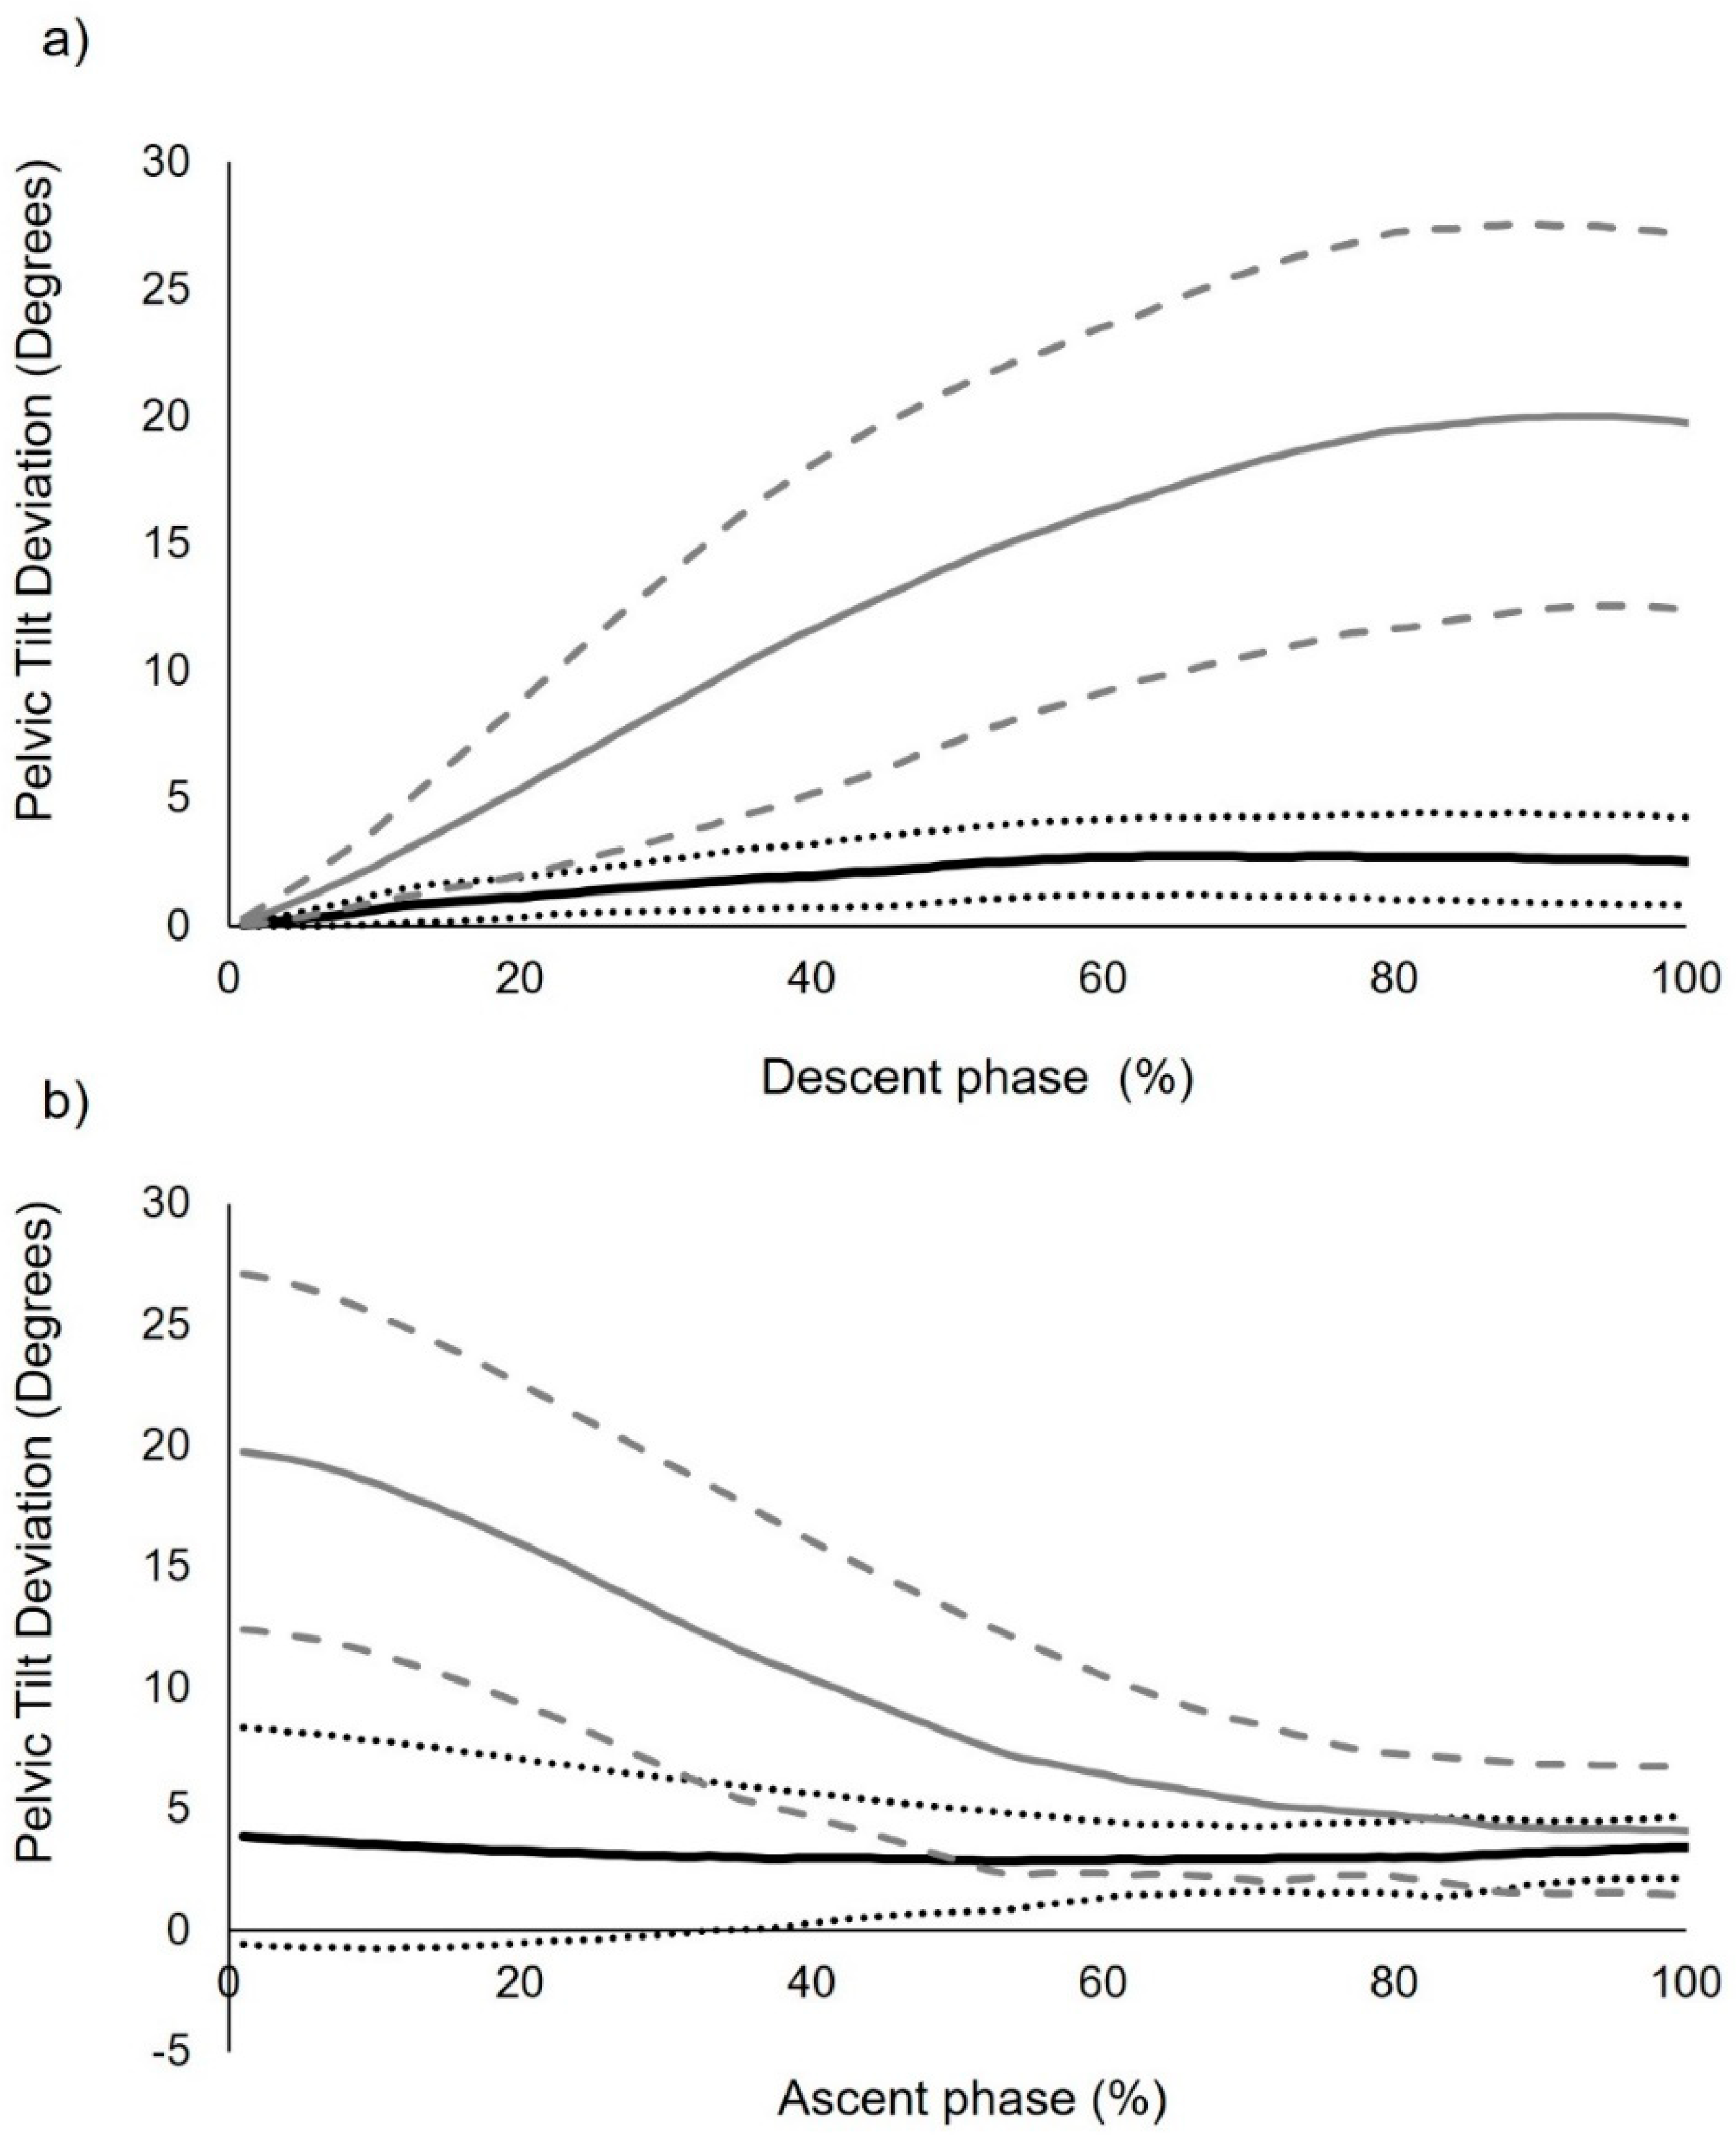
| Pelvic deviation (iii) | 4.08 (1.40) | 19.95 ** (6.48) | 15.87 (11.9–19.8) |
| Knee flexion at termination of ascent phase (iv) | 3.04 (5.01) | 3.10 (4.39) | 0.05 (−2.0–2.1) |
Publisher’s Note: MDPI stays neutral with regard to jurisdictional claims in published maps and institutional affiliations. |
© 2022 by the authors. Licensee MDPI, Basel, Switzerland. This article is an open access article distributed under the terms and conditions of the Creative Commons Attribution (CC BY) license (https://creativecommons.org/licenses/by/4.0/).
Share and Cite
Blandford, L.; Cushion, E.; Mahaffey, R. Segmental and Intersegmental Coordination Characteristics of a Cognitive Movement Control Test: Quantifying Loss of Movement Choices. Biomechanics 2022, 2, 213-234. https://doi.org/10.3390/biomechanics2020018
Blandford L, Cushion E, Mahaffey R. Segmental and Intersegmental Coordination Characteristics of a Cognitive Movement Control Test: Quantifying Loss of Movement Choices. Biomechanics. 2022; 2(2):213-234. https://doi.org/10.3390/biomechanics2020018
Chicago/Turabian StyleBlandford, Lincoln, Emily Cushion, and Ryan Mahaffey. 2022. "Segmental and Intersegmental Coordination Characteristics of a Cognitive Movement Control Test: Quantifying Loss of Movement Choices" Biomechanics 2, no. 2: 213-234. https://doi.org/10.3390/biomechanics2020018
APA StyleBlandford, L., Cushion, E., & Mahaffey, R. (2022). Segmental and Intersegmental Coordination Characteristics of a Cognitive Movement Control Test: Quantifying Loss of Movement Choices. Biomechanics, 2(2), 213-234. https://doi.org/10.3390/biomechanics2020018