Abstract
The purpose of this study was to assess the relationship between work rate, stroke metrics, and performance in whitewater slalom. Twelve Spanish, nationally competitive whitewater slalom kayakers took part in a simulated competition while using an instrumented kayak paddle to record stroke metrics over a simulated race, total duration and sectional splits. Performance time was highly correlated to overall power output (r2 = 0.511, p < 0.001), where kayakers demonstrated a positive pacing strategy with power output significantly decreasing over successive sectional splits (158 ± 40, 112 ± 32 and 65 ± 33 W, p < 0.001). This resulted in an increased stroke duration (p < 0.001), time to peak force (p < 0.001), a decrease in stroke peak force (p < 0.001), and rate of peak force development (p < 0.001) over elapsed time. As such, work rate is deemed an objective metric to monitor performance, prescribe training, and ascertain optimal pacing strategies in canoe slalom.
1. Introduction
Whitewater slalom is technically demanding [1], where athletes negotiate a predetermined course of 18–25 gates suspended above a whitewater river. Competition duration ranges from 75–95 s, where physiological demands in flatwater and whitewater slalom reflect a 32–50% anaerobic and 50–68% aerobic contribution to work [2,3]. Such holistic analysis provides no detail regarding the objective physical requirements of the sport in relation to work rate, pacing strategy and stroke metrics. Such information could be important for developmental monitoring, and training prescription.
Initial studies into stroke metrics [4,5] have investigated force production and stroke capability using tethered systems and extrapolation of linear-flatwater paddling data to competitive performances. Subsequently, the development of a commercially available, instrumented kayak paddle shaft [6] identified very strong relationships between straight line (r2 = 0.982) and slalom specific velocity (r2 = 0.993). Importantly, the authors [6] identified that during straight line paddling, stroke rate was instrumental for increases in power, whereas stroke peak force and impulse increased by ~5% and stroke rate decreased by ~5% at the same work rate during slalom specific movement. Later work [7] reported mean power outputs of 204 ± 45 W with a positive pacing (work-rate) strategy in a NZ team of athletes. In this cohort, frequency analysis of stroke categorisation into propulsive and steering/driving identified a 94:6% split, respectively. The only significant relationships between performance and stroke metrics were between peak force and the rate of peak force development, where the inability to maintain work rate led to decreases in both. The authors postulated that whitewater would lead to a greater emphasis on technique, forcing participants to change to a more conservative pacing strategy to prevent technical mistakes. However, the case study report of a world class athlete during competition [8] shows a supramaximal effort during the first 10 s followed by a much more variable work rate than flatwater power profiles. Additionally, stroke metrics showed no correlation with elapsed time, unlike the flatwater simulation, meaning the athlete adopted a more even paced strategy. What is not known is whether the strategy of this individual athlete was due to the whitewater environment or their personal-optimal strategy. Understanding how work rate and stroke metrics relate to overall performance amongst a group of competitive athletes in relation to strategy could provide useful data to athletes and coaches.
Therefore, the aim of this study was to assess the relationship between work rate, stroke metrics, and performance amongst nationally ranked Spanish whitewater slalom kayakers.
It is hypothesized that work rate will be negatively correlated to performance time, athletes will adopt a more even paced strategy that will result in a decreased peak force and rate of peak force development per stroke over elapsed time.
2. Methods
2.1. Participants
Twelve Spanish, nationally competitive, Canoe Whitewater Slalom kayak athletes (age 19 ± 3 years., height 1.73 ± 0.04 m, body weight 71.0 ± 10.0 kg, sitting height 0.89 ± 0.02 m, arm span 1.79 ± 0.06 m), with 9 ± 3 years. slalom experience (6 ± 4 years. at a national level), 16-d out from their national championships were recruited for this study. The University Research Ethics Committee approved this study, and prior to their involvement, all participants provided written informed consent in accordance with the requirements of the Declaration of Helsinki.
2.2. Testing
Participants were instructed on the race format, schedule, and the course of gates to be negotiated (Figure 1) 24 h prior to the race simulation, which included one competition run with no prior practise of the racecourse. However, participants were all familiar with the river as it is their local training facility and conditions were equal for all competitors. There was no interference from the researchers in the athlete’s preparation, but participants were asked to prepare, as per national whitewater slalom races held in Spain, and to mentally plan their route and race strategy, as is typical in whitewater slalom [9].
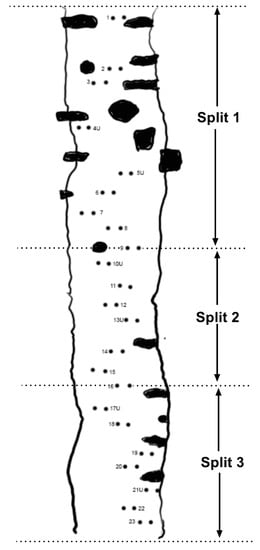
Figure 1.
Pictorial presentation of the racecourse where the two parallel lines represent the riverbanks, solid objects within the river are natural obstacles such as rocks, and with gates numbered 1–23. Numbers with a “U” signify an upstream gate. Split 1 starts at the start line and finishes at gate 9, split starts from gate 9 and finishes at gate 16 and split 3 starts at gate 16 and finishes at the finish line.
The racecourse was designed by a level 3 certified Olympic whitewater slalom coach and consisted of twenty-three gates (Figure 1), including seventeen downstream gates and six upstream gates, as per the International Canoe Federation rules [10]. The course was divided into three sections of equal technical/physical challenges, as determined by the course designer for split-time, inter-athlete performance analysis purposes. Splits occurred from: 1. start-9; 2. 9–16; 3. 16-finish (Figure 1).
On arrival at the venue (San Miguel Slalom Course, Bidasoa River, Irun, Spain), all participants were weighed (kg) without kayak clothing, measured standing (m) and sitting height (m), and arm span (m).
All participants used their own kayaks in conjunction with an instrumented kayak paddle powermeter (v2.1, One Giant Leap, Gisborne, New Zealand), with X-16 medium paddle blades (Raab, Jablonec nad Nisou, Czech Republic). All participants were familiar with the use of the shaft and blades used within this study from own personal use, previous testing on at least one occasion and during the warm-up period. The paddle shaft allows for length and blade angle adjustment to match the participants usual dimensions while the strain gauge placement is far enough apart to allow for inter-participant variations in hand positions and marked with tape on the shaft to enable easy identification for the participant. Paddle length, blade angle, and hand position measurement data were inputted into the shaft’s onboard processor via the One Giant Leap web app (https://app.onegiantleap.co.nz/ (accessed on 11 November 2021)) prior to each participant’s trial.
The kayak power meter logs force measured by 12 load sensors located and offset around the circumference of the shaft at 4 different positions, on either side of the hand grip placement (Figure 2). This enables direct measurement of hand force on the paddle shaft over 360° independent of blade pressure distribution and requires no assumption of the centre of pressure of the blade. Each shaft is fitted with an on-board inertial measuring unit that records hand acceleration and rotational velocity, and the use of a commercially sensitive algorithm enables the calculation of power output (work rate), combining data from the pushing and pulling hand, within a stationary frame and from kinetic energy transferred to the paddle at 100 Hz. Validation data of the strain gauges under static conditions were found to be between 0.12–1.40% accurate, with a coefficient of variation between 0.12–1.48% [6]. In the field under a real-world setting, the kayak powermeter presented a cubic relationship for power as a function of velocity during straight-line paddling (r2 = 0.982) and slalom specific testing (r2 = 0.993) [6].

Figure 2.
Pictorial image of the slalom kayak paddle powermeter with strain gauges and inertial measurement units (IMU) indicated. Strain gauges are located between carbon fibre layers and the IMU’s are in within the shaft.
Logged data is transferred to a standard personal computer as a csv.file and processed using MATLAB R2018b. On a stroke by stroke basis, stroke metric data were analysed [6] including:
- (a)
- Stroke duration (s), defined as the time taken from data onset (when the drive side blade triggers a force threshold >2 N and is a >20 number points from the end of the previous stroke) to data offset (when drive side blade triggers a force threshold <2 N). Stroke duration was subsequently used to characterise stroke as propulsive (<0.6 s) and driving/steering (>0.6 s) [2], Figure 3A–D. Propulsive stroke are forward paddling strokes (Figure 3A) that keep the boat moving, whereas driving/steering strokes help the boat to move after stopping and steering strokes are used to turn the boat, including forward sweep strokes (Figure 3B), bow rudders or draw strokes (Figure 3C), and reverse sweep strokes (Figure 3D);
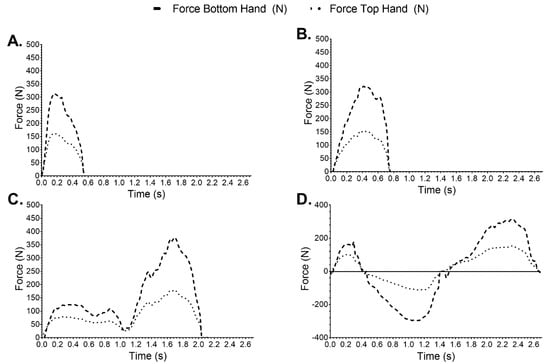 Figure 3. Force-time profile for four basic strokes used in whitewater slalom. Where (A) is a propulsive forwards stroke, (B) is a steering/driving forwards sweep stroke, (C) is a steering/driving draw stroke, and (D) is a steering/driving reverse stroke.
 - (b)
- Impulse (N∙s)—the area under the force curve per stroke.
- (c)
- Peak force (N)—the maximum force reached during each stroke.
- (d)
- Time (s) to peak force from stroke onset.
- (e)
- The rate of peak force development (N∙s−1).
Competition runs were manually timed (Kalenji Onstart 310, Decathlon, France) with video playback verification.
2.3. Statistical Analysis
Performance time and work rate data were checked for normal distribution via D’Agostino-Pearson’s omnibus normality test (K2, p-value). Descriptive data including mean ± SD (95% CI) was used to describe dependent variables logged within the race runs. The relationship between overall performance time, work rate, and specific sectional splits were analysed using linear regression statistics. Spearman’s correlation was used to determine the relationship between competition rank and stroke metrics (stroke duration, impulse, peak force, time to peak force, rate of peak force development). Additionally, sectional split data differences were analysed using One-Way repeated ANOVA (F-value, p-value) with Tukey’s post hoc testing; 95% CI difference reported when applicable. Due to the small subject group used, effect size (ES) was also calculated to help detect any difference not detected by the significance testing; the effect size was reported and classified.
3. Results
Performance times for all participants expressed as mean ± SD (range) were 88.6 ± 4.55 s (77.94–95.66 s, Figure 4) and were normally distributed (K2 = 3.928, p = 0.140). All sectional split time (s) were significantly related (p < 0.05) to overall performance time, where greater significance was found for sectional split 3 (r2 = 0.814, p < 0.001) and split 2 (r2 = 0.763, p < 0.001) compared to split 1 (r2 = 0.453, p = 0.023), Figure 4.
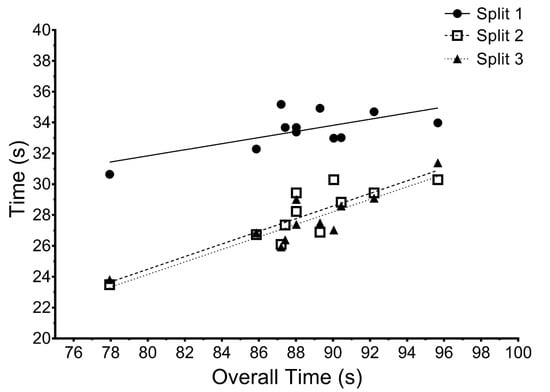
Figure 4.
The relationship between sectional split times and overall performance time (s).
An example of raw data collection for forces and power outputs is provided (Figure 5A–C) for participant ranked No. 1 in the simulated race.
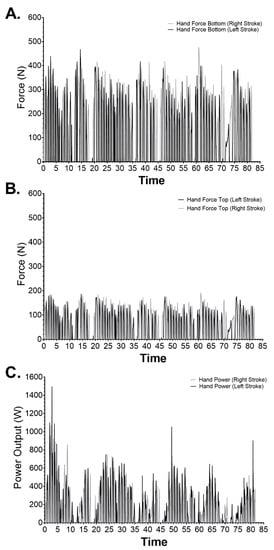
Figure 5.
Exemplar raw data for the fastest participant in the simulated race for (A) Bottom hand forces per left and right stroke, (B) Top hand forces per left and right strokes, and (C) Power output per left and right strokes.
Overall, mean work rate data expressed as power output were 115.4 ± 31.8W (95.2–135.6) and were normally distributed (K2 = 3.928, p = 0.1403), while power: weight ratio was 1.65 ± 0.45 W∙kg−1 (1.36–1.93) and normally distributed (K2 = 1.467, p = 0.4802). Overall individual participant data is presented in Figure 6A,B. Linear regression for this group indicates a significant relationship between overall performance time (s) and mean power output (r2 = 0.511, p < 0.01, Figure 6A), and overall performance time (s) and power: weight ratio (r2 = 0.458, p < 0.02, Figure 6B).
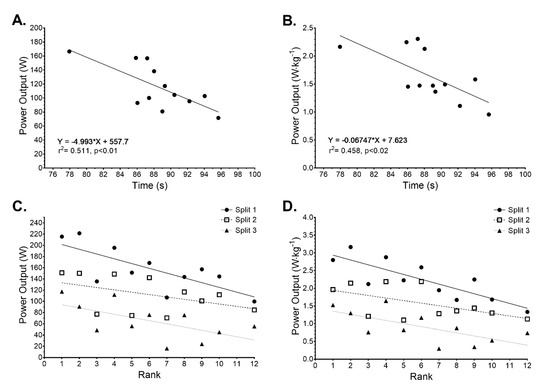
Figure 6.
The relationship between (A) Overall mean power output (W) and overall performance time (s), (B) power: weight ratio (W∙kg−1) and overall performance time (s). Sectional split data for (C) individual absolute power output (W) and rank, and (D) individual relative power output per kg of body mass (W∙kg−1) and rank.
Sectional split data highlighted significant overall differences in mean power outputs (158.2 ± 39.7, 111.7 ± 32.2, and 65.1 ± 32.7 W, F(1.792, 17.92) = 102.2, p < 0.001) with significant (p < 0.001) post hoc multiple comparisons for split 1 vs. split 2 (effect size = 1.28 (large), mean difference = 46.5W, 95% CI = 29.6–63.3 W), split 1 vs. split 3 (effect size = 2.56 (very large), mean difference = 93.0 W, 95% CI = 72.4–113.6 W), and split 2 vs. split 3 (effect size = 1.43 (large), mean difference = 46.6 W, 95% CI = 30.9–62.3 W).
There were also significant overall mean relative power output differences between sectional splits (2.24 ± 0.57, 1.57 ± 0.45, and 0.91 ± 0.45 W∙kg−1, F(1.687, 16.87) = 86.55, p < 0.001) with significant (p < 0.001) post hoc multiple comparisons for split 1 vs. split 2 (effect size = 1.31 (large), mean difference = 0.67 W∙kg−1, 95% CI = 0.42–0.92 W∙kg−1), split 1 vs. split 3 (effect size = 2.59 (very large), mean difference = 1.33 W∙kg−1, 95% CI = 1.00–1.66 W∙kg−1), and split 2 vs. split 3 (effect size = 1.47 (large), mean difference = 0.66 W∙kg−1, 95% CI = 0.43–0.90 W∙kg−1).
Linear regression of work rate suggests a significant relationship between absolute power output and overall performance time (Figure 6C), where split 1 (r2 = −0.562, p = 0.008) and split 3 (r2 = −0.384, p = 0.042) were significantly related to overall performance, but not split 2 (r2 = −0.303, p = 0.079). Similarly, the relationship between power: weight ratio and performance (Figure 6D) were significant for split 1 (r2 = −0.536, p = 0.010) and split 3 (r2 = 0.378, p = 0.044), but not for split 2 (r2 = −0.325, p = 0.067).
Mean ± SD (95% CI) total stroke count was 120 ± 15 (110–129), with 106 ± 14 (97–115) propulsive strokes and 14 ± 16 (10–18) steering strokes. There were no correlations between stroke counts for total strokes (r = −0.09, 95% CI = −0.64–0.52), propulsive strokes (r = 0.12, 95% CI = −0.50–0.66) or steering strokes (r = −0.03, 95% CI = −0.61–0.57) and performance. Individual data is presented in Figure 7.
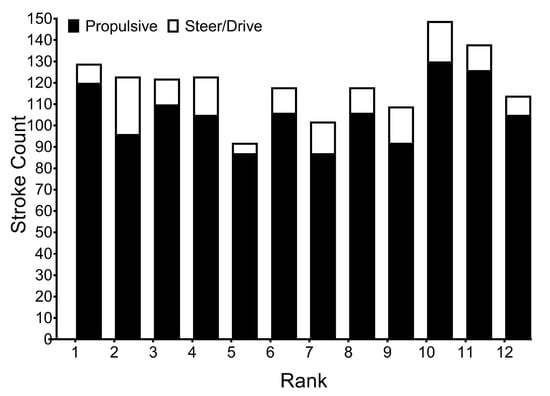
Figure 7.
Individual participants race run rank and total stroke count, categorised as propulsive (<0.6 s) and steering/driving (>0.6 s).
Individual mean stroke metric data (stroke duration, impulse, peak force, time to peak force, rate of peak force development) are presented in Table 1, along with the mean, standard deviation, and 95% CI for the cohort. There were no relationships between performance rank and any overall stroke metric presented (Table 1).

Table 1.
Individual participants race rank, mean stroke metrics, plus the overall mean, SD, 95% CI, and Spearman’s correlation.
Further analysis of stroke metrics over each sectional split presented an overall significant effect for stroke length (F(2, 148) = 11.55, p < 0.001, Figure 8A), with significant post hoc increases in stroke duration between splits 1–3 (p < 0.001, effect size = 3.568 (very large), 95% CI of difference −0.111–0.034 s) and 2–3 (p < 0.001, effect size = 0.183 (trivial), 95% CI of difference −0.102–−0.022 s), but not splits 1–2 (p = 0.809, effect size = 0.162 (trivial), 95% CI of difference −0.050–0.029 s). There was a significant overall effect of sectional split on stroke peak force (F(2, 148) = 23.94, p < 0.001, Figure 8B) with significant post hoc decreases in stroke peak force between splits 1–3 (p < 0.001, effect size = 1.22 (large), 95% CI of difference 35.1–74.6 N) and splits 2–3 (p < 0.001, effect size = 0.971 (moderate), 95% CI of difference 23.4–64.4 N), but not splits 1–2 (p = 0.413, effect size = 0.293 (small), 95% CI of difference −9.43–31.3 N). A significant overall effect of sectional split on time to peak force (F(2, 143) = 12.77, p < 0.001, Figure 8C) with significant post hoc increase in time to peak force between splits 1–3 (p < 0.001, effect size = 0.819 (moderate), 95% CI of difference −0.065–−0.020 s) and splits 2–3 (p < 0.001, effect size = 1.099 (moderate), 95% CI of difference −0.067–−0.020 s), but not splits 1–2 (p = 0.993, effect size = 0.024 (trivial), 95% CI of difference −0.022–0.024 s). A significant overall effect of sectional split on rate of peak force development (F(2, 143) = 18.23, p < 0.001, Figure 8D) with significant post hoc decreases between splits 1–3 (p < 0.001, effect size = 1.212 (large), 95% CI of difference 309–716 N∙s−1) and splits 2–3 (p < 0.001, effect size = 0.827 (moderate), 95% CI of difference 136–587 N∙s−1), but not splits 1–2 (p = 0.137, effect size = 0.373 (small), 95% CI of difference 39–371 N∙s−1). There was no overall effect of sectional split on impulse (F(2, 143) = 0.170, p = 0.844) and where effect size comparisons were trivial.
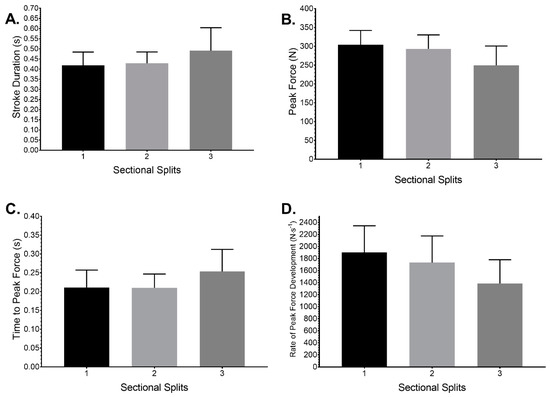
Figure 8.
Comparison of mean ± SD (A) Stroke duration (s), (B) Stroke Peak force (N), (C) Time to peak force (s), and (D) Rate of peak force development for each sectional split.
4. Discussion
This investigation set out to assess the relationship between work rate, stroke metrics, and performance in a simulated whitewater slalom competition. In agreement with the hypothesis, the main findings show that performance is highly correlated to work rate but not stroke metrics. The hypothesis that participants would adopt an even paced strategy was rejected as all participants used a positive pacing strategy where power output significantly decreased over successive sectional splits. This led to an increase in stroke duration, decreases in stroke peak force, increased time to stroke peak force, and a decrease in stroke rate of peak force development, respectively.
The work rate during the whitewater slalom competition was considerably less (115 ± 32 W) than previously reported for flatwater slalom simulations (204 ± 45 W) [7]. This could be attributed to physical capability differences between groups, but is more likely explained by the greater emphasis on optimal timing requirements for strokes, in relation to boat positioning, and water dynamics during whitewater paddling [8]. It had been postulated [2] that a whitewater environment would likely result in a lower stroke rate, with greater emphasis on longer strokes, greater impulse, but lower rates of peak force development relative to power output compared to flatwater. The current data set (Table 1) supports this hypothesis, where greater overall stroke impulse, peak force, and rate of peak force development relative to power output were observed compared to flatwater studies [2,6]. While unsubstantiated, pulling against the flow combined with boat movement/speed within the whitewater likely alters resistance to blade movement and, thus, alters kinetic variables. This requires further research with more participants and greater ranges of ability on a variety of courses with differing technical demands.
Even with water technicality and the possible effects on work rate, the data (Figure 6A,B) highlight significant and strong correlations between both absolute and relative power output, and overall performance. The relationship identified between absolute power and performance is akin to linear-motion sports, where resistive forces have been controlled, and velocity, performance, and power output are all related [11]. In this study, the best athletes had the greatest work rate, regardless and inclusive of body weight, meaning they can sufficiently overcome external resistive forces acting against the boat or paddle [12]. This is an important finding, meaning power output can be used objectively to quantify training intensities and monitor competition performance rather than outcome, while providing a means to monitor long-term athlete development.
Unlike in flatwater sprinters [13], and whitewater slalom athletes performing flatwater linear sprints [5,6], the relationship between power output and performance for whitewater slalom in this study did not translate to significant relationships between overall mean stroke metrics and performance in this group (Table 1). This could be explained by that whitewater slalom participants can take different routes due to technical and/or physical ability, individual preference, or chance [14,15], where not all strokes are used to propel the boat to the finish line. Rather, an athlete may use a high force stroke as a correctional/holding stroke [8]; this does not increase performance, but does prevent performance catastrophe. Figure 7 highlights the non-related range in total number of strokes, and those classified as propulsive or steering strokes [7] used by participants. The percentage of strokes classified steering in this data set (12%) was double that reported for flatwater slalom [7] and supports the aforementioned change in demands from flatwater to whitewater slalom. However, such a classification [2] does not take into account individual differences in stroke characteristics. While likely capturing the main differences between key turning and propulsive strokes, this method of characterising strokes may be less useful differentiating between propulsive strokes and strokes, such as the forwards sweep stroke (Figure 3A,B) in the 0.5–0.6 s range.
Traditionally, whitewater slalom coach-athletes break competition runs into splits for time motion analysis [15]. To our knowledge, there is no published data comparing the different sectional splits with overall performance. Figure 4 highlights the relationship within this group of participants and indicates that performance in all splits is important, and where successive splits become increasingly important to overall performance.
Participant power outputs over the same sectional splits successively decrease for all participants (Figure 6C,D), indicating that a positive pacing strategy (work rate based) is favoured by whitewater slalom athletes, as previously shown in flatwater slalom competition simulations [7]. Such a strategy is typical of linear-motion sports of similar duration, including flatwater (500 m) kayakers [16] and 800 m runners [17]. It is interesting that whitewater slalom paddlers would adopt such a strategy that could limit technical capability and increase the chance of time penalty infringements and technical mistakes because of fatigue. The relationship between sectional split power output (Figure 6C,D) and overall performance does not mirror the strong relationships of overall performance and split performance time (Figure 4). In Figure 6C,D, the relationship between overall performance and split 1 is as expected due to the initial flatwater sprint, but those between split 2–3 suggest that something other than power output over the short duration of splits is affecting the relationship. This is likely the influence of a pacing strategy, resulting in fatigue and the ensuing decline in both physical and cognitive skills (technical capability) under fatigue. Theoretically, a paddler may fatigue at a greater rate, but their overall boat positioning/efficiency is impeded less, and as such, they perform at a better level for similar power output scores to other athletes. This is important and implies that understanding individual capabilities is vital to choosing optimal pacing, facilitating a more efficient trajectory throughout the course, and avoiding possible timely technical mistakes.
While the performance outcome of technique in slalom relates to boat trajectory and speed (not reported here), stroke metrics are part of the technical process. Data analysed in relation to elapsed time support the findings of flatwater slalom [2], where stroke duration increased, peak force decreased, time to peak force increased, and rate of peak force development decreased (Figure 8) when paddlers fatigued with elapsed time, as with this cohort, for this race simulation. These changes could be explained via reduced muscle capability at a cellular [18] and neuromuscular level [19], where participants become more reliant on high intensity aerobic respiration [2] and a reduced cognitive capability [20]. This is reflected in the power profiles (Figure 6C,D), where power output decreases in successive splits for all participants.
5. Limitations
While this is a novel data set within the sport of canoe slalom, the use of a one-off simulated race on one natural river, as presented, limits the usefulness to the wider slalom community, competing at numerous races on different rivers or courses at different levels, river grades and within different classes (K1 men, K1 women, C1 Men, C1 women, plus juniors). Additionally, data analysis as presented within this paper, combined with greater understanding regarding linear kinematics within the race (s), regarding athlete capability through on-water specific performance-physiological testing, would lead to a more powerful data set.
6. Conclusions
The results of the present study indicate that whitewater slalom performance is highly correlated to power output for participants within this study. A positive pacing strategy, highly intermittent in nature, was exercised, where performance time in successive sectional splits is increasingly more important. The ensuing fatigue or decline in physical capability resulted in an increase in both stroke duration and time to peak force per stroke with consequential decreases in peak force and its rate of development over the competition period. Further research to identify the relationships between performer capability, pacing strategy, fatigue, and performance is required.
Author Contributions
Conceptualization, P.W.M. and T.O.; methodology, P.W.M. and T.O.; software, P.W.M. and T.O.; validation, P.W.M.; formal analysis, P.W.M. and T.O.; data curation, P.W.M.; writing—original draft preparation, P.W.M.; writing—P.W.M.; supervision, P.W.M. All authors have read and agreed to the published version of the manuscript.
Funding
This research received no external funding.
Institutional Review Board Statement
The study was conducted in accordance with the Declaration of Helsinki, and approved by the Ethics Committee of Massey University (ID 4000020887).
Informed Consent Statement
Informed consent was obtained from all subjects involved in the study.
Data Availability Statement
Not applicable.
Conflicts of Interest
The authors declare no conflict of interest.
References
- Nibali, M.; Hopkins, W.G.; Drinkwater, E. Variability and predictability of elite competitive slalom canoe-kayak performance. Eur. J. Sport Sci. 2011, 11, 125–130. [Google Scholar] [CrossRef]
- Macdermid, P.W.; Osborne, A.; Stannard, S.R. Mechanical Work and Physiological Responses to Simulated Flat Water Slalom Kayaking. Front. Physiol. 2019, 10, 260. [Google Scholar] [CrossRef] [PubMed]
- Zamparo, P.; Tomadini, S.; Didone, F.; Grazzina, F.; Rejc, E.; Capelli, C. Bioenergetics of a slalom kayak (K1) competition. Int. J. Sports Med. 2006, 27, 546–552. [Google Scholar] [CrossRef] [PubMed]
- Manchado-Gobatto, F.B.; Vieira, N.A.; Messias, L.D.; Ferrari, H.G.; Borin, J.P.; de Carvalho Andrade, V.; Terezani, D.R. Anaerobic threshold and critical velocity parameters determined by specific tests of canoe slalom: Effects of monitored training. Sci. Sports 2014, 29, e55–e58. [Google Scholar] [CrossRef]
- Messias, L.H.D.; Ferrari, H.G.; Sousa, F.A.B.; Dos Reis, I.G.M.; Serra, C.C.S.; Gobatto, C.A.; Manchado-Gobatto, F.B. All-out Test in Tethered Canoe System can Determine Anaerobic Parameters of Elite Kayakers. Int. J. Sports Med. 2015, 94, 803–808. [Google Scholar] [CrossRef] [PubMed] [Green Version]
- Macdermid, P.W.; Fink, P.W. The Validation of a Paddle Power Meter for Slalom Kayaking. Sports Med. Int. Open 2017, 1, E50–E57. [Google Scholar] [CrossRef] [PubMed] [Green Version]
- Macdermid, P.; Osbourne, A.; Stannard, S. Protocol for study titled: Mechanical and physiological responses to slalom kayaking.mp4. figshare. Media. 2018. Available online: https://figshare.com/articles/media/Protocol_for_study_titled_Mechanical_and_physiological_responses_to_slalom_kayaking_mp4/7376783/1 (accessed on 18 January 2022). [CrossRef]
- Macdermid, P.W.; Gilbert, C.; Jayes, J. Using a kayak paddle power-meter in the sport of whitewater slalom. J. Hum. Sport Exerc. 2019, 15. [Google Scholar] [CrossRef]
- MacIntyre, T.E.; Moran, A.P. A qualitative investigation of imagery use and meta-imagery processes among elite canoe-slalom competitors. J. Imag. Res. Sport Phys. Act. 2007, 2, 3. [Google Scholar] [CrossRef]
- ICF. Slalom Competition Rules. 2019. Available online: https://www.canoeicf.com/sites/default/files/rules_canoe_slalom_2019.pdf (accessed on 18 January 2022).
- Atkinson, G.; Peacock, O.; Gibson, A.S.C.; Tucker, R. Distribution of power output during cycling: Impact and mechanisms. Sports Med. 2007, 37, 647–667. [Google Scholar] [CrossRef] [PubMed]
- Michael, J.S.; Smith, R.; Rooney, K.B. Determinants of kayak paddling performance. Sports Biomech. 2009, 8, 167–179. [Google Scholar] [CrossRef] [PubMed]
- Kong, P.W.; Tay, C.S.; Pan, J.W. Application of Instrumented Paddles in Measuring On-Water Kinetics of Front and Back Paddlers in K2 Sprint Kayaking Crews of Various Ability Levels. Sensors 2020, 20, 6317. [Google Scholar] [CrossRef] [PubMed]
- Hunter, A. Canoe slalom boat trajectory while negotiating an upstream gate. Sports Biomech. 2009, 8, 105–113. [Google Scholar] [CrossRef] [PubMed]
- Hunter, A.; Cochrane, J.; Sachlikidis, A. Canoe slalom competition analysis. Sports Biomech. 2008, 7, 24–37. [Google Scholar] [CrossRef] [PubMed]
- Goreham, J.A.; Landry, S.C.; Kozey, J.W.; Smith, B.; Ladouceur, M. Using principal component analysis to investigate pacing strategies in elite international canoe kayak sprint races. Sports Biomech. 2020, 26, 1–16. [Google Scholar] [CrossRef] [PubMed]
- Hettinga, F.J.; Edwards, A.M.; Hanley, B. The science behind competition and winning in athletics: Using world-level competition data to explore pacing and tactics. Front. Sports Active Living 2019, 1, 11. [Google Scholar] [CrossRef] [PubMed] [Green Version]
- Enoka, R.M.; Duchateau, J. Muscle fatigue: What, why and how it influences muscle function. J. Physiol. 2008, 586, 11–23. [Google Scholar] [CrossRef]
- Forestier, N.; Nougier, V. The effects of muscular fatigue on the coordination of a multijoint movement in human. Neurosci. Lett. 1998, 252, 187–190. [Google Scholar] [CrossRef]
- Moore, R.D.; Romine, M.W.; O’connor, P.J.; Tomporowski, P.D. The influence of exercise-induced fatigue on cognitive function. J. Sports Sci. 2012, 30, 841–850. [Google Scholar] [CrossRef] [PubMed]
Publisher’s Note: MDPI stays neutral with regard to jurisdictional claims in published maps and institutional affiliations. |
© 2022 by the authors. Licensee MDPI, Basel, Switzerland. This article is an open access article distributed under the terms and conditions of the Creative Commons Attribution (CC BY) license (https://creativecommons.org/licenses/by/4.0/).