Upper-Limb Isometric Force Feasible Set: Evaluation of Joint Torque-Based Models


Abstract
1. Introduction
2. Material and Methods
2.1. Upper-Limb Model
2.2. Force Ellipsoids and Polytopes Computation
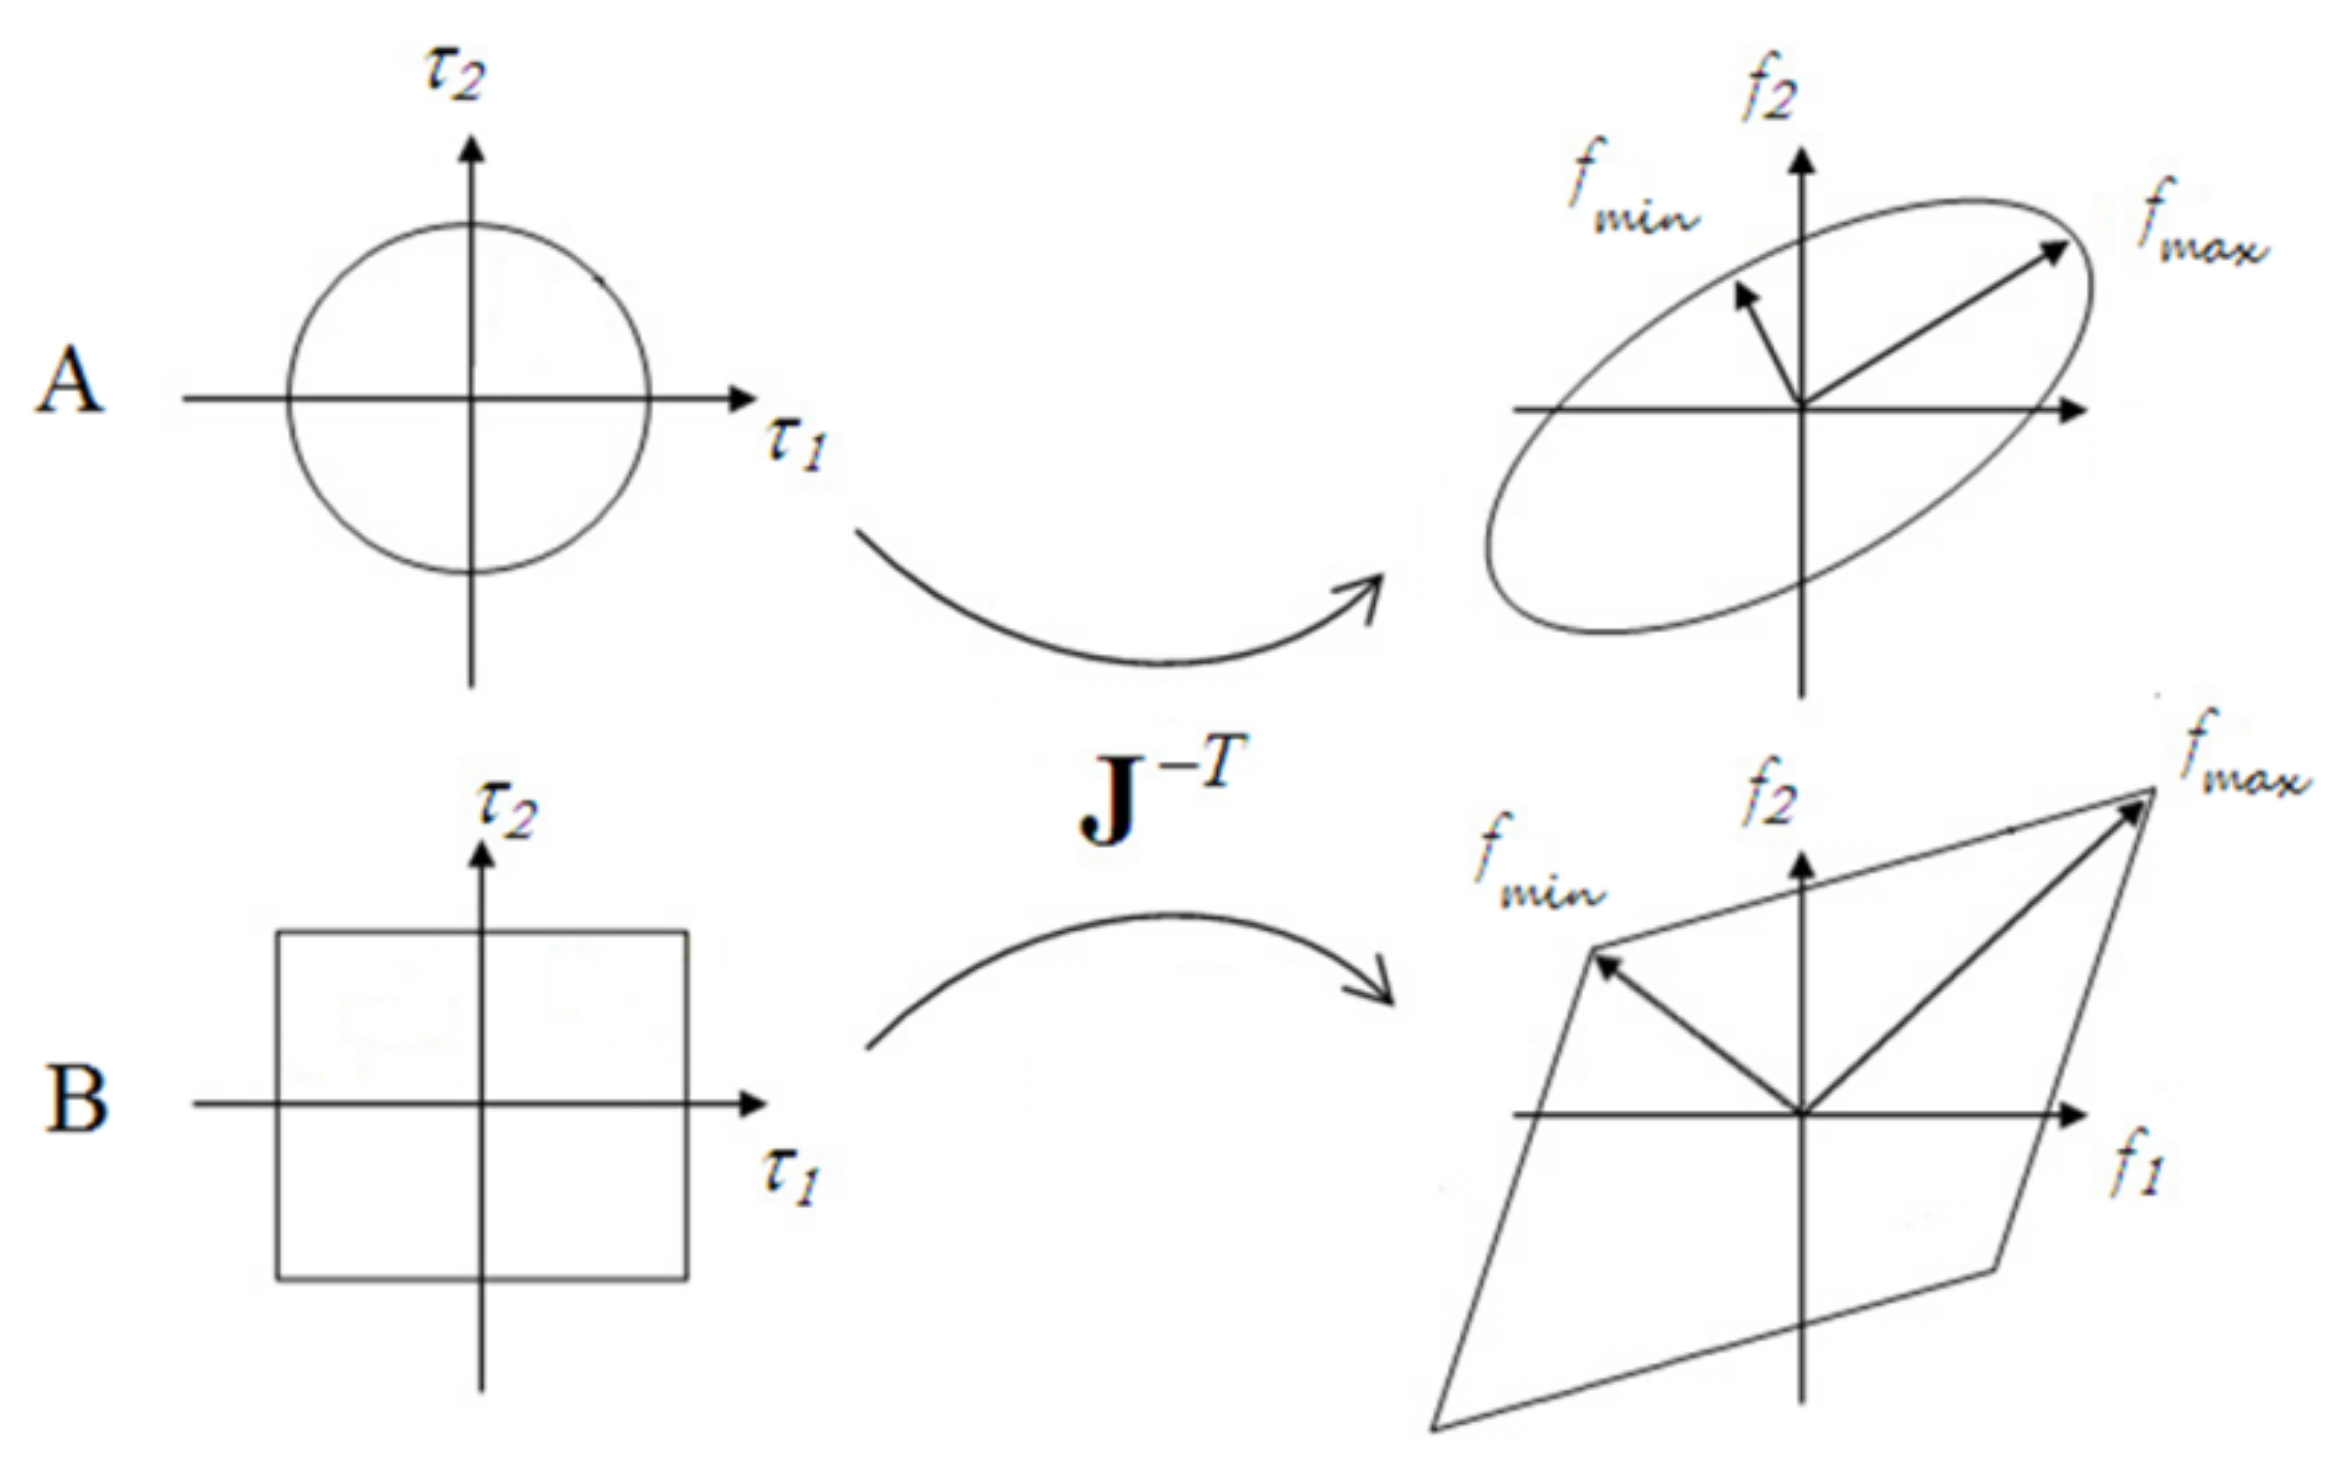
2.2.1. Force Ellipsoids Definition
2.2.2. Force Polytopes Definition
2.2.3. Measured Force Polytope
2.3. Participants
2.4. Materials
2.5. Experimental Protocol
Data Analysis
3. Results
4. Discussion
5. Conclusions
Author Contributions
Funding
Institutional Review Board Statement
Informed Consent Statement
Data Availability Statement
Conflicts of Interest
Abbreviations
| FFS | Force feasible set |
| FE | Force ellipsoid |
| SFE | Scaled force ellipsoid |
| FP | Force polytope |
| SFP | Scaled force polytope |
| MFP | Measured force polytope |
References
- McAtamney, L.; Nigel Corlett, E. RULA: A survey method for the investigation of work-related upper limb disorders. Appl. Ergon. 1993, 24, 91–99. [Google Scholar] [CrossRef]
- Vignais, N.; Miezal, M.; Bleser, G.; Mura, K.; Gorecky, D.; Marin, F. Innovative system for real-time ergonomic feedback in industrial manufacturing. Appl. Ergon. 2013, 44, 566–574. [Google Scholar] [CrossRef] [PubMed]
- Hignett, S.; McAtamney, L. Rapid Entire Body Assessment (REBA). Appl. Ergon. 2000, 31, 201–205. [Google Scholar] [CrossRef]
- Colombini, D.; Occhipinti, E. Preventing upper limb work-related musculoskeletal disorders (UL-WMSDS): New approaches in job (re)design and current trends in standardization. Appl. Ergon. 2006, 37, 441–450. [Google Scholar] [CrossRef]
- Wang, X.; Le Breton-Gadegbeku, B.; Bouzon, L. Lower limb, Biomechanical evaluation, Pedal operation, Comfort/discomfort, Clutch pedal. Int. J. Ind. Ergon. 2004, 34, 209–221. [Google Scholar] [CrossRef]
- Ma, L.; Chablat, D.; Bennis, F.; Zhang, W. A new simple dynamic muscle fatigue model and its validation. Int. J. Ind. Ergon. 2009, 39, 211–220. [Google Scholar] [CrossRef]
- Maurice, P.; Padois, V.; Measson, Y.; Bidaud, P. Human-oriented design of collaborative robots. Int. J. Ind. Ergon. 2017, 57, 88–102. [Google Scholar] [CrossRef]
- Maurice, P.; Malaisé, A.; Amiot, C.; Paris, N.; Richard, G.J.; Rochel, O.; Ivaldi, S. Human movement and ergonomics: An industry-oriented dataset for collaborative robotics. Int. J. Robot. Res. 2019, 38, 1529–1537. [Google Scholar] [CrossRef]
- Carmichael, M.G.; Liu, D. Estimating Physical Assistance Need Using a Musculoskeletal Model. IEEE Trans. Biomed. Eng. 2013, 60, 1912–1919. [Google Scholar] [CrossRef]
- Jan Nijhof, E.; Gabriel, D.A. Maximum isometric arm forces in the horizontal plane. J. Biomech. 2006, 39, 708–716. [Google Scholar] [CrossRef]
- Sasaki, M.; Iwami, T.; Miyawaki, K.; Sato, I.; Obinata, G.; Dutta, A. Higher Dimensional Spatial Expression of Upper Limb Manipulation Ability Based on Human Joint Torque Characteristics. In Robot Manipulators; Lazinica, A., Kawai, H., Eds.; IntechOpen: Rijeka, Croatia, 2010; Chapter 36. [Google Scholar] [CrossRef]
- Yu, D.; Xu, X.; Lin, J.H. Impact of posture choice on one-handed pull strength variations at low, waist, and overhead pulling heights. Int. J. Ind. Ergon. 2018, 64, 226–234. [Google Scholar] [CrossRef]
- Lin, J.H.; McGorry, R.W.; Maynard, W. One-handed standing pull strength in different postures: Normative data. Appl. Ergon. 2013, 44, 603–608. [Google Scholar] [CrossRef]
- Haslegrave, C.M.; Tracy, M.F.; Corlett, E.N. Force exertion in awkward working postures-strength capability while twisting or working overhead. Ergonomics 1997, 40, 1335–1356. [Google Scholar] [CrossRef]
- Castro, C.; De la Vega, E.; Báez, G.; Carrasco, F. Maximum force levels in different positions of shoulder and elbow. Work 2012, 41 (Suppl. 1), 5488–5490. [Google Scholar] [CrossRef]
- Yoshikawa, T. Manipulability of Robotic Mechanisms. Int. J. Robot. Res. 1985, 4, 3–9. [Google Scholar] [CrossRef]
- Chiacchio, P.; Bouffard-Vercelli, Y.; Pierrot, F. Force polytope and force ellipsoid for redundant manipulators. J. Robot. Syst. 1997, 14, 613–620. [Google Scholar] [CrossRef]
- Oshima, T.; Fujikawa, T.; Kameyama, O.; Kumamoto, M. Robotic analyses of output force distribution developed by human limbs. In Proceedings of the 9th IEEE International Workshop on Robot and Human Interactive Communication, IEEE RO-MAN 2000 (Cat. No.00TH8499), Osaka, Japan, 27–29 September 2000; pp. 229–234. [Google Scholar] [CrossRef]
- Tanaka, Y.; Shiokawa, M.; Yamashita, H.; Tsuji, T. Manipulability Analysis of Kicking Motion in Soccer Based on Human Physical Properties. In Proceedings of the 2006 IEEE International Conference on Systems, Man and Cybernetics, Taipei, Taiwan, 8–11 October 2006; Volume 1, pp. 68–73. [Google Scholar] [CrossRef]
- Knapik, J.J.; Wright, J.E.; Mawdsley, R.H.; Braun, J. Isometric, Isotonic, and Isokinetic Torque Variations in Four Muscle Groups Through a Range of Joint Motion. Phys. Ther. 1983, 63, 938–947. [Google Scholar] [CrossRef]
- Krishnan, C.; Allen, E.J.; Williams, G.N. Effect of knee position on quadriceps muscle force steadiness and activation strategies. Muscle Nerve 2011, 43, 563–573. [Google Scholar] [CrossRef]
- Pinter, I.J.; Bobbert, M.F.; van Soest, A.J.K.; Smeets, J.B.J. Isometric torque-angle relationships of the elbow flexors and extensors in the transverse plane. J. Electromyogr. Kinesiol. 2010, 20, 923–931. [Google Scholar] [CrossRef]
- Hernandez, V.; Rezzoug, N.; Jacquier-Bret, J.; Gorce, P. Human upper-limb force capacities evaluation with robotic models for ergonomic applications: Effect of elbow flexion. Comput. Methods Biomech. Biomed. Eng. 2016, 19, 440–449. [Google Scholar] [CrossRef]
- Rezzoug, N.; Hernandez, V.; Jacquier-Bret, J.; Gorce, P. Comparison between model-based and measured force polytopes: Towards isometric force capacity evaluation. Comput. Methods Biomech. Biomed. Eng. 2013, 16, 172–174. [Google Scholar] [CrossRef]
- Corke, P. MATLAB toolboxes: Robotics and vision for students and teachers. IEEE Robot. Autom. Mag. 2007, 14, 16–17. [Google Scholar] [CrossRef]
- Bayle, B.; Fourquet, J.Y.; Renaud, M. Manipulability analysis for mobile manipulators. In Proceedings of the 2001 ICRA. IEEE International Conference on Robotics and Automation (Cat. No.01CH37164), Seoul, Korea, 21–26 May 2001; Volume 2, pp. 1251–1256. [Google Scholar] [CrossRef]
- Sasaki, M.; Iwami, T.; Miyawaki, K.; Sato, I.; Obinata, G.; Dutta, A. Vertex Search Algorithm of Convex Polyhedron Representing Upper Limb Manipulation Ability. In Search Algorithms and Applications; Mansour, N., Ed.; IntechOpen: Rijeka, Croatia, 2011; Chapter 22. [Google Scholar] [CrossRef]
- Skuric, A.; Padois, V.; Daney, D. On-line force capability evaluation based on efficient polytope vertex search. arXiv 2011, arXiv:2011.05226. [Google Scholar]
- Wu, G.; van der Helm, F.C.; Veeger, H.E.J.; Makhsous, M.; Van Roy, P.; Anglin, C.; Nagels, J.; Karduna, A.R.; McQuade, K.; Wang, X.; et al. ISB recommendation on definitions of joint coordinate systems of various joints for the reporting of human joint motion—Part II: Shoulder, elbow, wrist and hand. J. Biomech. 2005, 38, 981–992. [Google Scholar] [CrossRef]
- Ehrig, R.M.; Taylor, W.R.; Duda, G.N.; Heller, M.O. A survey of formal methods for determining the centre of rotation of ball joints. J. Biomech. 2006, 39, 2798–2809. [Google Scholar] [CrossRef]
- Monnet, T.; Desailly, E.; Begon, M.; Vallée, C.; Lacouture, P. Comparison of the SCoRE and HA methods for locating in vivo the glenohumeral joint centre. J. Biomech. 2007, 40, 3487–3492. [Google Scholar] [CrossRef]
- Begon, M.; Monnet, T.; Lacouture, P. Effects of movement for estimating the hip joint centre. Gait Posture 2007, 25, 353–359. [Google Scholar] [CrossRef]
- Lempereur, M.; Leboeuf, F.; Brochard, S.; Rousset, J.; Burdin, V.; Rémy-Néris, O. In vivo estimation of the glenohumeral joint centre by functional methods: Accuracy and repeatability assessment. J. Biomech. 2010, 43, 370–374. [Google Scholar] [CrossRef]
- Herzog, W. The relation between the resultant moments at a joint and the moments measured by an isokinetic dynamometer. J. Biomech. 1988, 21, 5–12. [Google Scholar] [CrossRef]
- Kaufman, K.R.; An, K.N.; Chao, E.Y.S. A comparison of intersegmental joint dynamics to isokinetic dynamometer measurements. J. Biomech. 1995, 28, 1243–1256. [Google Scholar] [CrossRef]
- Arampatzis, A.; Karamanidis, K.; De Monte, G.; Stafilidis, S.; Morey-Klapsing, G.; Brüggemann, G.P. Differences between measured and resultant joint moments during voluntary and artificially elicited isometric knee extension contractions. Clin. Biomech. 2004, 19, 277–283. [Google Scholar] [CrossRef] [PubMed]
- Arampatzis, A.; Morey-Klapsing, G.; Karamanidis, K.; DeMonte, G.; Stafilidis, S.; Brüggemann, G.P. Differences between measured and resultant joint moments during isometric contractions at the ankle joint. J. Biomech. 2005, 38, 885–892. [Google Scholar] [CrossRef] [PubMed]
- Lu, T.W.; O’Connor, J. Bone position estimation from skin marker co-ordinates using global optimisation with joint constraints. J. Biomech. 1999, 32, 129–134. [Google Scholar] [CrossRef]
- Roux, E.; Bouilland, S.; Godillon-Maquinghen, A.P.; Bouttens, D. Evaluation of the global optimisation method within the upper limb kinematics analysis. J. Biomech. 2002, 35, 1279–1283. [Google Scholar] [CrossRef]
- La Delfa, N.J.; Freeman, C.C.; Petruzzi, C.; Potvin, J.R. Equations to predict female manual arm strength based on hand location relative to the shoulder. Ergonomics 2014, 57, 254–261. [Google Scholar] [CrossRef] [PubMed]
- La Delfa, N.J.; Potvin, J.R. The ‘Arm Force Field’ method to predict manual arm strength based on only hand location and force direction. Appl. Ergon. 2017, 59 Pt A, 410–421. [Google Scholar] [CrossRef]
- Danneskiold-Samsøe, B.; Bartels, E.M.; Bülow, P.M.; Lund, H.; Stockmarr, A.; Holm, C.C.; Wätjen, I.; Appleyard, M.; Bliddal, H. Isokinetic and isometric muscle strength in a healthy population with special reference to age and gender. Acta Physiol. 2009, 197 (Suppl. 673), 1–68. [Google Scholar] [CrossRef]
- Roy, J.S.; MacDermid, J.; Boyd, K.; Faber, K.; Drosdowech, D.; Athwal, G. Rotational strength, range of motion, and function in people with unaffected shoulders from various stages of life. Sports Med. Arthrosc. Rehabil. Ther. Technol. 2009, 1, 4. [Google Scholar] [CrossRef]
- Jacquier-Bret, J.; Faupin, A.; Rezzoug, N.; Gorce, P. A New Postural Force Production Index to Assess Propulsion Effectiveness During Handcycling. J. Appl. Biomech. 2013, 29, 798–803. [Google Scholar] [CrossRef]
- Tanaka, Y.; Yamada, N.; Nishikawa, K.; Masamori, I.; Tsuji, T. Manipulability analysis of human arm movements during the operation of a variable-impedance controlled robot. In Proceedings of the 2005 IEEE/RSJ International Conference on Intelligent Robots and Systems, Edmonton, AB, Canada, 2–6 August 2005; pp. 1893–1898. [Google Scholar] [CrossRef]
- Valero-Cuevas, F.J. A mathematical approach to the mechanical capabilities of limbs and fingers. Adv. Exp. Med. Biol. 2009, 629, 619–633. [Google Scholar]
- Kutch, J.J.; Valero-Cuevas, F.J. Muscle redundancy does not imply robustness to muscle dysfunction. J. Biomech. 2011, 44, 1264–1270. [Google Scholar] [CrossRef]
- Khalaf, K.A.; Parnianpour, R. A normative database of isokinetic upper-extremity joint strenghts: Towards the evaluation of dynamic human performance. Biomed. Eng. Appl. Basis Commun. 2001, 13, 79–92. [Google Scholar] [CrossRef]
- Komura, T.; Shinagawa, Y.; Kunii, T.L. Calculation and visualization of the dynamic ability of the human body. J. Vis. Comput. Animat. 1999, 10, 57–78. [Google Scholar] [CrossRef]
- Hernandez, V.; Rezzoug, N.; Gorce, P. Toward isometric force capabilities evaluation by using a musculoskeletal model: Comparison with direct force measurement. J. Biomech. 2015, 48, 3178–3184. [Google Scholar] [CrossRef]


| dof | Offset | |||
|---|---|---|---|---|
| S-FE/EX | 0 | 0 | 0 | |
| S-AB/AD | 0 | 0 | ||
| S-LR/MR | 0 | |||
| E-FL/EX | + CA | 0 | 0 | 0 |
| E-SU/PR | 0 | |||
| W-RD/UD | 0 | 0 | ||
| W-FL/EX | 0 | 0 | 0 |
| Shoulder | FL (+) | EX (−) | AD (+) | AB (−) | MR (+) | LR (−) |
| 71.6 (17.0) | 87.5( (25.7) | 81.0 (25.0) | 68.0 (19.9) | 53.9 (12.0) | 41.7 (5.8) | |
| Elbow | FL (+) | EX (−) | PR (+) | SU (−) | ||
| 68.1 (18.9) | 61.0 (11.5) | 9.3 (2.3) | 11.8 (5.3) | |||
| Wrist | FL (+) | EX (−) | UD (+) | RD (−) | ||
| 14.8 (8.3) | 7.9 (3.9) | 17.1 (8.0) | 14.4 (7.1) |
| S-FE/EX | S-AB/AD | S-LR/MR | E-FL/EX | E-SU/PR | W-RD/UD | W-FL/EX | |
|---|---|---|---|---|---|---|---|
| Dynamometer | 6.2 (4.7) * | −22.3 (5.4) | 5.7 (3.9) | 71.3 (6.7) | 75.1 (7.9) | 4.5 (5.2) * | −12.4 (3.5) |
| Force sensor | 12.9 (7.0) * | −22.2 (3.5) | −1.5 (7.9) | 66.5 (6.6) | 80.1 (6.4) | −3.0 (4.4) * | −18.5 (8.4) |
| FE/MFP | SFE/MFP | FP/MFP | SFP/MFP |
|---|---|---|---|
| 12.8 (3.1) | 7.4 (3.3) * | 14.6 (3.0) | 9.3 (5.3) £ |
| RMSE Mean | RMSE Min | RMSE Max | % X < 50 N | % 50 < X < 100 N | % X > 100 N | |
|---|---|---|---|---|---|---|
| SFE vs. MFP | 72.8 (16.0) | 1.3 (3.2) | 244.0 (79.1) | 39.7 (12.0) | 33.6 (12.8) | 26.8 (13.0) |
| SFP vs. MFP | 56.4 (16.7) | 0.13 (0.13) | 305.6 (85.3) | 56.2 (14.0) | 28.3 (7.2) | 15.4 (8.7) |
Publisher’s Note: MDPI stays neutral with regard to jurisdictional claims in published maps and institutional affiliations. |
© 2021 by the authors. Licensee MDPI, Basel, Switzerland. This article is an open access article distributed under the terms and conditions of the Creative Commons Attribution (CC BY) license (https://creativecommons.org/licenses/by/4.0/).
Share and Cite
Rezzoug, N.; Hernandez, V.; Gorce, P. Upper-Limb Isometric Force Feasible Set: Evaluation of Joint Torque-Based Models. Biomechanics 2021, 1, 102-117. https://doi.org/10.3390/biomechanics1010008
Rezzoug N, Hernandez V, Gorce P. Upper-Limb Isometric Force Feasible Set: Evaluation of Joint Torque-Based Models. Biomechanics. 2021; 1(1):102-117. https://doi.org/10.3390/biomechanics1010008
Chicago/Turabian StyleRezzoug, Nasser, Vincent Hernandez, and Philippe Gorce. 2021. "Upper-Limb Isometric Force Feasible Set: Evaluation of Joint Torque-Based Models" Biomechanics 1, no. 1: 102-117. https://doi.org/10.3390/biomechanics1010008
APA StyleRezzoug, N., Hernandez, V., & Gorce, P. (2021). Upper-Limb Isometric Force Feasible Set: Evaluation of Joint Torque-Based Models. Biomechanics, 1(1), 102-117. https://doi.org/10.3390/biomechanics1010008