Article

COx-Free Hydrogen Production via CH4 Decomposition on Alkali-Incorporated (Mg, La, Ca, Li) Ni-Al Catalysts

by
Morgana Rosset
1,†,
Yan Resing Dias
2,*,
Liliana Amaral Féris
2,† and
Oscar William Perez-Lopez
2,*
1
Department of Chemical Engineering, Polytechnic School, University of São Paulo (USP), Professor Luciano Gualberto Avenue, 380 Lane 3, São Paulo 05508-010, Brazil
2
Department of Chemical Engineering, Federal University of Rio Grande do Sul (UFRGS), Ramiro Barcelos Street, 2777, Porto Alegre 90035-007, Brazil
*
Authors to whom correspondence should be addressed.
These authors contributed equally to this work.
Nanoenergy Adv. 2025, 5(3), 10; https://doi.org/10.3390/nanoenergyadv5030010
Submission received: 31 March 2025 / Revised: 1 July 2025 / Accepted: 22 July 2025 / Published: 30 July 2025
(This article belongs to the Special Issue Novel Energy Materials)

Abstract

The catalytic decomposition of CH4 is a promising method for producing high-purity COx-free hydrogen. A Ni-Al-LDH catalyst synthesized via coprecipitation was modified with alkali metals (Mg, La, Ca, or Li) through reconstruction to enhance catalytic activity and resistance to deactivation during catalytic methane decomposition (CMD). The catalysts were evaluated by two activation methods: H2 reduction and direct heating with CH4. The MgNA-R catalyst achieved the highest CH4 conversion (65%) at 600 °C when reduced with H2, attributed to a stronger Ni-Al interaction. Under CH4 activation, LaNA-C achieved a 55% conversion at the same temperature, associated with a smaller crystallite size and higher reducibility due to La incorporation. Although all catalysts deactivated due to carbon deposition and/or sintering, LaNA-C was the only sample that could resist deactivation for a longer period, as La appears to have a protective effect on the active phase. Post-reaction characterizations revealed the formation of graphitic and filamentous carbon. Raman spectroscopy exhibited a higher degree of graphitization and structural order in LaNA-C, whereas SEM showed a more uniform distribution of carbon filaments. TEM confirmed the presence of multi-walled carbon nanotubes with encapsulated Ni particles in La-promoted samples. These results demonstrate that La addition improves the catalytic performance under CH4 activation and carbon structure. This finding offers a practical advantage for CMD processes, as it reduces or eliminates the need to use hydrogen during catalyst activation.

Graphical Abstract

1. Introduction

Hydrogen is a clean energy source and a promising fuel due to its properties. Furthermore, hydrogen has potential applications such as fuel cells and internal combustion engines [1,2]. Hence, hydrogen is considered a clean fuel as it only produces water during combustion [3].
Conventionally, hydrogen production occurs via catalytic steam reforming, partial oxidation of methane, and auto-thermal reforming of natural gas [4,5,6]. These methods consume a high amount of energy, produce a large amount of carbon dioxide, and require complicated and expensive processes for hydrogen purification [7,8]. The commercial steam methane reforming (SMR) process is typically carried out under severe conditions, with a temperature range of 800–1100 °C and a pressure of approximately 8–35 bar [9]. However, a major drawback of these routes is the formation of large amounts of COx as byproducts [4,10]. Hydrogen must be completely free of COx to be used in fuel cells.
Given economic issues and greenhouse gas emissions, the focus is on developing new hydrogen production systems. Non-catalytic decomposition of methane (CH4 (g)  C (s) + 2H2 (g)) is an endothermic (ΔH° = 75.6 kJ mol−1) reaction that requires extremely high temperatures above 1000 °C to decompose stable C–H bonds [1,6] with a bond energy of 434 kJ mol−1 [10]. However, in the presence of a suitable catalyst, this reaction can occur at much lower temperatures, even below 500 °C. Catalytic methane decomposition (CMD) is a single-step process that produces CO2-free hydrogen, along with valuable carbon nanomaterials, such as carbon nanofibers [11,12]. If full methane conversion is achieved, CMD can be considered a green technology without CO or CO2 emissions [13]. Therefore, CMD presents a promising alternative to conventional steam methane reforming for hydrogen production [5,14].
Transition metals such as cobalt-based, iron-based, and especially nickel-based catalysts are known to benefit from their low cost, good catalytic activity, and stability [15,16,17]. Ni is the most investigated catalytic component and exhibits high activity and carbon yield [18,19]. Meanwhile, further modification of the Ni-based catalysts remains essential, as this gradual material deactivation inevitably occurs during the reaction, due to the sintering of Ni particles and the coverage of active sites by the deposited carbon [19,20].
Pudukudy et al. [21] described how Pd, as a promoter, enhanced the catalytic activity and improved the stability of the Ni/MgAl2O4 catalyst at a temperature of 700 °C. Rastegarpanah et al. [22] investigated the effects of different promoters (La, Co, Fe, Ce, and Cu) on the supported Ni catalysts. They observed that the addition of copper prevented the formation of graphite layers on the Ni sites and enhanced the reducibility of Ni on the catalyst surface. Catalysts with high nickel concentrations, 75%Ni–12%Cu/Al2O3 and 70%Ni–10%Cu–10%Fe/Al2O3, were synthesized and tested at various temperatures. The optimal temperatures for methane decomposition using the Ni-Cu/Al2O3 catalyst were 600–650 °C [23]. According to Bayat et al. [16], the addition of iron or copper to a nickel catalyst enhances its catalytic performance. Furthermore, copper increased methane adsorption and improved reducibility; the high affinity of copper with the graphite structure prevented the generation of encapsulating carbon on the nickel surface, thereby hindering catalyst deactivation.
Layered double hydroxides (LDH) are a class of ionic lamellar compounds made up of positively charged brucite-like layers (Mg(OH)6) with an interlayer region containing charge-compensating anion molecules. [M2+1−x M3+x (OH)2][An−]x/n∙m H2O is the general formula of hydrotalcite (HT), where An− represents interlayer anions, inorganic or organic anions, and n is the charge in the interlayer ion; x and m are the fraction constants [24,25]. The thermal stability of hydrotalcite depends on its method of synthesis, the ratio M2+/M3+, and the nature of incorporated metals (M2+, M3+) [26]. Furthermore, the oxides derived from hydrotalcite exhibit small particle sizes, large surface areas, homogeneous inter-dispersion of the metallic phase, and better resistance to sintering compared to other supported catalysts [27,28]. The chemical composition and preparation method of the catalyst, the support, and the promoter influence the activity and stability, and determine the structure and morphology of the carbon formed [29,30].
A Mg-Ni-Al-LDH catalyst was synthesized via the coprecipitation method, with varied nickel concentration, and tested for methane decomposition in a fixed-bed reactor [31]. They found that a 40% nickel concentration provided the highest performance, with a conversion rate above 80% for 7 h of reaction, owing to its effective diffusion of carbon particles and spinel-like structure. As a result, cobalt-, iron-, and copper-substituted nickel-aluminum hydrotalcite-like compounds have been synthesized and used for methane decomposition. Furthermore, in reaction at 600 °C, alloying Ni with Co, Fe, and especially Cu enhances the catalytic life and carbon yield. In addition, Ni-Cu alloying alters the carbon morphology, resulting in carbon nanofibers as the primary product [32].
The hydrotalcite-derived Ni-Fe-Cu-based tri-metallic catalyst for methane catalytic decomposition has been studied using the Taguchi method by Al Mesfer et al. [33]. The study results revealed that the catalyst reaction performance and the nature of deposited carbon depend on the catalyst composition. Moreover, the diameter of carbon nanotubes formed over the catalyst primarily depends on the Ni loading. Rare earth (La, Pr, Nd, Gd, and Sm) metal-doped Ni-Al hydrotalcite precursors were obtained by coprecipitation and evaluated for CH4 decomposition at 550 °C until their complete deactivation by the Anjaneyulu et al. group [34]. A correlation was established between H2 production rates and the Ni metal surface area of the catalyst. Adding La to Ni-Al significantly altered the Ni behavior, resulting in higher H2 yields.
The present work evaluated the effect of incorporating different alkali metals (Mg, La, Ca, and Li) on the performance of the LDH NiAl-derived catalyst for methane decomposition. In addition, detailed characterization was carried out of the fresh and used catalysts to correlate their properties and activity.

2. Experimental

2.1. Catalyst Synthesis

The Ni-Al-LDH sample was prepared from a solution of Ni(NO3)2 and Al(NO3)3 with a Ni/Al molar ratio of 2:1 by the coprecipitation method using a solution containing a mixture of KOH and K2CO3 [35,36]. The synthesis was performed by continuously mixing the solutions in a jacketed CSTR reactor under temperature and pH control. The precipitate was maintained under agitation at 50 °C for 1 h and then vacuum-filtered, washed with deionized water, and dried overnight at 80 °C. The obtained material was calcined in a muffle at 400 °C for 12 h. The resultant catalyst was named NA.
In the second step, 1.5 g NA-C (calcined) was dispersed in 50 mL to the different metal nitrate solutions (Ca(NO3)2, La(NO3)3, Mg(NO3)2 or LiNO3) with the concentration of 1 mol L−1, and stirred for 24 h at 50 °C. Then, the mixture was filtered and dried overnight at 80 °C. Finally, the samples were obtained by calcination at 600 °C for 6 h [35]. The resultant catalysts were named according to the corresponding metals. The samples are designated as MNA-C and MNA-R, where M represents the incorporated metal (Mg, Ca, Li, or La), N stands for nickel, A for aluminum, C indicates that the sample was calcined, and R denotes a reduced sample. All chemicals were purchased from Synth (Diadema, São Paulo, Brazil).

2.2. Catalytic Activity

The reactions were carried out in a fixed-bed, tubular quartz reactor at atmospheric pressure with heating provided by a resistive electric oven. Typically, 100 mg of catalyst was used in reactions with 500 mg of silicon carbide (SiC) as a diluent for the catalyst. The catalysts were previously activated in situ at 700 °C for 1 h under a mixture of 10 mL min−1 H2 and 90 mL min−1 N2 [37]. The flow rate used in the tests was 100 mL min−1, with a volume rate of 1:9 for CH4:N2. The catalysts were also evaluated without the previous reduction step, where the activation occurred during heating with the same CH4:N2 mixture. The effluent gases were analyzed online in a gas chromatograph (Varian 3600cx, Palo Alto, CA, USA) with a packed column (Porapak Q) and a thermal conductivity detector (TCD) [36]. Runs as a function of temperature were carried out stepwise from 500 to 700 °C, with five GC analyses of 3 min performed at each reaction temperature. Reactions were also performed at a fixed temperature of 700 °C, with a time-on-stream of 300 min.

2.3. Catalysts Characterization

Powder X-ray diffraction (XRD) patterns of the catalysts were obtained using a Bruker D2-Phaser diffractometer (Karlsruhe, Germany) with Cu-Kα radiation of λ = 0.1541 nm (at 30 kV and 10 mA) and a set of 0.02° (2θ) in the range of 5–70° [36]. The average crystallite sizes were estimated using Scherrer’s equation [38]. The surface area, pore volume, and pore diameter analyses were obtained via nitrogen adsorption-desorption measurements using a surface area and pore analyzer (NOVA 4200e, Quantachrome Instruments, Boynton Beach, FL, USA). The samples were pretreated at 300 °C for 3 h under vacuum. The BET method was used to determine the specific surface area, while pore volume and diameter were calculated using the BJH method [39]. Temperature-programmed reduction (H2-TPR) and carbon dioxide desorption (CO2-TPD) were analyzed in a multipurpose system (Rio de Janeiro, Brazil). For H2-TPR tests, approximately 100 mg of the sample is heated from room temperature up to 800 °C at a rate of 10 °C min−1 under a mixture of H2:N2 at a ratio of 1:9, with a total flow rate of 30 mL min−1 [40]. Before each CO2-TPD run, 100 mg of the sample was degassed with a pure He flow at 100 °C for 30 min. Afterward, the sample was saturated with a pure CO2 flow for 30 min. Next, the sample was purged with a pure He flow and heated at a rate of 10 °C min−1 up to 800 °C under pure He flow [40]. CO2-TPD curves were deconvoluted using Gaussian functions.
To characterize the spent catalysts and the carbon species formed after the stability tests, multiple complementary techniques were employed. Temperature-programmed oxidation (TPO) was carried out using an SDT Q600 thermobalance (New Castle, DE, USA) with 10 mg of sample under a synthetic air flow of 100 mL min−1, heating from room temperature up to 800 °C at a rate of 10 °C min−1 [41]. Raman spectroscopy was performed using a Renishaw inVia Raman Microscope (Gloucestershire, UK) with a 532 nm excitation laser, providing structural information on the carbon deposits [42]. Additionally, the morphology of the spent catalysts was evaluated through scanning (SEM) and transmission electron microscopy (TEM) analyses, which were conducted using a JEOL JSM-6060 microscope (Tokyo, Japan) operated with a secondary electron beam and a JEM-2100 microscope (Tokyo, Japan) operated at an acceleration voltage of 200 kV, respectively. Before the SEM analyses, the samples were coated with a thin layer of gold. For TEM analyses, the samples were dispersed in isopropanol and sonicated for 10 minutes, then dropped onto a carbon film supported on 300-mesh copper grids and allowed to dry. These techniques collectively enabled a detailed assessment of both the catalyst surface and the morphology and structure of the carbon formed during methane decomposition [43].

3. Results and Discussion

3.1. Catalyst Characterization

The XRD patterns of calcined samples are shown in Figure 1. All samples exhibited diffraction peaks at approximately 37.2°, 43.7°, and 62.8°, which corresponded to the cubic NiO planes on the (111), (200), and (220) planes, and/or spinel-type NiAl2O4 phases on the (311), (400), and (440) planes, respectively [44,45]. These results indicate that the incorporation of alkali metals did not significantly alter the crystalline structure of the NiO and NiAl2O4 phases. Although it is not possible to identify NiAl2O4 phases from NiO purely by XRD due to overlapping peaks, it is well-reported in the literature that LDH-derived catalysts tend to form nickel aluminates after calcination [46,47]. Furthermore, the reconstructed samples (LiNA-C, MgNA-C, CaNA-C, and LaNA-C) exhibited only the presence of NiO and/or Ni-containing spinels without any additional oxide phases being detected. These results suggest that the incorporated metals were successfully integrated into the LDH lattice during the reconstruction process.
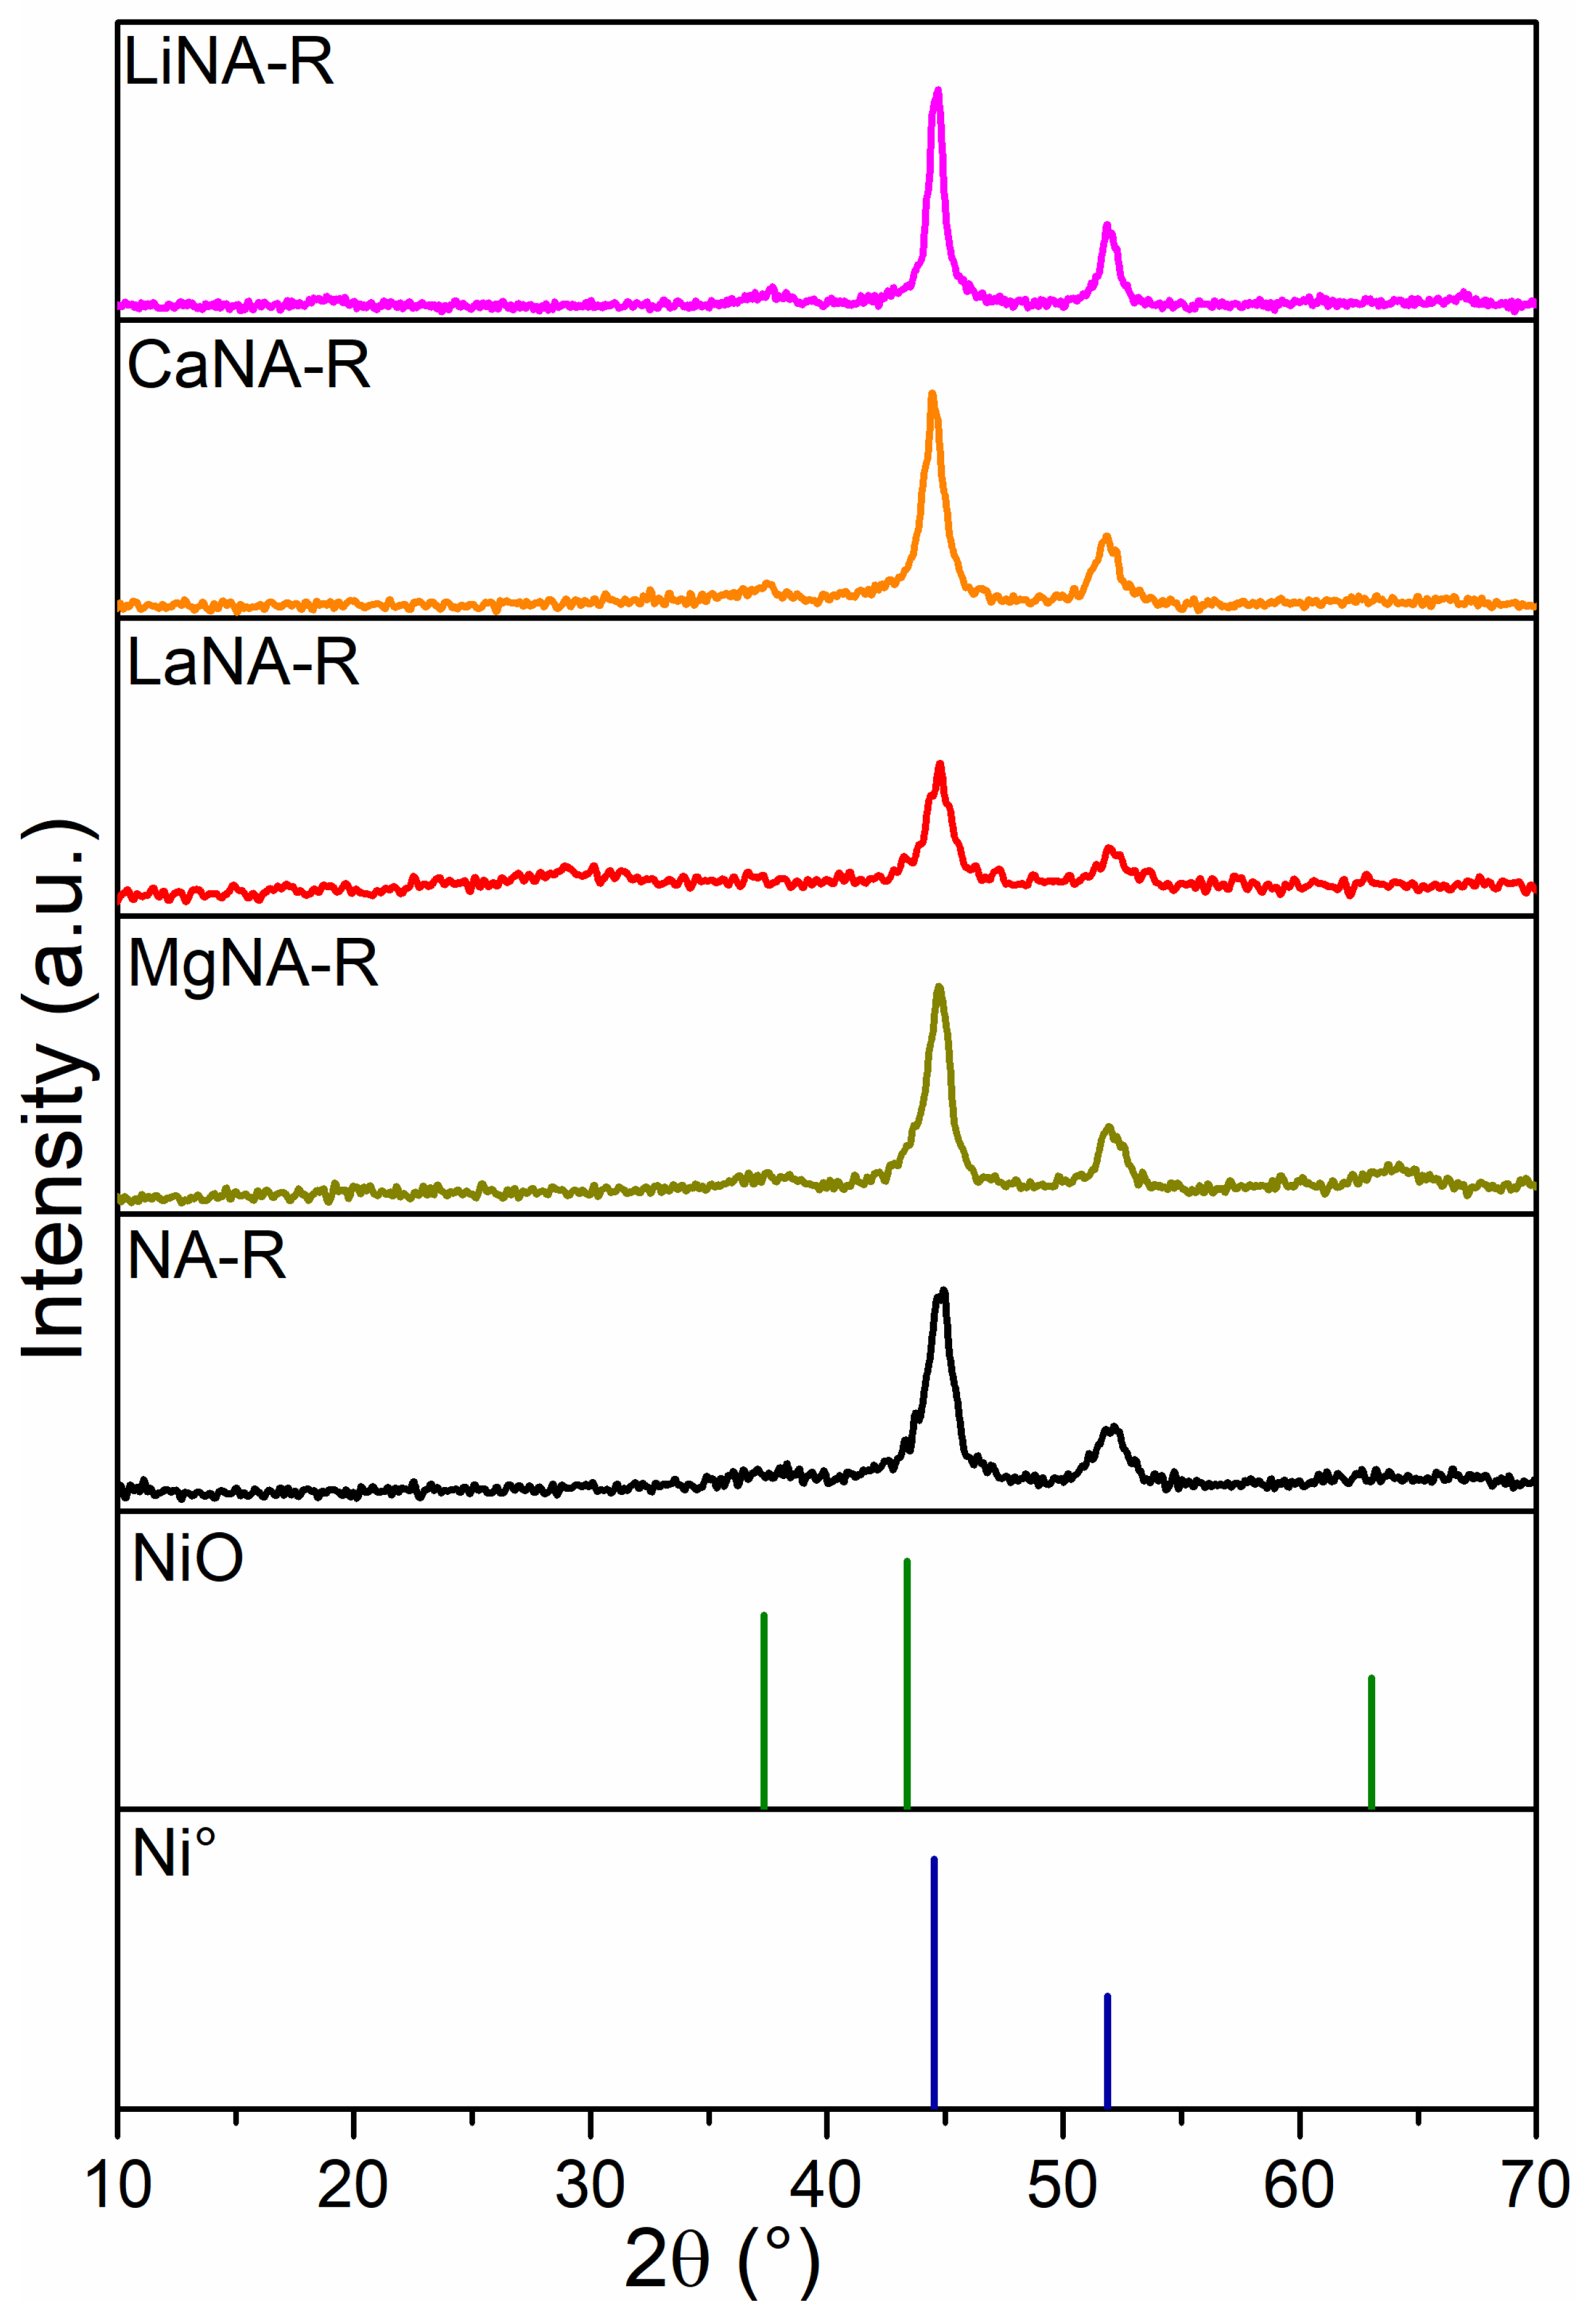
The XRD patterns of the reduced samples are illustrated in Figure 2. These diffractograms reveal reflections of the metallic Ni (Ni°) phase, indicating that the conditions were enough to complete the reduction of most of the oxides. Meanwhile, some samples (LiNA-R, MgNA-R, CaNA-R) present a small peak at 37.5° (311), likely related to mixed oxide phases that could not be completely reduced [48,49]. All samples showed two reflections at 44.8° and 51.9°, corresponding to the Ni0 (111) and (200) crystal planes [50].
The LiNA-R and CaNA-R samples had Ni° peak at 44.8° with higher intensity, indicating the larger crystallite sizes in these samples. The LaNA-R presented the smallest crystallite size, similar to that of the Calgaro and Perez-Lopez study [37]; aside from the La-containing sample, the one reconstructed with Mg also presented a crystallite size lower than NA-R, indicating that these promoters could enhance the Ni distribution on the surface and improve its dispersion [51,52]. LaNA-R and MgNA-R have already been reported to be effective promoters of Ni dispersion and aid in controlling crystallite size [53,54].
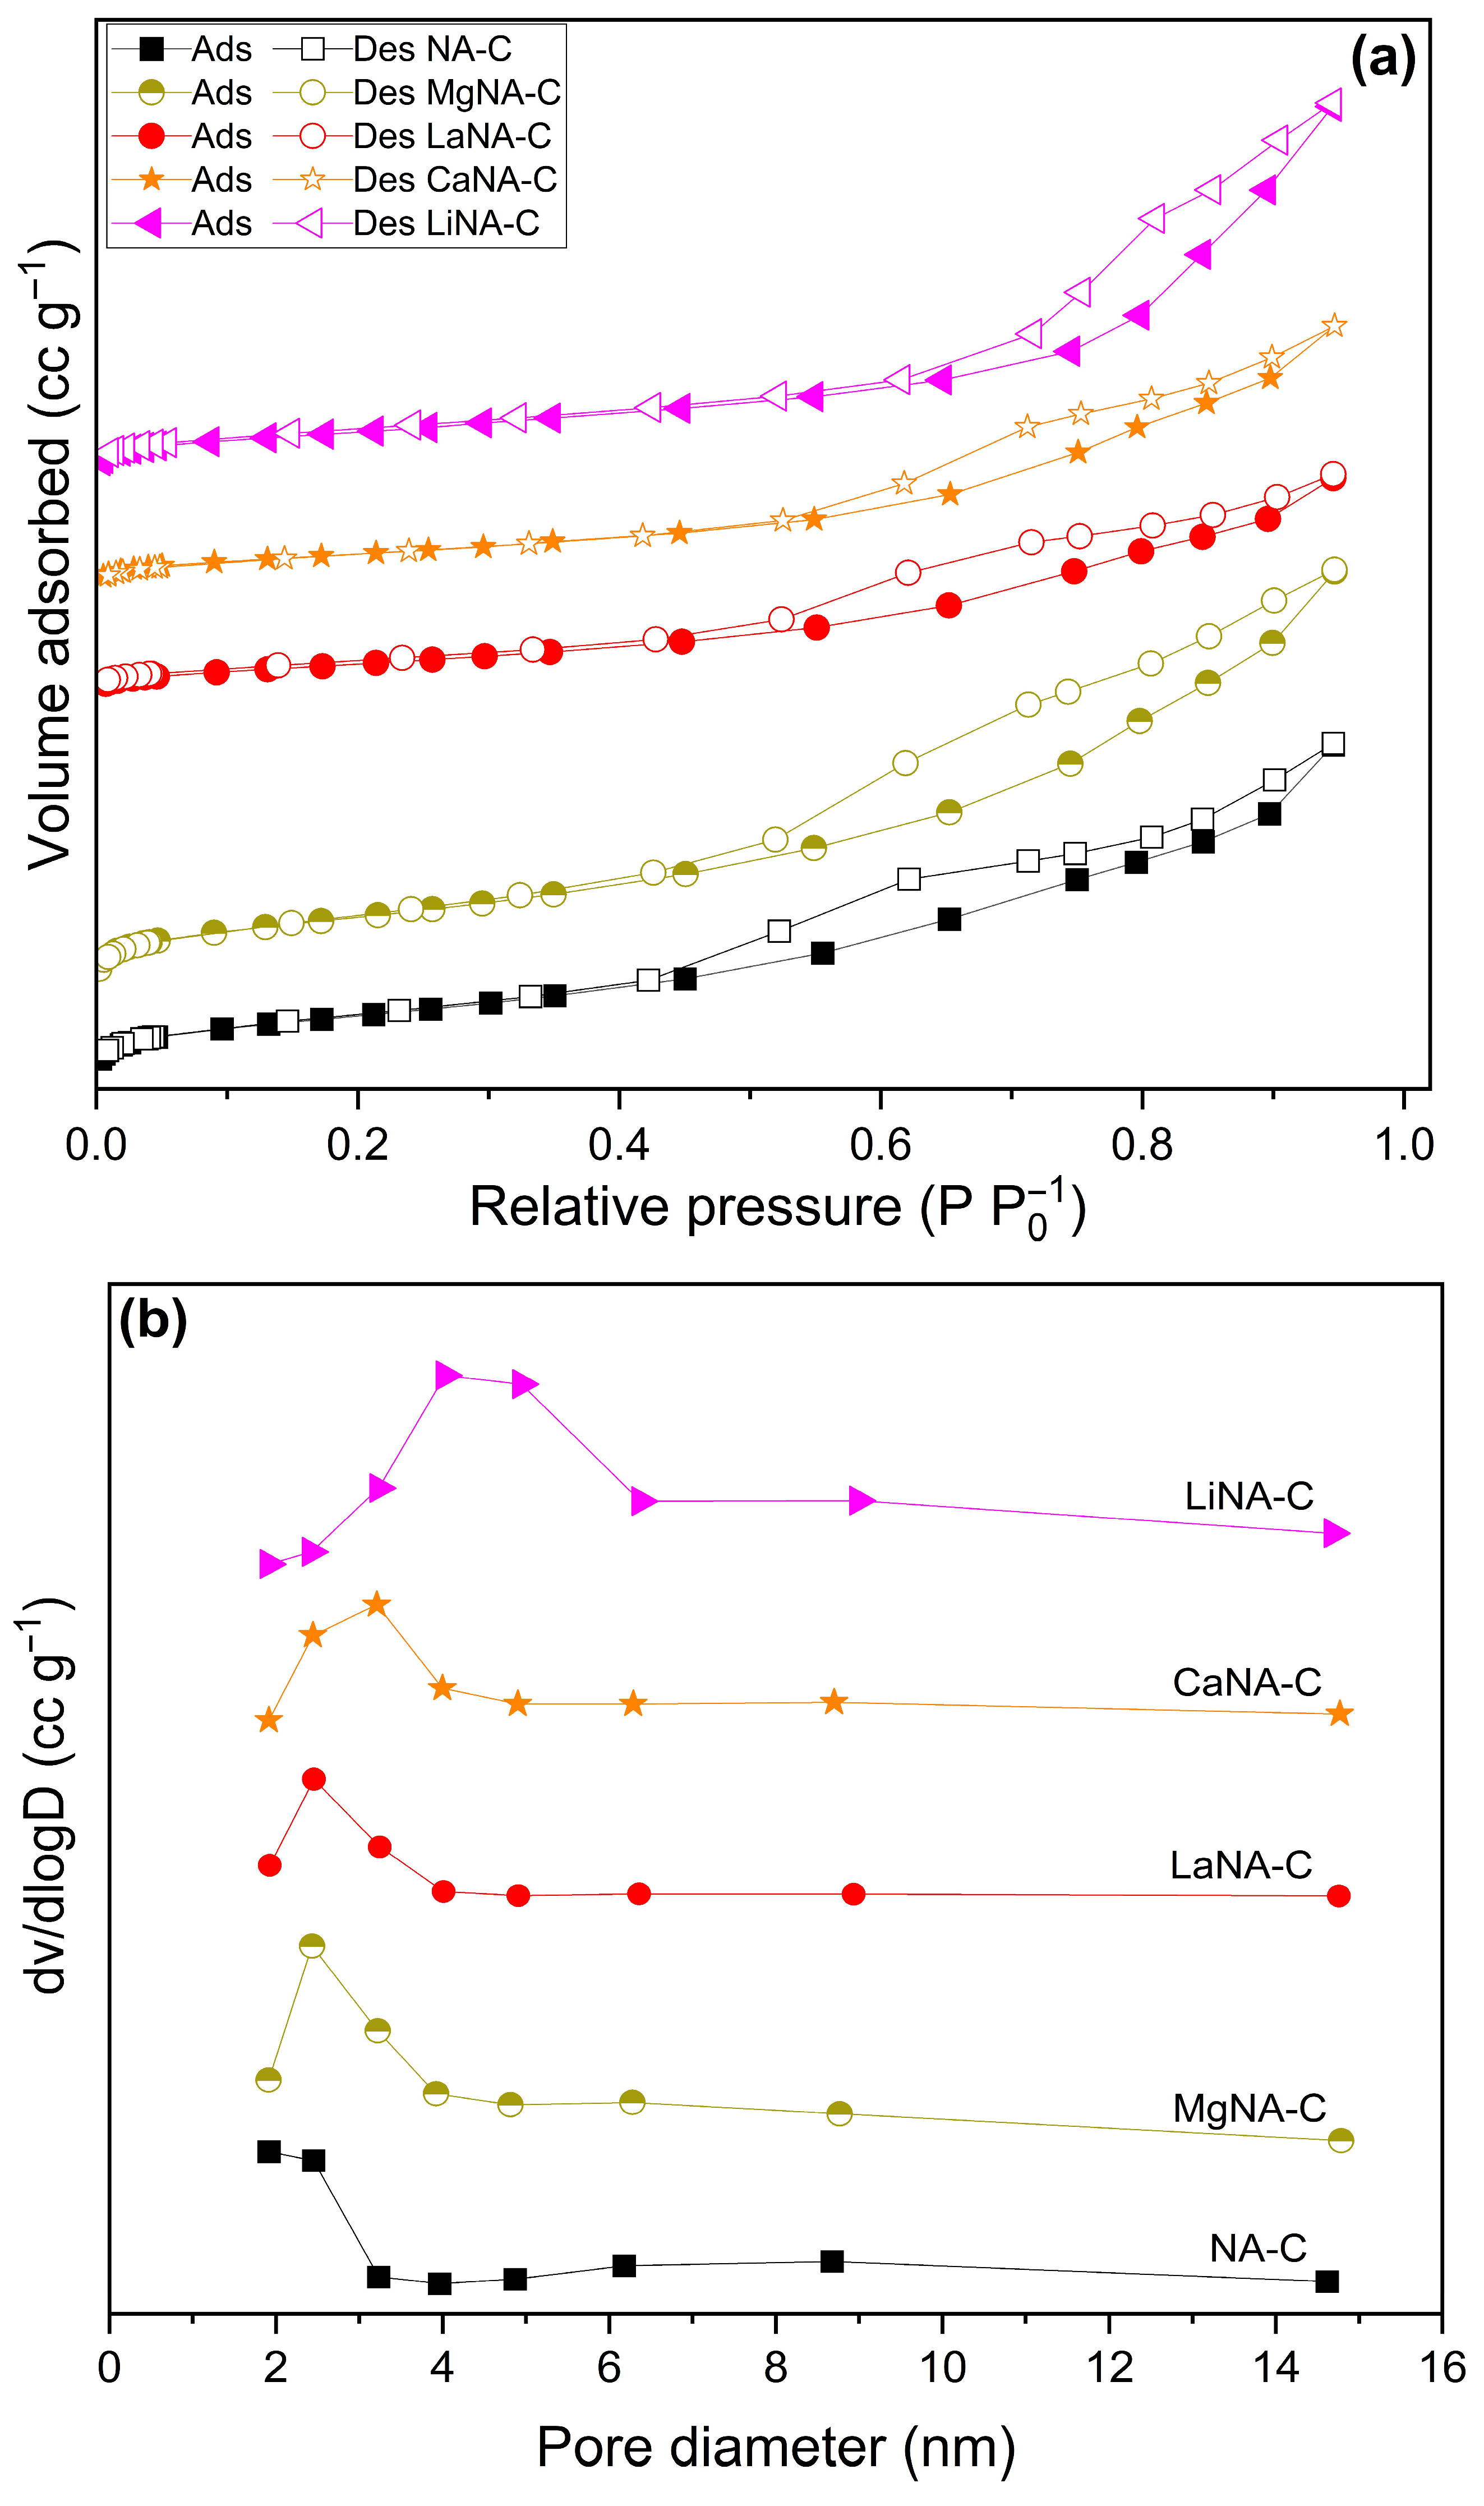
The specific surface area, pore volume, and pore diameter data obtained from N2 adsorption-desorption analyses are compiled in Figure 3 and Table 1. At the same time, results for NA-C and MgNA-C samples are found in Rosset et al. (2021) [38]. Notably, the reconstructed samples present a lower surface area than the NA-C sample, and the pore volume, except for the Li-containing samples, does not follow a clear trend. Additionally, the pore diameter increased in most samples, particularly in the LiNA-C sample. These results may be related to the incorporation of different metals during reconstruction into the lamellae, which obstruct the existing pores of Ni-Al and consequently hinder the total surface area after calcination, as well as cause pores to collapse, increase pore diameter, and diminish pore volume [55,56].
All samples presented isotherms typical of type IV(a), according to IUPAC recommendation, associated with mesoporous materials as evidenced by the pore diameter data (2–50 nm). At P/P0 ≤ 0.4, the adsorption and desorption curves coincide, representing monolayer adsorption on the surface. The samples exhibit hysteresis after that due to pore condensation, possibly covering pores not filled by condensate, as reported in type H3 hysteresis loops. This type of hysteresis is also associated with plate-like particles, which are usually found in clays, a material class to which LDH belongs [57].
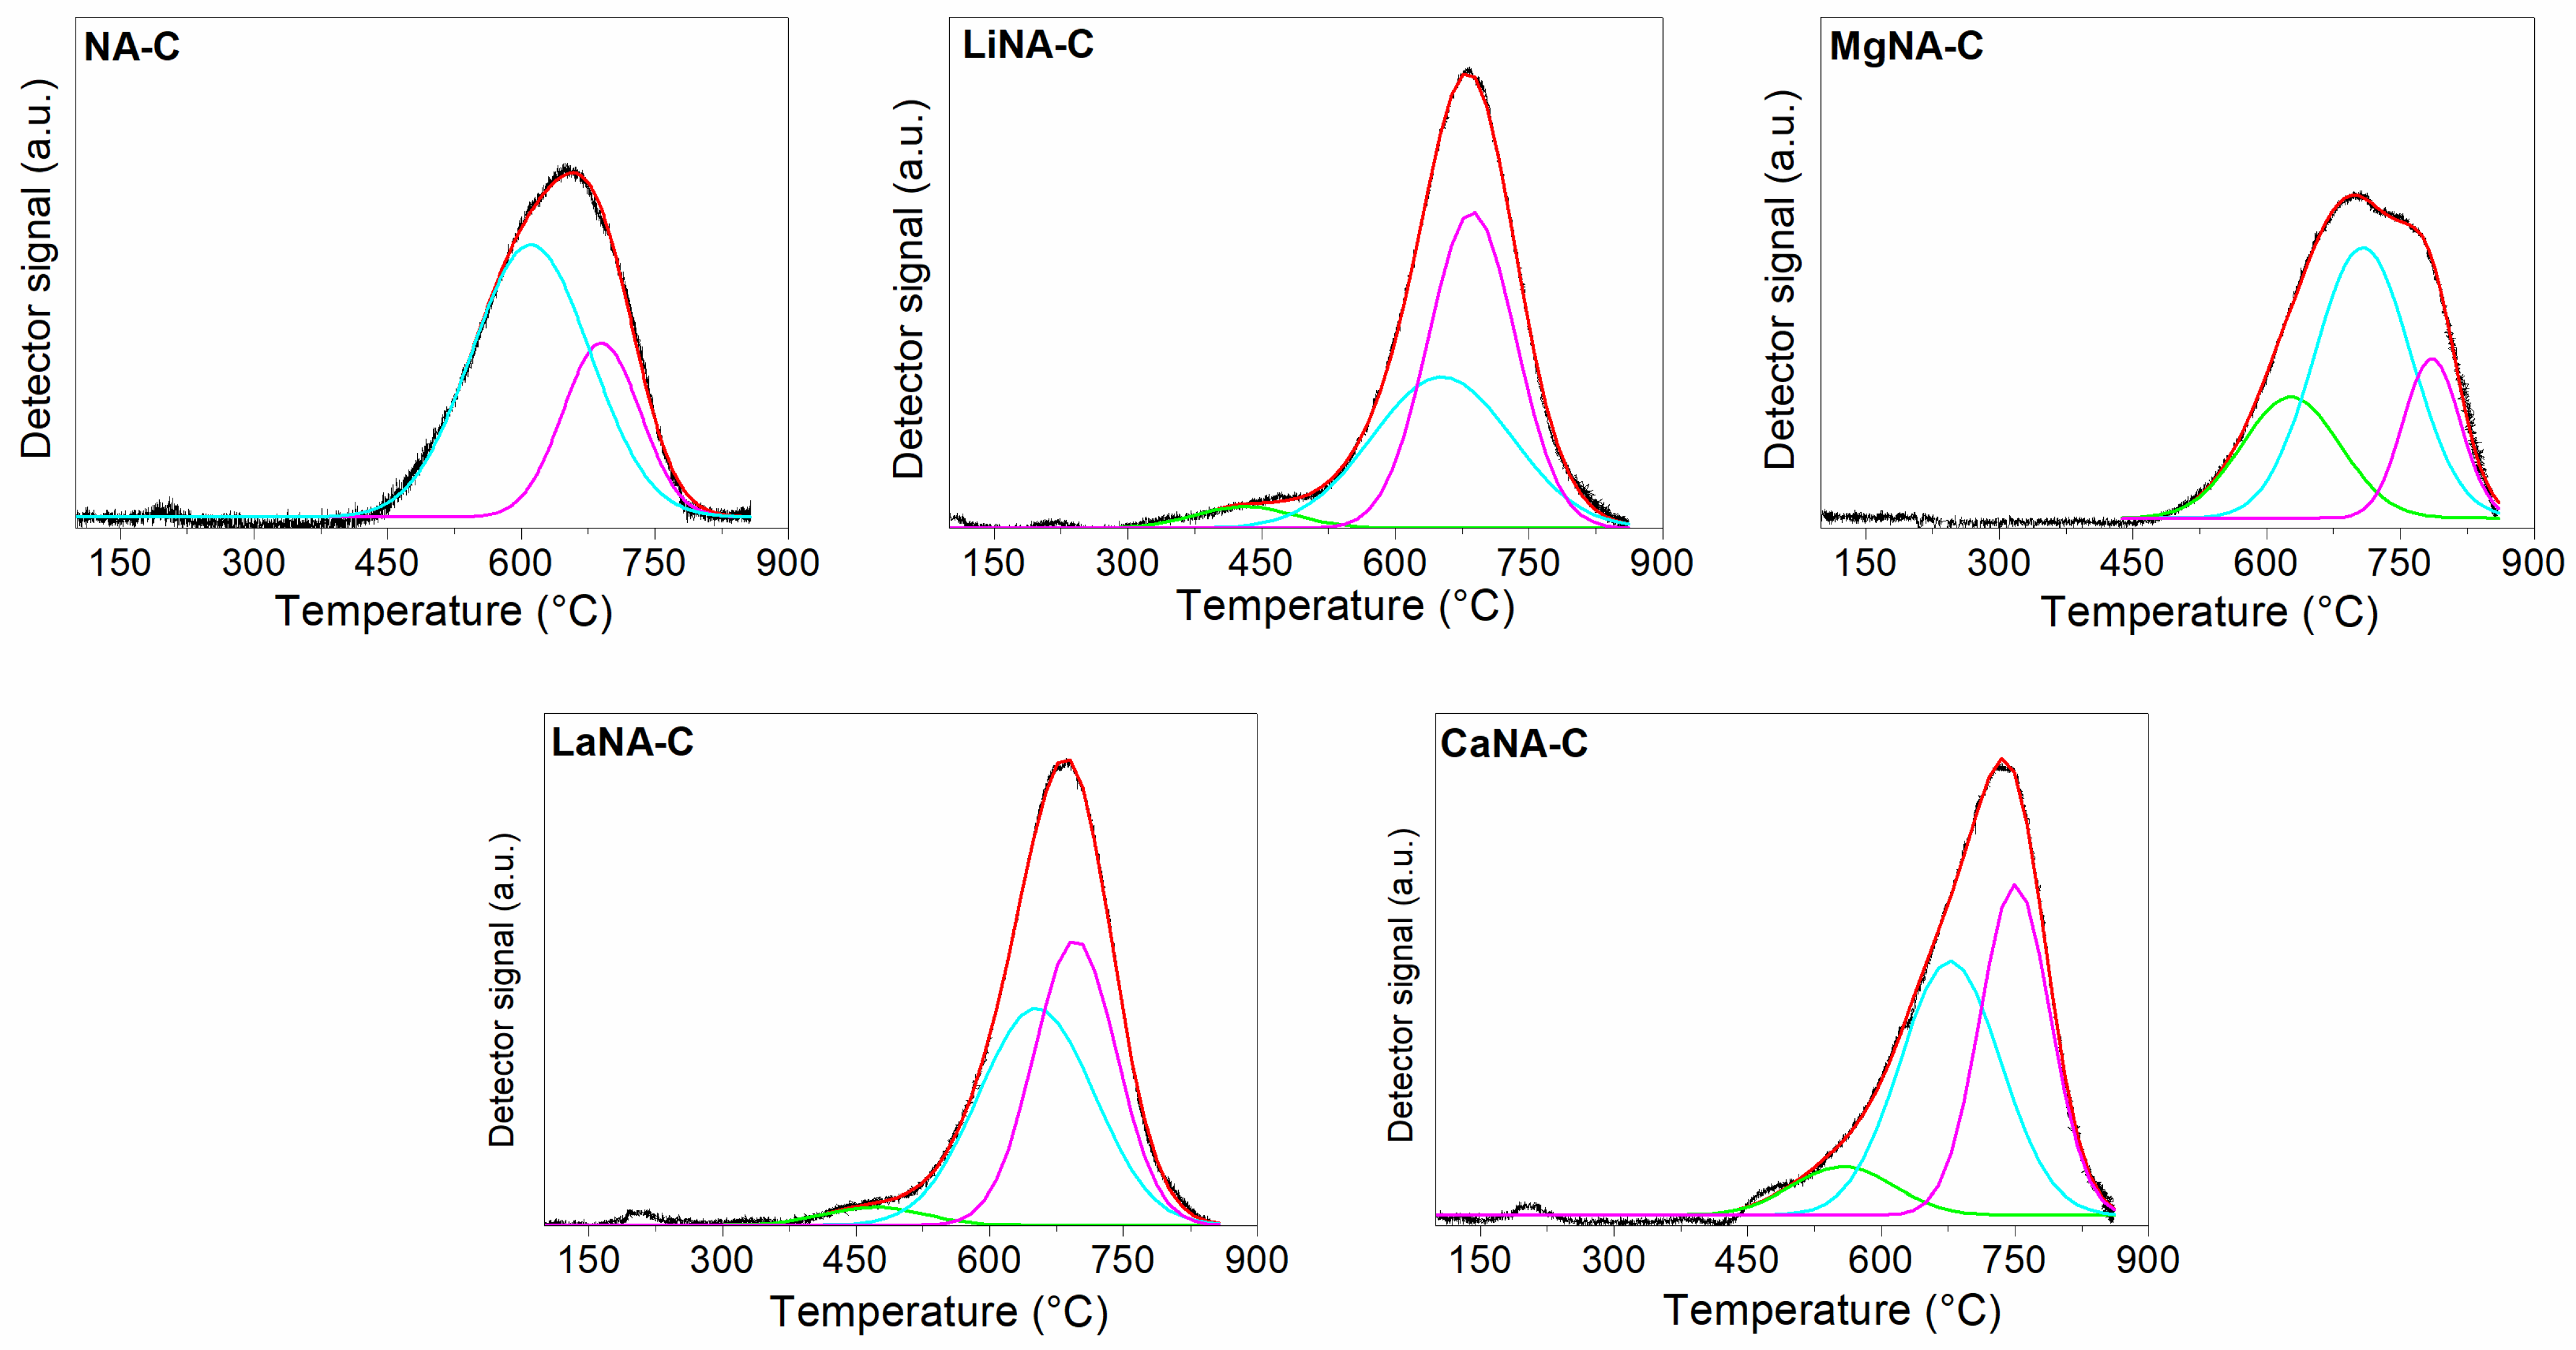
Figure 4 presents the CO2 desorption profiles Figure 4 presents the CO2 desorption profiles and the corresponding deconvolution curves using Gaussian functions, while Table 2 summarizes the peak temperatures and quantification of basic sites. All samples exhibit a broad, asymmetric main peak that is more intense at lower temperatures. Due to their asymmetry, deconvolution was applied, revealing three overlapping desorption peaks previously observed in the literature [38,58,59]. The first peak, ranging from 100 °C to 250 °C, is addressed to weak basic sites derived from surface hydroxyl groups (OH); from 250 °C to 350 °C related to medium-strength basic sites, related to Lewis acid-base metal oxide pairings (M2+-O2−); and 350 °C onwards related to strong basic sites due to adsorption on low-coordination surface O2− [52]. The NA-C sample primarily consists of medium- and strong basic sites, as well as high basicity. Despite the reconstruction of the samples with alkaline elements, their total number of basic sites decreased to less than half, except for CaNA-C and LaNA-C.
However, the average strength profile of the reconstructed samples was slightly modified. The LaNA-C sample maintained a higher number of medium to strong sites, like NA-C. The CaNA-C and MgNA-C presented a higher concentration of weak and medium sites, while LiNA-C showed a uniform distribution of basic sites among its profile. Although the temperature range did not change for the weak basic sites, it did for the medium sites of the CaNA-C and MgNA-C samples, as well as for the strong sites of the CaNA-C samples, implying that the strength of these sites increased, even if it does not translate to improved basicity. The opposite was observed in the strong basic sites of LaNA-C and LiNA-C, whose temperatures were shifted to lower values, indicating weaker basicity in this region.
The reduction profiles of the calcined samples are depicted in Figure 5, while the peak temperatures and fraction areas are summarized in Table 3. All samples present the main peak, usually around 600–700 °C, corresponding to the reduction of NA mixed oxides to Ni0; these oxides present high interaction between Ni and Al [60,61,62] with low-sized crystallites, therefore being hardly reducible. However, as this peak may comprise different species of mixed oxides, deconvolution was applied to the profiles, reveling three distinct peaks. The first peak may be associated with NiO highly interacting with Ni-Al mixed oxides or mixed oxides with higher Ni concentration than the stoichiometric mixed oxides (Ni/Al ≥ 3). In contrast, the second and third peaks are related to the reduction of inverse (Ni2AlO4) and normal (NiAl2O4) spinel-type mixed oxides, respectively [63,64].
The samples LiNA-C and LaNA-C exhibited a facilitated reduction, resulting in lower temperatures and increased Ni reducibility [37]. On the other hand, both CaNA-C and MgNA-C samples had their reduction temperatures shifted to higher ones, despite the increment in total reduction area, which is possibly related to the formation of mixed oxides of Ca-Al and Mg-Al, or even Ni-Ca-Al and Ni-Mg-Al due to incorporation in the lattice, that are more difficult to reduce than pure Ni-Al mixed oxides [65,66].
Except for the NA-C and MgNA-C [38] samples, the catalysts exhibited similar reduction areas between the second and third peaks, indicating the major presence of mixed oxide phases. In contrast, the highly concentrated Ni phase is much less prominent. The higher presence of the mixed oxides suggests a strong interaction between the metals, thus promoting a higher dispersion associated with low crystallite sizes [67,68].

3.2. Catalytic Activity

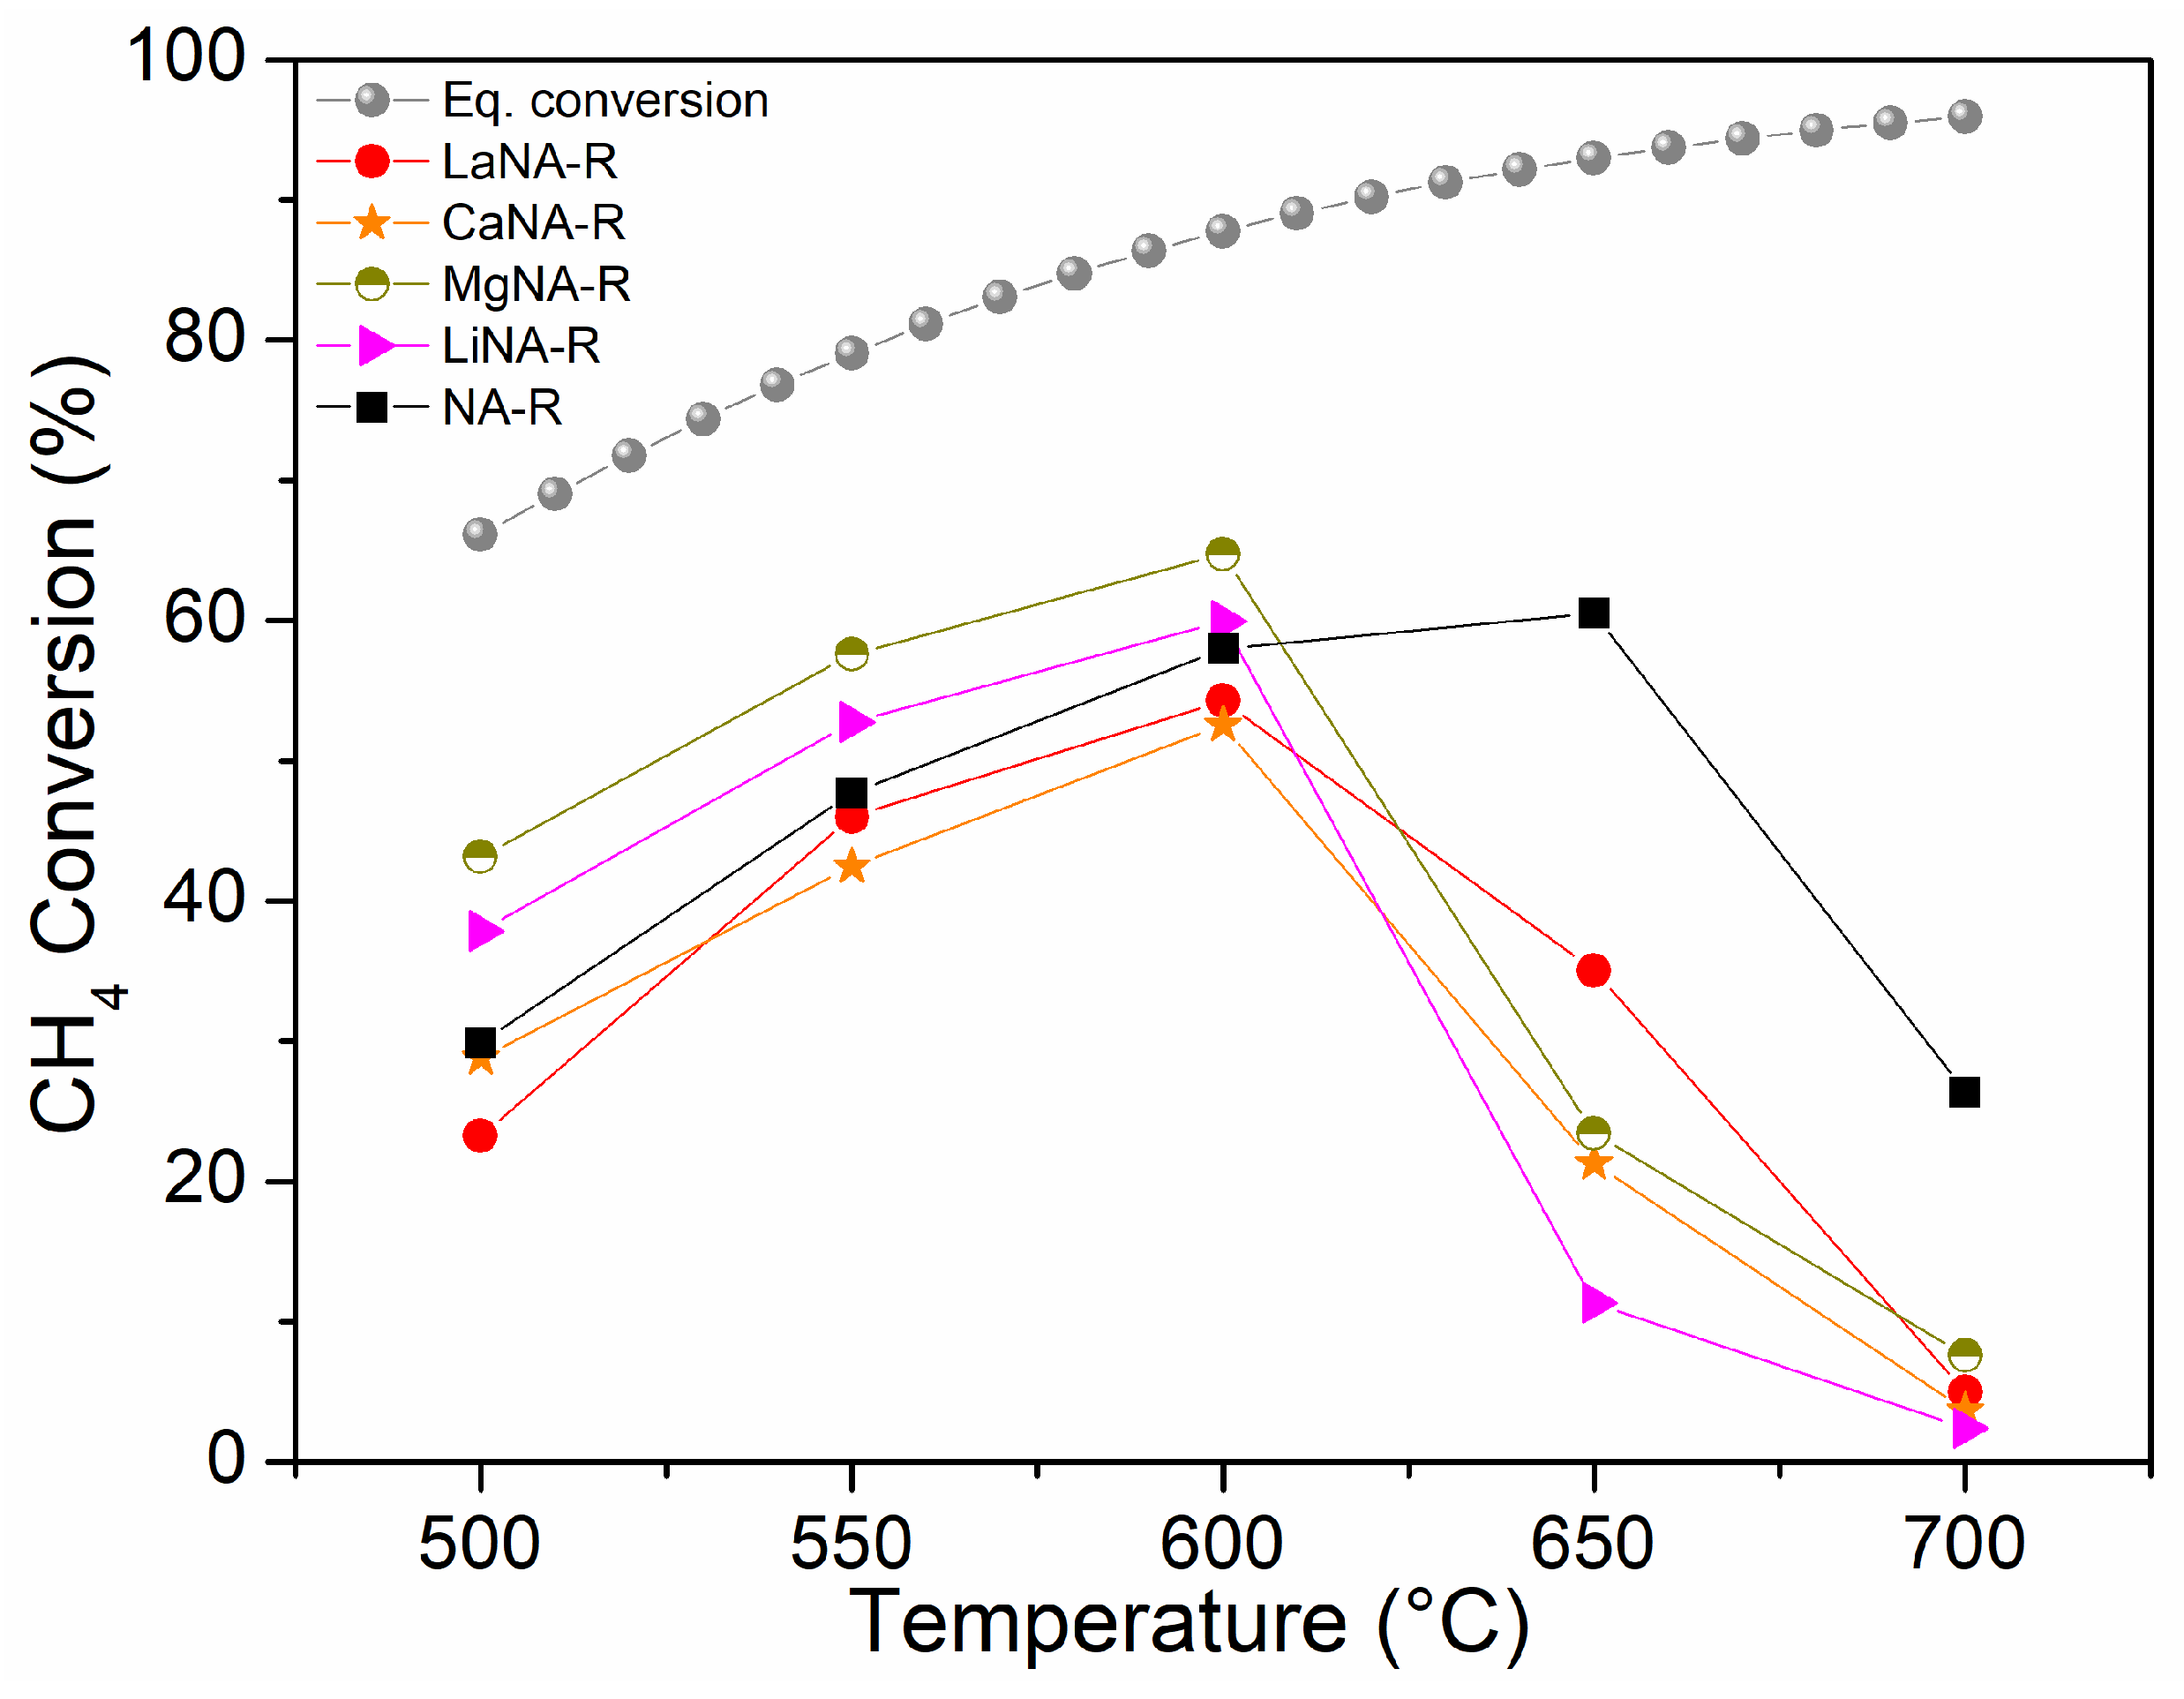
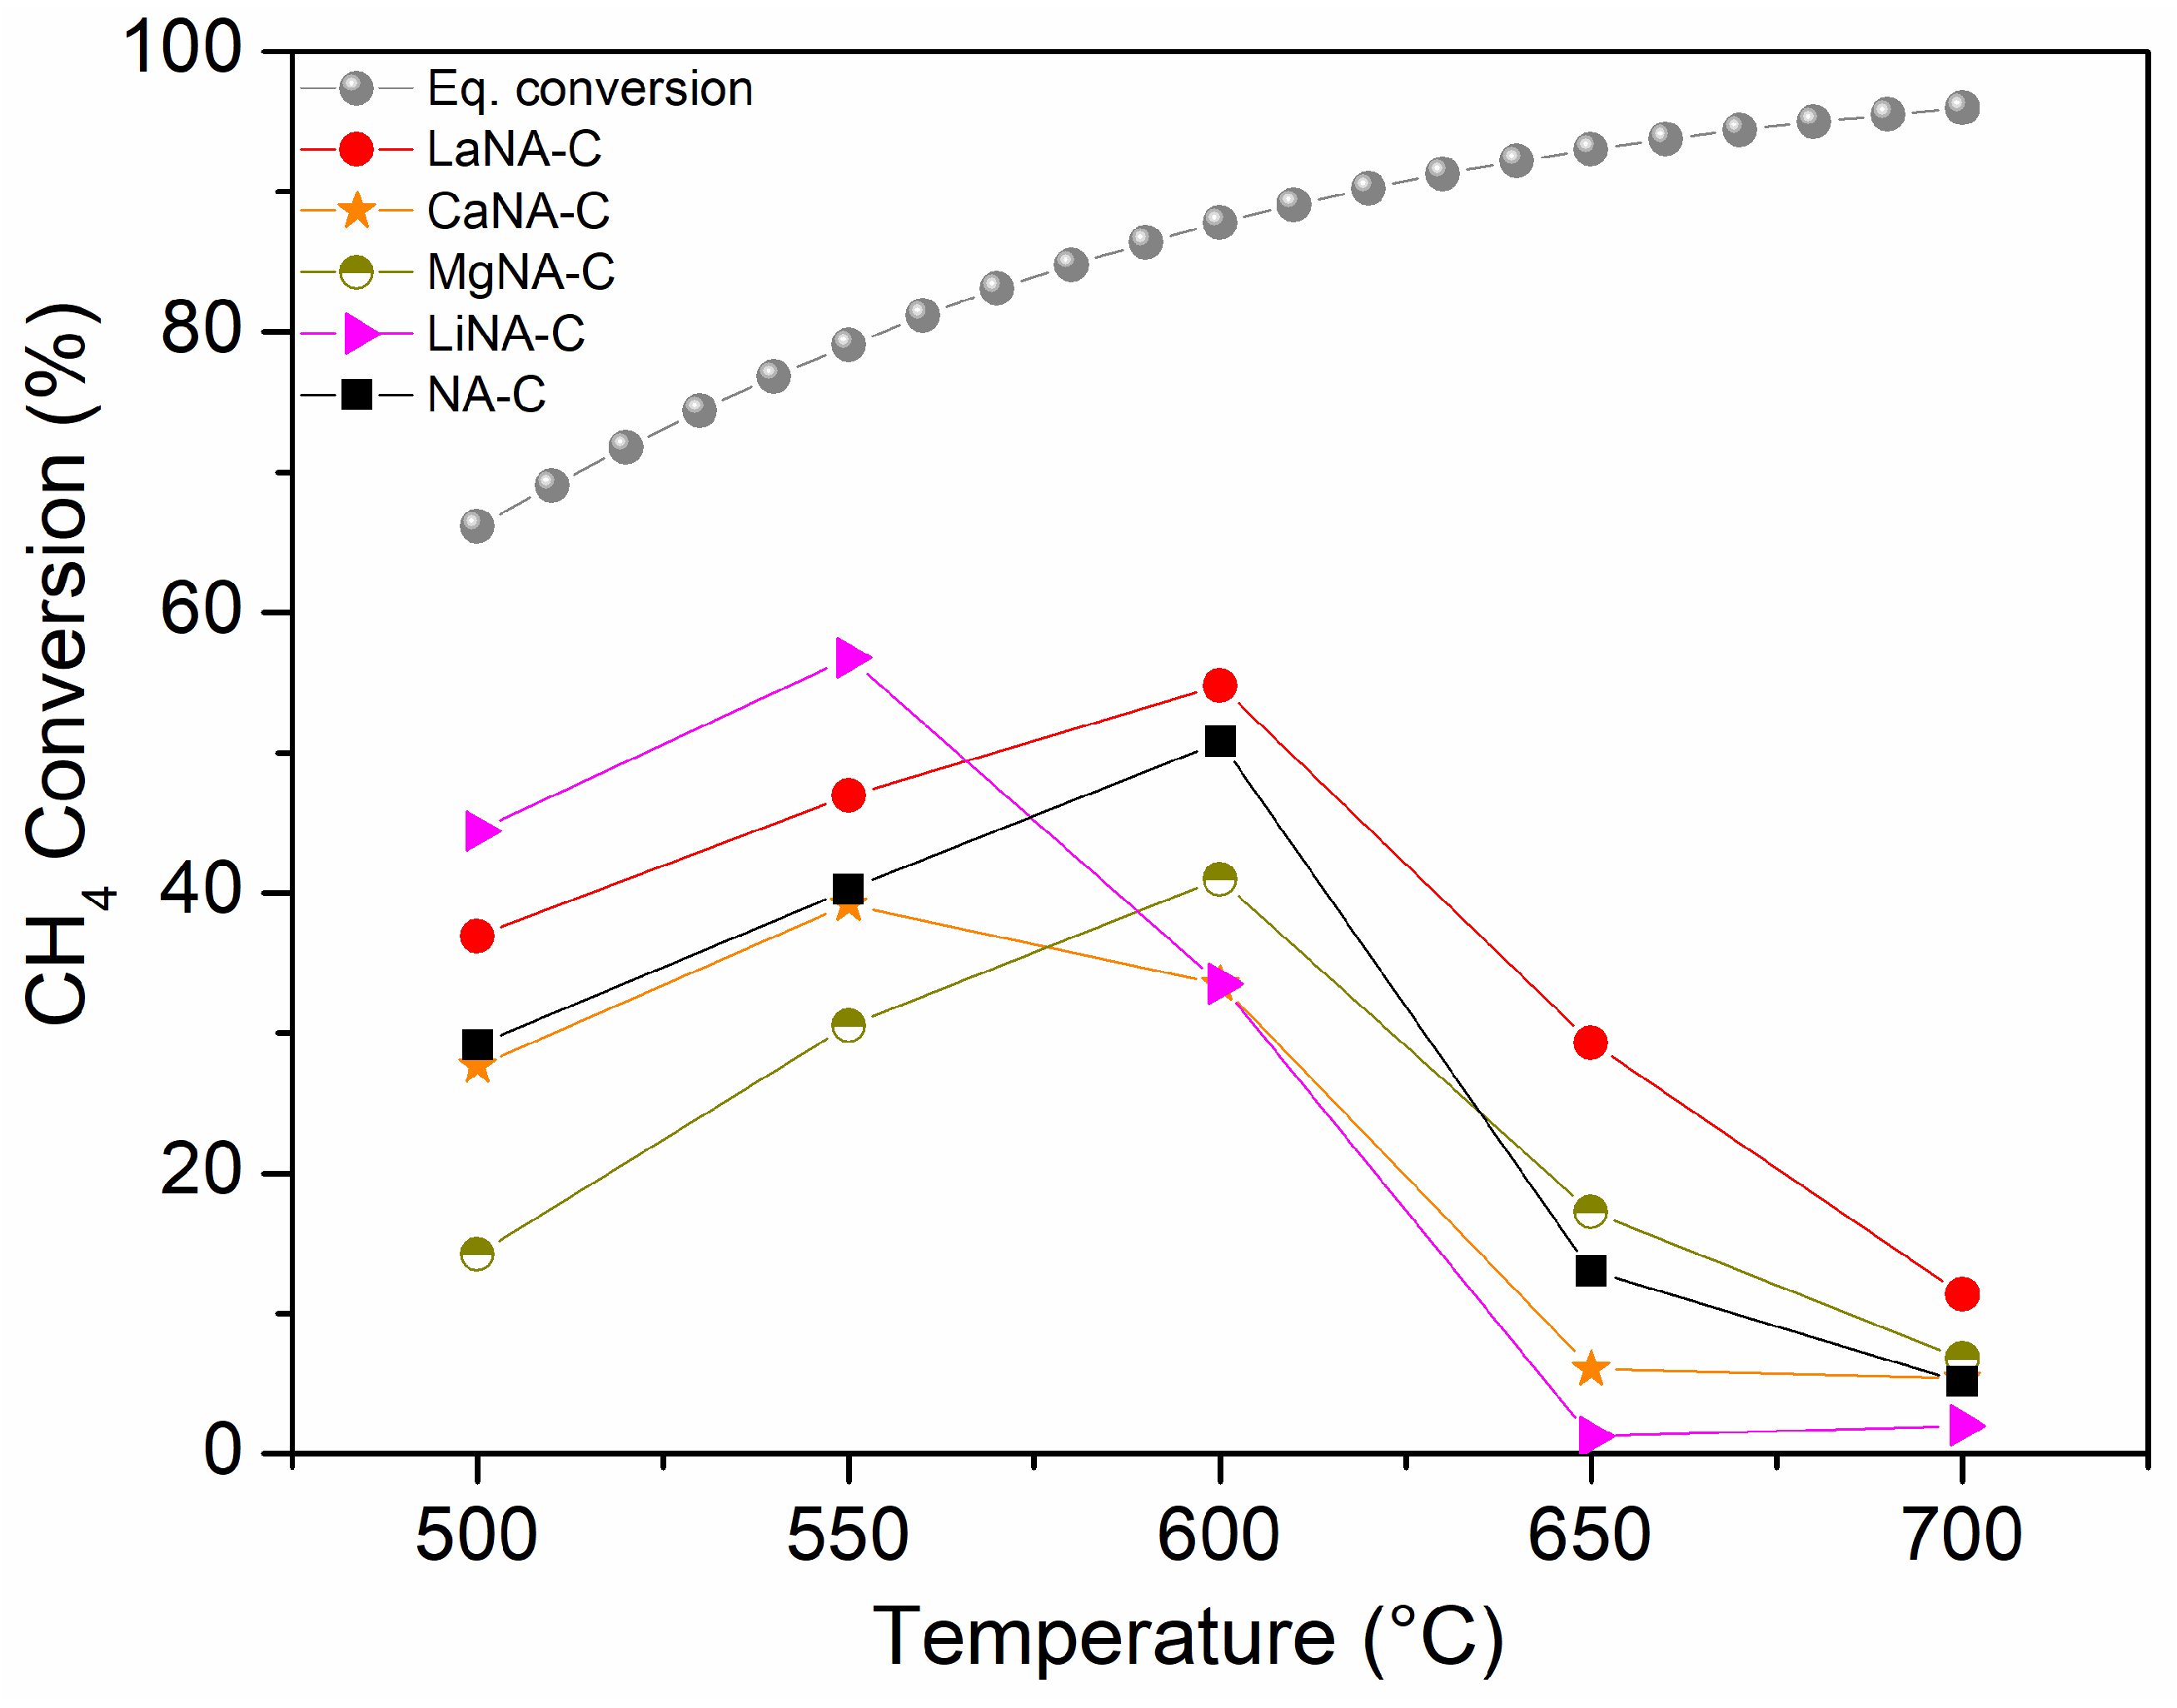
Figure 6 shows the CH4 conversion for samples activated with H2, while samples in Figure 7 were activated under the CH4 stream, ranging from 500 to 700 °C. The effect of temperature on the equilibrium conversion of methane is presented in Figure 6 and Figure 7 for a pressure of 1 bar and temperatures ranging from 500 °C to 700 °C. These were calculated based on the minimization of Gibbs free energy, considering the formation of solid carbon as a product, as predicted by the global reaction [69].
Among the samples previously activated with H2, most show increasing CH4 conversions from 20–40% to 60% between 500 and 600 °C, respectively, after which they deactivate. NA-R could still slightly increase conversion up to 650 °C (60%) before deactivating at 700 °C, whereas the reconstructed samples exhibited similar behavior, improving activity until 600 °C and then deactivating. In the range from 500 to 600 °C, the samples reconstructed with Mg and Li showed higher activity than NA-R. At 600 °C, the MgNA-R sample reached 65% CH4 conversion, presenting the highest activity among the catalysts under these conditions, while LiNA-R reached 60%, like NA-R.
Different behaviors were observed when catalytic tests were conducted without prior H2 activation, i.e., the samples were heated under a CH4 stream. The NA-C catalyst has not surpassed 50% CH4 conversion at 600 °C and, unlike the reduced catalyst, strongly deactivates thereafter. These results can be attributed to the fact that CH4 is a “softer” reducing agent than H2. Consequently, the reduction of nickel oxides (bulk and mixed oxides) under CH4 flow is expected to occur at higher temperatures compared to the reduction under H2 flow [70,71]. Regarding the reconstructed samples, generally lower activity was observed, especially after 600 °C when these were strongly deactivated. MgNA-C and CaNA-C samples performed poorer than the H2-activated tests. LiNA-C exhibited a slightly higher initial activity at 500–550 °C but then quickly deactivated. LaNA-C also presented a similar pattern when previously activated and heated with the CH4 stream, despite the latter reaching slightly higher CH4 conversions from 500 to 600 °C before deactivating. Among the CH4-activated samples, LaNA-C maintained higher activity throughout the temperature range, reaching the highest CH4 conversion of 55% at 600 °C. LiNA-C achieved a similar CH4 conversion of 57% at 550 °C, although it was severely deactivated at higher temperatures. This result may be related to the reduction pattern, as the sample has the lowest activation temperatures despite being more prone to deactivation due to sintering at high temperatures.
The higher activity of the MgNA-R sample when H2-reduced compared to the CH4-activated test may be related to the small crystallite size of the sample and, thus, high dispersion. In contrast, a higher amount of carbon is formed during activation under CH4, hindering its activity. A similar observation can be made for NA-C, CaNA-C, and LiNA-C, although their larger crystallites diminished their activity compared to MgNA-C. LaNA-C, therefore, presented higher activity when activated with CH4, which could be due to their smaller crystallite sizes and the improved resistance to carbon deposition. Possibly, La protected Ni from being covered by carbon or confined on the structure, also preventing it from being carried away by carbon filaments.
While sintering likely occurs due to the growth of crystallite sizes, given the high temperatures to which the catalysts were subjected, the most likely cause of deactivation is assigned to carbon deposition on the surface, which blocks the active sites, with different deactivation mechanisms depending on the type of carbon formed [72]. The slower activation of Ca- and Mg-reconstructed samples when heated with CH4 compared to those previously reduced may be explained by the reduction of these samples being more difficult due to higher reduction temperatures, as seen in the TPR analysis, and consequently not activated properly; a previous reduction step is necessary to activate them. These results indicate that despite slightly higher conversions that could be obtained through a reduction step previously to the reaction, the activation during heating and reaction starting directly with CH4 flow is advantageous, as low or no H2 would be spent to activate the catalyst in a process that envisions producing H2.
The experimental results demonstrate that methane conversion increases with temperature, closely following the thermodynamic equilibrium curve up to approximately 600 °C. However, beyond 600 °C, a noticeable decline in CH4 conversion is observed, diverging from the expected equilibrium behavior. This decrease is likely attributed to catalyst deactivation, possibly due to carbon deposition, leading to reduced catalytic efficiency at higher temperatures.
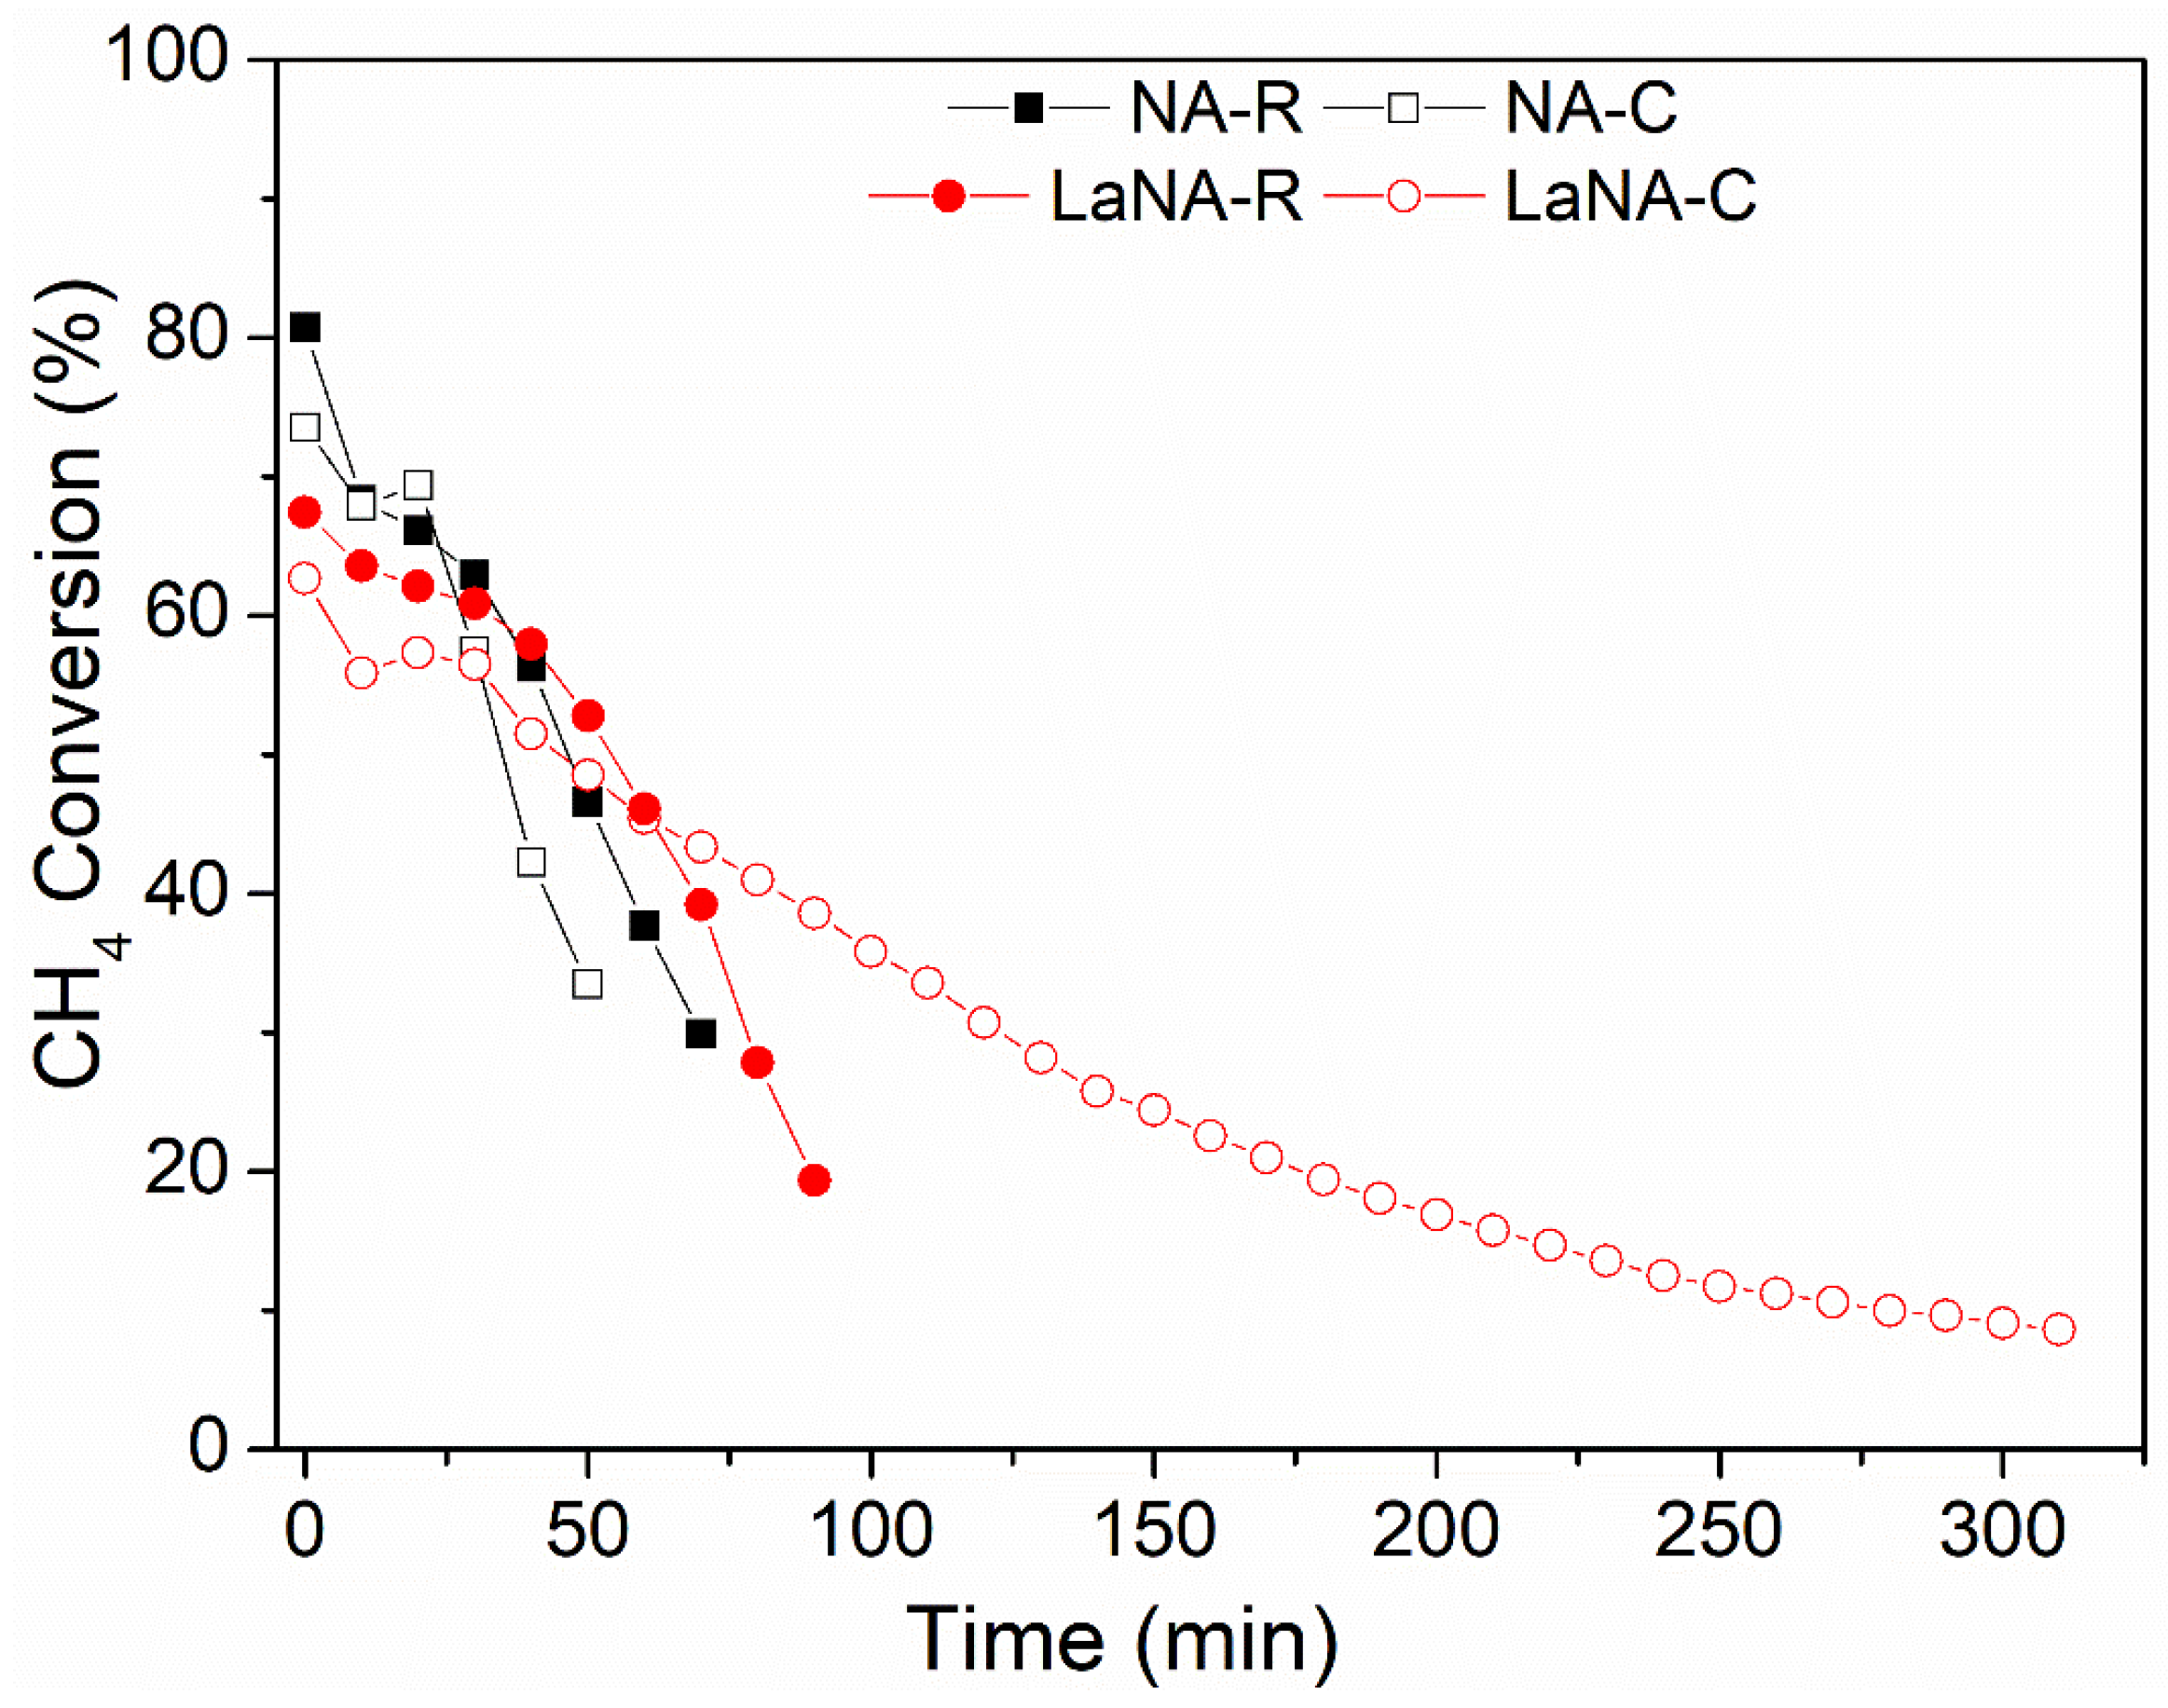
Both H2-activated and CH4-heated samples underwent stability tests at 700 °C for 300 min, with CH4 conversions shown in Figure 8. The LaNA(-R and -C) and NA(-R and -C) samples were selected from those prepared due to their similar activity patterns in the previous tests, the smallest crystallite size, and as a comparison base, respectively.
The NA catalyst could not surpass 50 min of reaction when H2-reduced and 70 min when CH4-heated, strongly deactivating from 80–75% to 30% of CH4 conversion; however, the catalyst could still be active, and the internal reactor pressure highly increased due to the carbon accumulation over the catalytic bed, enabling the tests to be continued. This behavior was also observed in the LaNA-R samples when H2-reduced, as it did not last more than 100 min of reaction, with CH4 conversion dropping from 70% to 20%.
However, when the LaNA-C sample was heated with CH4, the reaction could be performed for 300 min, even though the sample was constantly deactivated, starting with a CH4 conversion of around 65% and ending at 10%. As observed in the temperature-ramp tests, the primary cause of deactivation is the deposition of carbon over the active sites and/or the formation of carbon filaments (CNFs) or nanotubes (CNTs) that remove the metal from the surface. Except for LaNA-C, the deactivation in the stability tests was rapid and intense, resulting in bed growth that increased the reactional pressure. In this view, La could improve resistance to carbon deactivation by hindering its formation, although it could not be completely avoided.

Suggestion of the Reaction Mechanism of Catalytic Methane Decomposition (CMD)

The mechanism of the CMD reaction was based on combining Langmuir–Hinshelwood surface reactions with a dissolution–precipitation model typical of carbon nanostructure growth on Ni catalysts, as shown in Figure 9 [73,74]. Methane gas (CH4 (g)) is first adsorbed onto active nickel sites (Ni0), represented by “*”. Subsequently, (CH4*) undergoes stepwise dissociation of the C-H bonds, forming surface-bound intermediates (CH3*, CH2*, CH*, and C*) and hydrogen atoms (H*). Hydrogen desorbs from the surface as H2 gas. Surface carbon (C*) may either dissolve into the nickel bulk (dissolution) or be precipitated as carbon nanotubes (CNT). This cycle continues until the accumulation of carbon leads to the deactivation of the active sites through encapsulation or sintering of the Ni sites.

3.3. Characterization of Spent Catalysts

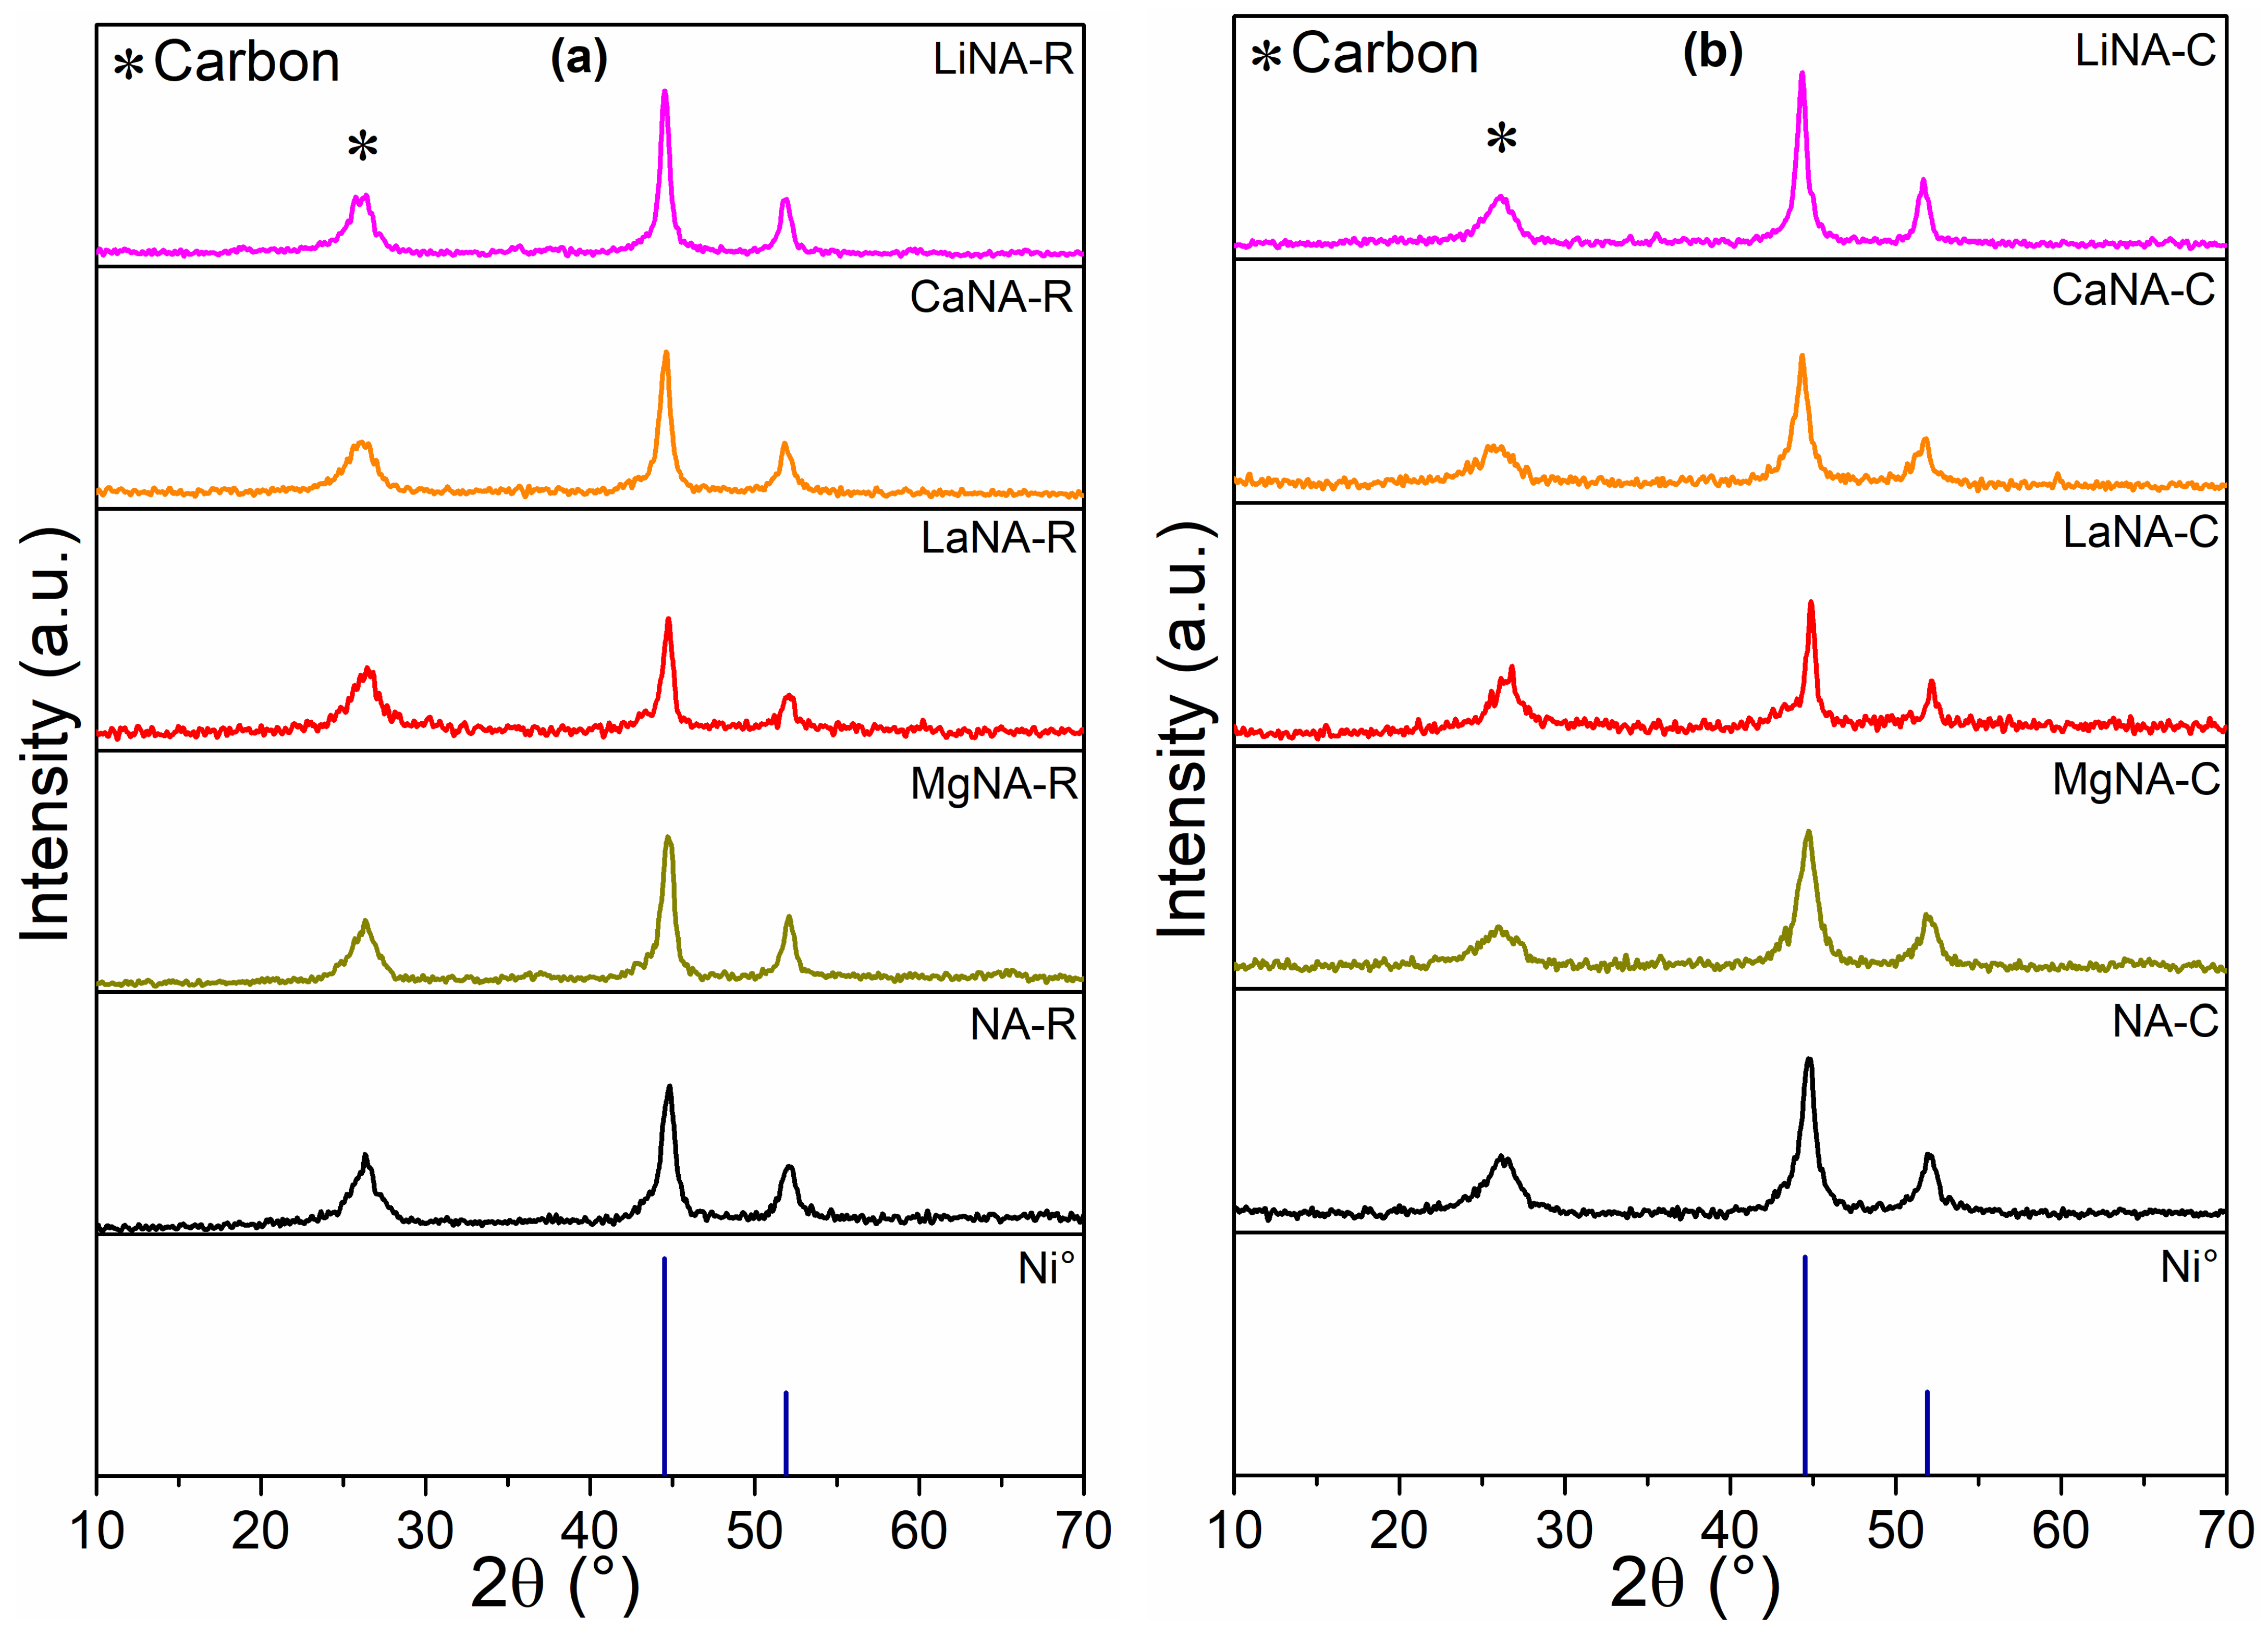
The XRD patterns of the samples spent in the temperature-ramp tests are depicted in Figure 10, representing samples reduced with H2 and heated with CH4 before the tests, respectively. All samples presented three main peaks, at 26°, attributed to carbon, and at 44.5° and 51.9°, related to Ni0, as observed in the reduced samples [36]. The carbon peak represents an overlapping of two different carbon types formed during the reaction: nanotubes (CNT) at 25.9° and graphitic (GC) at 26.3° [38].
Table 4 presents the crystallite sizes of H2-reduced and spent samples. After the ramp tests, most samples showed smaller sizes than fresh, reduced samples. Then, it is not possible to state that sintering occurred. Comparing the sizes of samples reduced with H2 and heated with CH4, NA (-C and -R), MgNA (-C and -R), and LiNA (-C and -R) after the tests, the results were similar, indicating that these samples can maintain a constant size regardless of the activation method.
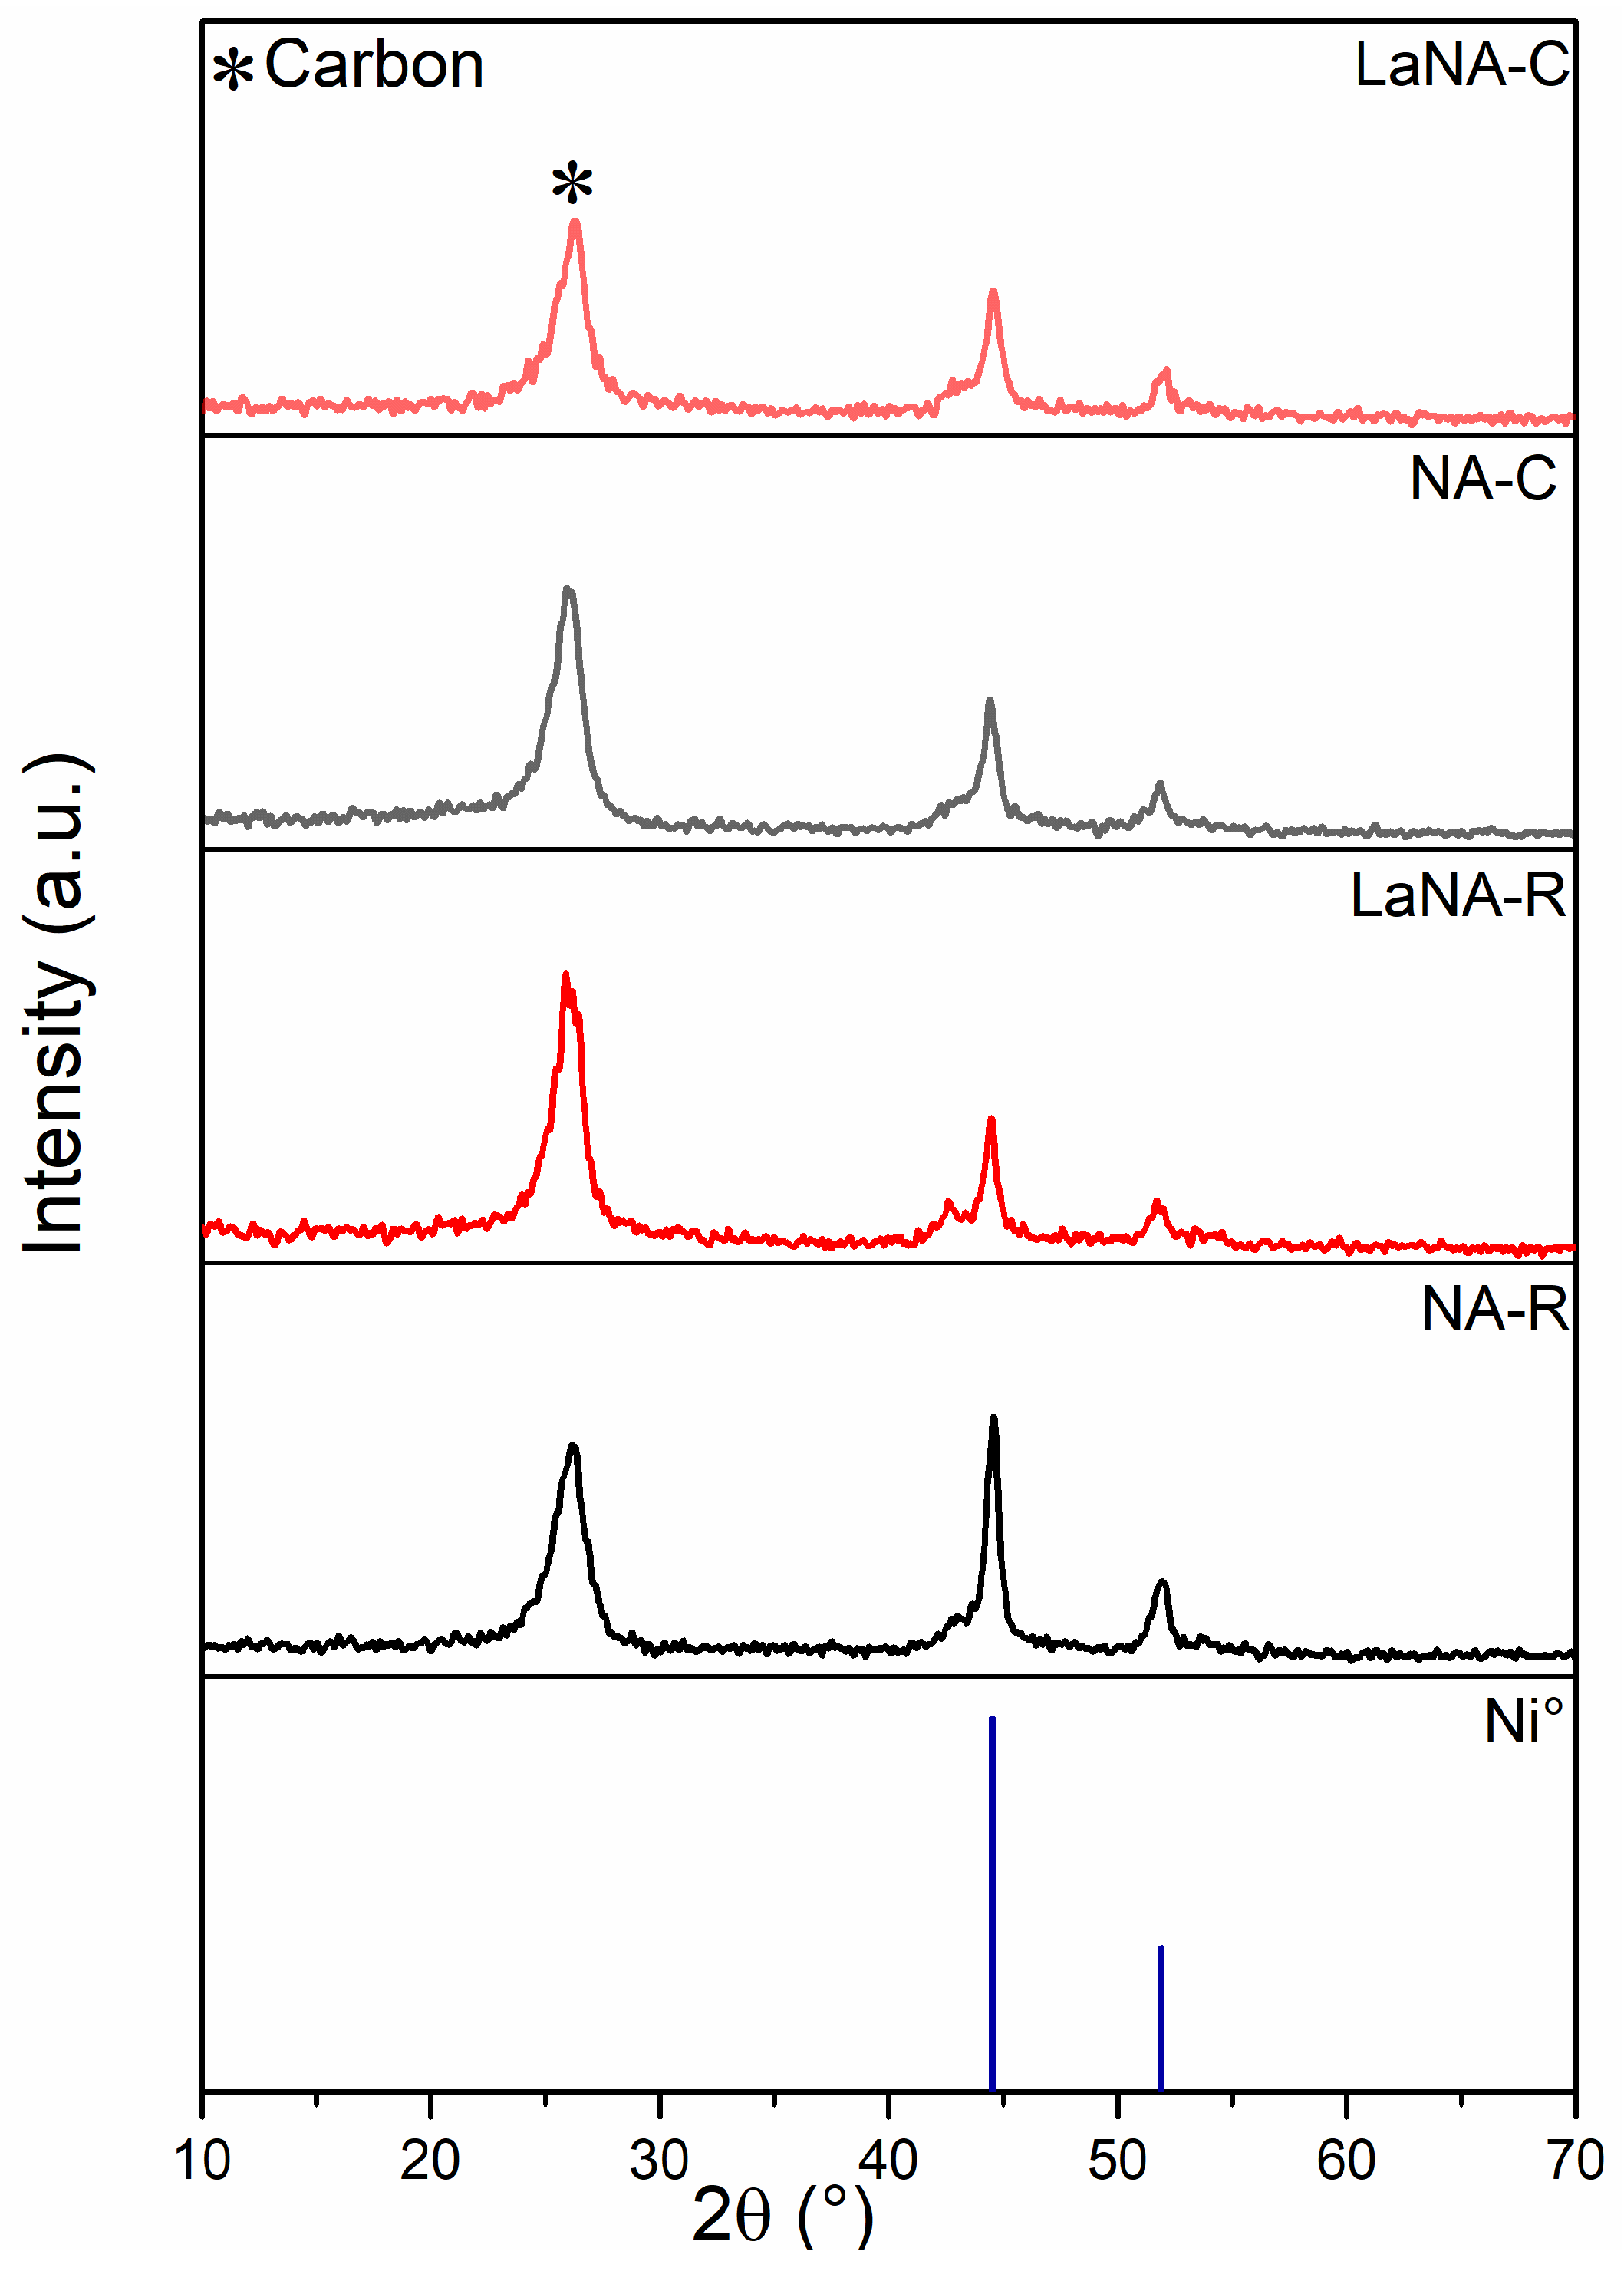
Similarly to the XRD patterns obtained after the temperature-ramp tests, those depicted in Figure 11 after stability present a peak at 26° related to carbon species and two peaks at 44.5° and 51.9°, ascribed to Ni0 after both H2-reduced and CH4-heated tests [36]. Furthermore, LaNA samples exhibit a small shoulder peak at 42.6°, attributed to unreduced Ni-Al-O species [45]. Comparing the crystallite sizes after reduction and stability tests (Tab. 4), the catalysts do not present a clear trend between H2-reduced and CH4-heated samples; however, LaNA had similar crystallite sizes independent of the activation path, even though both samples exhibited sintering.
The weight variation and DTA profiles obtained through TPO analysis of spent catalysts from stability tests are depicted in Figure 12a,b. The samples presented weight loss of around 70–80%, ranging from 400 to 700 °C, primarily attributed to the oxidation of carbon deposits, as confirmed by XRD analysis. The DTA indicates that the samples presented carbon deposits in graphitic and nanotube forms, depending on the oxidation temperatures [75]. The NA (-C and -R) samples have softer carbon, while the LaNA (-C and -R) samples have higher oxidation temperatures associated with harder carbon. NA-R is the only sample whose peaks are separate, indicating a higher number of filaments or nanotubes [70,71,76].
To both NA and LaNA samples, the H2-reduced (NA-R and LaNA-R) presented higher carbon formation rates than the CH4-heated (NA-C and LaNA-C), even considering their low reaction time (Table 5). This is consonant with the increased pressure on the system due to the high amount of carbon formed, possibly linked to a higher exposition of the active sites when reduced previously to the reaction.
Notably, carbon is formed even before the reaction begins during heating with CH4, although the carbon formation rates are lower. Additionally, the LaNA samples, particularly the LaNA-C, exhibited fewer carbon deposits, even though LaNA-C was the only sample that could withstand the entire reaction time. These results indicate that the higher resistance to carbon deposition conferred by La reconstruction is due to a protective effect of the active phase.
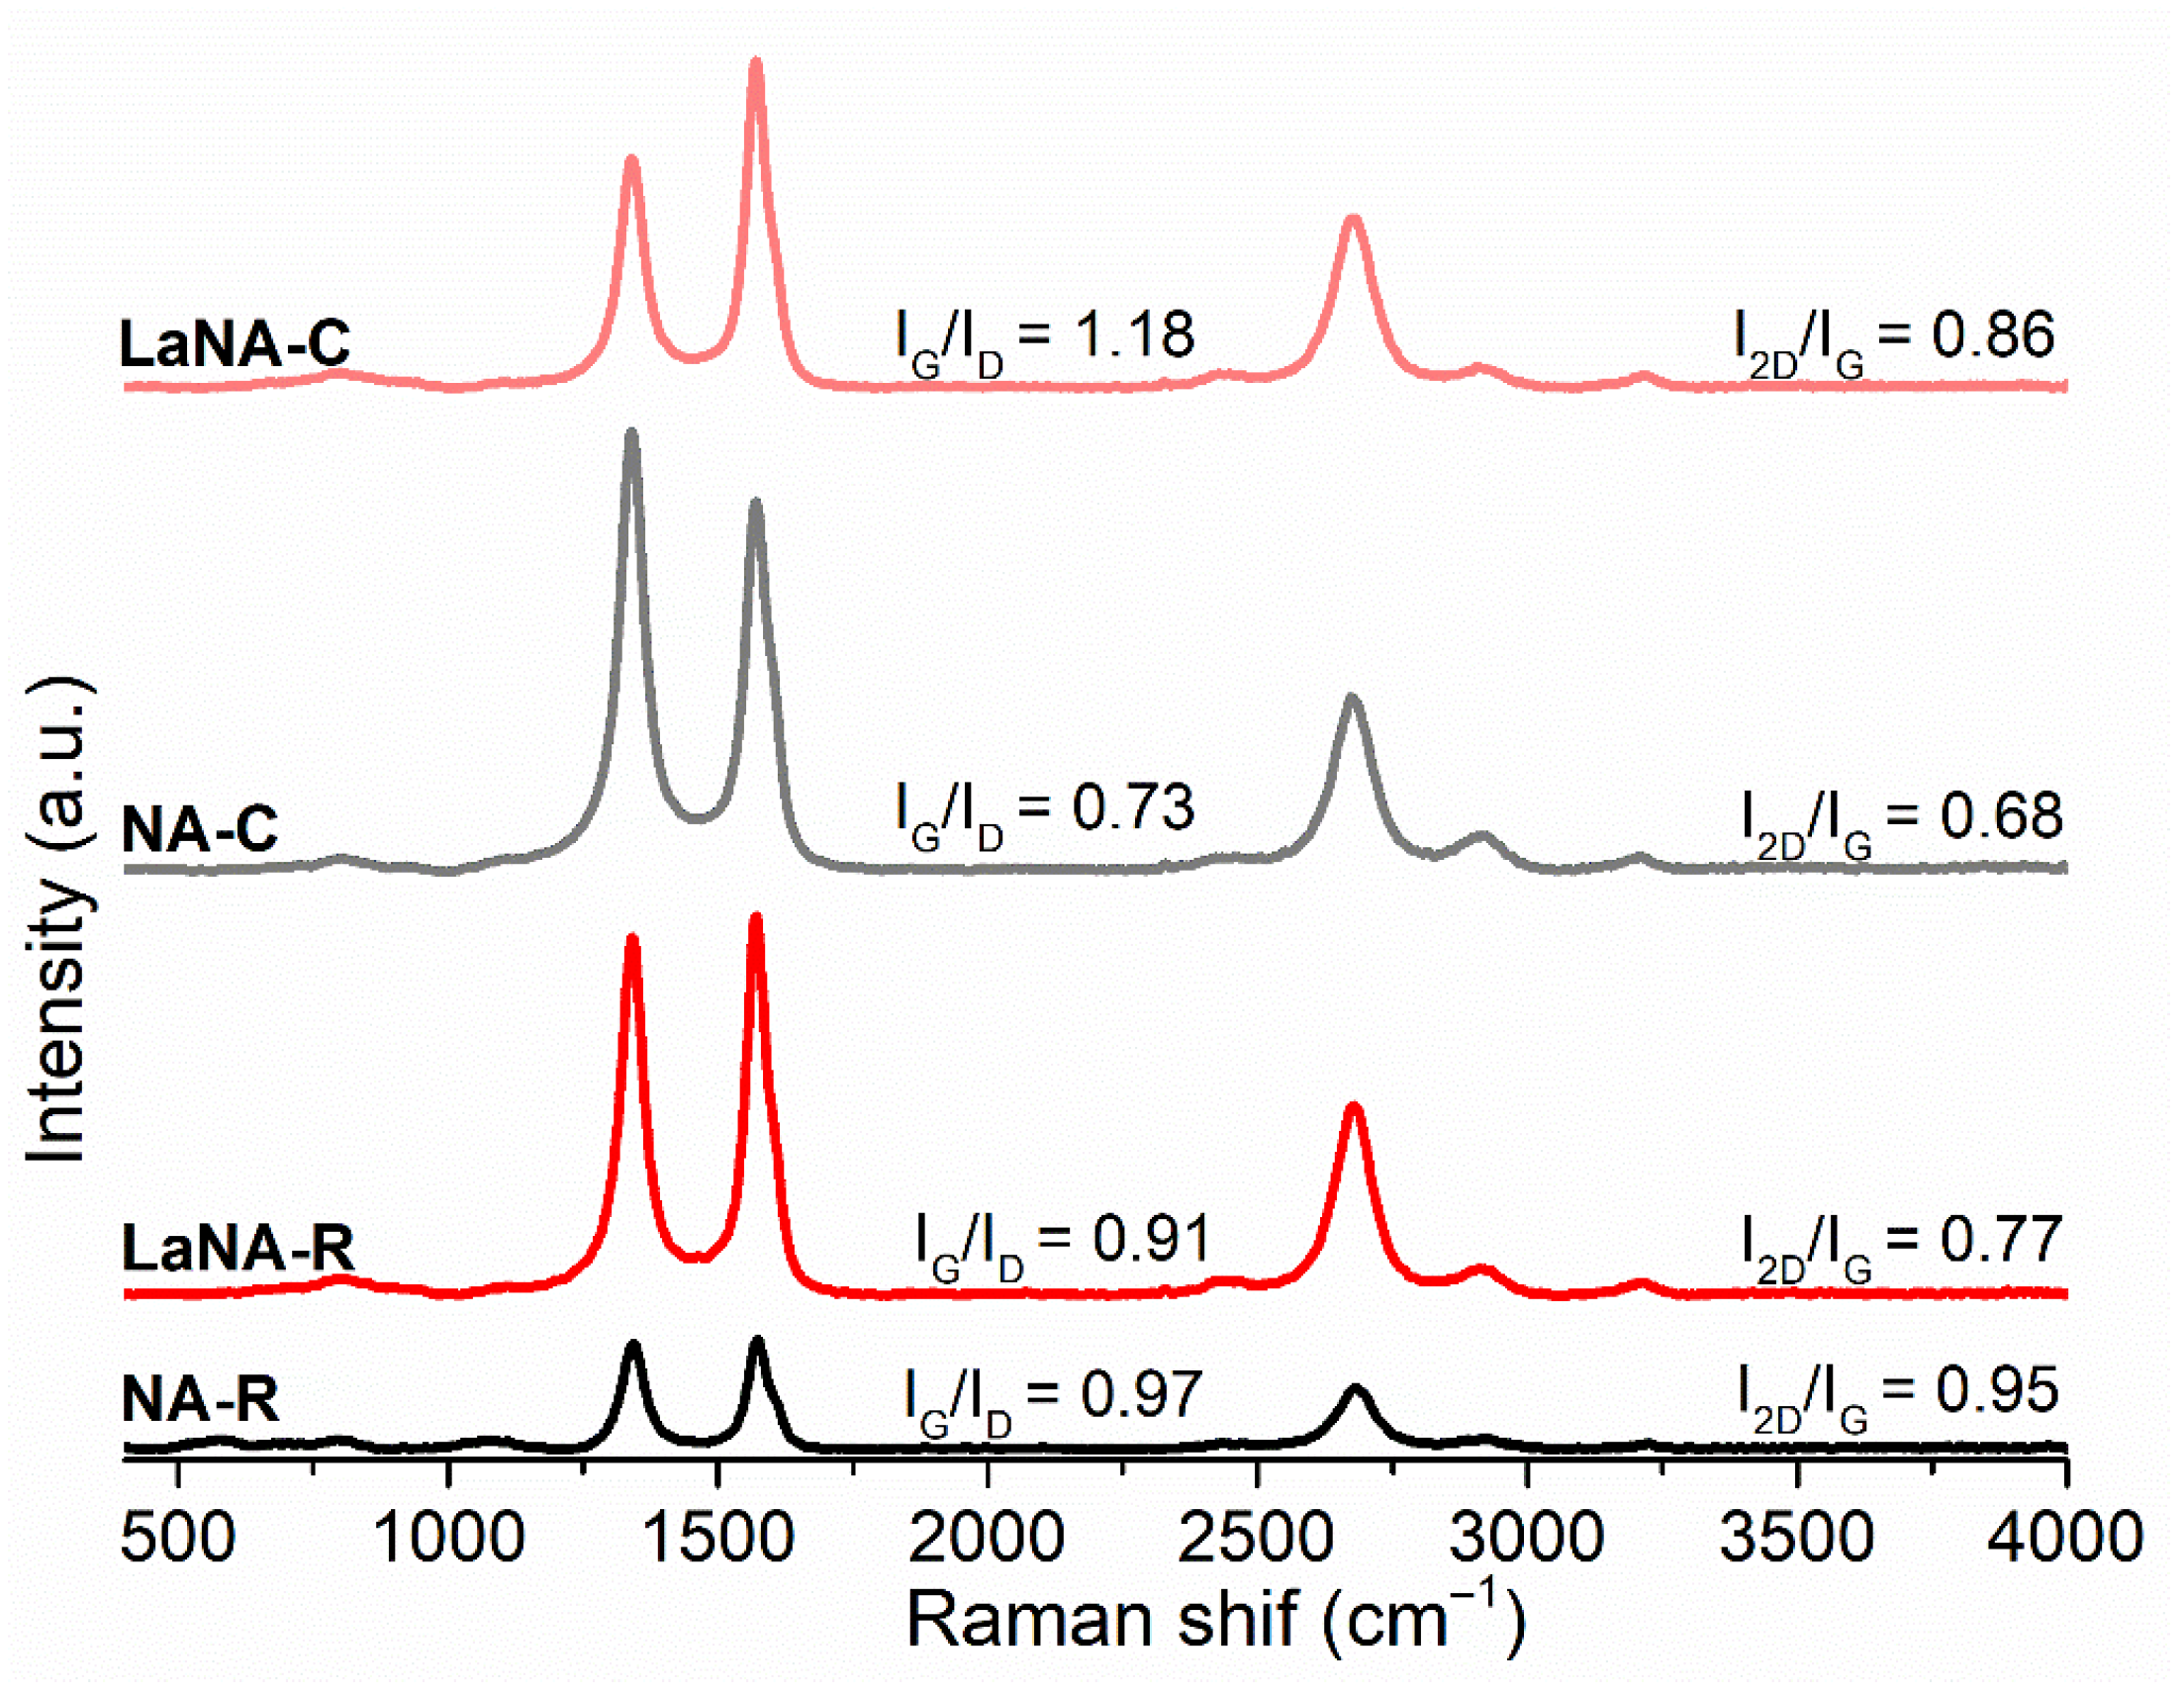
Raman spectroscopy was used to investigate the structural characteristics of the deposited carbon after the methane decomposition at 700 °C. In the spectra presented in Figure 13, the bands at 1342 cm−1 (D band), 1565 cm−1 (G band), and 2677 cm−1 (2D band) were identified for all catalysts. Although this technique could not directly determine the macroscopic morphology of carbon present on the catalysts, it provided insights into their degree of order or disorder, allowing one to infer the predominant carbon structure present [77,78,79].
The IG/ID ratio of less than 1 for most samples indicates a more disordered and defective carbon structure, while the low I2D/IG ratio suggests poorly ordered structures. Although the IG/ID ratios were not consistent across different activation methods or La promotion, these values provided some insights regarding the samples’ structures. For the NA-C sample (IG/ID = 0.73), the carbon structure is highly disordered (I2D/IG = 0.68), suggesting the predominant presence of amorphous carbon or highly defective graphitic carbon. This highly defective carbon is more likely to quickly deactivate [80,81,82]. The NA-R sample is considerably more graphitized (IG/ID = 0.97) than the non-reduced one and has a higher stacking order (I2D/IG = 0.95), which may be related to the presence of more carbon nanofibers (CNFs), although potentially with defective walls, leading to more ordered filaments. This structural characteristic slightly improved resistance to deactivation, as observed in catalytic tests (Figure 8).
For the La-promoted samples, the results diverge from the non-promoted ones regarding the activation method. The LaNA-C sample exhibits highly ordered or graphitized carbon (IG/ID = 1.18) with a high stacking degree (I2D/IG = 0.86), which strongly suggests the formation of well-graphitized carbon filaments (CNFs) with a low defect density. This type of carbon prevents disorganized carbon deposition and is associated with less prejudice to catalytic activity. The LaNA-R sample, on the other hand, exhibits a less ordered carbon structure (IG/ID = 0.91) and a lower stacking density (I2D/IG = 0.77) compared to LaNA-C. While still more ordered than NA-C, this suggests that for catalysts activated with H2, the presence of La may lead to a less ordered carbon structure in the CH4-heating activation, potentially indicating that the active phase was more prone to deactivation under these conditions [4,83].
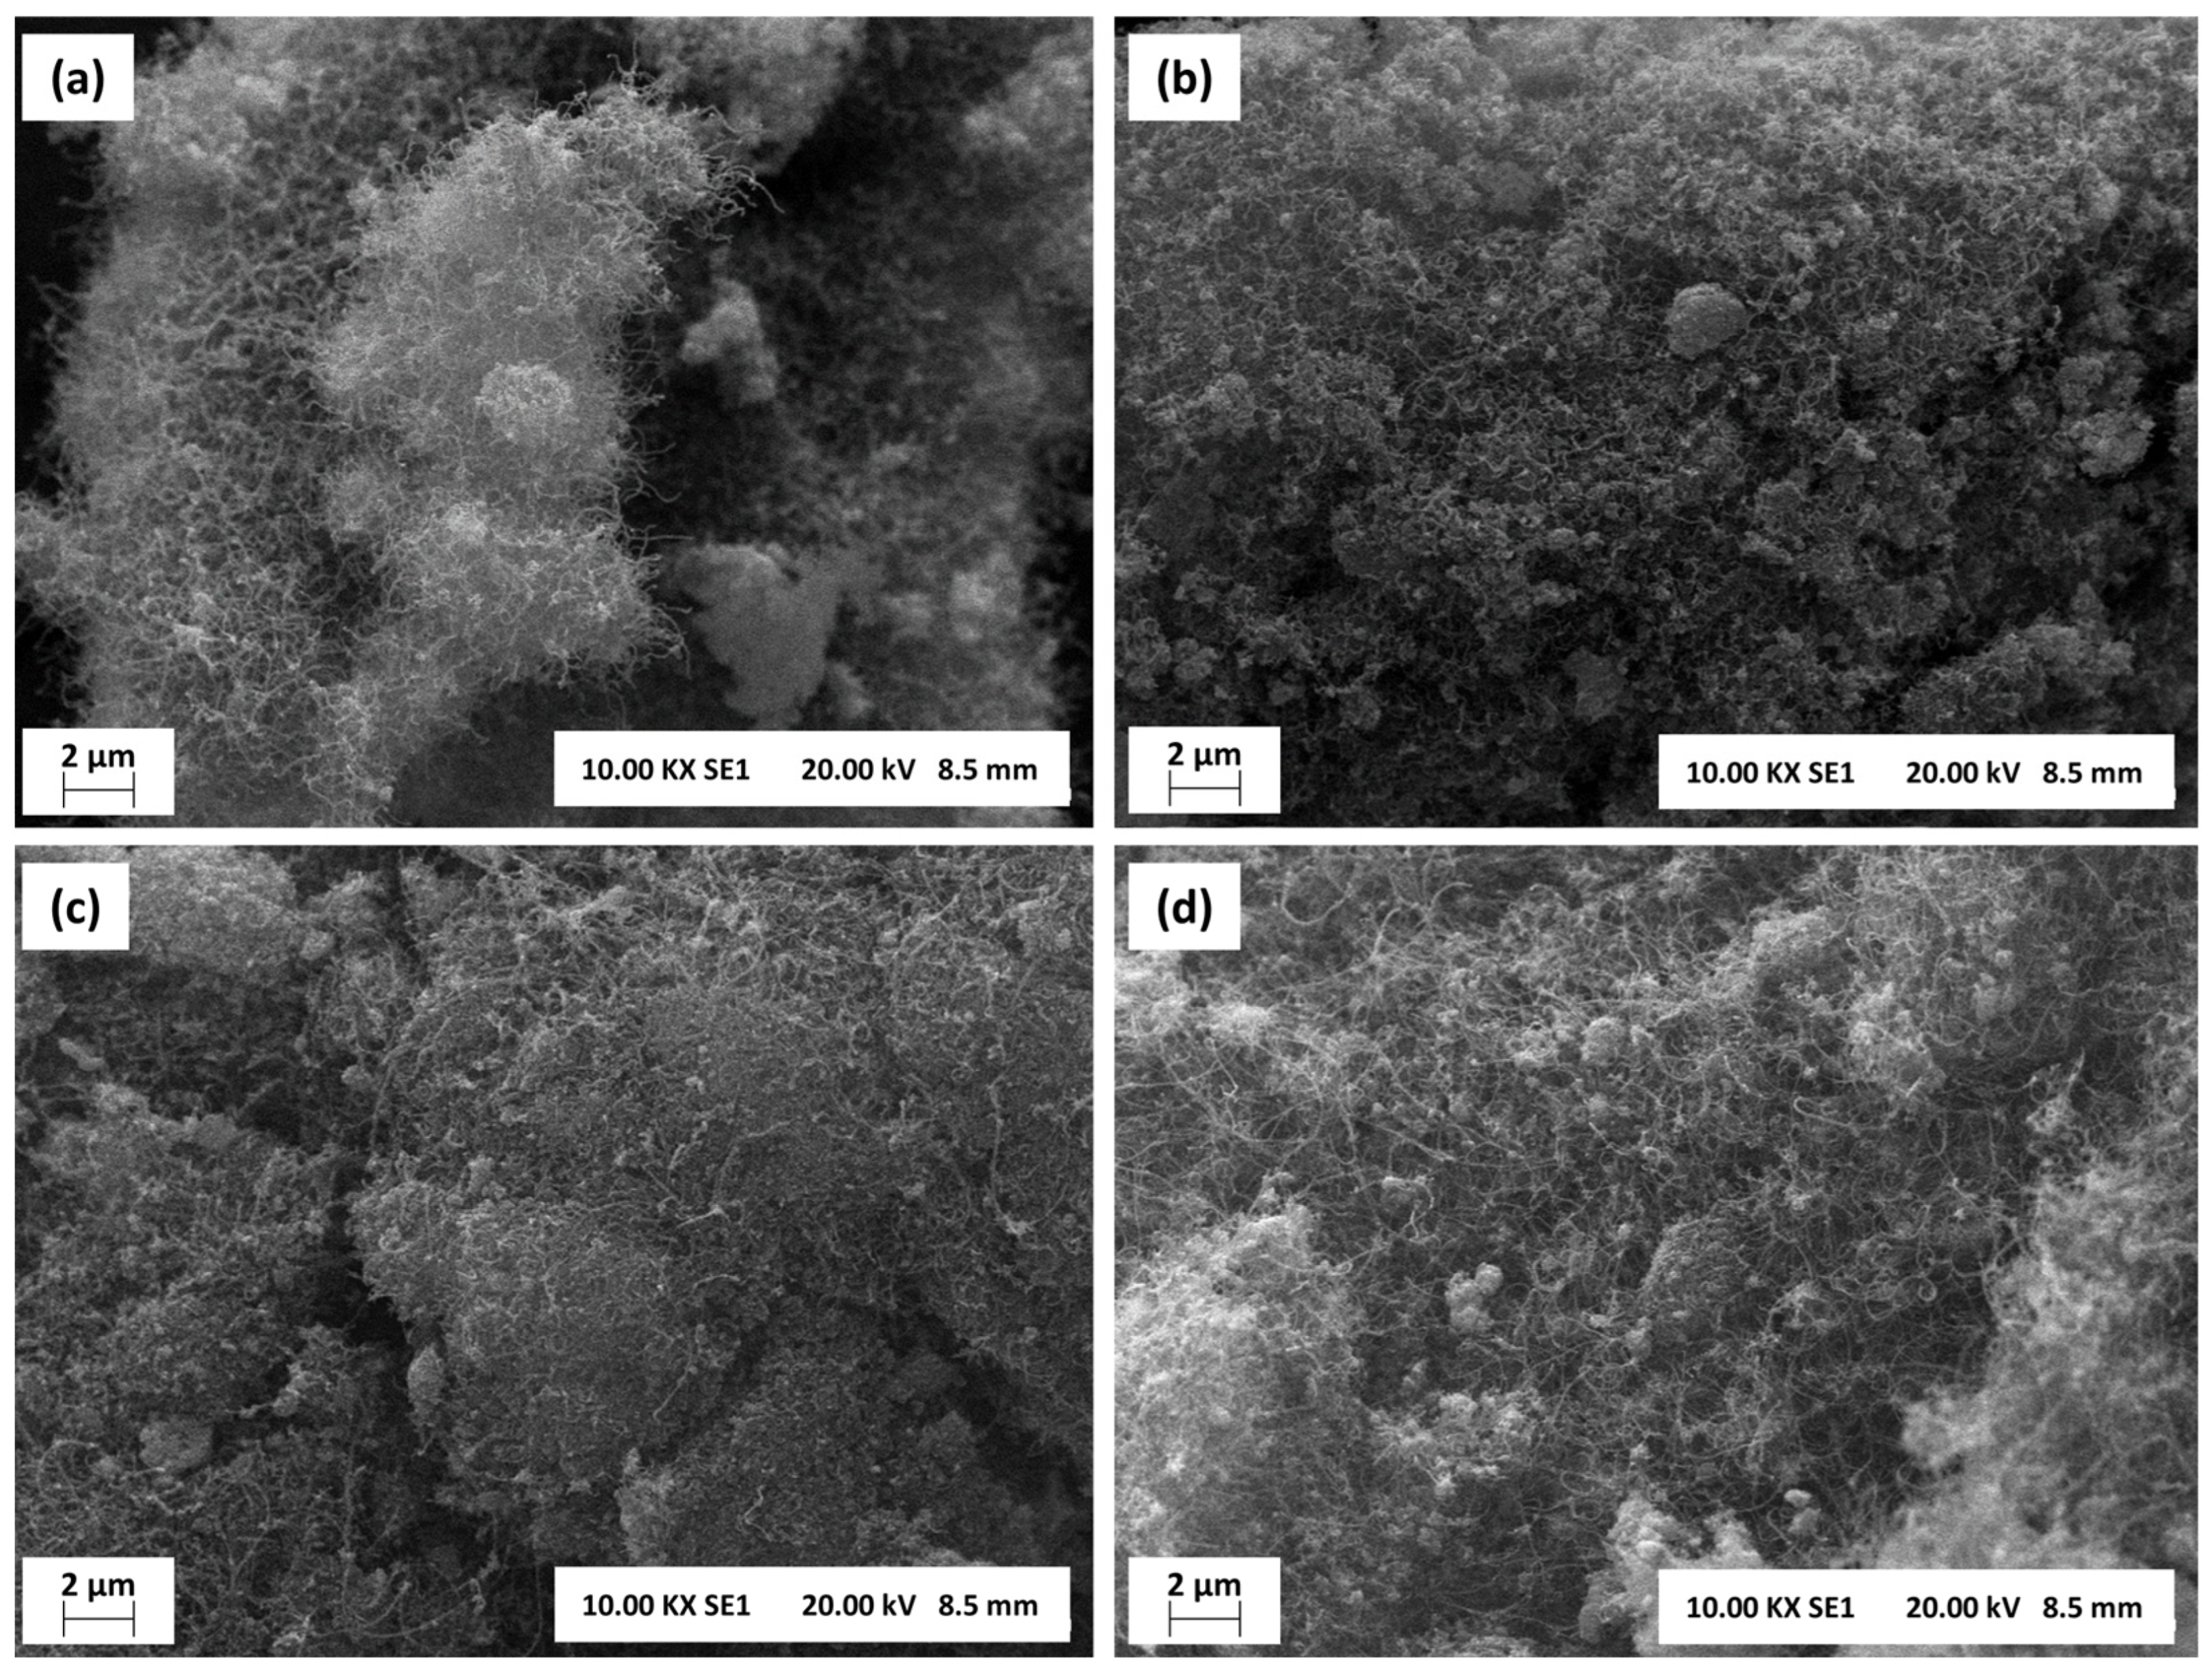
The scanning electron microscopy (SEM) images of samples subjected to stability tests at 700 °C are shown in Figure 14. As corroborated by the XRD, TPO, and Raman analyses, carbon filaments or nanotubes are deposited on the surface of all catalysts. As stated by the Raman results, the CNFs or CNTs are disorderly spread over the surface, independent of the activation pathway; subsequently, carbon accumulation is mainly linked to the reaction temperature and the nature of the catalyst.
Whereas the previous characterizations strongly indicate the presence of graphitic carbon, this cannot be observed in the SEM images, possibly due to the concentration on a layer below the CNFs or CNTs. The surfaces are amorphous and irregular, with some particle agglomerates visible, which reinforces the occurrence of sintering as observed in the XRD analysis.
NA-R and NA-C samples exhibited denser and more agglomerated structures with less visible carbon filaments. In contrast, the LaNa-R sample showed a greater number of filaments, although it remained somewhat disordered. LaNA-C sample, on the other hand, displayed a more uniform distribution of carbon filaments or fibers, suggesting better control over carbon morphology.
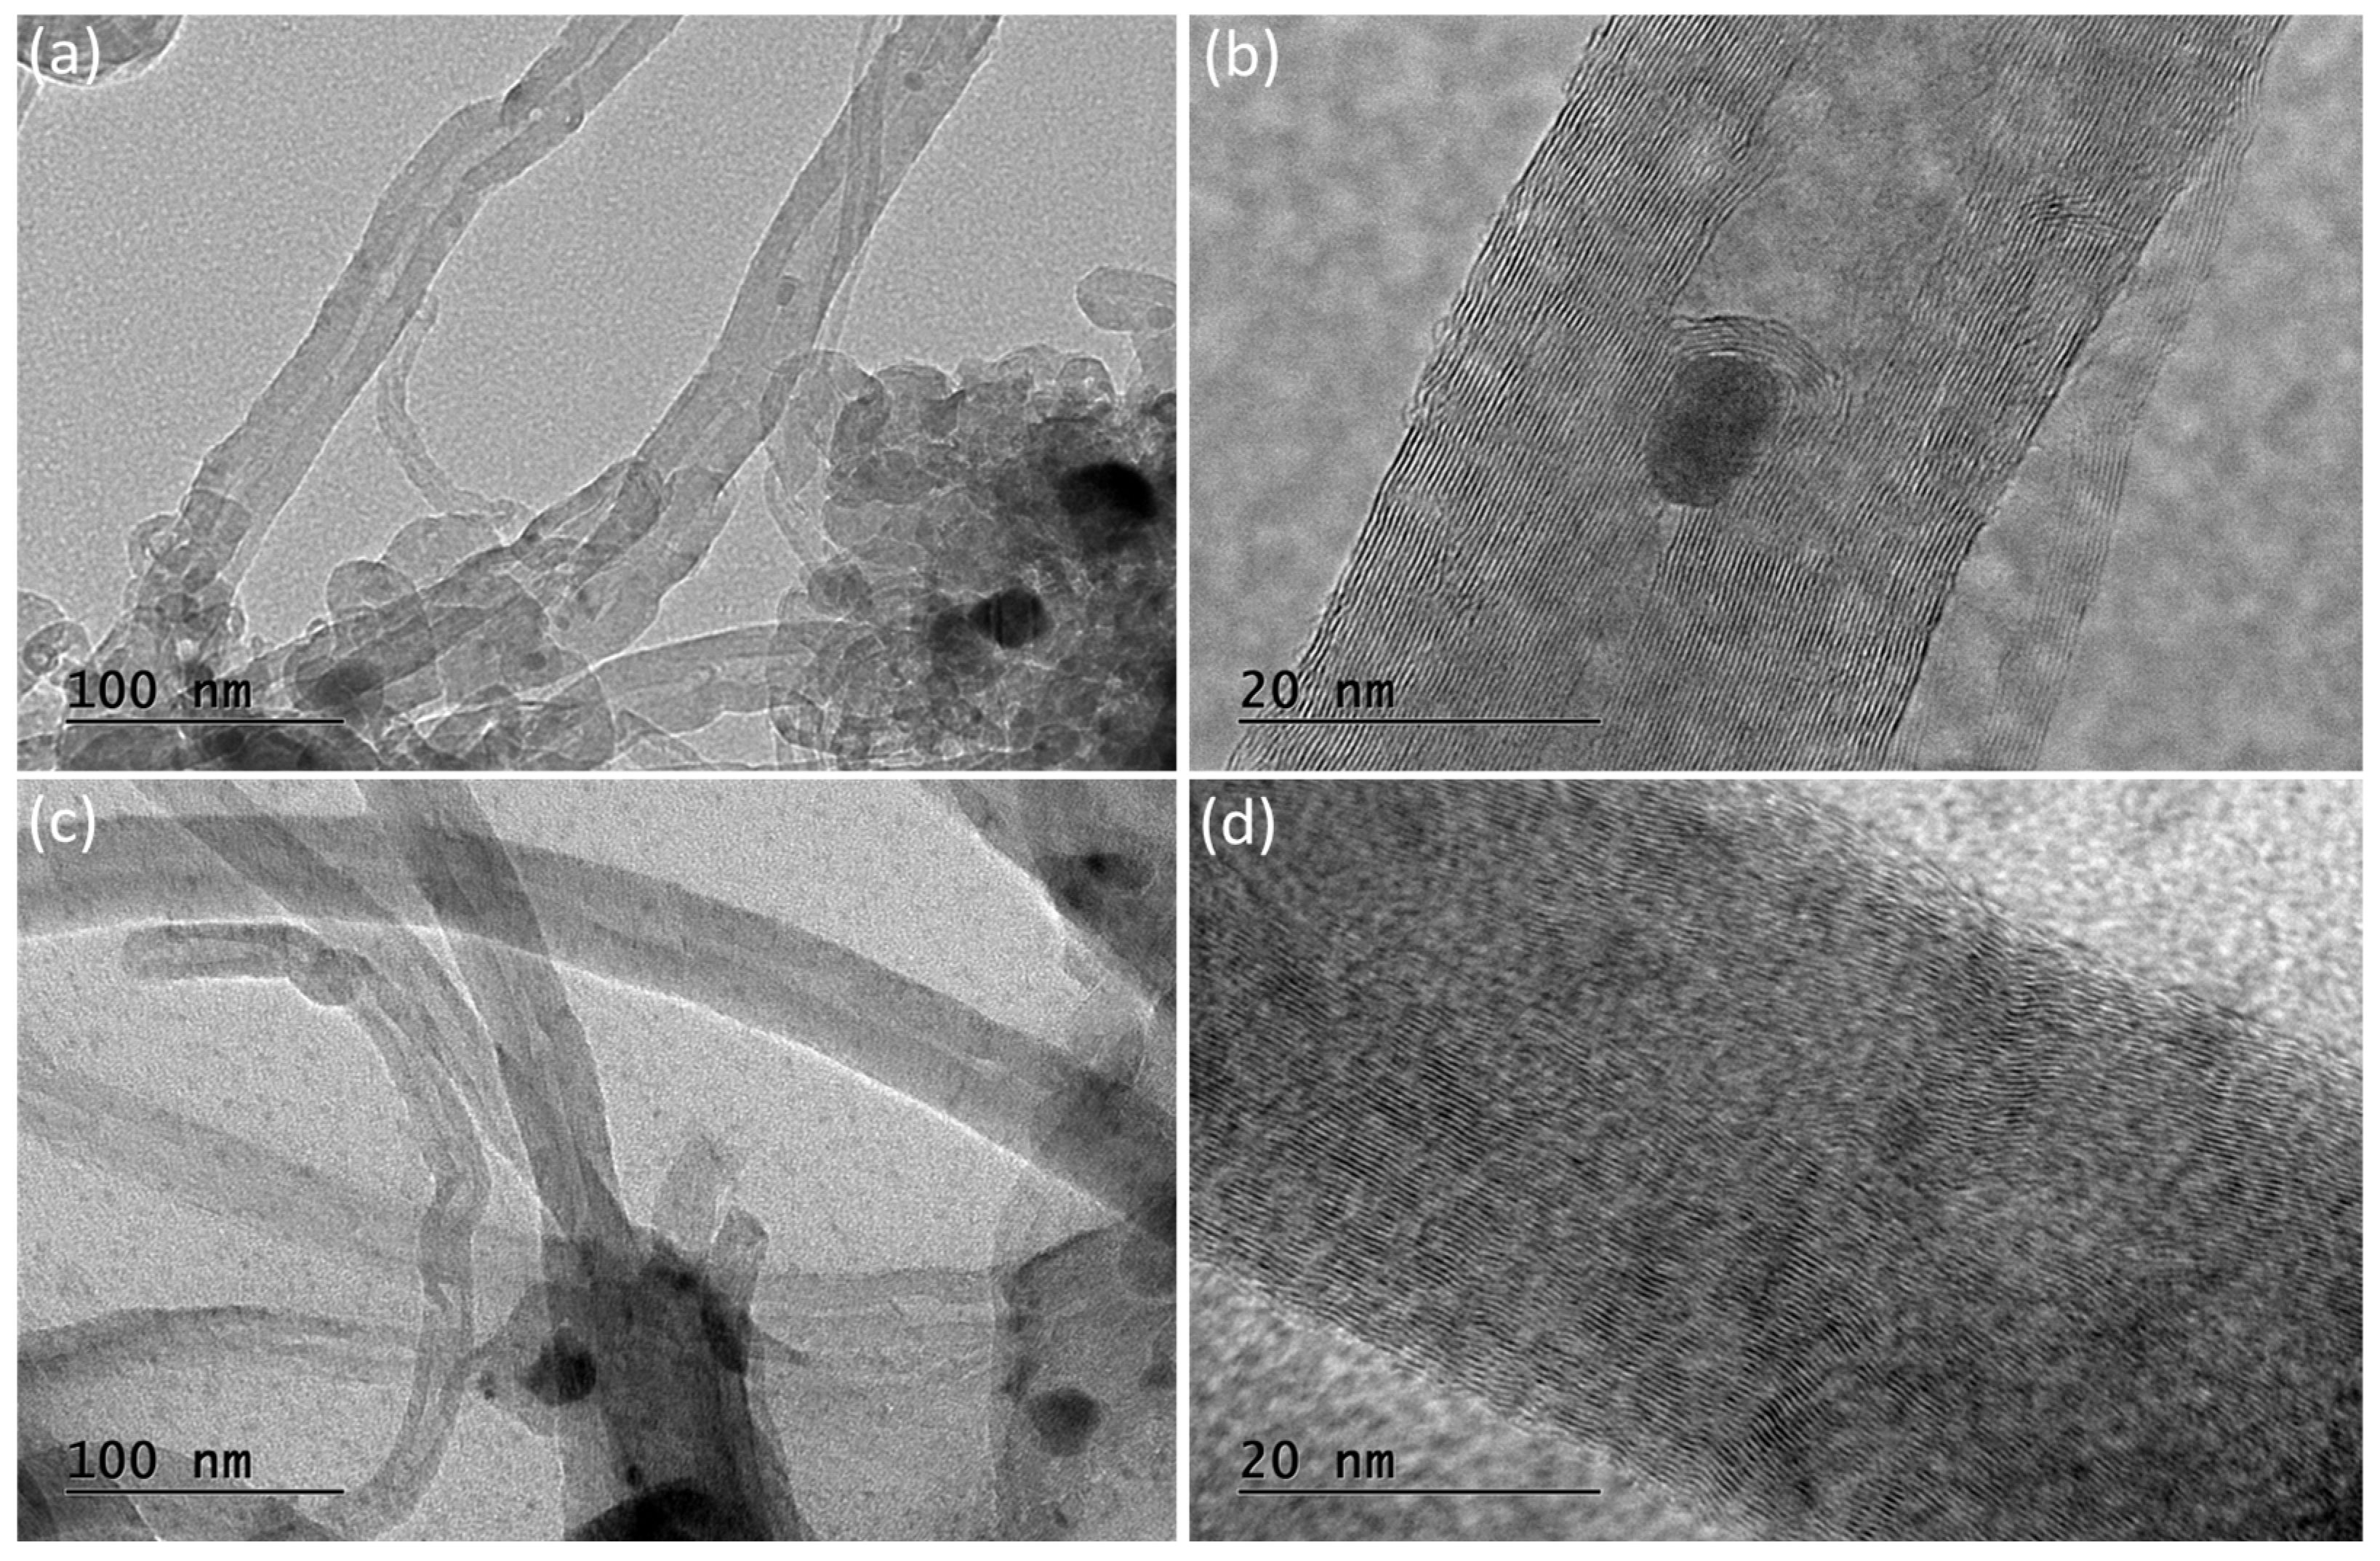
Transmission electron microscopy (TEM) images of the spent catalysts after stability tests at 700 °C, LaNA-C and LaNA-R, are presented in Figure 15. The micrographs reveal that the carbon filaments previously observed in the SEM analysis are composed of multi-walled carbon nanotubes (MWCNTs) in both samples. These nanotubes exhibit a well-defined tubular morphology with concentric graphitic layers. Notably, some nickel nanoparticles are encapsulated within the inner channels of the nanotubes, as visible, particularly in Figure 15a,b. Compared to LaNA-R, the LaNA-C sample (Figure 15c,d) displays a higher degree of graphitic order, as evidenced by the more regular and parallel graphene walls.
TEM analysis confirmed the presence of MWCNTs as the main carbon structures formed during methane decomposition over La-promoted catalysts. The improved structural ordering observed in the LaNA-C sample, characterized by more defined graphene layers and fewer structural defects, corroborates the Raman findings and SEM analysis, which pointed to a higher degree of graphitization and stacking order. These results suggest that the activation method combined with lanthanum promotion significantly influences the quality of carbon deposition, favoring the formation of more stable and less deactivating carbon structures. These highlight the importance of tuning both catalyst composition and activation conditions to enhance catalytic stability in methane decomposition processes.

4. Conclusions

The present study evaluated the effect of incorporating basic metal properties (Mg, La, Ca, and Li) on Ni-Al LDH-derived catalysts to produce COx-free hydrogen via catalytic methane decomposition. The catalysts were modified through a reconstruction method, where the metal promoter restructured the mixed oxide into a layered form via the memory effect. Two activation strategies were evaluated: prior reduction with H2 and direct heating under CH4. The catalyst containing Mg (MgNA-R) exhibited the highest activity in the reduced tests, achieving 65% CH4 conversion at 600 °C, indicating better active phase stabilization due to a stronger interaction with Ni and Al, as observed in the XRD and TPR analyses. The tests comprising the samples heated with CH4 had the sample reconstructed with La (LaNA-C) attaining 55% of CH4 conversion, maintaining a higher activity throughout the temperature range compared to the other samples, which may be attributed to a higher resistance to deactivation promoted by La in a scenario where carbon is already produced during heating, the sample low crystallite size, and higher reducibility. Further stability tests were performed on LaNA and NA samples, showing that only the LaNA sample heated with CH4 could withstand more than 100 min of reaction, although it also constantly deactivated. All spent catalysts presented the formation of graphitic and filamentous carbon. TEM analysis revealed that these filaments were main multi-walled carbon nanotubes, with LaNA-C exhibiting more ordered and graphitized structures, as corroborated by Raman spectroscopy and SEM, indicating better morphology control. La incorporation proved effective in tuning the structural and morphological properties of the Ni-Al catalyst for CMD, resulting in the lowest carbon formation despite the longer time on the stream. This result is more evident when no reduction is performed before the reactions, which also helps avoid spending H2, considering that the aim is to produce H2.

Author Contributions

Conceptualization, M.R., L.A.F., and O.W.P.-L.; formal analysis, M.R. and Y.R.D.; investigation, M.R. and Y.R.D.; methodology, M.R.; project administration, O.W.P.-L.; resources, O.W.P.-L.; supervision, L.A.F. and O.W.P.-L.; validation, M.R.; writing—original draft, M.R. and Y.R.D.; writing—review and editing, L.A.F. and O.W.P.-L. All authors have read and agreed to the published version of the manuscript.

Funding

This research received no external funding.

Data Availability Statement

The raw data supporting the conclusions of this article will be made available by the authors on request.

Acknowledgments

The authors acknowledge CAPES, through the PROEX Program, and CNPq agencies for the financial support to carry out this work.

Conflicts of Interest

The authors declare no conflict of interest.

References

  1. Zhang, J.; Li, X.; Chen, H.; Qi, M.; Zhang, G. Hydrogen production by catalytic methane decomposition: Carbon materials as catalysts or catalyst supports. Int. J. Hydrogen Energy 2017, 42, 19755–19775. [Google Scholar] [CrossRef]
  2. Singh, S.; Jain, S.; Ps, V.; Tiwari, A.K.; Nouni, M.R.; Pandey, J.K.; Goel, S. Hydrogen: A sustainable fuel for future of the transport sector. Renew. Sustain. Energy Rev. 2015, 51, 623–633. [Google Scholar] [CrossRef]
  3. Ashik, U.P.M.; Daud, W.M.A.W.; Abbas, H.F. Production of greenhouse gas free hydrogen by thermocatalytic decomposition of methane–A review. Renew. Sustain. Energy Rev. 2015, 44, 221–256. [Google Scholar] [CrossRef]
  4. Anjaneyulu, C.; Naveen Kumar, S.; Vijay Kumar, V.; Naresh, G.; Bhargava, S.K.; Chary, K.V.R.; Venugopal, A. Influence of La on reduction behaviour and Ni metal surface area of Ni-Al2O3 catalysts for COx free H2 by catalytic decomposition of methane. Int. J. Hydrogen Energy 2015, 40, 3633–3641. [Google Scholar] [CrossRef]
  5. Qian, J.X.; Chen, T.W.; Enakonda, L.R.; Liu, D.B.; Mignani, G.; Basset, J.-M.; Zhou, L. Methane decomposition to produce COx-free hydrogen and nano-carbon over metal catalysts: A review. Int. J. Hydrogen Energy 2020, 45, 7981–8001. [Google Scholar] [CrossRef]
  6. Abbas, H.F.; Ashik, U.P.M.; Mohammed, S.A.; Daud, W.M.A.W. Impact of reactor materials on methane decomposition for hydrogen production. Chem. Eng. Res. Des. 2021, 174, 127–136. [Google Scholar] [CrossRef]
  7. Bayat, N.; Rezaei, M.; Meshkani, F. Hydrogen and carbon nanofibers synthesis by methane decomposition over Ni-Pd/Al2O3 catalyst. Int. J. Hydrogen Energy 2016, 41, 5494–5503. [Google Scholar] [CrossRef]
  8. Hong, S.; Lee, J.; Cho, H.; Kim, M.; Moon, I.; Kim, J. Multi-objective optimization of CO2 emission and thermal efficiency for on-site steam methane reforming hydrogen production process using machine learning. J. Clean. Prod. 2022, 359, 132133. [Google Scholar] [CrossRef]
  9. Zarei-Jelyani, F.; Salahi, F.; Farsi, M.; Reza Rahimpour, M. Synthesis and application of Ni-Co bimetallic catalysts supported on hollow sphere Al2O3 in steam methane reforming. Fuel 2022, 324, 124785. [Google Scholar] [CrossRef]
  10. Muhammad, A.F.S.; Awad, A.; Saidur, R.; Masiran, N.; Salam, A.; Abdullah, B. Recent advances in cleaner hydrogen productions via thermo-catalytic decomposition of methane: Admixture with hydrocarbon. Int. J. Hydrogen Energy 2018, 43, 18713–18734. [Google Scholar] [CrossRef]
  11. Tezel, E.; Figen, H.E.; Baykara, S.Z. Hydrogen production by methane decomposition using bimetallic Ni–Fe catalysts. Int. J. Hydrogen Energy 2019, 44, 9930–9940. [Google Scholar] [CrossRef]
  12. Gómez-Pozuelo, G.; Pizarro, P.; Botas, J.A.; Serrano, D.P. Hydrogen production by catalytic methane decomposition over rice husk derived silica. Fuel 2021, 306, 121697. [Google Scholar] [CrossRef]
  13. Karaismailoglu, M.; Figen, H.E.; Baykara, S.Z. Hydrogen production by catalytic methane decomposition over yttria doped nickel based catalysts. Int. J. Hydrogen Energy 2019, 44, 9922–9929. [Google Scholar] [CrossRef]
  14. Keipi, T.; Tolvanen, H.; Konttinen, J. Economic analysis of hydrogen production by methane thermal decomposition: Comparison to competing technologies. Energy Convers. Manag. 2018, 159, 264–273. [Google Scholar] [CrossRef]
  15. Fan, Z.; Weng, W.; Zhou, J.; Gu, D.; Xiao, W. Catalytic decomposition of methane to produce hydrogen: A review. J. Energy Chem. 2021, 58, 415–430. [Google Scholar] [CrossRef]
  16. Bayat, N.; Meshkani, F.; Rezaei, M. Thermocatalytic decomposition of methane to COx-free hydrogen and carbon over Ni–Fe–Cu/Al2O3 catalysts. Int. J. Hydrogen Energy 2016, 41, 13039–13049. [Google Scholar] [CrossRef]
  17. Kutteri, D.A.; Wang, I.W.; Samanta, A.; Li, L.; Hu, J. Methane decomposition to tip and base grown carbon nanotubes and COx-free H2 over mono- and bimetallic 3D transition metal catalysts. Catal. Sci. Technol. 2018, 8, 858–869. [Google Scholar] [CrossRef]
  18. Urdiana, G.; Valdez, R.; Lastra, G.; Valenzuela, M.; Olivas, A. Production of hydrogen and carbon nanomaterials using transition metal catalysts through methane decomposition. Mater. Lett. 2018, 217, 9–12. [Google Scholar] [CrossRef]
  19. Karimi, S.; Bibak, F.; Meshkani, F.; Rastegarpanah, A.; Deng, J.; Liu, Y.; Dai, H. Promotional roles of second metals in catalyzing methane decomposition over the Ni-based catalysts for hydrogen production: A critical review. Int. J. Hydrogen Energy 2021, 46, 20435–20480. [Google Scholar] [CrossRef]
  20. Rastegarpanah, A.; Rezaei, M.; Meshkani, F.; Zhang, K.; Zhao, X.; Pei, W.; Liu, Y.; Deng, J.; Arandiyan, H.; Dai, H. Influence of group VIB metals on activity of the Ni/MgO catalysts for methane decomposition. Appl. Catal. B 2019, 248, 515–525. [Google Scholar] [CrossRef]
  21. Pudukudy, M.; Yaakob, Z.; Takriff, M.S. Methane decomposition over Pd promoted Ni/MgAl2O4 catalysts for the production of COx free hydrogen and multiwalled carbon nanotubes. Appl. Surf. Sci. 2015, 356, 1320–1326. [Google Scholar] [CrossRef]
  22. Rastegarpanah, A.; Meshkani, F.; Rezaei, M. Thermocatalytic decomposition of methane over mesoporous nanocrystalline promoted Ni/MgO·Al2O3 catalysts. Int. J. Hydrogen Energy 2017, 42, 16476–16488. [Google Scholar] [CrossRef]
  23. Chesnokov, V.V.; Chichkan, A.S. Production of hydrogen by methane catalytic decomposition over Ni-Cu-Fe/Al2O3 catalyst. Int. J. Hydrogen Energy 2009, 34, 2979–2985. [Google Scholar] [CrossRef]
  24. Cavani, F.; Trifirò, F.; Vaccari, A. Hydrotalcite-type anionic clays: Preparation, properties and applications. Catal. Today 1991, 11, 173–301. [Google Scholar] [CrossRef]
  25. Wang, Q.; Ohare, D. Recent advances in the synthesis and application of layered double hydroxide (LDH) nanosheets. Chem. Rev. 2012, 112, 4124–4155. [Google Scholar] [CrossRef]
  26. Touahra, F.; Ketir, M.S.W.; Chebout, K.B.R. Effect of the Ni/Al ratio of hydrotalcite-type catalysts on their performance in the methane dry reforming process. Appl. Petrochem. Res. 2016, 6, 1–13. [Google Scholar] [CrossRef]
  27. Abdelsadek, Z.; Sehailia, M.; Halliche, D.; Gonzalez-delacruz, V.M.; Holgado, J.P. In-situ hydrogasi fi cation/regeneration of NiAl-hydrotalcite derived catalyst in the reaction of CO2 reforming of methane: A versatile approach to catalyst recycling. Journal of CO2 Utilization 2016, 14, 98–105. [Google Scholar] [CrossRef]
  28. Kumar, R.; Pant, K.K. Hydrotalcite-derived Ni-Zn-Mg-Al catalyst for Tri-reforming of methane: Effect of divalent to trivalent metal ratio and Ni loading. Fuel Process. Technol. 2020, 210, 106559. [Google Scholar] [CrossRef]
  29. Li, Y.; Li, D.; Wang, G. Methane decomposition to COx-free hydrogen and nano-carbon material on group 8–10 base metal catalysts: A review. Catal. Today 2011, 162, 1–48. [Google Scholar] [CrossRef]
  30. Fakeeha, A.H.; Ibrahim, A.A.; Khan, W.U.; Seshan, K.; Al Otaibi, R.L.; Al-Fatesh, A.S. Hydrogen production via catalytic methane decomposition over alumina supported iron catalyst. Arab. J. Chem. 2018, 11, 405–414. [Google Scholar] [CrossRef]
  31. Sikander, U.; Samsudin, M.F.; Sufian, S.; KuShaari, K.Z.; Kait, C.F.; Naqvi, S.R.; Chen, W.-H. Tailored hydrotalcite-based Mg-Ni-Al catalyst for hydrogen production via methane decomposition: Effect of nickel concentration and spinel-like structures. Int. J. Hydrogen Energy 2019, 44, 14424–14433. [Google Scholar] [CrossRef]
  32. Wan, C.; Shi, Z.; Huang, M.; Pan, J.; Luo, R.; Li, D.; Jiang, L. Influence of alloying on the catalytic performance of Ni–Al catalyst prepared from hydrotalcite-like compounds for methane decomposition. Int. J. Hydrogen Energy 2021, 46, 3833–3846. [Google Scholar] [CrossRef]
  33. Al Mesfer, M.K.; Danish, M.; Shah, M. Synthesis and optimization of hydrotalcite derived Ni-Fe-Cu based catalysts for catalytic methane decomposition process using the design of experiment approach. J. Taiwan. Inst. Chem. Eng. 2021, 128, 370–379. [Google Scholar] [CrossRef]
  34. Anjaneyulu, C.; Naresh, G.; Kumar, V.V.; Tardio, J.; Rao, T.V.; Venugopal, A. Influence of Rare Earth (La, Pr, Nd, Gd, and Sm) Metals on the Methane Decomposition Activity of Ni-Al Catalysts. ACS Sustain. Chem. Eng. 2015, 3, 1298–1305. [Google Scholar] [CrossRef]
  35. Rosset, M.; Féris, L.A.; Perez-Lopez, O.W. Biogas dry reforming over Ni-Al catalyst: Suppression of carbon deposition by catalyst preparation and activation. Int. J. Hydrogen Energy 2020, 45, 6549–6562. [Google Scholar] [CrossRef]
  36. Perez-Lopez, O.W.; Senger, A.; Marcilio, N.R.; Lansarin, M.A. Effect of Composition and Thermal pretreatment on properties of Ni–Mg–Al catalysts for CO2 reforming of methane. Appl. Catal. A Gen. 2006, 303, 234–244. [Google Scholar] [CrossRef]
  37. Calgaro, C.O.; Perez-Lopez, O.W. Biogas dry reforming for hydrogen production over Ni-M-Al catalysts (M = Mg, Li, Ca, La, Cu, Co, Zn). Int. J. Hydrogen Energy 2019, 44, 17750–17766. [Google Scholar] [CrossRef]
  38. Rosset, M.; Féris, L.A.; Perez-Lopez, O.W. Biogas dry reforming using Ni–Al-LDH catalysts reconstructed with Mg and Zn. Int. J. Hydrogen Energy 2021, 46, 20359–20376. [Google Scholar] [CrossRef]
  39. Rosset, M.; Sfreddo, L.W.; Hidalgo, G.E.N.; Perez-Lopez, O.W.; Féris, L.A. Adsorbents derived from hydrotalcites for the removal of diclofenac in wastewater. Appl. Clay Sci. 2019, 175, 150–158. [Google Scholar] [CrossRef]
  40. Rosset, M.; Perez-Lopez, O.W. Catalytic properties of Cu–Mg–Al hydrotalcites, their oxides and reduced phases for ethanol dehydrogenation. React. Kinet. Mech. Catal. 2018, 123, 689–705. [Google Scholar] [CrossRef]
  41. Denardin, F.G.; Perez-Lopez, O.W. Methane dehydroaromatization over Fe-M/ZSM-5 catalysts (M = Zr, Nb, Mo). Microporous Mesoporous Mater. 2020, 295, 109961. [Google Scholar] [CrossRef]
  42. Calgaro, C.O.; Perez-Lopez, O.W. Graphene and carbon nanotubes by CH4 decomposition over Co–Al catalysts. Mater. Chem. Phys. 2019, 226, 6–19. [Google Scholar] [CrossRef]
  43. Rosset, M.; Féris, L.A.; Perez-Lopez, O.W. Biogas dry reforming over Ni-M-Al (M = K, Na and Li) layered double hydroxide-derived catalysts. Catal Today 2021, 381, 96–107. [Google Scholar] [CrossRef]
  44. Kovanda, F.; Rojka, T.; Bezdička, P.; Jirátová, K.; Obalová, L.; Pacultová, K.; Bastl, Z.; Grygar, T. Effect of hydrothermal treatment on properties of Ni-Al layered double hydroxides and related mixed oxides. J. Solid. State Chem. 2009, 182, 27–36. [Google Scholar] [CrossRef]
  45. Gousi, M.; Andriopoulou, C.; Bourikas, K.; Ladas, S.; Sotiriou, M.; Kordulis, C.; Lycourghiotis, A. Green diesel production over nickel-alumina co-precipitated catalysts. Appl. Catal. A Gen. 2017, 536, 45–56. [Google Scholar] [CrossRef]
  46. Pérez-Ramírez, J.; Mul, G.; Kapteijn, F.; Moulijn, J.A. In situ investigation of the thermal decomposition of Co-Al hydrotalcite in different atmospheres. J. Mater. Chem. 2001, 11, 821–830. [Google Scholar] [CrossRef]
  47. Li, F.; Tan, Q.; Evans, D.G.; Duan, X. Synthesis of carbon nanotubes using a novel catalyst derived from hydrotalcite-like Co–Al layered double hydroxide precursor. Catal. Lett. 2005, 99, 151–156. [Google Scholar] [CrossRef]
  48. Zhan, Y.; Han, J.; Bao, Z.; Cao, B.; Li, Y.; Street, J.; Yu, F. Biogas reforming of carbon dioxide to syngas production over Ni-Mg-Al catalysts. Mol. Catal. 2017, 436, 248–258. [Google Scholar] [CrossRef]
  49. Nguyen-Phu, H.; Kim, T.; Kim, Y.; Kang, K.H.; Cho, H.; Kim, J.; Ro, I. Role of phase in NiMgAl mixed oxide catalysts for CO2 dry methane reforming (DRM). Catal. Today 2023, 411–412, 113894. [Google Scholar] [CrossRef]
  50. Bian, L.; Wang, W.; Li, Z. Ni-based catalyst derived from Ni/Al hydrotalcite- like compounds by the urea hydrolysis method for CO methanation. RSC Adv. 2015, 6, 677–686. [Google Scholar] [CrossRef]
  51. Jin, L.; Ma, B.; Zhao, S.; He, X.; Li, Y.; Hu, H.; Lei, Z. Ni/MgO–Al2O3 catalyst derived from modified [Ni,Mg,Al]-LDH with NaOH for CO2 reforming of methane. Int. J. Hydrogen Energy 2018, 43, 2689–2698. [Google Scholar] [CrossRef]
  52. Wierzbicki, D.; Baran, R.; Dębek, R.; Motak, M.; Grzybek, T.; Gálvez, M.E.; Da Costa, P. The influence of nickel content on the performance of hydrotalcite-derived catalysts in CO2 methanation reaction. Int. J. Hydrogen Energy 2017, 42, 23548–23555. [Google Scholar] [CrossRef]
  53. Zhang, L.; Bian, L.; Zhu, Z.; Li, Z. La-promoted Ni/Mg-Al catalysts with highly enhanced low-temperature CO2 methanation performance. Int. J. Hydrogen Energy 2018, 43, 2197–2206. [Google Scholar] [CrossRef]
  54. Stepanova, L.N.; Kobzar, E.O.; Trenikhin, M.V.; Leont’eva, N.N.; Serkova, A.N.; Salanov, A.N.; Lavrenov, A.V. Catalysts Based on Ni(Mg)Al-Layered Hydroxides Prepared by Mechanical Activation for Furfural Hydrogenation. Catalysts 2023, 13, 497. [Google Scholar] [CrossRef]
  55. Chmielarz, L.; Jabłońska, M.; Strumiński, A.; Piwowarska, Z.; Węgrzyn, A.; Witkowski, S.; Michalik, M. Selective catalytic oxidation of ammonia to nitrogen over Mg-Al, Cu-Mg-Al and Fe-Mg-Al mixed metal oxides doped with noble metals. Appl. Catal. B 2013, 130–131, 152–162. [Google Scholar] [CrossRef]
  56. Takehira, K.; Shishido, T.; Shoro, D.; Murakami, K.; Honda, M.; Kawabata, T.; Takaki, K. Preparation of egg-shell type Ni-loaded catalyst by adopting “Memory Effect” of Mg-Al hydrotalcite and its application for CH4 reforming. Catal. Commun. 2004, 5, 209–213. [Google Scholar] [CrossRef]
  57. Thommes, M.; Kaneko, K.; Neimark, A.V.; Olivier, J.P.; Rodriguez-Reinoso, F.; Rouquerol, J.; Sing, K.S. Physisorption of gases, with special reference to the evaluation of surface area and pore size distribution (IUPAC Technical Report). Pure Appl. Chem. 2015, 87, 1051–1069. [Google Scholar] [CrossRef]
  58. Pavel, O.D.; Tichit, D.; Marcu, I.C. Acido-basic and catalytic properties of transition-metal containing Mg-Al hydrotalcites and their corresponding mixed oxides. Appl. Clay Sci. 2012, 61, 52–58. [Google Scholar] [CrossRef]
  59. Cosimo JIDi Díez, V.K.; Xu, M.; Iglesia, E.; Apesteguía, C.R. Structure and Surface and Catalytic Properties of Mg-Al Basic Oxides. J. Catal. 1998, 510, 499–510. [Google Scholar] [CrossRef]
  60. Kong, L.; Li, D.; Bi, J.; Fan, X.; Xie, Z.; Xiao, X.; Zhao, Z. Template-induced mesoporous Ni–Al oxide catalysts with tuned physico–chemical properties for the oxidative dehydrogenation of ethane. Chem. Eng. J. 2023, 452, 139247. [Google Scholar] [CrossRef]
  61. Skoufa, Z.; Xantri, G.; Heracleous, E.; Lemonidou, A.A. A study of Ni-Al-O mixed oxides as catalysts for the oxidative conversion of ethane to ethylene. Appl. Catal. A Gen. 2014, 471, 107–117. [Google Scholar] [CrossRef]
  62. Zhou, Y.; Lin, J.; Li, L.; Tian, M.; Li, X.; Pan, X.; Chen, Y.; Wang, X. Improving the selectivity of Ni-Al mixed oxides with isolated oxygen species for oxidative dehydrogenation of ethane with nitrous oxide. J. Catal. 2019, 377, 438–448. [Google Scholar] [CrossRef]
  63. Summa, P.; Gajewska, M.; Li, L.; Hu, C.; Samojeden, B.; Motak, M.; Da Costa, P. Solution combustion synthesis as an alternative synthesis route for novel Ni-Mg-Al mixed-oxide catalyst for CO2 methanation. J. CO2 Util. 2022, 60, 101983. [Google Scholar] [CrossRef]
  64. Wei, Q.; Gao, X.; Liu, G.; Yang, R.; Zhang, H.; Yang, G.; Yoneyama, Y.; Tsubaki, N. Facile one-step synthesis of mesoporous Ni-Mg-Al catalyst for syngas production using coupled methane reforming process. Fuel 2018, 211, 1–10. [Google Scholar] [CrossRef]
  65. Dang, C.; Li, Z.; Long, J.; Yang, W.; Cai, W. Sorption-enhanced glycerol steam reforming over hierarchical hollow Ni-CaO-Ca12Al14O33 bi-functional catalyst derived from hydrotalcite-like compounds. Fuel 2022, 324, 124468. [Google Scholar] [CrossRef]
  66. Chatla, A.; Abu-Rub, F.; Prakash, A.V.; Ibrahim, G.; Elbashir, N.O. Highly stable and coke-resistant Zn-modified Ni-Mg-Al hydrotalcite derived catalyst for dry reforming of methane: Synergistic effect of Ni and Zn. Fuel 2022, 308, 122042. [Google Scholar] [CrossRef]
  67. Zhang, R.J.; Xia, G.F.; Li, M.F.; Wu, Y.; Nie, H.; Li, D.D. Effect of support on catalytic performance of Ni-based catayst in methane dry reforming. Ranliao Huaxue Xuebao/J. Fuel Chem. Technol. 2015, 43, 1359–1365. [Google Scholar] [CrossRef]
  68. Liu, Z.; Gao, X.; Liu, B.; Ma, Q.; Zhao, T.S.; Zhang, J. Recent advances in thermal catalytic CO2 methanation on hydrotalcite-derived catalysts. Fuel 2022, 321, 124115. [Google Scholar] [CrossRef]
  69. Leal Pérez, B.J.; Medrano Jiménez, J.A.; Bhardwaj, R.; Goetheer, E.; van Sint Annaland, M.; Gallucci, F. Methane pyrolysis in a molten gallium bubble column reactor for sustainable hydrogen production: Proof of concept & techno-economic assessment. Int. J. Hydrogen Energy 2021, 46, 4917–4935. [Google Scholar] [CrossRef]
  70. Escobar, C.; Perez-Lopez, O.W. Hydrogen Production by Methane Decomposition Over Cu–Co–Al Mixed Oxides Activated Under Reaction Conditions. Catal. Lett. 2014, 144, 796–804. [Google Scholar] [CrossRef]
  71. Zardin, L.; Perez-lopez, O.W. Hydrogen Production by methane decomposition over Co-Al mixed oxides derived from hydrotalcites: Effect of the catalyst activation with. Int. J. Hydrogen Energy 2017, 42, 7895–7907. [Google Scholar] [CrossRef]
  72. Liang, W.; Yan, H.; Chen, C.; Lin, D.; Tan, K.; Feng, X.; Liu, Y.; Chen, X.; Yang, C.; Shan, H. Revealing the effect of nickel particle size on carbon formation type in the methane decomposition reaction. Catalysts 2020, 10, 890. [Google Scholar] [CrossRef]
  73. Asiai, K.; Nagayasu, Y.; Takane, K.; Iwamoto, S.; Yagasaki, E.; Ishii, K.; Inoue, M. Mechanisms of Methane Decomposition over Ni Catalysts at High Temperatures. J. Jpn. Pet. Inst. 2008, 51, 42–49. [Google Scholar] [CrossRef]
  74. Martins, R.L.; Baldanza, M.A.; Souza, M.M.; Schmal, M. The effect of support on methane activation over Pt catalysts in the presence of MoO3. Appl. Catal. A Gen. 2007, 318, 207–212. [Google Scholar] [CrossRef]
  75. Herrera, J.E.; Resasco, D.E. In situ TPO/Raman to characterize single-walled carbon nanotubes. Chem. Phys. Lett. 2003, 376, 302–309. [Google Scholar] [CrossRef]
  76. Hermes, N.A.; Lansarin, M.A.; Perez-lopez, O.W. Catalytic Decomposition of Methane Over M–Co–Al Catalysts (M = Mg, Ni, Zn, Cu). Catal. Lett. 2011, 141, 1018–1025. [Google Scholar] [CrossRef]
  77. Ferrari, A.C.; Robertson, J. Interpretation of Raman spectra of disordered and amorphous carbon. Phys. Ver. B 2000, 61, 14095. [Google Scholar] [CrossRef]
  78. Ferrari, A.C.; Robertson, J. Raman spectroscopy of amorphous, nanostructured, diamond-like carbon, and nanodiamond. Phil Trans. R. Soc. Lond. A 2004, 362, 2477–2512. [Google Scholar] [CrossRef]
  79. Dresselhaus, M.S.; Jorio, A.; Hofmann, M.; Dresselhaus, G.; Sato, R. Perspectives on carbon nanotubes and graphene Raman spectroscopy. Nano Lett. 2010, 10, 751–758. [Google Scholar] [CrossRef]
  80. Dong, L.; Du, Y.; Li, J.; Wang, H.; Yang, Y.; Li, S.; Tan, Z. The effect of CH4 decomposition temperature on the property of deposited carbon over Ni/SiO2 catalyst. Int. J. Hydrog. En. 2015, 40, 9670–9676. [Google Scholar] [CrossRef]
  81. Zhang, C.C.; Hartlaub, S.; Petrovic, I.; Yilmaz, B. Raman spectroscopy characterization of amorphous coke generated in industrial processes. ACS Omega 2022, 7, 2565–2570. [Google Scholar] [CrossRef] [PubMed]
  82. Han, S.B.; Kim, M.S.; Deng, Y.; Kang, K.Y.; Choi, J.S.; Jang, E.; Bae, J.W. Chemical looping-based catalytic CH4 decomposition and successive coke gasification with CO2 on ordered mesoporous NiMCeOx (M = Co, Zr, La). Chem. Eng. J. 2024, 489, 151034. [Google Scholar] [CrossRef]
  83. Mansooripour, H.; Bibak, F.; Meshkani, F. Facile synthesis of Ni-M/MgO (M = Y2O3, Gd2O3) catalysts using the surfactant-assisted co-precipitation method and their applications in the methane decomposition reaction. Mol. Catal. 2024, 564, 114277. [Google Scholar] [CrossRef]
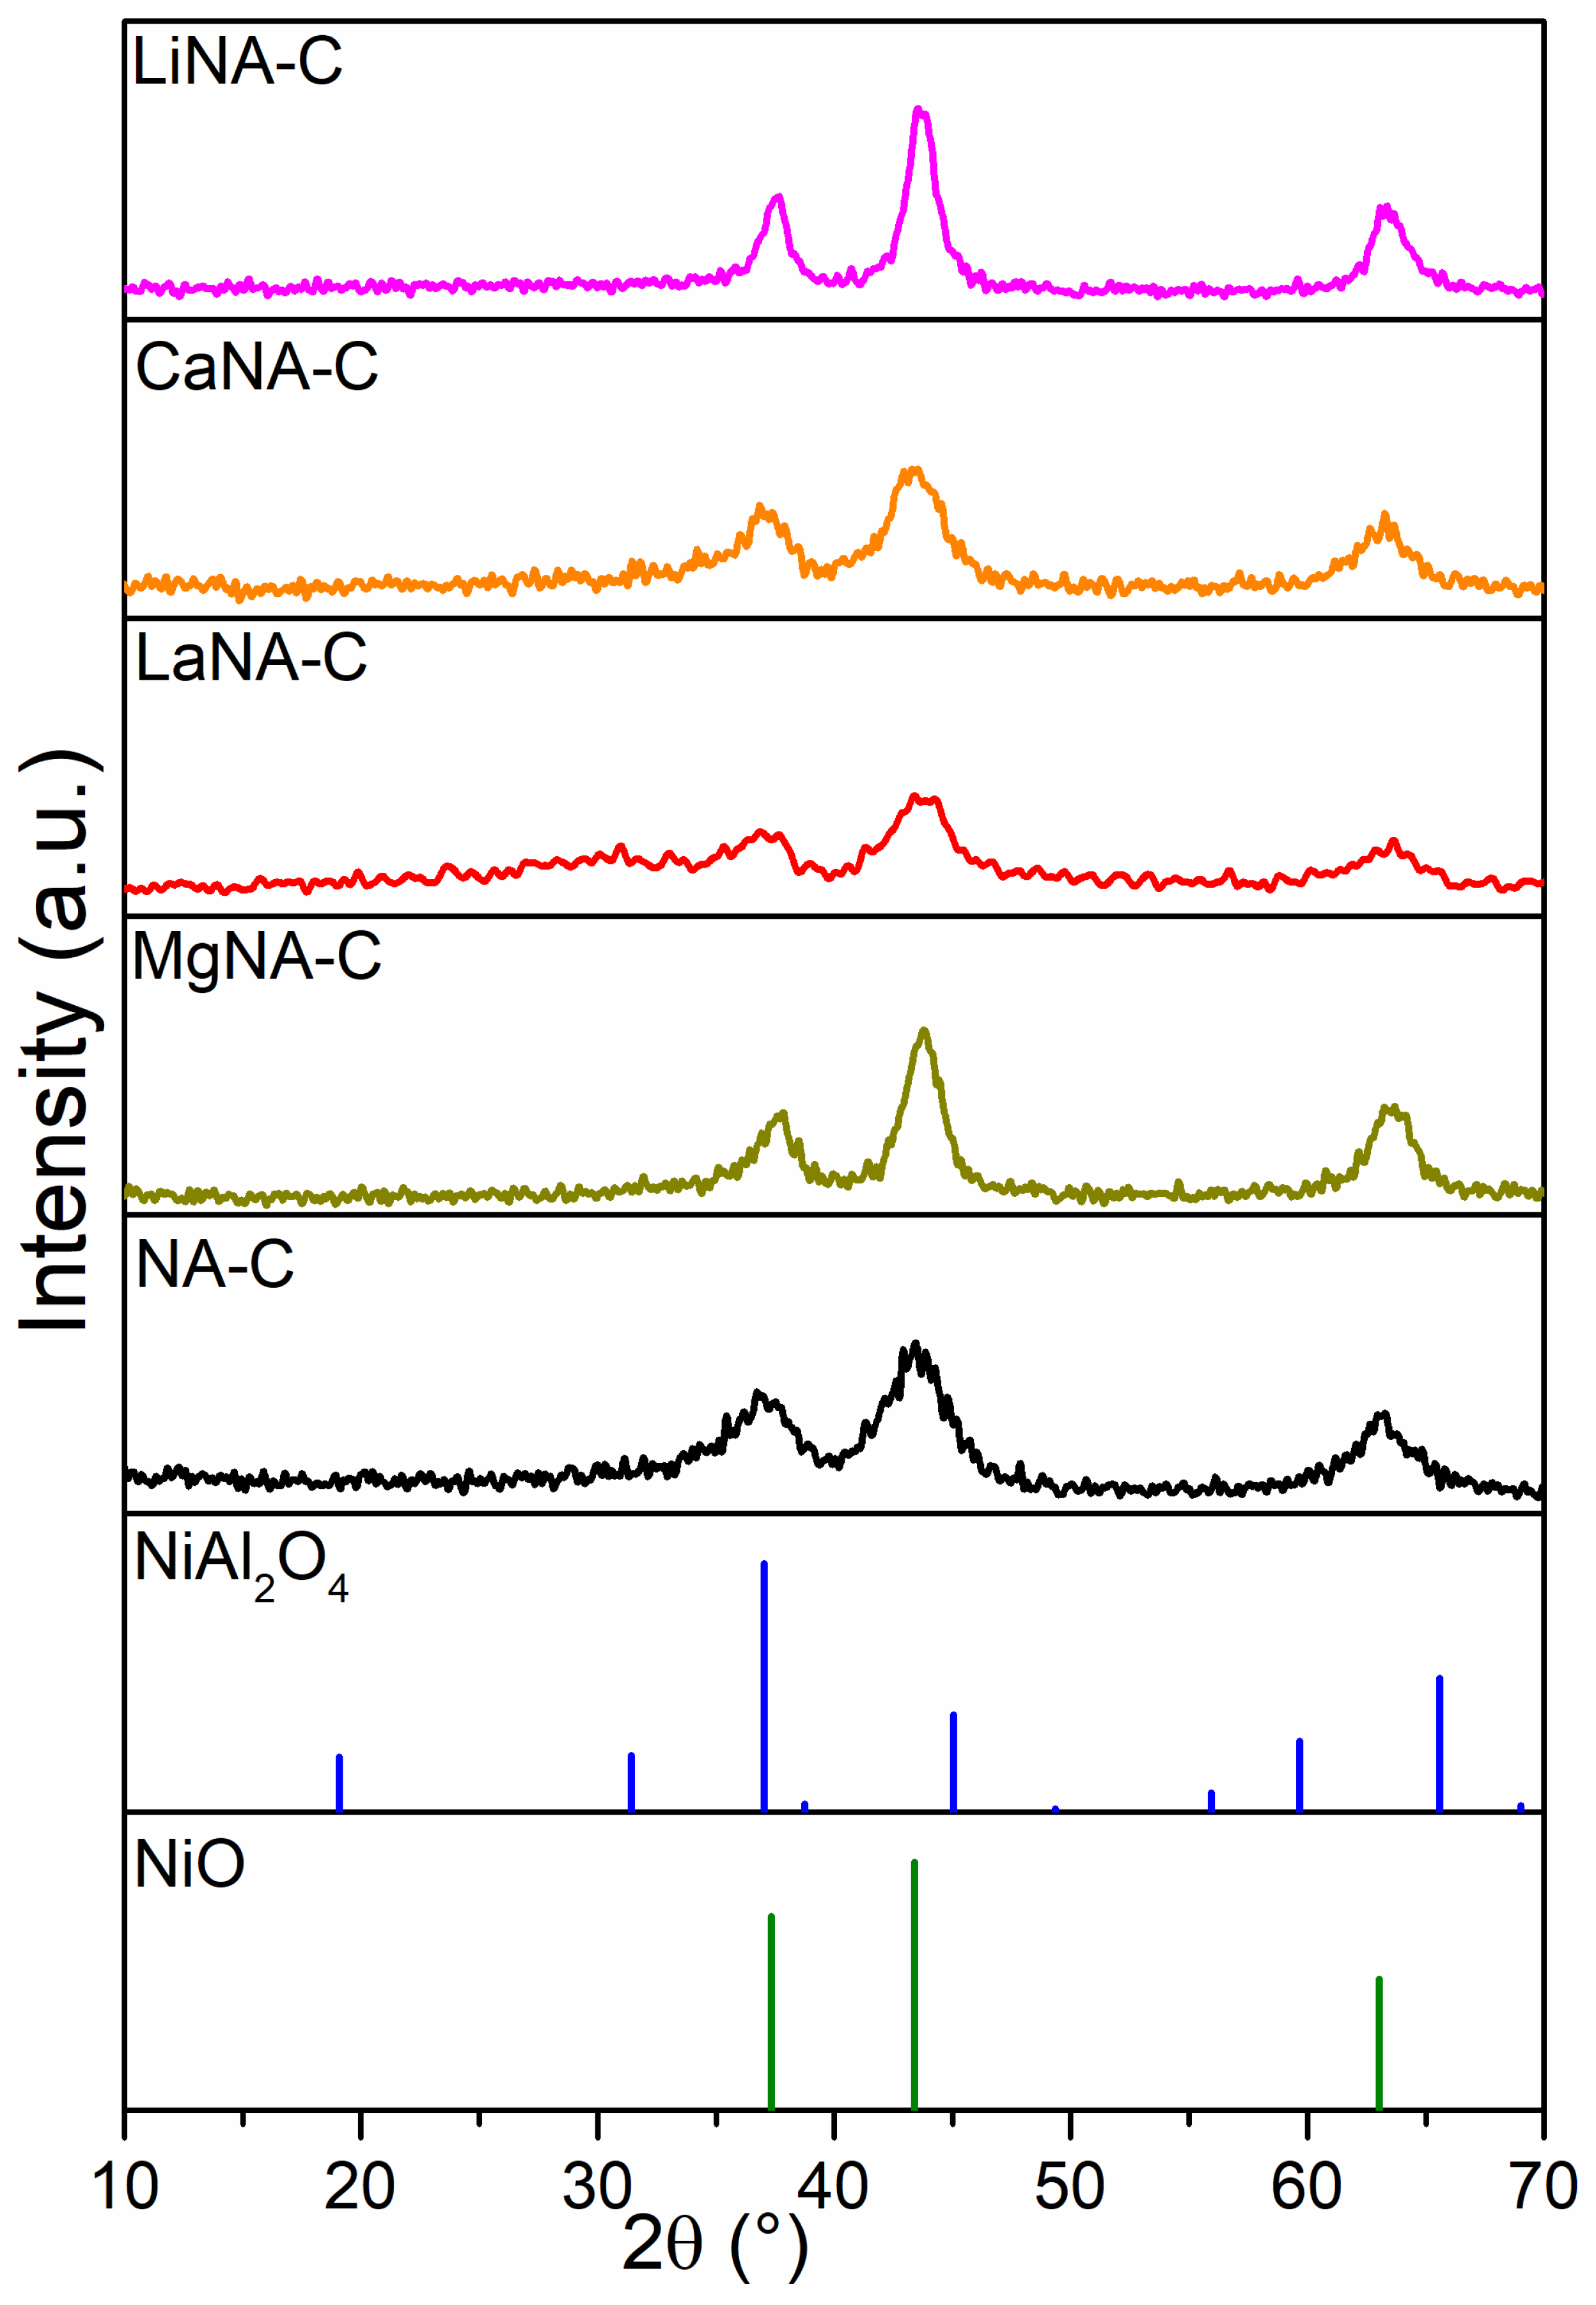
Figure 1. XRD patterns of samples after calcination at 600 °C.
Nanoenergyadv 05 00010 g001
Figure 2. XRD patterns of samples after reduction with H2 at 700 °C.
Nanoenergyadv 05 00010 g002
Figure 3. N2 adsorption-desorption isotherms (a) and pore size distributions (b) of samples calcined at 600 °C.
Nanoenergyadv 05 00010 g003
Figure 4. CO2-TPD curves of the samples calcined at 600 °C and deconvolution curves using Gaussian.
Nanoenergyadv 05 00010 g004
Figure 5. H2-TPR curves of the samples calcined at 600 °C and deconvolution curves using Gaussian.
Nanoenergyadv 05 00010 g005
Figure 6. CH4 conversion between 500 and 700 °C for samples previously reduced with H2 at 700 °C and equilibrium conversion of methane with temperature and pressure at 1 bar in Aspen Plus® v12.
Nanoenergyadv 05 00010 g006
Figure 7. CH4 conversion between 500 and 700 °C for samples activated under CH4 flow and equilibrium conversion of methane with temperature and pressure at 1 bar in Aspen Plus® v12.
Nanoenergyadv 05 00010 g007
Figure 8. CH4 conversion with the time on stream at a reaction temperature of 700 °C for samples previously reduced with H2 at 700 °C (NA-R and LaNA-R) and the samples activated under CH4 flow (Na-C and LaNA-C).
Nanoenergyadv 05 00010 g008
Figure 9. Proposed reaction mechanism for methane decomposition on Ni-based catalysts.
Nanoenergyadv 05 00010 g009
Figure 10. XRD after the CH4 decomposition between 500 and 700 °C for samples (a) previously reduced with H2 at 700 °C and (b) activated under CH4 flow.
Nanoenergyadv 05 00010 g010
Figure 11. X-ray diffractograms after time on stream at 700 °C for samples reduced with H2 at 700 °C and heated with CH4.
Nanoenergyadv 05 00010 g011
Figure 12. (a) TPO and (b) DTA profiles of the spent catalysts after reactions at 700 °C.
Nanoenergyadv 05 00010 g012
Figure 13. Raman spectra of carbon deposited on the spent catalysts after reaction at 700 °C.
Nanoenergyadv 05 00010 g013
Figure 14. Scanning electron microscopies (SEM) (10 kx, 20 kV) of (a) NA-R, (b) NA-C, (c) LaNA-R, and (d) LaNA-C samples after stability tests at 700 °C.
Nanoenergyadv 05 00010 g014
Figure 15. Transmission electron microscopy (TEM) of (a,b) LaNA-R and (c,d) LaNA-C in different magnification samples after stability tests at 700 °C.
Nanoenergyadv 05 00010 g015
Table 1. Physicochemical properties and crystallite sizes of the calcined samples.
SamplesSBETVporesDpores
(m2 gcat−1) a(cm3 gcat−1) b(nm) b
NA-C1740.3233.8
MgNA-C940.1713.9
LaNA-C1000.2164.9
CaNA-C920.2544.9
LiNA-C1180.3448.1
a Determined by BET method. b Determined by BJH method.
Table 2. Deconvolution of CO2-TPD profiles of the calcined and reduced samples.
SamplesTemperature (°C)Relative Basic Sites
(mmol gcat−1)
Total Basic SitesTotal Area
1st Peak2nd Peak3rd PeakWeakMediumStrong(mmol gcat−1)(a.u.)
NA-C2202864460.240.290.380.91401
MgNA-C2273204660.150.140.100.39118
LaNa-C2142733840.150.170.210.53237
CaNA-C2223145200.220.240.190.65173
LiNa-C2022803840.070.060.100.2399
Table 3. Deconvolution of H2-TPR profiles in the temperature function.
SamplesPeak Temperature (°C)Relative Fraction of Peak Reduction Area (%)Total Area (a.u.)
1st2nd3rd1st2nd3rd
NA-C-610690-76243218
MgNA-C6277077852555193306
LaNA-C469652695450473437
CaNA-C556677750948433727
LiNA-C431651685440563389
Table 4. Average Ni0 crystallite size of the samples after reduction and catalytic tests.
SamplesAverage Crystallite Size by XRD (nm) a
Reduced at 700 °CAfter a Reaction Between 500 and 750 °C After Reaction at 700 °C
Reduced with H2Heated with CH4Reduced with H2Heated with CH4
NA13.27.37.715.69.3
MgNA9.97.57.8--
LaNA7.213.116.315.311.2
CaNA18.4 12.27.4--
LiNA16.814.716.6--
a Obtained from Ni0 reflection at 44.5°.
Table 5. Weight variation by carbon oxidation and carbon formation rate after the reactions.
SampleWeight Loss (%)Carbon Formation Rate (mg gcat−1 h−1)
Reduced with H2Heated with CH4Reduced with H2Heated with CH4
NA72.6277.98864.52666.50
LaNA82.6181.09550.73162.18
Disclaimer/Publisher’s Note: The statements, opinions and data contained in all publications are solely those of the individual author(s) and contributor(s) and not of MDPI and/or the editor(s). MDPI and/or the editor(s) disclaim responsibility for any injury to people or property resulting from any ideas, methods, instructions or products referred to in the content.