Article

Spray-Coated Transition Metal Dichalcogenides as Hole Transport Layers in Inverted NFA-Based Organic Photovoltaics with Enhanced Stability under Solar and Artificial Light

by
Marinos Tountas
1,*,†,
Katerina Anagnostou
1,†,
Evangelos Sotiropoulos
1,
Christos Polyzoidis
1 and
Emmanuel Kymakis
1,2,*
1
Department of Electrical & Computer Engineering, Hellenic Mediterranean University (HMU), 71410 Heraklion, Greece
2
Institute of Emerging Technologies (i-EMERGE), HMU Research Center, 71410 Heraklion, Greece
*
Authors to whom correspondence should be addressed.
These authors contributed equally to this work.
Nanoenergy Adv. 2024, 4(3), 221-234; https://doi.org/10.3390/nanoenergyadv4030014
Submission received: 26 February 2024 / Revised: 4 July 2024 / Accepted: 5 July 2024 / Published: 10 July 2024
(This article belongs to the Topic Nanomaterials for Energy and Environmental Applications)

Abstract

:
In this study, we explored the potential of exfoliated transition metal dichalcogenides (TMDs) as innovative spray-coated hole transport layers (HTLs) in organic photovoltaics (OPVs), addressing the need for efficient and stable materials in solar cell technology. This research was motivated by the need for alternative HTLs that can offer enhanced performance under varying lighting conditions, particularly in indoor environments. Employing UV-visible absorption and Raman spectroscopy, we characterized the optical properties of MoS2, MoSe2, WS2, and WSe2, confirming their distinct excitonic transitions and direct bandgap features. The nanocrystalline nature of these TMDs, revealed through XRD patterns and crystallite size estimation using the Scherrer method, significantly contributes to their enhanced physical properties and operational efficiency as HTLs in OPVs. These TMDs were then integrated into OPV devices and evaluated under standard solar and indoor lighting conditions, to assess their effectiveness as HTLs. The results demonstrated that MoS2, in particular, displayed remarkable performance, rivalling traditional HTL materials like MoO3. It maintained high power conversion efficiency across a spectrum of light intensities, illustrating its versatility for both outdoor and indoor applications. Additionally, MoS2 showed superior stability over extended periods, suggesting its potential for long-term usage in OPVs. This study contributes significantly to the field of photovoltaic materials, presenting TMDs, especially MoS2, as promising candidates for efficient and stable OPVs in diverse lighting conditions, thereby broadening the scope of solar cell applications.

1. Introduction

Organic photovoltaics (OPVs) have evolved substantially since the first devices were developed in the 1980s [1], with their reported power conversion efficiency (PCE) displaying an overall increase of >19% as of 2023 [2]. However, it has become increasingly clear that the objective of this class of emerging photovoltaics is not to replace conventional silicon (Si)-based solar panels but to complement them. Organic solar cells (OSCs) offer a lightweight and cost-effective alternative for solar power generation, and while recent advancements have enabled PCE values to approach those of commercial Si solar panels, their role is seen as supplementary, particularly in applications where flexibility and lower weight are advantageous [2]. There are persisting drawbacks that generally hinder their commercial viability and market adoption. OPVs exhibit low stability, as exposure to moisture, oxygen, and UV light cause degradation of the cell, especially to the polymer active layer (AL) [3,4]. Therefore, providing protection of the AL is a pragmatic approach for increasing the overall stability of OPVs.
To address these challenges effectively and enhance the performance and stability of OPVs, it is crucial to not only focus on the photoactive materials but also on other critical components of the cell where performance losses are likely to occur [5]. The carrier-selective charge transport interlayers, essential for enhancing photogenerated carrier extraction from the bulk heterojunction (BHJ) [6], are of particular interest. The ideal interlayer, whether it is an n-or a p-type semiconductor, should align energetically with the BHJ layer and offer processing flexibility to prevent issues like de-wetting and pinhole formation [7]. While there are several successful examples of electron-transporting layers (ETLs), like ZnO, LiF, and PFN-Br in organic photovoltaics (OPVs) [8,9], progress in hole-transporting layers (HTLs) has been more constrained, with fewer materials available [10,11,12]. Currently, the conjugated polymer Poly(3,4-ethylenedioxythiophene) (PEDOT:PSS) stands out as the most prevalent HTL in standard OPV architectures, while the vacuum-deposited MoO3 is typically employed in inverted structures [13]. However, the hygroscopic and acidic nature of PEDOT:PSS can degrade the commonly used indium tin oxide (ITO) electrode material. To overcome these challenges, alternative HTL materials, including various transition metal oxides, have been suggested [14,15]. Yet, these alternatives often require vacuum processing or complicated chemistry, involving high-temperature annealing, which add complexity and energy intensity to the cell manufacturing process.
The advent of Internet of Things (IoT) technology has catalyzed the development of low-energy electronics, such as wireless sensors and router nodes, that can be powered by the minimal energy harvested from indoor lighting. This advancement has carved a specialized market for OPVs. Compared to their inorganic counterparts [16,17], OPVs have demonstrated superior performance in indoor environments, attributed to their highly tunable light absorption properties and lower current leakage. Studies indicate that OPVs can achieve indoor PCE values exceeding 30% [18,19], underscoring their potential in powering low-energy-consuming electronics for indoor use. A key factor distinguishing indoor from outdoor power generation is the light source. Indoor artificial lighting, predominantly within the visible spectrum, has a varied emission spectrum and significantly lower intensity—often less than one-thousandth—compared to outdoor sunlight [20].
TMDs are a class of layered semiconductor that consist of one transition metal atom (M) and two chalcogen atoms (X) in the general chemical formula of MX2 (Figure 1a). In their bulk or three-dimensional (3D) form, TMDs appear as stacked layers of X–M–X held together by weak van der Waals forces, wherein the metal and chalcogen atoms are connected with strong covalent bonds, creating a honeycomb-shaped lattice. Bulk TMDs are semiconductors with a tunable indirect energy bandgap that widens and shifts toward a direct bandgap with the transition toward a monolayer structure [21,22,23]. Due to their optical and electrical properties [24,25], TMDs such as MoS2, WS2, MoSe2, and WSe2 have been utilized in electronic and optoelectronic technologies [25,26], photovoltaic devices [27,28], and energy storage [29].
Monolayer or few-layer TMDs can be produced with exfoliation, which involves the isolation of individual flakes from the bulk crystal by applying an external force which is sufficient to overcome the van der Waals forces holding the individual flakes together. Exfoliation is a top-down production method that can be achieved by mechanical cleavage, also known as “the ScotchTM tape method” [30] and chemical exfoliation [31,32]. In this study, liquid phase exfoliation (LPE) was employed to produce exfoliated TMD flakes directly from pristine TMD powders.
LPE is a simple, high-yield, scalable, and cost-effective method of producing exfoliated mono- and few-layer nanomaterials such as graphene, graphene-related materials, and TMDs [33,34,35,36]. The driving force behind LPE is cavitation [37,38]. Cavitation involves the formation and growth of bubbles within the liquid medium due to the applied high ultrasonic frequencies, the intercalation of these microbubbles between the individual sheets of the bulk nanomaterial, and subsequent collapse of said bubbles. Upon implosion, the energy that is released from the generated shock wave is sufficient to overcome the van der Waals forces between the materials layers resulting in the separation of individual nanosheets. Another important benefit of LPE as a production method for exfoliated nanomaterials is that the produced nanosheets are dispersed directly into a liquid medium from the bulk crystal and are ready to use for further modification through chemical reactions or for thin film formulation using several deposition methods, such as spin-coating [27] or inkjet printing [39].
For the deposition of the LPE-produced TMD flakes onto the AL, spray-coating was employed. This deposition method was selected as an alternative to spin-coating, as it ensures the distribution of TMD flakes all along the AL surface and allows for thickness control by monitoring the total volume of the dispersion that is sprayed, with results ranging from TMD flake decoration to thick, compact TMD films. The spray-coating method involves spraying a solution or dispersion of a material onto the desired substrate, which is mildly heated to aid the evaporation of the solvent, thus leaving behind a solid thin film of the material.
In this study, we embarked on a detailed investigation into the properties and applications of exfoliated transition metal dichalcogenides (TMDs), focusing on their potential as alternative HTLs in OPVs. Our approach involved a thorough characterization of the optical properties of MoS2, MoSe2, WS2, and WSe2 using UV-visible absorption and Raman spectroscopy. These analyses confirmed the unique excitonic transitions and direct bandgap features of the TMDs, aligning well with the existing literature. A significant aspect of our research was the integration of these TMDs into OPV systems, where they were tested under both standard and indoor lighting conditions. This dual-environment testing was crucial in evaluating the real-world applicability of the TMDs in OPVs, especially considering the varying light conditions in practical scenarios. The results were particularly promising for MoS2, which emerged as a strong contender among the TMDs for its effective performance as an HTL. This material demonstrated comparable, and in some cases superior, efficacy to traditional HTL materials like MoO3, both under standard solar illumination and indoor lighting conditions. The adaptability of MoS2 across different light intensities, essential for indoor applications, was a standout finding, highlighting its potential versatility in photovoltaic applications. Furthermore, the long-term stability of MoS2, surpassing that of MoO3 in extended aging tests, pointed to its robustness and suitability for sustained use in OPV applications. This comprehensive study not only advances our understanding of TMDs in photovoltaic applications but also opens new avenues for the development of more efficient and versatile OPVs, suitable for a wide range of environmental conditions.

2. Materials and Methods

For the preparation of the exfoliated TMDs, molybdenum(IV) sulfide (98%), molybdenum(IV) selenide (99.9%, metals basis), tungsten(IV) sulfide, (99.8%, metals basis) and tungsten(IV) selenide (99.8%, metals basis) were purchased from Thermo Fisher Scientific Inc. (Waltham, MA, USA), while isopropanol (IPA, ≥99.8%) was purchased from Honeywell (Charlotte, NC, USA). LPE was performed using a Hielscher (Teltow, Germany) UP200Ht (200 W, 26 KHz) ultrasonic probe. The resulting TMD dispersions were isolated via centrifugation using a Hettich (Tuttlingen, Germany) UNIVERSAL 320 centrifuge. The UV-Vis absorption spectra of the TMD dispersions and their respective sprayed film were recorded using a Shimadzu (Kyoto, Japan) UV-2401 PC Recording Spectrophotometer and UV Probe Software v2.34. Raman spectra were obtained at room temperature using a modified LabRAM HR Raman Spectrometer (HORIBA Scientific, Kyoto, Japan). Deposition of TMD dispersions via spray-coating was carried out using a commercial spray gun and air compressor.
To prepare the TMD dispersions, 135 mg of each TMD powder was added to 45 mL IPA for an initial concentration of 3 mg/mL. Each mixture was ultrasonicated using an ultrasonic probe (200 W, 26 KHz, 100% Amplitude) for 2 h to achieve LPE. An ice bath was used throughout LPE to maintain low temperatures and avoid overheating. The dispersions were then centrifugated for 20 min to remove unexfoliated particles and aggregates. MoS2(IPA) was centrifugated at 5000 rpm (3075 g), while MoSe2(IPA), WS2(IPA), and WSe2(IPA) were centrifugated at 4000 rpm (1968 g). The resulting dispersions (Figure 1b) were diluted to C/2 and their UV-Vis absorption spectra were recorded (Figure 2). Solid samples for Raman spectroscopy measurements (Figure S1) were prepared by drop-casting 10 μL of each LPE-prepared TMD dispersion onto O2-plasma-treated (50 W, 5 min) silicon (Si) substrates.
For the device fabrication, the glass substrates with the indium tin oxide (ITO) pattern from Naranjo first underwent a thorough cleaning process. Initially, they were subjected to ultrasonic cleaning (37 KHz) in a sequence of deionized water, acetone, and isopropanol, each for a duration of 10 min. This was followed by drying using a flow of nitrogen gas and then an oxygen plasma treatment (50 W) for 5 min. Subsequently, a zinc oxide (ZnO) solution was prepared by mixing zinc acetate dihydrate (0.5 g) and ethanolamine (0.14 g) in 10 mL of 2-methoxyethanol. This mixture was stirred vigorously for 12 h under ambient conditions. The ZnO ETL layer was deposited at 4000 rpm for 40 s and was annealed at 160 °C for 30 min. For the active layer (AL), a solution comprising Poly[(2,6-(4,8-bis(5-(2-ethylhexyl)thiophen-2-yl)-benzo[1,2-b:4,5-b’]dithiophene))-alt-(5,5-(1’,3’-di-2-thienyl-5’,7’-bis(2-ethylhexyl)benzo[1’,2’-c:4’,5’-c’]dithiophene-4,8-dione)] (PBDB-T) and 3,9-bis(2-methylene-(3-(1,1-dicyanomethylene)-indanone))-5,5,11,11-tetrakis(4-hexylphenyl)-dithieno[2,3-d:2’,3’-d’]-s-indaceno [1,2-b:5,6-b’]dithiophene (ITIC) in a 1:1 ratio (10:10 mg) was dissolved in 992.5 μL of chlorobenzene (CB) and 7.5 μL of 1,8-diiodooctane (DIO). This solution was then spin-coated onto the prepared substrates at a speed of 2500 rpm for 60 s. To complete the device, molybdenum oxide (MoOx) and silver (Ag), measuring 10 nm and 100 nm, respectively, were thermally evaporated onto the substrates. This was realized in a high-vacuum thermal evaporator operating at less than 3 × 10⁻⁶ Torr, creating an active area of 0.4 cm2. To incorporate the TMD flakes as the HTL into the OPV devices, 0.5 mL of each TMD (IPA) dispersion were spray-coated onto the previously deposited AL. The spray-coating deposition was performed using a commercial airbrush and the devices were placed on a hotplate (40 °C) to aid solvent removal. The carrier gas pressure was set at 2 bar, the deposition rate was 5 spray cycles per ml, the deposition height was set at 15 cm, and the length was set at ~7 cm. The dispersions were sprayed in 30 s intervals to allow time for the solvent to evaporate before beginning the next spray cycle.
The electrical performance of the solar cell devices was evaluated through current density-voltage (J-V) testing conducted in a nitrogen-filled glovebox. This process utilized an Oriel solar simulator equipped with a 450 W Xenon lamp and an AM1.5G filter. To ensure accuracy, the lamp’s intensity was carefully calibrated to 100 mW/cm2 using a KG5 silicon reference cell before any measurements were taken. Regarding the indoor light measurements, an ultra-low-cost, commercial, and remotely-controlled smart LED lamp was used that has the ability to change its emission spectrum and intensity per user’s taste. The X-ray diffraction (XRD) measurements were conducted using a RIGAKU (Tokyo, Japan) D/MAX-2500 powder diffractometer equipped with a monochromated Cu Kα radiation [(λ = 1.5418 Å)]. Steady-state and time-resolved photoluminescence spectra were measured using a fluorescence spectrophotometer (FS5, Edinburgh Instruments, Livingston, UK) at room temperature. The samples were excited using a 478.4 nm laser as a source.

3. Results

3.1. Characterization of Exfoliated TMDs

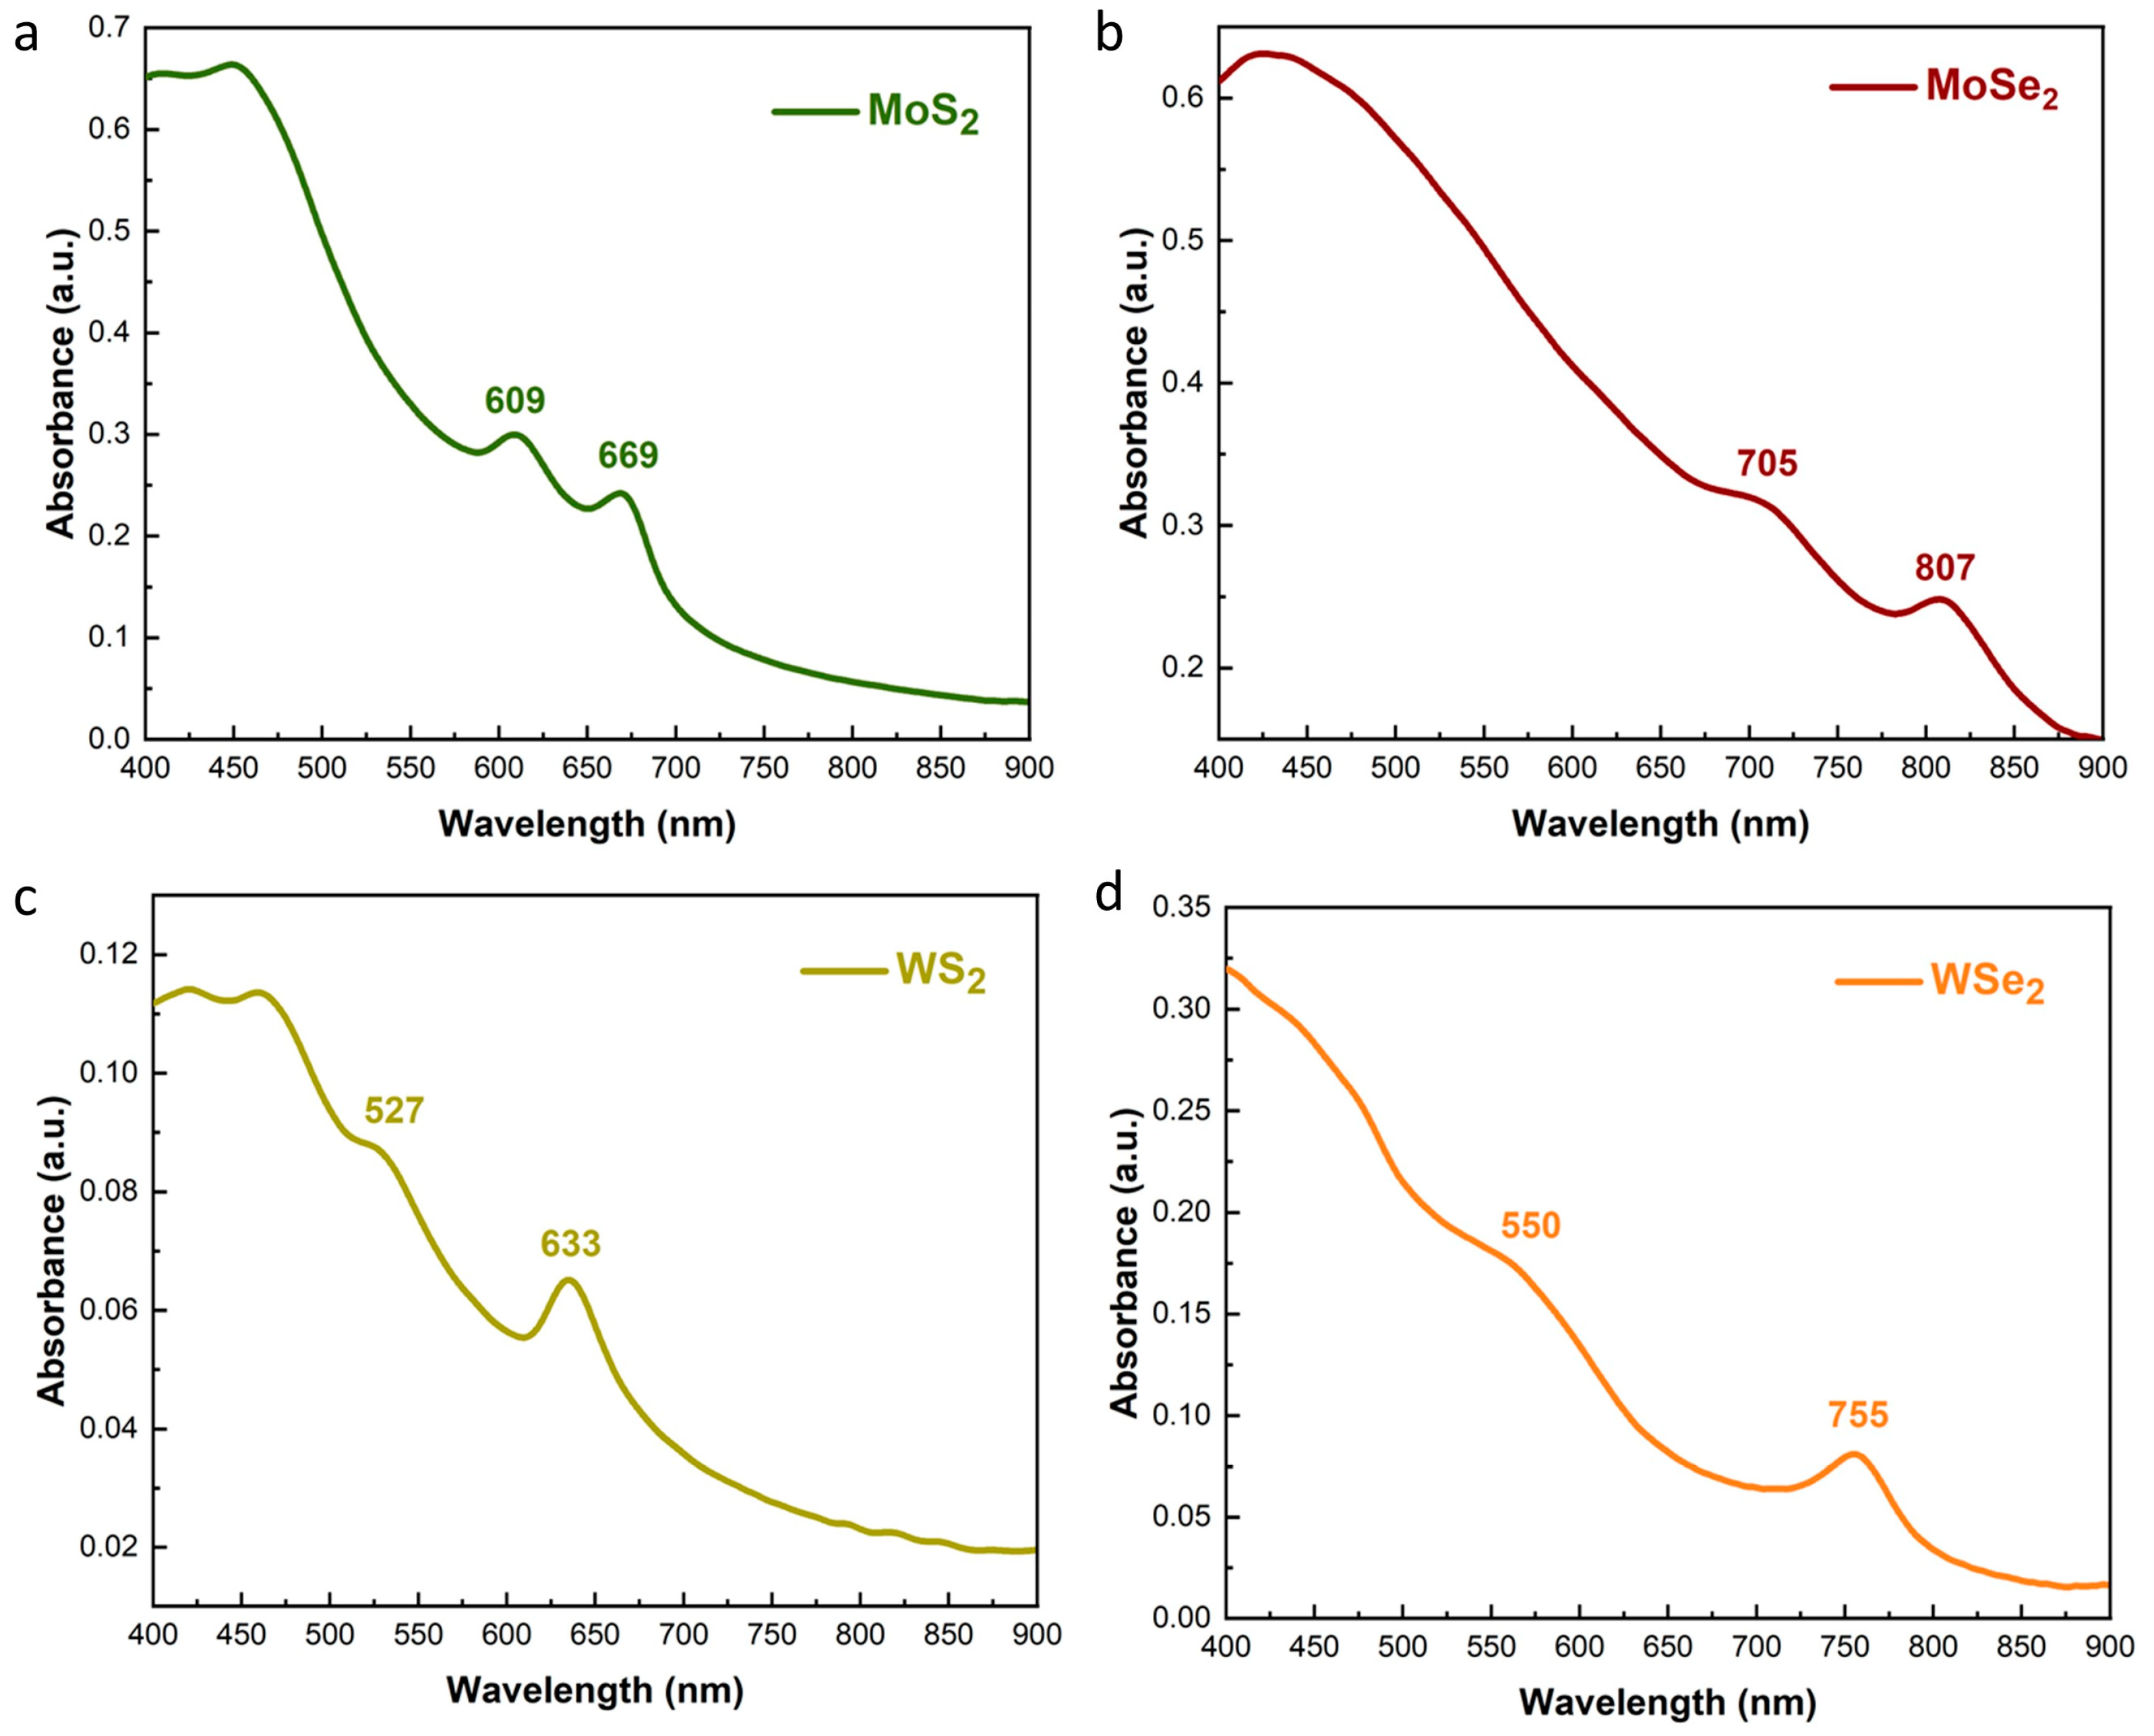
When observing the recorded UV-Vis absorption spectra of all four TMD dispersions in IPA (Figure 2), characteristic peaks of each sample are visible in the region of 500–900 nm and are in agreement with previous reports on the optical absorbance of TMD nanoflakes prepared via LPE with ultrasonication [40,41,42]. The absorption peaks appearing at 609 and 669 nm for MoS2, 705 and 807 nm for MoSe2, 527 and 633 nm for WS2, and ~550 and 755 nm for WSe2 are attributed to excitonic transitions that arise at the K point of the Brillouin zone and are a characteristic of the 2H-phase [40,43,44,45]. Absorbance at ≤500 nm is owed to direct transitions from the valence band to the conduction band [40,43]. The Raman spectra obtained for the prepared TMD samples are available in the Supporting Information (Figure S1). Raman spectra were obtained at room temperature using a modified LabRAM HR Raman Spectrometer (HORIBA Scientific, Kyoto, Japan). Raman excitation was achieved with a 532 nm central wavelength solid-state laser module with a maximum laser output power of 90 mW. The microscope was coupled with a 50× microscopic objective lens with a 0.5 numerical aperture and 10.6 mm working distance (LMPlanFLN 50×/0.5, Olympus, Tokyo, Japan) that delivered the excitation light and collected the Raman signals. The laser spot size was approximately 1.7 μm laterally and about 2 μm axially. A 600 grooves/mm grating was used, resulting in a Raman spectral resolution of ~2 cm−1. Figure S1 shows the recorded Raman spectra of the four LPE-prepared TMD flakes.
For MoS2, two prominent peaks are observed at 376 cm−1 and 401 cm−1, and are attributed to first-order Raman modes, which are associated with the in-plane (E12g) and out-of-plane (A1g) vibrational modes, respectively [46,47,48,49]. For MoSe2, the E12g peak appears at 281 cm−1 and is lower in intensity than the A1g, which is observed at 236 cm−1 [49,50,51]. An additional low-intensity peak is observed at 346 cm−1, which is assigned to the B12g vibrational mode. This mode is not active in bulk MoSe2; instead, it becomes Raman active only in few-layer MoSe2 samples. In the WS2 spectrum, two signals are detected: a strong peak at 338 cm−1, which is attributed to the second-order Raman peak, associated with the 2LA(M) phonon mode, and the A2g peak at 418 cm−1 [40,52]. In WS2, the E12g peak, which appears at ~355 cm−1, overlaps with the high-intensity 2LA peak [52]. The resonance of the 2LA(M) phonon mode is activated in monolayer WS2, thus providing ample evidence of the successful exfoliation of the bulk material [53]. Two additional low-intensity peaks appear at 171 and 227 cm−1. Lastly, the Raman spectrum recorded for WSe2 exhibits a strong peak at 247 cm−1, which is interpreted as the combination signal of the A1g and E12g Raman modes [49,50,54]. This can be an indicator of successful exfoliation, as distinct A1g and E12g peaks are observed in the bulk WSe2 samples. The appearance of the B12g peak, which is inactive in the bulk WSe2, further supports the generation of few-layer flakes upon ultrasonication.
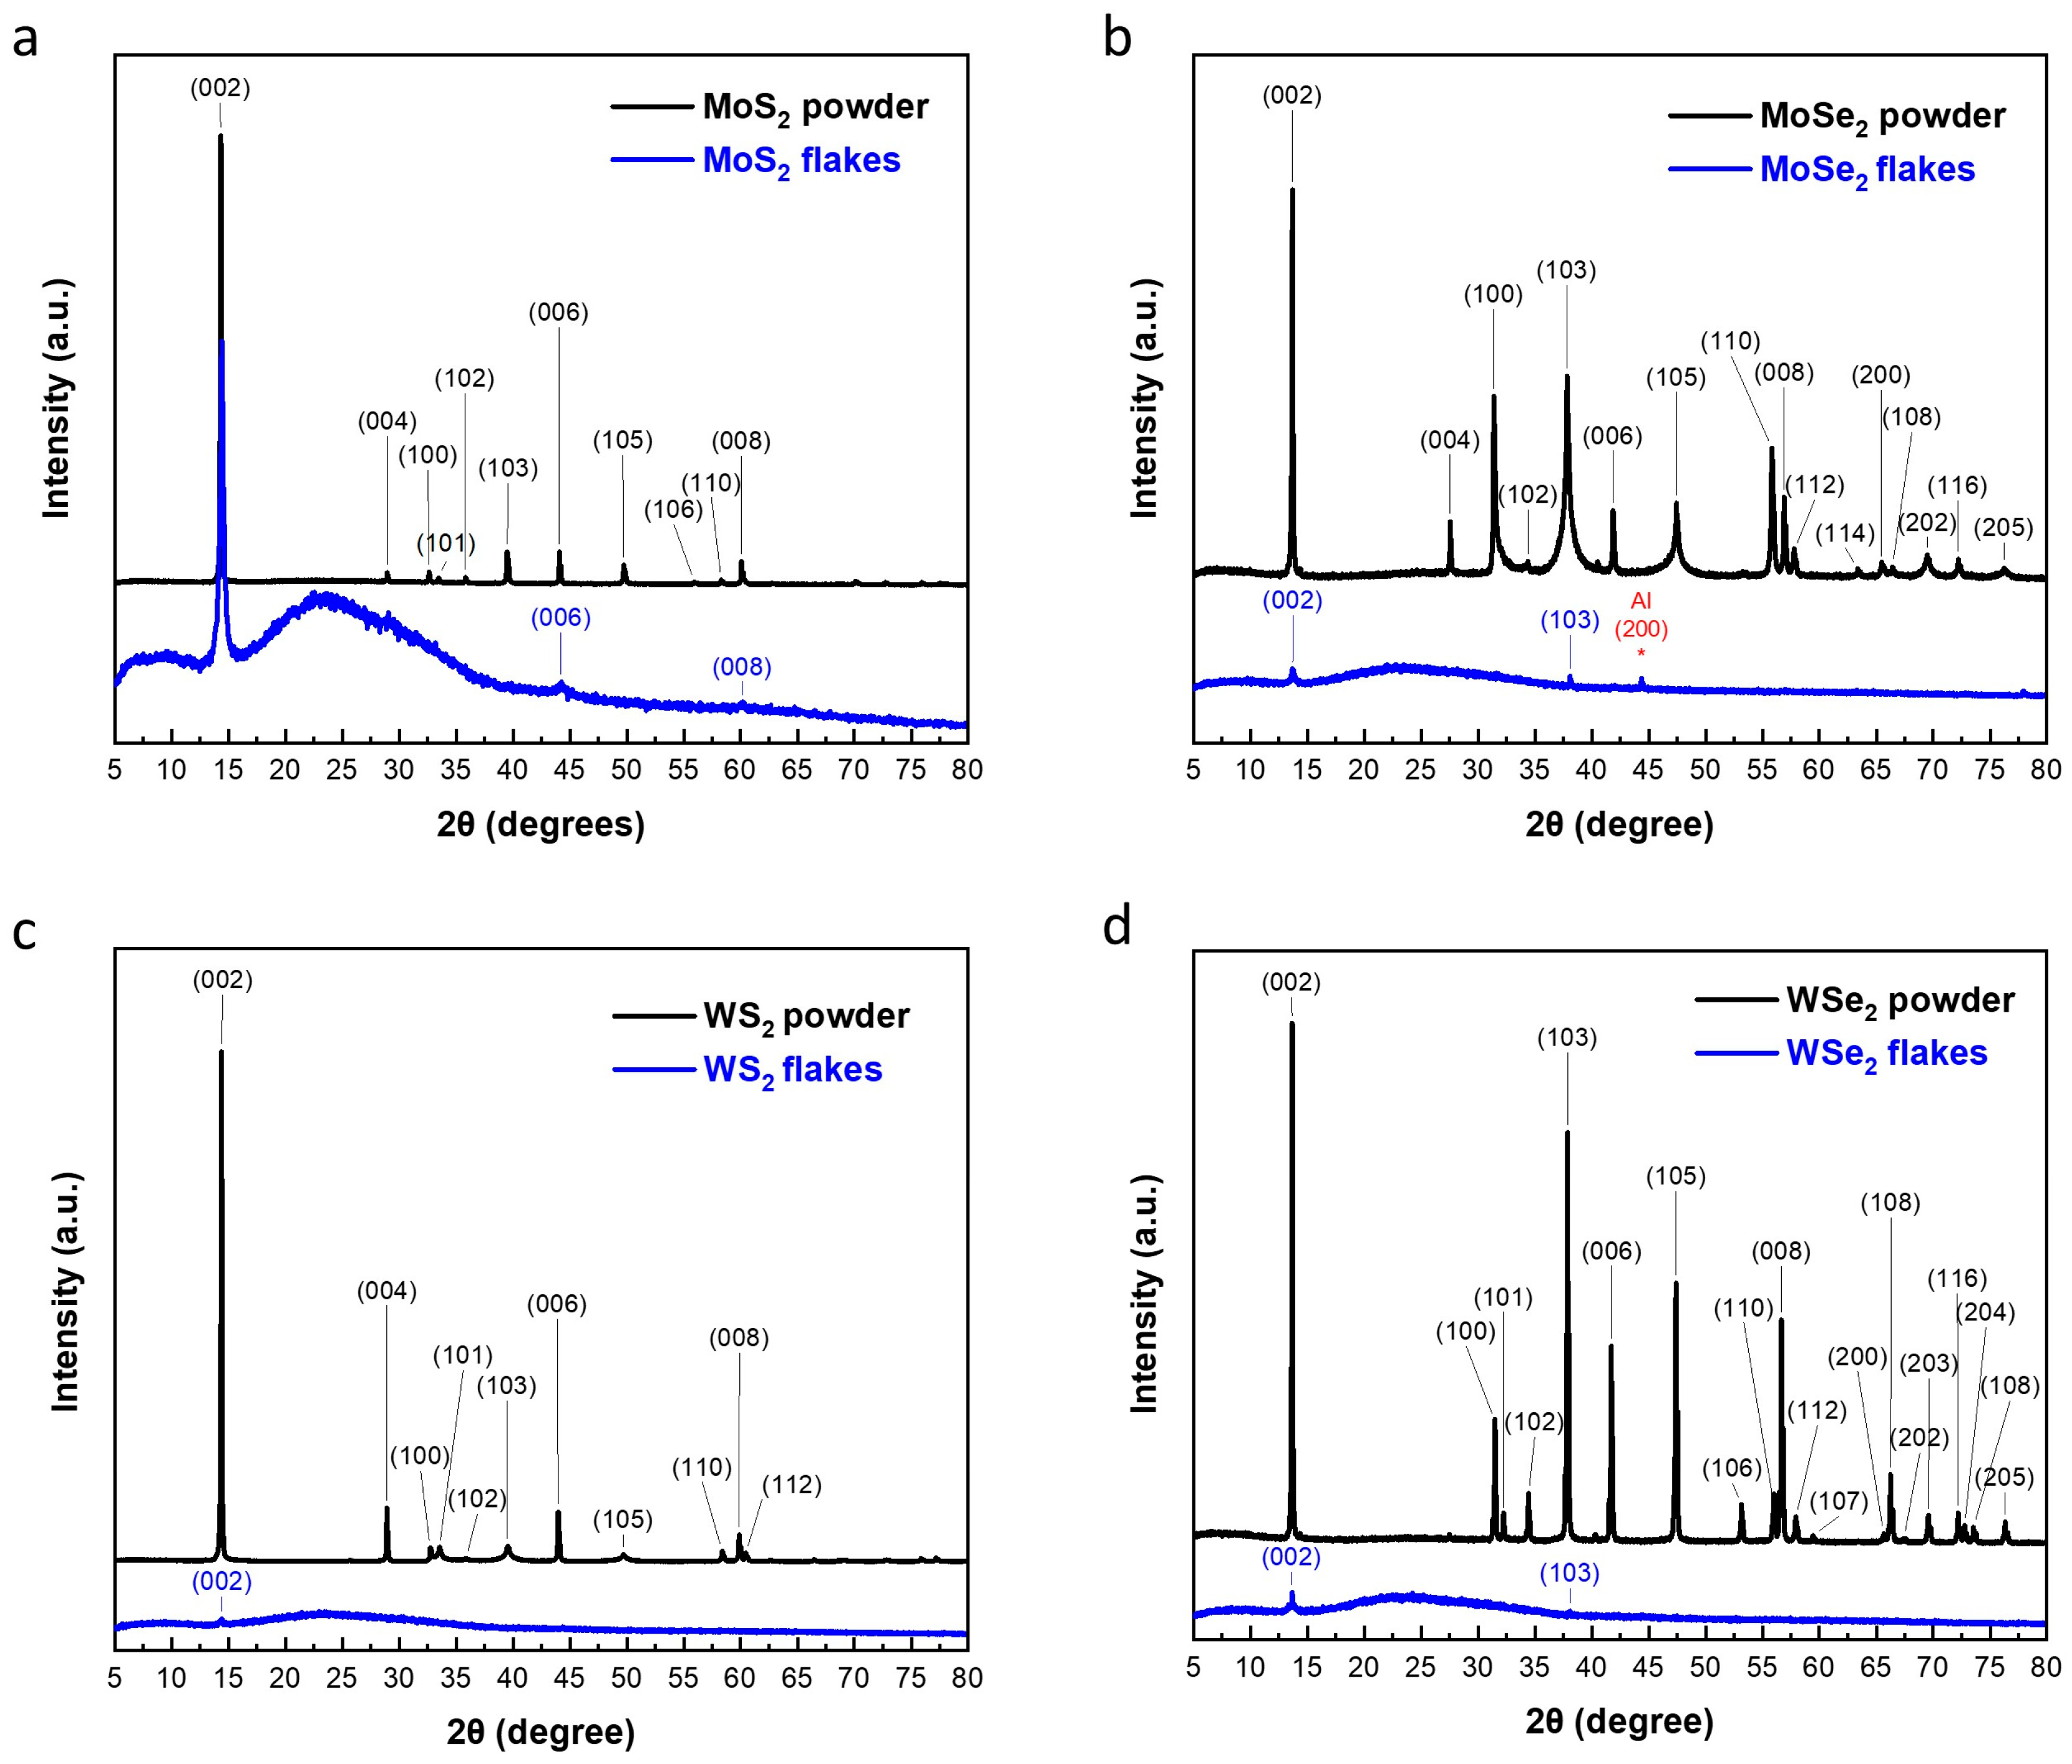
X-ray diffraction (XRD) was utilized to investigate the crystalline phase, the degree of crystallinity, and the flake size of the TMD samples [55,56]. The TMD powders, which were measured as reference samples, exhibit multiple narrow, sharp peaks with high intensity, indicating the existence of multiple layers within well-ordered, highly crystalline materials, a long-range order, and well-defined scattering planes (Figure 3) [57]. The XRD patterns of the TMD powders are in agreement with previous reports for MoS2, MoSe2, WS2, and WSe2 that match 2H polytype, which has a hexagonal (D6h) symmetry (space group: P63/mmc) [58,59,60,61,62,63,64,65,66]. The LPE-prepared TMD flakes have fewer and broader diffraction peaks compared to their respective powders, indicating that the crystallites are of smaller size and/or have a less ordered crystalline structure. Overall, the obtained results for our LPE-prepared samples are in accordance with previously reported XRD patterns for the same exfoliated nanomaterials [67,68]. The absence of any other diffraction peaks is evidence that the exfoliated TMD flakes remain pristine and unoxidized during the LPE process [65,67,69]. A low-intensity peak appears at 44° for the MoSe2 flakes, which are attributed to the aluminum (Al) holder [70]. A broad peak appears for the spray-coated TMD samples, which is attributed to the signal derived from the glass substrates that the TMD flakes were deposited onto [71,72]. The (002) peak is present in both the bulk and exfoliated samples and corresponds to a typical Bragg’s plane for a nanocrystalline structure [73]. The (002) peak of all the LPE-prepared flakes is much lower than that of the respective powder, indicating successful exfoliation of the bulk material and the generation of few-layer TMDs. Apart from the crystal structure analysis, information on the particle size can be derived from the XRD peaks through the Scherrer equation [74,75,76]. The average crystallite size D was calculated for the four TMDs at 14.44 nm for MoS2, 35 nm for MoSe2, 18.27 nm for WS2, and 31.11 nm for WSe2, according to the Scherrer equation, where K = 0.94, λ = 0.154 nm, β = FWHM, and θ = peak position. The nanocrystalline size of TMD flakes affects their physical, optoelectronic, mechanical, and structural properties [25,57,77,78,79,80]. The reduced crystallite sizes, estimated at 14.44 nm for MoS2, 35 nm for MoSe2, 18.27 nm for WS2, and 31.11 nm for WSe2, contribute to a significant increase in surface area and active sites [81]. This nanocrystalline feature is crucial for improving the charge transfer efficiency and stability of the TMDs when applied as HTLs in OPVs. The enhanced performance of MoS2, notably its high PCE and superior stability under various lighting conditions, can be attributed to its nanocrystalline nature, which facilitates efficient charge transfer properties and effective charge carrier dynamics [82,83]. The size-dependent optical and electrical properties of these nanocrystalline TMDs underscore their suitability for integration into OPVs, wherein their ability to enhance light absorption and charge separation can significantly boost device performance.

3.2. Device Fabrication and Characterization

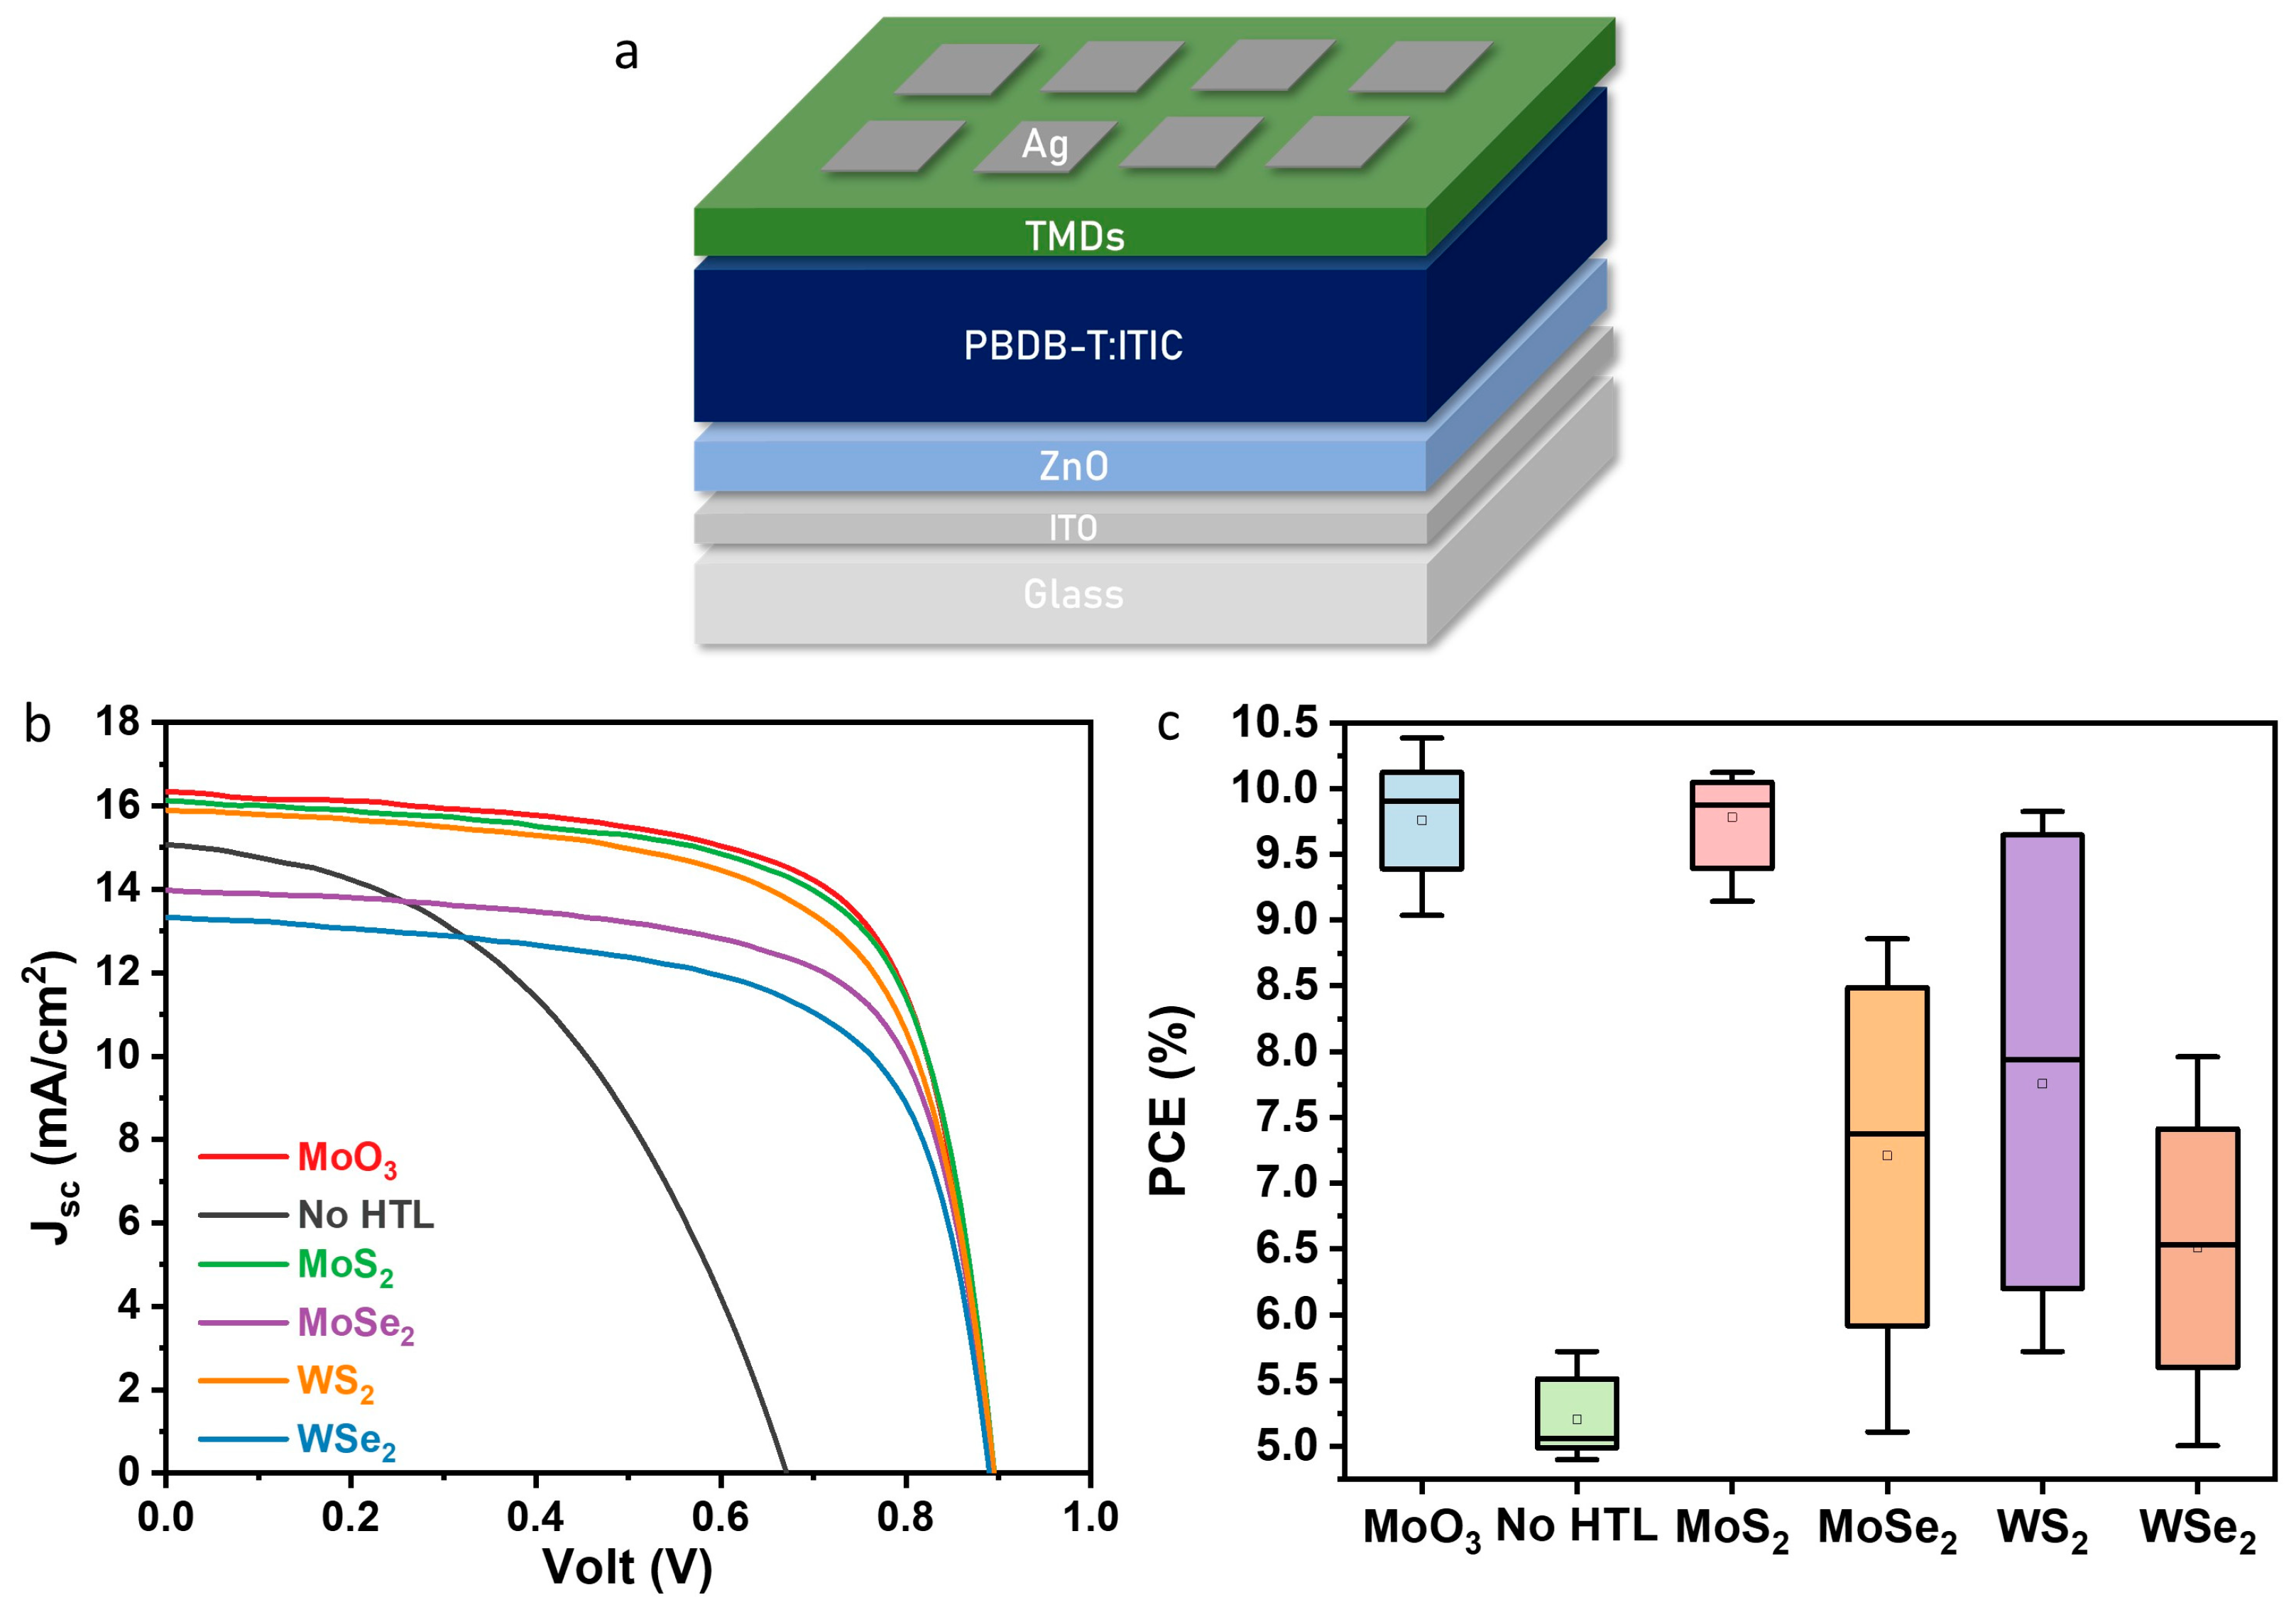
The inverted architecture followed for the development of the OPVs in our study is displayed in Figure 4a. A thin layer of the four TMDs was inserted via spray-coating between the AL and the metal anode, in order to fabricate the OPVs. The active layer that was used is PBDB-T:ITIC. The J-V curves in Figure 4b compare the devices fabricated without HTL, with MoO3, and with the four TMDs MoS2, MoSe2, WS2, and WSe2 taken under 100 mW/cm2 AM 1.5G illumination. Table 1 and Figure 4c provide a summary of the average values for short-circuit current density (Jsc), open-circuit voltage (Voc), fill factor (FF), and power conversion efficiency (PCE) for each device set. The absence of an HTL results in a lower PCE of 5.2 ± 0.14%, attributed to a diminished built-in electric field. This is evident from the moderate open-circuit voltage (Voc) and short-circuit current density (Jsc) values. The devices incorporating the commonly used MoO3 as an HTL show a significant improvement, elevating the PCE to 9.68 ± 0.12%. This improvement underscores the pivotal role of an efficient HTL in photovoltaic devices, as evidenced by the increased Voc and Jsc values, along with a substantial FF. Shifting focus to the four TMDs, MoS2, MoSe2, WS2, and WSe2, as spray-coated replacement HTLs, each MX2 demonstrates unique performance characteristics. MoS2 emerges as a strong contender, closely rivaling the performance of MoO3 with a PCE of 9.78 ± 0.10%. This suggests that MoS2 is an effective alternative to traditional HTL materials. MoSe2, while showing a higher Voc, yielded a PCE of 7.21 ± 0.41%, indicating a compromise in other performance metrics like Jsc and FF. WS2 and WSe2, although exhibiting comparable Voc values to MoS2 and MoO3, fall short in their overall performance, with PCEs of 7.76 ± 0.64% and 6.51 ± 0.62%, respectively. Their lower Jsc and FF values suggest that while they are viable HTL materials, their efficiency in converting solar energy is less optimal compared to MoS2 and MoO3.
To study the charge carrier dynamics and understand the efficiency of the various HTLs in the OPVs, we performed photoluminescence (PL) measurements (Figure S2). In the provided PL graph, MoO3 is denoted with the lowest PL intensity among the tested HTL materials, suggesting a highly efficient charge separation. The TMDs also demonstrate quenched PL intensities in comparison to the device without an HTL, indicating enhanced charge transfer processes and potential photovoltaic performance benefits over the non-HTL baseline. This quenching effect is a positive attribute for the application of these materials in solar cell technologies.

3.3. Indoor Devices Fabrication and Characterization

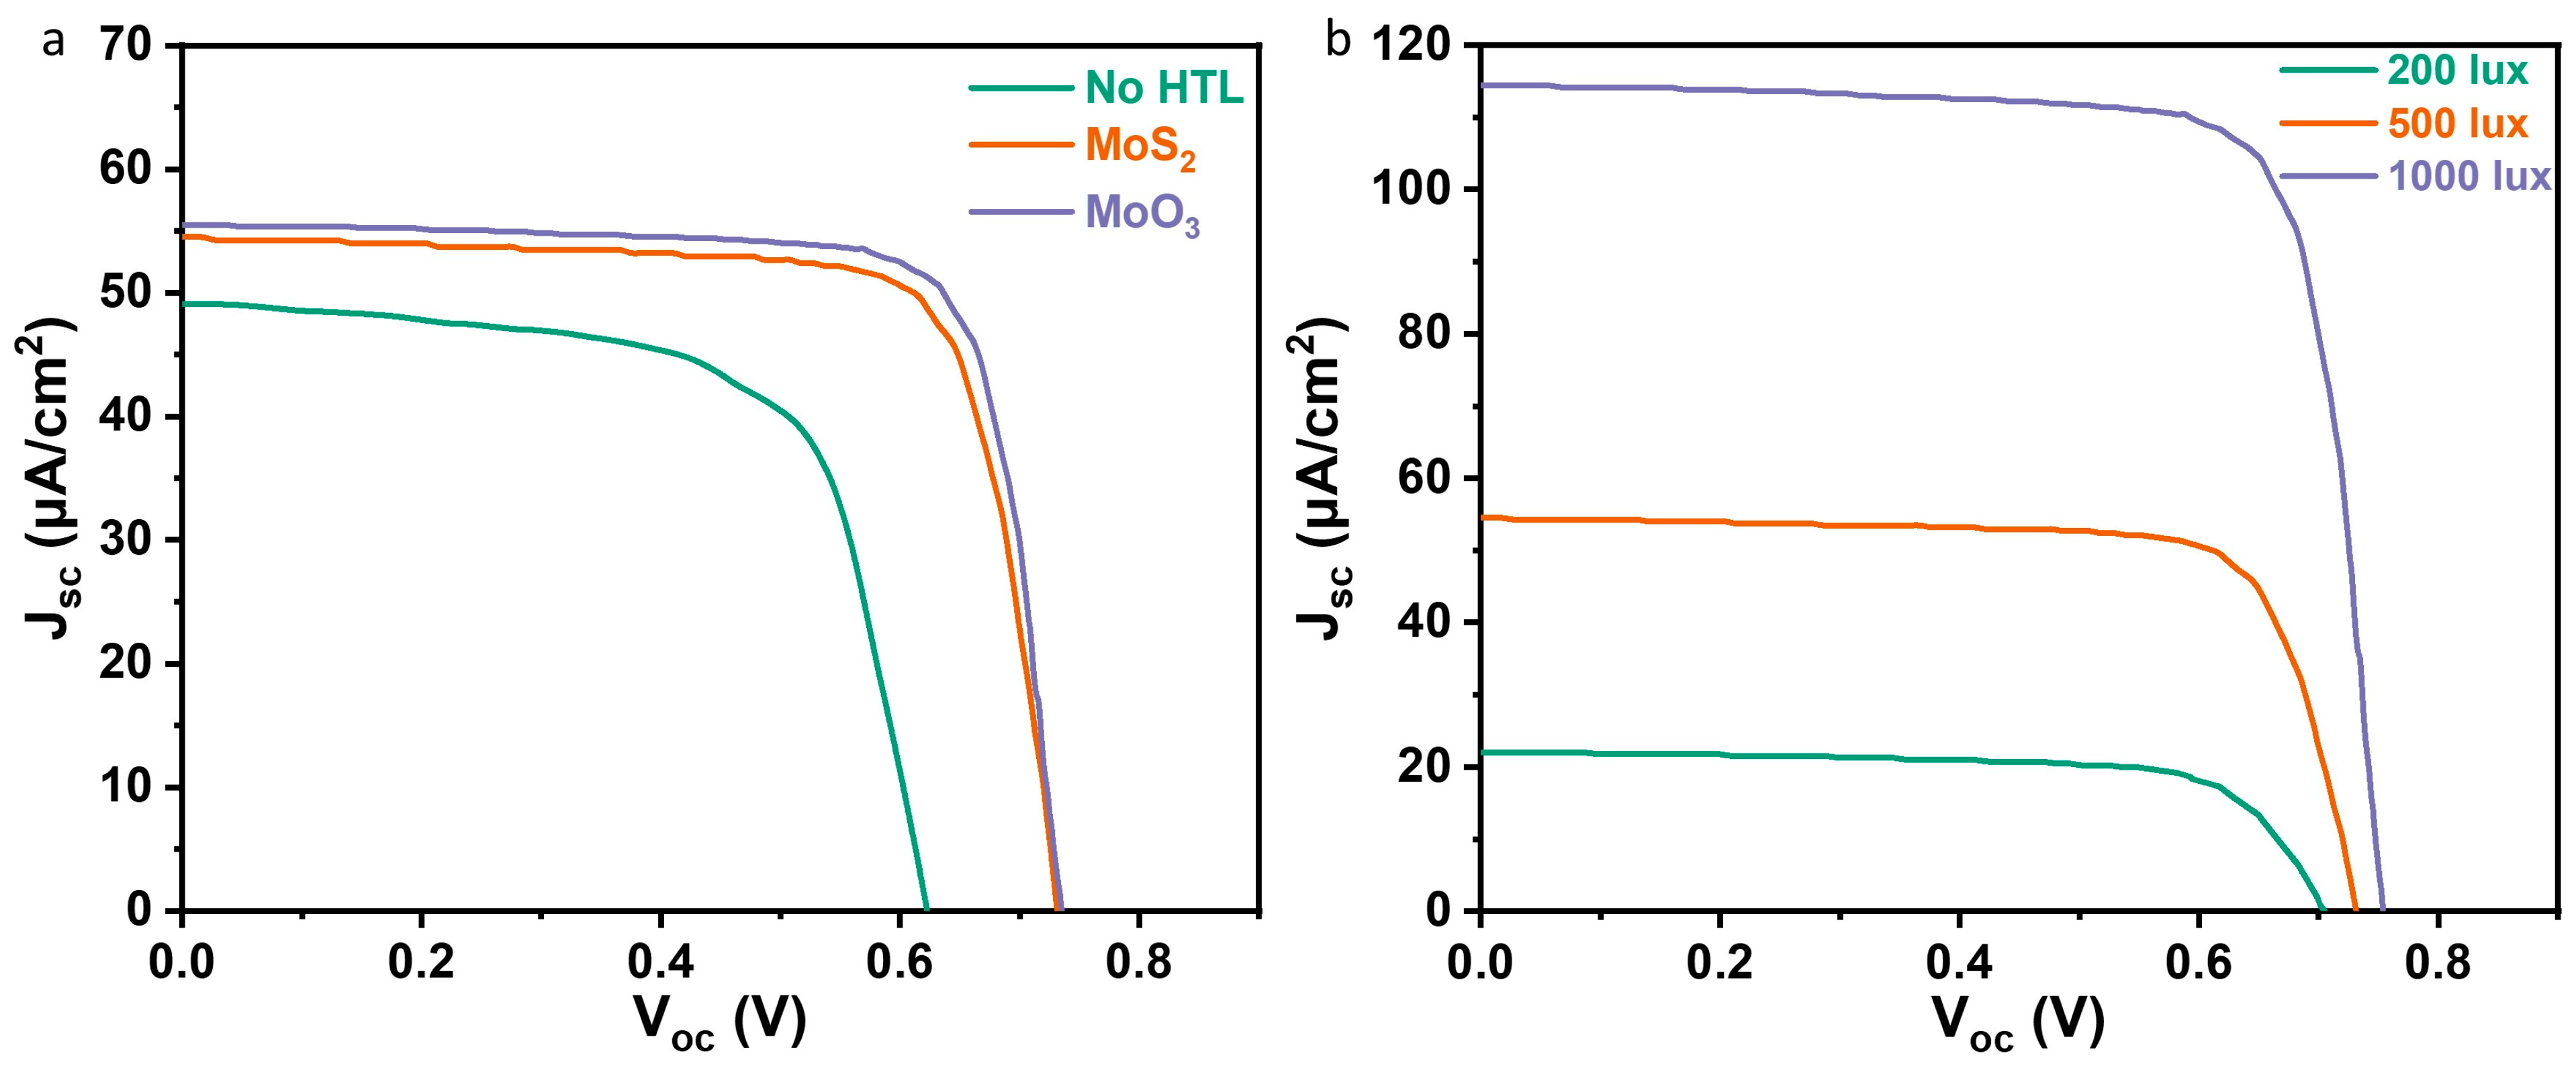
Next, we tested the OPV cells under indoor lighting conditions. This step was crucial to further understand the real-world applicability of these cells in environments where artificial lighting is the primary light source. Specifically, we focused on the discrete illuminance steps of 200, 500, and 1000 lux, which are representative of conditions typical for indoor environments, like homes, offices, and commercial spaces. The corresponding light power intensities measured at these lux levels were 61, 151, and 303 µW/cm2, respectively. The data in Figure 5 and Table 2 offer compelling insight into the performance of the devices under different indoor lighting conditions, particularly highlighting the efficacy of MoS2 as an HTL, similar to the results seen before under AM 1.5G illumination. The efficacy of MoS2 as a viable HTL, comparable to the commonly used MoO3, is notably highlighted. At the outset, under the 200 lux condition, which simulates dim indoor environments, OPV cells without any HTL demonstrate a baseline PCE of 8.55%. When MoS2 is employed as an HTL, there is a significant leap in performance, with the PCE reaching 17.29%, a figure that closely rivals the 17.97% achieved by cells using MoO3. This parity in efficiency at a lower light intensity underscores the potential of MoS2 as a strong alternative to MoO3 in less illuminated settings. As the light intensity increases to 500 lux, representing moderately lit indoor spaces, the trend affirming the competitiveness of MoS2 continues, as seen in Figure 5a. In this scenario, cells without an HTL show a modest improvement in PCE to 9.68%, but the introduction of MoS2 as an HTL results in a substantial boost in efficiency to 19.16%, a value that nearly matches the 20.02% PCE of cells with MoO3. This consistency in performance under medium light intensity further cements MoS2’s position as an effective and viable HTL option. At the highest light intensity of 1000 lux, akin to well-lit indoor areas, the efficiency of cells without an HTL reaches 10.83%. However, OPV cells incorporating MoS2 as an HTL exhibit an impressive PCE of 22.26%, maintaining a close gap with the 22.34% PCE observed in cells using MoO3. This sustained high performance of MoS2 at elevated light levels highlights its capability to operate effectively across a broad spectrum of lighting conditions, making it a compelling alternative to the traditional MoO3 HTL.

3.4. Device Stability

Finally, we evaluated the stability of MoS2 by comparing it to the devices without HTL and MoO3 by implementing the ISOS D1 protocol in unencapsulated devices. Figure 6 illustrates the comparative analysis of the normalized PCE over time, under aging conditions, for the OPVs with different HTLs. This analysis is valuable for understanding the longevity and stability of OPV cells under prolonged use. Initially, all HTL conditions start with a normalized PCE set at unity for ease of comparison. As the aging time progresses, there is a discernible decline in the normalized PCE for all conditions, which is indicative of the degradation phenomena typical in OPV cells. However, the rate and degree of degradation vary notably between the different HTLs. Cells without an HTL suffer the most pronounced degradation, with their efficiency dropping precipitously to about 30% of the initial value within 100 h, before entering a more gradual decline. Conversely, the OPV cells incorporating MoS2 as an HTL exhibit remarkable stability. The normalized PCE of MoS2-equipped cells shows a slight initial reduction but remains notably high, above 80%, even after several hundred hours of aging. This gentle slope indicates that MoS2 significantly decelerates the degradation process, suggesting an inherent stability that is beneficial for the longevity of OPV cells. Intriguingly, while MoO3 is known for its stability-enhancing properties, the graph indicates that over extended aging times, its stability is surpassed by that of MoS2. MoO3 begins with a strong retention of PCE but experiences a more pronounced degradation past the 300 h mark. The decline in the stability of MoO3 could be attributable to several factors. MoO3 is known to be sensitive to moisture and could undergo morphological and structural changes over time when exposed to environmental factors. Additionally, the interaction between MoO3 and the photoactive layers may lead to interfacial reactions that compromise stability. In contrast, MoS2’s superior stability might be ascribed to its robustness against environmental factors and a more stable interfacial contact with the photoactive layer. Owing to its hydrophobic nature [84] and nonacidic and chemically stable properties [85] the layered structure of MoS2 could provide a barrier from ambient moisture penetration, which is a critical factor in the aging of OPV cells. Moreover, the chemical stability of MoS2 might contribute to fewer interfacial reactions, thereby preserving the integrity of the photoactive layer over time.

4. Conclusions

In this study, we studied exfoliated transition metal dichalcogenides (TMDs) and explored their applications as innovative hole transport layers (HTLs) in organic photovoltaics (OPVs), both under standard and indoor lighting conditions. Our analysis, supported by UV-visible absorption and Raman spectroscopy, confirmed the unique optical properties of MoS2, MoSe2, WS2, and WSe2, in line with the existing literature on their excitonic transitions and direct bandgap features. The integration of these TMDs into OPVs not only enhanced power conversion efficiency (PCE) compared to the devices without HTL in standard light conditions but also showed remarkable performance under indoor lighting, an aspect critical for real-world applications. Particularly noteworthy was the performance of MoS2, which demonstrated its effectiveness as an HTL, rivaling traditional materials like MoO3 in both standard and indoor lighting conditions. This adaptability of MoS2, maintaining high PCE across a range of light intensities typical of indoor environments, underscores its potential for diverse photovoltaic applications. Moreover, this study revealed the superior stability of MoS2 compared to MoO3 over extended aging periods, suggesting its robustness against environmental factors and affirming its suitability for long-term usage in OPVs. These findings not only contribute significantly to the field of photovoltaic materials science but also pave the way for the development of more efficient and stable OPVs suitable for a variety of lighting conditions.

Supplementary Materials

The following supporting information can be downloaded at: https://www.mdpi.com/article/10.3390/nanoenergyadv4030014/s1, Figure S1: Raman spectra of LPE-prepared (a) MoS2; (b) MoSe2; (c) WS2; (d) WSe2 flakes; Figure S2: Photoluminescence (PL) spectra of the four TMDs deposited on BHJ on glass.

Author Contributions

Conceptualization, M.T., K.A. and E.K; methodology, M.T. and K.A.; validation, M.T., K.A., E.S. and C.P.; formal analysis, M.T., K.A. and C.P.; investigation, M.T., K.A., E.S. and C.P.; resources, E.K.; data curation, M.T., K.A. and C.P.; writing—original draft preparation, M.T., K.A.; writing—review and editing, M.T., K.A. and E.K.; visualization, M.T., K.A., E.S., C.P. and E.K.; supervision, E.K.; project administration, E.K.; funding acquisition, E.K. All authors have read and agreed to the published version of the manuscript.

Funding

This research project was supported by the Hellenic Foundation for Research and Innovation (H.F.R.I.) under the “2nd Call for H.F.R.I. Research Projects to support Faculty Members & Researchers” (Project Number: 02712).

Data Availability Statement

The original contributions presented in the study are included in the article/Supplementary Material, further inquiries can be directed to the corresponding author/s.

Conflicts of Interest

The authors declare no conflicts of interest.

References

  1. Chamberlain, G.A. Organic Solar Cells: A Review. Sol. Cells 1983, 8, 47–83. [Google Scholar] [CrossRef]
  2. Best Research-Cell Efficiency Chart. Available online: https://www.nrel.gov/pv/cell-efficiency.html (accessed on 3 December 2023).
  3. Chander, N.; Singh, S.; Iyer, S.S.K. Stability and Reliability of P3HT:PC61BM Inverted Organic Solar Cells. Sol. Energy Mater. Sol. Cells 2017, 161, 407–415. [Google Scholar] [CrossRef]
  4. Solak, E.K.; Irmak, E. Advances in Organic Photovoltaic Cells: A Comprehensive Review of Materials, Technologies, and Performance. RSC Adv. 2023, 13, 12244–12269. [Google Scholar] [CrossRef] [PubMed]
  5. Firdaus, Y.; Le Corre, V.M.; Khan, J.I.; Kan, Z.; Laquai, F.; Beaujuge, P.M.; Anthopoulos, T.D. Key Parameters Requirements for Non-Fullerene-Based Organic Solar Cells with Power Conversion Efficiency >20%. Adv. Sci. 2019, 6, 1802028. [Google Scholar] [CrossRef]
  6. Zheng, Z.; Hu, Q.; Zhang, S.; Zhang, D.; Wang, J.; Xie, S.; Wang, R.; Qin, Y.; Li, W.; Hong, L.; et al. A Highly Efficient Non-Fullerene Organic Solar Cell with a Fill Factor over 0.80 Enabled by a Fine-Tuned Hole-Transporting Layer. Adv. Mater. 2018, 30, 1801801. [Google Scholar] [CrossRef]
  7. Zhou, H.; Zhang, Y.; Mai, C.-K.; Collins, S.D.; Nguyen, T.-Q.; Bazan, G.C.; Heeger, A.J. Conductive Conjugated Polyelectrolyte as Hole-Transporting Layer for Organic Bulk Heterojunction Solar Cells. Adv. Mater. 2014, 26, 780–785. [Google Scholar] [CrossRef]
  8. He, Z.; Zhong, C.; Su, S.; Xu, M.; Wu, H.; Cao, Y. Enhanced Power-Conversion Efficiency in Polymer Solar Cells Using an Inverted Device Structure. Nat. Photon 2012, 6, 591–595. [Google Scholar] [CrossRef]
  9. Sun, C.; Wu, Z.; Hu, Z.; Xiao, J.; Zhao, W.; Li, H.-W.; Li, Q.-Y.; Tsang, S.-W.; Xu, Y.-X.; Zhang, K.; et al. Interface Design for High-Efficiency Non-Fullerene Polymer Solar Cells. Energy Environ. Sci. 2017, 10, 1784–1791. [Google Scholar] [CrossRef]
  10. Sun, Y.; Takacs, C.J.; Cowan, S.R.; Seo, J.H.; Gong, X.; Roy, A.; Heeger, A.J. Efficient, Air-Stable Bulk Heterojunction Polymer Solar Cells Using MoOx as the Anode Interfacial Layer. Adv. Mater. 2011, 23, 2226–2230. [Google Scholar] [CrossRef]
  11. de Jong, M.P.; van IJzendoorn, L.J.; de Voigt, M.J.A. Stability of the Interface between Indium-Tin-Oxide and Poly(3,4-Ethylenedioxythiophene)/Poly(Styrenesulfonate) in Polymer Light-Emitting Diodes. Appl. Phys. Lett. 2000, 77, 2255–2257. [Google Scholar] [CrossRef]
  12. Wijeyasinghe, N.; Regoutz, A.; Eisner, F.; Du, T.; Tsetseris, L.; Lin, Y.-H.; Faber, H.; Pattanasattayavong, P.; Li, J.; Yan, F.; et al. Copper(I) Thiocyanate (CuSCN) Hole-Transport Layers Processed from Aqueous Precursor Solutions and Their Application in Thin-Film Transistors and Highly Efficient Organic and Organometal Halide Perovskite Solar Cells. Adv. Funct. Mater. 2017, 27, 1701818. [Google Scholar] [CrossRef]
  13. Kyaw, A.K.K.; Sun, X.W.; Jiang, C.Y.; Lo, G.Q.; Zhao, D.W.; Kwong, D.L. An Inverted Organic Solar Cell Employing a Sol-Gel Derived ZnO Electron Selective Layer and Thermal Evaporated MoO3 Hole Selective Layer. Appl. Phys. Lett. 2008, 93, 221107. [Google Scholar] [CrossRef]
  14. Manders, J.R.; Tsang, S.-W.; Hartel, M.J.; Lai, T.-H.; Chen, S.; Amb, C.M.; Reynolds, J.R.; So, F. Solution-Processed Nickel Oxide Hole Transport Layers in High Efficiency Polymer Photovoltaic Cells. Adv. Funct. Mater. 2013, 23, 2993–3001. [Google Scholar] [CrossRef]
  15. Yu, X.; Marks, T.J.; Facchetti, A. Metal Oxides for Optoelectronic Applications. Nat. Mater 2016, 15, 383–396. [Google Scholar] [CrossRef] [PubMed]
  16. Cutting, C.L.; Bag, M.; Venkataraman, D. Indoor Light Recycling: A New Home for Organic Photovoltaics. J. Mater. Chem. C 2016, 4, 10367–10370. [Google Scholar] [CrossRef]
  17. Arai, R.; Furukawa, S.; Hidaka, Y.; Komiyama, H.; Yasuda, T. High-Performance Organic Energy-Harvesting Devices and Modules for Self-Sustainable Power Generation under Ambient Indoor Lighting Environments. ACS Appl. Mater. Interfaces 2019, 11, 9259–9264. [Google Scholar] [CrossRef] [PubMed]
  18. Lee, C.; Lee, J.-H.; Lee, H.H.; Nam, M.; Ko, D.-H. Over 30% Efficient Indoor Organic Photovoltaics Enabled by Morphological Modification Using Two Compatible Non-Fullerene Acceptors. Adv. Energy Mater. 2022, 12, 2200275. [Google Scholar] [CrossRef]
  19. Bi, P.; An, C.; Zhang, T.; Chen, Z.; Xu, Y.; Cui, Y.; Wang, J.; Li, J.; Wang, Y.; Ren, J.; et al. Achieving 31% Efficiency in Organic Photovoltaic Cells under Indoor Light Using a Low Energetic Disorder Polymer Donor. J. Mater. Chem. A 2023, 11, 983–991. [Google Scholar] [CrossRef]
  20. Polyzoidis, C.; Rogdakis, K.; Kymakis, E. Indoor Perovskite Photovoltaics for the Internet of Things—Challenges and Opportunities toward Market Uptake. Adv. Energy Mater. 2021, 11, 2101854. [Google Scholar] [CrossRef]
  21. Chaves, A.; Azadani, J.G.; Alsalman, H.; da Costa, D.R.; Frisenda, R.; Chaves, A.J.; Song, S.H.; Kim, Y.D.; He, D.; Zhou, J.; et al. Bandgap Engineering of Two-Dimensional Semiconductor Materials. Npj 2D Mater. Appl. 2020, 4, 29. [Google Scholar] [CrossRef]
  22. Tongay, S.; Zhou, J.; Ataca, C.; Lo, K.; Matthews, T.S.; Li, J.; Grossman, J.C.; Wu, J. Thermally Driven Crossover from Indirect toward Direct Bandgap in 2D Semiconductors: MoSe2 versus MoS2. Nano Lett. 2012, 12, 5576–5580. [Google Scholar] [CrossRef] [PubMed]
  23. Wang, G.; Chernikov, A.; Glazov, M.M.; Heinz, T.F.; Marie, X.; Amand, T.; Urbaszek, B. Colloquium: Excitons in Atomically Thin Transition Metal Dichalcogenides. Rev. Mod. Phys. 2018, 90, 021001. [Google Scholar] [CrossRef]
  24. Mak, K.F.; Shan, J. Photonics and Optoelectronics of 2D Semiconductor Transition Metal Dichalcogenides. Nat. Photon 2016, 10, 216–226. [Google Scholar] [CrossRef]
  25. Wang, Q.H.; Kalantar-Zadeh, K.; Kis, A.; Coleman, J.N.; Strano, M.S. Electronics and Optoelectronics of Two-Dimensional Transition Metal Dichalcogenides. Nat. Nanotechnol. 2012, 7, 699–712. [Google Scholar] [CrossRef] [PubMed]
  26. Pospischil, A.; Mueller, T. Optoelectronic Devices Based on Atomically Thin Transition Metal Dichalcogenides. Appl. Sci. 2016, 6, 78. [Google Scholar] [CrossRef]
  27. Lin, Y.; Adilbekova, B.; Firdaus, Y.; Yengel, E.; Faber, H.; Sajjad, M.; Zheng, X.; Yarali, E.; Seitkhan, A.; Bakr, O.M.; et al. 17% Efficient Organic Solar Cells Based on Liquid Exfoliated WS2 as a Replacement for PEDOT:PSS. Adv. Mater. 2019, 31, 1902965. [Google Scholar] [CrossRef] [PubMed]
  28. Barrera, D.; Jawaid, A.; Daunis, T.B.; Cheng, L.; Wang, Q.; Lee, Y.-J.; Kim, M.J.; Kim, J.; Vaia, R.A.; Hsu, J.W.P. Inverted OPVs with MoS2 Hole Transport Layer Deposited by Spray Coating. Mater. Today Energy 2017, 5, 107–111. [Google Scholar] [CrossRef]
  29. Hoang Huy, V.P.; Ahn, Y.N.; Hur, J. Recent Advances in Transition Metal Dichalcogenide Cathode Materials for Aqueous Rechargeable Multivalent Metal-Ion Batteries. Nanomaterials 2021, 11, 1517. [Google Scholar] [CrossRef] [PubMed]
  30. Frindt, R.F. Single Crystals of MoS2 Several Molecular Layers Thick. J. Appl. Phys. 2004, 37, 1928–1929. [Google Scholar] [CrossRef]
  31. Dines, M.B. Lithium Intercalation via N-Butyllithium of the Layered Transition Metal Dichalcogenides. Mater. Res. Bull. 1975, 10, 287–291. [Google Scholar] [CrossRef]
  32. Yang, R.; Fan, Y.; Mei, L.; Shin, H.S.; Voiry, D.; Lu, Q.; Li, J.; Zeng, Z. Synthesis of Atomically Thin Sheets by the Intercalation-Based Exfoliation of Layered Materials. Nat. Synth. 2023, 2, 101–118. [Google Scholar] [CrossRef]
  33. Hernandez, Y.; Nicolosi, V.; Lotya, M.; Blighe, F.M.; Sun, Z.; De, S.; McGovern, I.T.; Holland, B.; Byrne, M.; Gun’Ko, Y.K.; et al. High-Yield Production of Graphene by Liquid-Phase Exfoliation of Graphite. Nat. Nanotechnol. 2008, 3, 563–568. [Google Scholar] [CrossRef] [PubMed]
  34. Paton, K.R.; Varrla, E.; Backes, C.; Smith, R.J.; Khan, U.; O’Neill, A.; Boland, C.; Lotya, M.; Istrate, O.M.; King, P.; et al. Scalable Production of Large Quantities of Defect-Free Few-Layer Graphene by Shear Exfoliation in Liquids. Nat. Mater. 2014, 13, 624–630. [Google Scholar] [CrossRef] [PubMed]
  35. Ciesielski, A.; Samorì, P. Graphene via Sonication Assisted Liquid-Phase Exfoliation. Chem. Soc. Rev. 2013, 43, 381–398. [Google Scholar] [CrossRef] [PubMed]
  36. Bonaccorso, F.; Bartolotta, A.; Coleman, J.N.; Backes, C. 2D-Crystal-Based Functional Inks. Adv. Mater. 2016, 28, 6136–6166. [Google Scholar] [CrossRef] [PubMed]
  37. Suslick, K.S. Sonochemistry. Science 1990, 247, 1439–1445. [Google Scholar] [CrossRef]
  38. Lauterborn, W.; Kurz, T.; Geisler, R.; Schanz, D.; Lindau, O. Acoustic Cavitation, Bubble Dynamics and Sonoluminescence. Ultrason. Sonochem. 2007, 14, 484–491. [Google Scholar] [CrossRef] [PubMed]
  39. Finn, D.J.; Lotya, M.; Cunningham, G.; Smith, R.J.; McCloskey, D.; Donegan, J.F.; Coleman, J.N. Inkjet Deposition of Liquid-Exfoliated Graphene and MoS2 Nanosheets for Printed Device Applications. J. Mater. Chem. C 2014, 2, 925–932. [Google Scholar] [CrossRef]
  40. Mishra, A.K.; Lakshmi, K.V.; Huang, L. Eco-Friendly Synthesis of Metal Dichalcogenides Nanosheets and Their Environmental Remediation Potential Driven by Visible Light. Sci. Rep. 2015, 5, 15718. [Google Scholar] [CrossRef]
  41. Dong, N.; Li, Y.; Feng, Y.; Zhang, S.; Zhang, X.; Chang, C.; Fan, J.; Zhang, L.; Wang, J. Optical Limiting and Theoretical Modelling of Layered Transition Metal Dichalcogenide Nanosheets. Sci. Rep. 2015, 5, 14646. [Google Scholar] [CrossRef]
  42. Li, H.; Zhang, Q.; Yap, C.C.R.; Tay, B.K.; Edwin, T.H.T.; Olivier, A.; Baillargeat, D. From Bulk to Monolayer MoS2: Evolution of Raman Scattering. Adv. Funct. Mater. 2012, 22, 1385–1390. [Google Scholar] [CrossRef]
  43. Muscuso, L.; Cravanzola, S.; Cesano, F.; Scarano, D.; Zecchina, A. Optical, Vibrational, and Structural Properties of MoS2 Nanoparticles Obtained by Exfoliation and Fragmentation via Ultrasound Cavitation in Isopropyl Alcohol. J. Phys. Chem. C 2015, 119, 3791–3801. [Google Scholar] [CrossRef]
  44. Zhao, W.; Ghorannevis, Z.; Chu, L.; Toh, M.; Kloc, C.; Tan, P.-H.; Eda, G. Evolution of Electronic Structure in Atomically Thin Sheets of WS2 and WSe2. ACS Nano 2013, 7, 791–797. [Google Scholar] [CrossRef] [PubMed]
  45. Wang, K.; Feng, Y.; Chang, C.; Zhan, J.; Wang, C.; Zhao, Q.; Coleman, J.N.; Zhang, L.; Blau, W.J.; Wang, J. Broadband Ultrafast Nonlinear Absorption and Nonlinear Refraction of Layered Molybdenum Dichalcogenide Semiconductors. Nanoscale 2014, 6, 10530–10535. [Google Scholar] [CrossRef] [PubMed]
  46. Lee, C.; Yan, H.; Brus, L.E.; Heinz, T.F.; Hone, J.; Ryu, S. Anomalous Lattice Vibrations of Single- and Few-Layer MoS2. ACS Nano 2010, 4, 2695–2700. [Google Scholar] [CrossRef] [PubMed]
  47. Mignuzzi, S.; Pollard, A.J.; Bonini, N.; Brennan, B.; Gilmore, I.S.; Pimenta, M.A.; Richards, D.; Roy, D. Effect of Disorder on Raman Scattering of Single-Layer MoS2. Phys. Rev. B 2015, 91, 195411. [Google Scholar] [CrossRef]
  48. Korn, T.; Heydrich, S.; Hirmer, M.; Schmutzler, J.; Schüller, C. Low-Temperature Photocarrier Dynamics in Monolayer MoS2. Appl. Phys. Lett. 2011, 99, 102109. [Google Scholar] [CrossRef]
  49. Niu, Y.; Gonzalez-Abad, S.; Frisenda, R.; Marauhn, P.; Drüppel, M.; Gant, P.; Schmidt, R.; Taghavi, N.S.; Barcons, D.; Molina-Mendoza, A.J.; et al. Thickness-Dependent Differential Reflectance Spectra of Monolayer and Few-Layer MoS2, MoSe2, WS2 and WSe2. Nanomaterials 2018, 8, 725. [Google Scholar] [CrossRef] [PubMed]
  50. Tonndorf, P.; Schmidt, R.; Böttger, P.; Zhang, X.; Börner, J.; Liebig, A.; Albrecht, M.; Kloc, C.; Gordan, O.; Zahn, D.R.T.; et al. Photoluminescence Emission and Raman Response of Monolayer MoS2, MoSe2, and WSe2. Opt. Express 2013, 21, 4908–4916. [Google Scholar] [CrossRef]
  51. Nam, D.; Lee, J.-U.; Cheong, H. Excitation Energy Dependent Raman Spectrum of MoSe2. Sci Rep 2015, 5, 17113. [Google Scholar] [CrossRef]
  52. Berkdemir, A.; Gutiérrez, H.R.; Botello-Méndez, A.R.; Perea-López, N.; Elías, A.L.; Chia, C.-I.; Wang, B.; Crespi, V.H.; López-Urías, F.; Charlier, J.-C.; et al. Identification of Individual and Few Layers of WS2 Using Raman Spectroscopy. Sci. Rep. 2013, 3, 1755. [Google Scholar] [CrossRef]
  53. McCreary, A.; Berkdemir, A.; Wang, J.; Nguyen, M.A.; Elías, A.L.; Perea-López, N.; Fujisawa, K.; Kabius, B.; Carozo, V.; Cullen, D.A.; et al. Distinct Photoluminescence and Raman Spectroscopy Signatures for Identifying Highly Crystalline WS2 Monolayers Produced by Different Growth Methods. J. Mater. Res. 2016, 31, 931–944. [Google Scholar] [CrossRef]
  54. Sahin, H.; Tongay, S.; Horzum, S.; Fan, W.; Zhou, J.; Li, J.; Wu, J.; Peeters, F.M. Anomalous Raman Spectra and Thickness-Dependent Electronic Properties of WSe2. Phys. Rev. B 2013, 87, 165409. [Google Scholar] [CrossRef]
  55. Harrington, G.F.; Santiso, J. Back-to-Basics Tutorial: X-Ray Diffraction of Thin Films. J. Electroceram. 2021, 47, 141–163. [Google Scholar] [CrossRef]
  56. Khan, H.; Yerramilli, A.S.; D’Oliveira, A.; Alford, T.L.; Boffito, D.C.; Patience, G.S. Experimental Methods in Chemical Engineering: X-Ray Diffraction Spectroscopy—XRD. Can. J. Chem. Eng. 2020, 98, 1255–1266. [Google Scholar] [CrossRef]
  57. Nguyen, T.P.; Sohn, W.; Oh, J.H.; Jang, H.W.; Kim, S.Y. Size-Dependent Properties of Two-Dimensional MoS2 and WS2. J. Phys. Chem. C 2016, 120, 10078–10085. [Google Scholar] [CrossRef]
  58. Wu, Z.; Wang, D.; Wang, Y.; Sun, A. Preparation and Tribological Properties of MoS2 Nanosheets. Adv. Eng. Mater. 2010, 12, 534–538. [Google Scholar] [CrossRef]
  59. Ratha, S.; Rout, C.S. Supercapacitor Electrodes Based on Layered Tungsten Disulfide-Reduced Graphene Oxide Hybrids Synthesized by a Facile Hydrothermal Method. ACS Appl. Mater. Interfaces 2013, 5, 11427–11433. [Google Scholar] [CrossRef]
  60. Luo, X.; Huang, J.; Li, J.; Cao, L.; Wang, Y.; Xu, Z.; Guo, L.; Cheng, Y.; Kajiyoshi, K.; Chen, S. Controlled WS2 Crystallinity Effectively Dominating Sodium Storage Performance. J. Energy Chem. 2020, 51, 143–153. [Google Scholar] [CrossRef]
  61. Gupta, D.; Chauhan, V.; Upadhyay, S.; Koratkar, N.; Singh, F.; Kumar, S.; Mahajan, A.; Chandra, R.; Kumar, R. Defects Engineering and Enhancement in Optical and Structural Properties of 2D-MoS2 Thin Films by High Energy Ion Beam Irradiation. Mater. Chem. Phys. 2022, 276, 125422. [Google Scholar] [CrossRef]
  62. Krishnamoorthy, K.; Pazhamalai, P.; Veerasubramani, G.K.; Kim, S.J. Mechanically Delaminated Few Layered MoS2 Nanosheets Based High Performance Wire Type Solid-State Symmetric Supercapacitors. J. Power Sources 2016, 321, 112–119. [Google Scholar] [CrossRef]
  63. Liu, Y.; Zhu, M.; Chen, D. Sheet-like MoSe2/C Composites with Enhanced Li-Ion Storage Properties. J. Mater. Chem. A 2015, 3, 11857–11862. [Google Scholar] [CrossRef]
  64. Zhang, X.; Wang, J.; Xu, H.; Tan, H.; Ye, X. Preparation and Tribological Properties of WS2 Hexagonal Nanoplates and Nanoflowers. Nanomaterials 2019, 9, 840. [Google Scholar] [CrossRef] [PubMed]
  65. Wang, X.; Chen, Y.; Zheng, B.; Qi, F.; He, J.; Li, Q.; Li, P.; Zhang, W. Graphene-like WSe2 Nanosheets for Efficient and Stable Hydrogen Evolution. J. Alloys Compd. 2017, 691, 698–704. [Google Scholar] [CrossRef]
  66. Rahul; Arora, S.K. Quantitative Evaluation of Nonlinear Temperature Dependence of Raman Shift in Exfoliated WSe2 Nanosheets. J. Electron. Mater. 2021, 50, 7126–7132. [Google Scholar] [CrossRef]
  67. Ni, P.; Dieng, M.; Vanel, J.-C.; Florea, I.; Bouanis, F.Z.; Yassar, A. Liquid Shear Exfoliation of MoS2: Preparation, Characterization, and NO2-Sensing Properties. Nanomaterials 2023, 13, 2502. [Google Scholar] [CrossRef]
  68. Chen, I.-W.P.; Lai, Y.-M.; Liao, W.-S. One-Pot Synthesis of Chlorophyll-Assisted Exfoliated MoS2/WS2 Heterostructures via Liquid-Phase Exfoliation Method for Photocatalytic Hydrogen Production. Nanomaterials 2021, 11, 2436. [Google Scholar] [CrossRef] [PubMed]
  69. Zhang, X.; Xue, M.; Yang, X.; Luo, G.; Yang, F. Hydrothermal Synthesis and Tribological Properties of MoSe2 Nanoflowers. Micro Nano Lett. 2015, 10, 339–342. [Google Scholar] [CrossRef]
  70. Ayieko, C.O.; Musembi, R.J.; Ogacho, A.A.; Aduda, B.O.; Muthoka, B.M.; Jain, P.K. Controlled Texturing of Aluminum Sheet for Solar Energy Applications. Adv. Mater. Phys. Chem. 2015, 5, 458–466. [Google Scholar] [CrossRef]
  71. Mikhalitsyna, E.A.; Kataev, V.A.; Larrañaga, A.; Lepalovskij, V.N.; Kurlyandskaya, G.V. Nanocrystallization in FINEMET-Type Fe73.5Nb3Cu1Si13.5B9 and Fe72.5Nb1.5Mo2Cu1.1Si14.2B8.7 Thin Films. Materials 2020, 13, 348. [Google Scholar] [CrossRef]
  72. Amjad, R.J.; Sahar, M.R.; Ghoshal, S.K.; Dousti, M.R.; Riaz, S.; Samavati, A.R.; Jamaludin, M.N.A.; Naseem, S. Plasmon-Enhanced Upconversion Fluorescence in Er3+:Ag Phosphate Glass: The Effect of Heat Treatment. Chin. Phys. Lett. 2013, 30, 027301. [Google Scholar] [CrossRef]
  73. Wang, S.; Wang, Z.; Qin, J.; Wang, W.; Li, W.; He, D. Nanocrystalline MoS2 through Directional Growth along the (002) Crystal Plane under High Pressure. Mater. Chem. Phys. 2011, 130, 170–174. [Google Scholar] [CrossRef]
  74. Zsigmondy, R.; Scherrer, P. Kolloidchemie: Ein Lehrbuch—Primary Source Edition; NABU Press: Berlin, Germany, 2014; ISBN 978-1-294-87694-6. [Google Scholar]
  75. Muniz, F.T.L.; Miranda, M.A.R.; Morilla dos Santos, C.; Sasaki, J.M. The Scherrer Equation and the Dynamical Theory of X-ray Diffraction. Acta Cryst. A 2016, 72, 385–390. [Google Scholar] [CrossRef] [PubMed]
  76. Monshi, A.; Foroughi, M.R.; Monshi, M.R. Modified Scherrer Equation to Estimate More Accurately Nano-Crystallite Size Using XRD. World J. Nano Sci. Eng. 2012, 2, 154–160. [Google Scholar] [CrossRef]
  77. Huang, Y.; Liu, L.; Sha, J.; Chen, Y. Size-Dependent Piezoelectricity of Molybdenum Disulfide (MoS2) Films Obtained by Atomic Layer Deposition (ALD). Appl. Phys. Lett. 2017, 111, 063902. [Google Scholar] [CrossRef]
  78. Saisopa, T.; Jitapunkul, K.; Bunpheng, A.; Nakajima, H.; Supruangnet, R.; Busayaporn, W.; Sukprom, T.; Hirunpinyopas, W.; Seubsai, A.; Songsiriritthigul, P.; et al. The Structure Analysis and Chemical Properties Probing during Recycling Processes of Transition Metal Dichalcogenides Exfoliation. Electrochim. Acta 2023, 449, 142171. [Google Scholar] [CrossRef]
  79. Chowdhury, T.; Kim, J.; Sadler, E.C.; Li, C.; Lee, S.W.; Jo, K.; Xu, W.; Gracias, D.H.; Drichko, N.V.; Jariwala, D.; et al. Substrate-Directed Synthesis of MoS2 Nanocrystals with Tunable Dimensionality and Optical Properties. Nat. Nanotechnol. 2020, 15, 29–34. [Google Scholar] [CrossRef] [PubMed]
  80. Voiry, D.; Yang, J.; Chhowalla, M. Recent Strategies for Improving the Catalytic Activity of 2D TMD Nanosheets Toward the Hydrogen Evolution Reaction. Adv. Mater. 2016, 28, 6197–6206. [Google Scholar] [CrossRef]
  81. Kadiev, K.M.; Maximov, A.L.; Kadieva, M.K. The Effect of MoS2 Active Site Dispersion on Suppression of Polycondensation Reactions during Heavy Oil Hydroconversion. Catalysts 2021, 11, 676. [Google Scholar] [CrossRef]
  82. Mukherjee, S.; Biswas, S.; Ghorai, A.; Midya, A.; Das, S.; Ray, S.K. Tunable Optical and Electrical Transport Properties of Size- and Temperature-Controlled Polymorph MoS2 Nanocrystals. J. Phys. Chem. C 2018, 122, 12502–12511. [Google Scholar] [CrossRef]
  83. Mukherjee, S.; Maiti, R.; Midya, A.; Das, S.; Ray, S.K. Tunable Direct Bandgap Optical Transitions in MoS2 Nanocrystals for Photonic Devices. ACS Photonics 2015, 2, 760–768. [Google Scholar] [CrossRef]
  84. Fang, L.J.; Chen, J.H.; Wang, J.M.; Lin, W.W.; Lin, X.G.; Lin, Q.J.; He, Y. Hydrophobic Two-Dimensional MoS2 Nanosheets Embedded in a Polyether Copolymer Block Amide (PEBA) Membrane for Recovering Pyridine from a Dilute Solution. ACS Omega 2021, 6, 2675–2685. [Google Scholar] [CrossRef] [PubMed]
  85. Kwon, K.C.; Kim, C.; Le, Q.V.; Gim, S.; Jeon, J.-M.; Ham, J.Y.; Lee, J.-L.; Jang, H.W.; Kim, S.Y. Synthesis of Atomically Thin Transition Metal Disulfides for Charge Transport Layers in Optoelectronic Devices. ACS Nano 2015, 9, 4146–4155. [Google Scholar] [CrossRef] [PubMed]
Figure 1. (a) Three-dimensional structure of TMDs, where M = transition metal and X = chalcogen. (b) Digital photograph of TMD dispersions prepared in IPA via liquid phase exfoliation (LPE).
Nanoenergyadv 04 00014 g001
Figure 2. UV-visible absorption spectra of LPE-prepared (a) MoS2; (b) MoSe2; (c) WS2; (d) WSe2 dispersions in IPA.
Nanoenergyadv 04 00014 g002
Figure 3. XRD patterns of the four TMDs (a) MoS2; (b) MoSe2; (c) WS2; (d) WSe2. The black line corresponds to the bulk material powder and the blue line corresponds to the sprayed TMD flakes.
Nanoenergyadv 04 00014 g003
Figure 4. (a) The inverted OPV device architecture. (b) J-V curves of the best performing devices for each parameter. (c) Statistical distribution of PCE from 20 cells for each parameter.
Nanoenergyadv 04 00014 g004
Figure 5. J-V curves of the best performing devices (a) comparing the different HTLs under 500 lux indoor lighting intensity and (b) comparing MoS2 under different indoor light intensities.
Nanoenergyadv 04 00014 g005
Figure 6. Normalized PCE measured for the different HTLs as a function of the aging time.
Nanoenergyadv 04 00014 g006
Table 1. Average photovoltaic parameters from J-V characterization of 20 devices, with and without TMDs as the HTL. The boldface values denote the parameters of the best performing devices.
HTLVoc (V)Jsc (mA/cm2)FF (%)PCE (%)
No HTL0.73 ± 0.02
(0.74)
14.35 ± 0.31
(14.63)
48.87 ± 0.32
(49.15)
5.2 ± 0.14
(5.34)
MoO30.88 ± 0.01
(0.89)
15.71 ± 0.1
(16.36)
69.27 ± 0.52
(71.13)
9.68 ± 0.12
(10.38)
MoS20.89 ± 0.01
(0.90)
15.88 ± 0.09
(16.07)
69.08 ± 0.45
(70.31)
9.78 ± 0.10
(10.12)
MoSe20.77 ± 0.05
(0.89)
14.25 ± 0.44
(13.94)
62.73 ± 3.34
(71.04)
7.21 ± 0.41
(8.86)
WS20.86 ± 0.02
(0.89)
14.84 ± 0.55
(16.06)
60.42 ± 3.43
(68.46)
7.76 ± 0.64
(9.82)
WSe20.8 ± 0.05
(0.89)
13.81 ± 0.56
(13.29)
59.03 ± 4.09
(67.28)
6.51 ± 0.62
(7.96)
Table 2. Parameters of the OPV cells with various HTLs under different indoor light intensities.
HTLLight
Source (lux)
Pin
(μW/cm2)
Voc (V)Jsc (μA/cm2)FF (%)PCE (%)
No HTL200610.5820.0444.518.55
5001510.6149.5948.559.68
10003030.62104.4950.3110.83
MoO3200610.7122.4168.9017.97
5001510.7355.4574.7420.02
10003030.75116.8477.2822.34
200610.7022.0167.9917.29
MoS25001510.7254.4773.7719.16
10003030.75114.7978.0922.26
Disclaimer/Publisher’s Note: The statements, opinions and data contained in all publications are solely those of the individual author(s) and contributor(s) and not of MDPI and/or the editor(s). MDPI and/or the editor(s) disclaim responsibility for any injury to people or property resulting from any ideas, methods, instructions or products referred to in the content.