Article

Modeling Particle-Doped Materials for Performance Improvement of Contact-Separation Triboelectric Nanogenerators

IFIMUP (Institute of Physics for Advanced Materials, Nanotechnology and Photonics), Department of Physics and Astronomy, Faculty of Sciences, University of Porto, Rua do Campo Alegre, s/n, 4169-007 Porto, Portugal
*
Authors to whom correspondence should be addressed.
Nanoenergy Adv. 2024, 4(2), 147-155; https://doi.org/10.3390/nanoenergyadv4020009
Submission received: 11 December 2023 / Revised: 22 March 2024 / Accepted: 12 April 2024 / Published: 30 April 2024

Abstract

:
Triboelectric nanogenerators (TENGs) are an attractive energy harvesting technology due to their high efficiency and vast applications in self-powered sensors. In this work, dielectric–dielectric contact-separation TENGs were modeled with time-dependent finite element simulations with the objective of improving TENG’s performance by enhancing the relative permittivity ( ε r ).To achieve this, the chosen material (PDMS, ε r = 2.75 ) was doped with SrTiO3 ( ε r = 300) particles. The open-circuit voltage ( V O C ) and short-circuit current ( I S C ) remained constant as ϵ r increased, as predicted by existent models, but in contradiction with available experimental data. Thus, we introduced a charge correction model relating ϵ r and surface charge density, allowing us to observe an increase in TENG performance output ( V O C and I S C ). This work shows that finite element simulations are suitable for better understanding and optimizing TENGs’ performance.

Graphical Abstract

1. Introduction

A triboelectric nanogenerator (TENG) is an energy harvester device that converts mechanical into electrical energy [1,2], while being environmentally friendly [3,4], making it an interesting energy source to help mitigate the present climate crisis [5,6,7]. TENGs have a vast potential for self-power sensor applications [3,8,9,10,11], powering self-sustainable devices (such as floating buoys [3,12,13,14] and wearables [3,8,15,16,17,18]) and bio-medical [19,20]. From the four TENG operations modes (contact-separation [1,21], sliding [1,22], single-electrode [1,23] and freestanding layer [1]), research focuses on enhancing output power (P) [24] and on modeling the working mechanisms [1,21,25,26,27] and contact properties [11,28]. One of the most important paths to enhance P is by improving material parameters such as relative permittivity ( ε r ) and surface charge density ( σ ) [29,30]. One way to improve ε r is by doping the triboelectric layers such as PDMS (Polydimethylsiloxane) [29,31,32,33], PMMA (Poly(methyl 2-methylpropenoate)) [34] and BMF (bamboo microfibrils) [35] with high ε r particles, such as BaTiO 3 [29,31,32,33], CaCu3Ti4O12 [35] and SrTiO3 [29]. The effective relative permittivity ( ε e f f ) of materials doped with particles will then be given by [29]:
ε e f f = ε r 1 f 1 + ε r 2 f 2 ,
where ε r 1 and ε r 2 are the relative permittivities of the matrix and particles, and f 1 and f 2 are the corresponding concentration fractions.
In particular, PDMS is attracting attention for its mature, low-cost manufacturing and flexibility [19,36]. References [29,32] showed that it is possible to combine PDMS with particle doping to improve TENG performances. However, having very high concentrations (≥10%) of particles leads to a decrease in surface contact area, decreasing TENG’s performance [29]. Therefore, one has to search for the optimal particle concentration [29,32,35] at the expense of a large amount of time and resources. To prevent this, the best option is to numerically model TENG materials with varying particle concentrations as a guide to obtaining optimal values experimentally. In fact, recent developments in finite element simulations have opened up new possibilities to simulate TENG performance and guide its optimization [11,37,38,39,40]. Numerical simulations are key not only to validating but also to predicting novel results when developing experimental setups or materials, decreasing the time spent in optimization. Performing time-dependent numerical simulations conjugating the relative motion of two materials and the resulting electrostatic spatial distribution has been a challenge for TENGs that has only recently been surpassed [37].
Research on TENGs using COMSOL has been performed recently for, e.g., heat TENG self-sustained sensors [11] and hybrid TENG and thermoelectric nanogenerators [40]. However, a detailed study on how to perform and optimize COMSOL TENG simulations has not yet been performed. Research on stationary simulations, where the device is simulated in one instant of time, was conducted by Hasan et al. [38]. However, time-dependent simulations allow for more realistic analysis, such as the charge transference processes occurring in TENGs. In that regard, Chen et al. [37] performed simulations on COMSOL Multiphysics with time-dependent simulations using contact-separation and sliding TENGs modes by using the moving mesh.
Niu et al. [21] modeled the contact-separation TENG as a double parallel-plate capacitor, with two electrodes, two dielectrics (for the dielectric–dielectric mode), and a varying air gap. By calculating the electric field in the dielectric and air gap, the voltage (V) is obtained:
V = Q S ε 0 d 1 ε r 1 + d 2 ε r 2 + x ( t ) + σ x ( t ) ε 0 ,
where Q is the charge in the electrodes, S the TENG’s area, σ the surface charge density of both dielectrics, d 1 and d 2 are the thicknesses of both dielectrics and ε r 1 , ε r 2 the corresponding relative permittivities and x ( t ) the time-dependent distance between the dielectrics.
Adding a load resistance ( R L ) to simulate the delivery of the harvested energy to an external circuit, two special cases arise. At low resistances, V is negligible and Equation (2) gives the short-circuit current ( I S C ):
I S C = S σ v ( t ) d 0 ( d 0 + x ( t ) ) 2 ,
where v ( t ) is the velocity of the moving layer of the TENG and d 0 = d 1 ε r 1 + d 2 ε r 2 . At high resistances (open-circuit region), the charge in the electrodes is negligible, allowing the determination of the open-circuit voltage ( V O C ):
V O C = σ x ( t ) ε 0 .
In this work, we simulated contact-separation TENGs with particle-doped materials for better optimization of the concentration, maximizing TENG’s performance. Furthermore, a comparison between particle and ε e f f models is provided.

2. Numerical Procedures

Based on Niu’s model [21], a dielectric–dielectric contact-separation TENG was simulated using COMSOL Multiphysics. To reduce the complexity of the model, the simulations were performed in 2D, with an out-of-plane thickness of 1 mm, due to COMSOL always performing simulations in 3D. The accuracy and optimization of the numerical simulations were based on our previous work [27]. The TENG was built in the Geometry node and inserted inside a box of air large enough not to interfere with the results (Figure 1a). Nylon and PMDS were the chosen dielectric materials and copper was chosen for the electrodes. The top electrode/Nylon pair has a uniform movement with respect to the bottom electrode/particle-doped PDMS, which is kept at rest. To simulate particles, 15 µm circles (with ε r = 300 [29] corresponding to SrTiO3) were distributed uniformly inside the PDMS using the Geometry node. The 15 µm value was chosen after time and convergence optimization while allowing us to cover a significant concentration and relative permittivity range. The use of smaller particles (in the nanosize range) would lead to far more complex and time-demanding simulations, also affecting convergence. Finally, a mesh with triangular shapes was created with the maximum size defined with the “finner” size in COMSOL, which was the best option to reduce simulation time without affecting the final results.
A comparison between PDMS with particles and PDMS with an equivalent ε e f f was performed to evaluate the effect of ε e f f for constant σ . Since researchers performing experiments with doped-nanoparticle TENG materials have observed an increase in the generated V O C and I S C with particle concentration [29,34,41] and ε r (until an optimal value is reached), one must consider a relation between ε e f f and σ . This relationship is still not well understood, and there is no model that accurately describes it. Inspired by the trends observed in Ref. [34], we related ε r and σ by modeling the contact-separation TENG as a parallel-plate capacitor with a dielectric medium (Figure 1b) with a ε e f f , for which the total electrical field is given by
E t o t a l = E 0 E i n d ,
with E 0 the electric field in vacuum and E i n d the induced electric field of PDMS. The electric fields can be written as:
σ ε 0 ε e f f = σ ε 0 σ i n d ε 0 ,
where σ is the total surface charge density and σ i n d the surface charge density induced on the materials. This can be rearranged as:
σ i n d = σ ε e f f 1 ε e f f .
To simulate the PDMS reference case, we used σ r e f = 6 × 10 4 cm−2 as σ i n d and obtained the total surface charge density value ( 9.42 × 10 4 cm−2). With these values, simulations were performed comparing particle-doped PDMS and a PDMS with an equivalent ε e f f with σ varying in both cases according to Equation (7).
To evaluate TENG’s performance, R L ranging from 1 M Ω to 1.2 G Ω were used allowing us to obtain the maximum power output (Pmax), while 100 Ω and 100 T Ω were used to obtain I S C and V O C , respectively. The values used for the simulations are listed in Table 1. The SrTiO3 particle-doped concentration and ε e f f values simulated are listed in Table 2. The ε e f f values were obtained from Equation (1) by considering SrTiO3 with ε r and particle concentration fractions (f) listed in Table 2 and PDMS ε r and fraction (1 − f).

3. Numerical Results

In this section, PDMS doped with different concentrations will be compared with an equivalent ε e f f PDMS with (i) a constant and (ii) a varying surface charge density (according to Equation (7)).

3.1. Constant Surface Charge Density Model

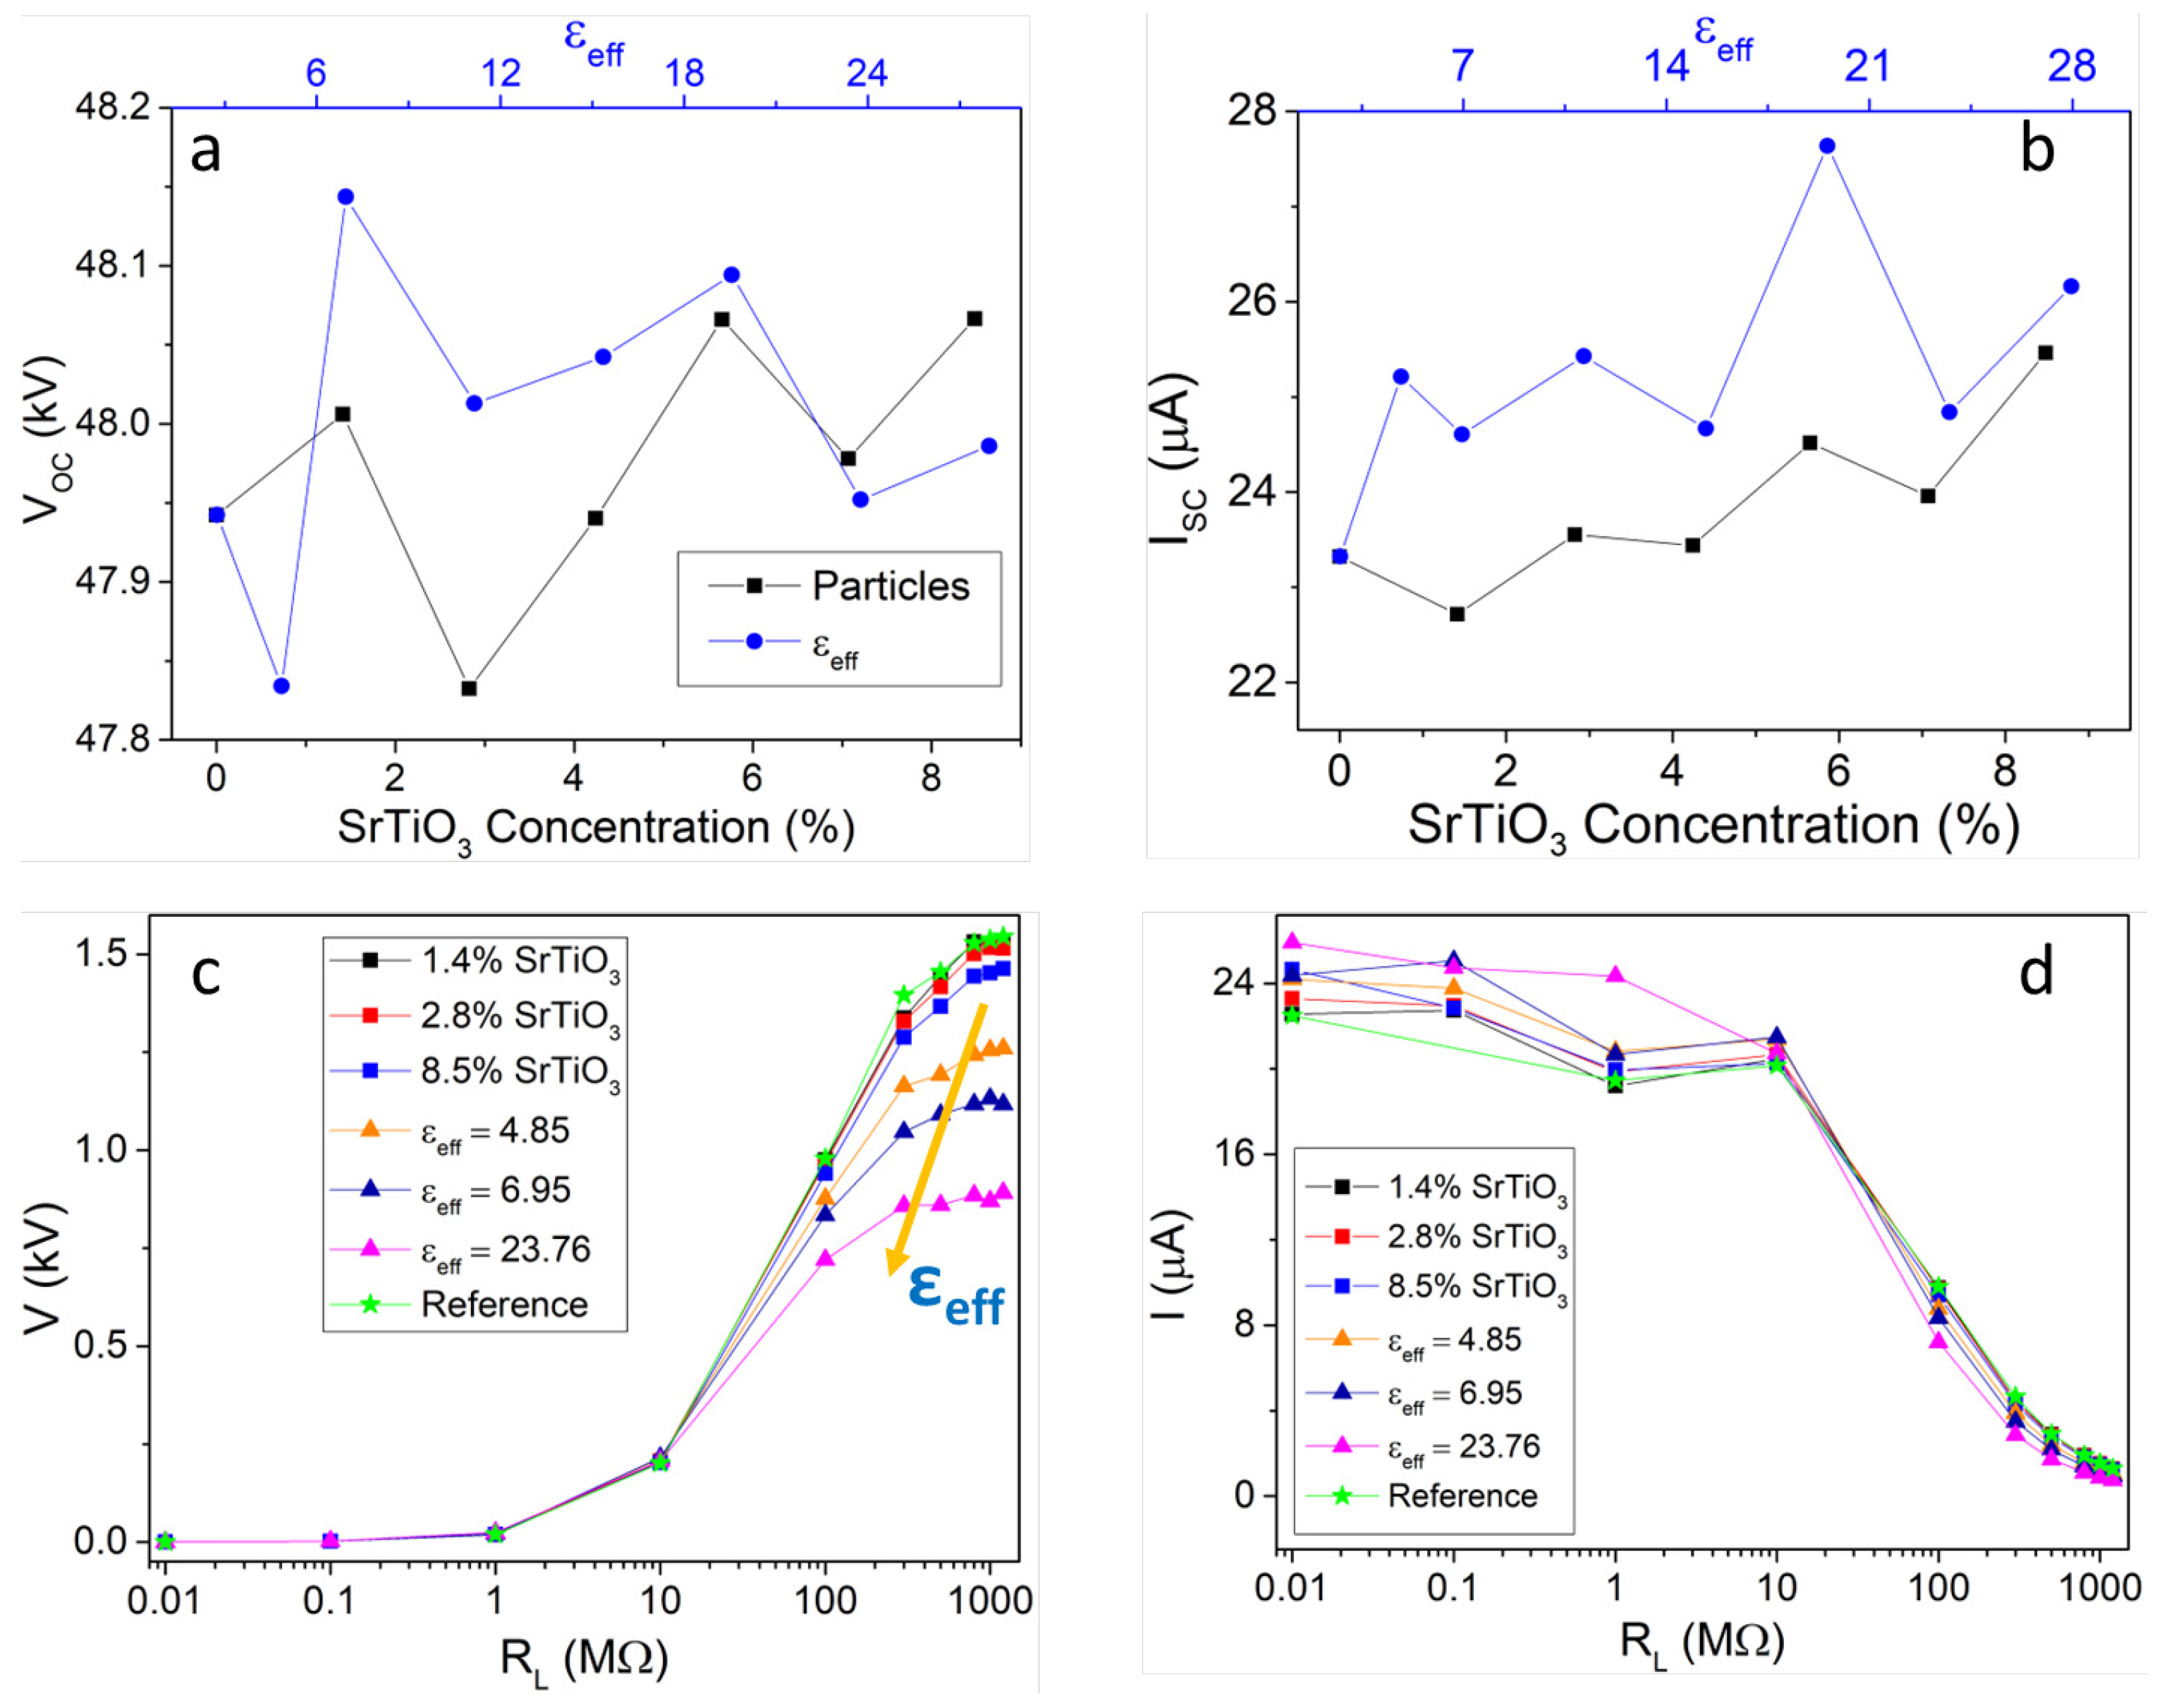
Figure 2 shows the comparison between varying the SrTiO3 particle concentration and varying ε e f f for V O C (Figure 2a), I S C (Figure 2b), V (Figure 2c) and current (I) (Figure 2d). Figure 2a,b show a rather constant trend (note the scale), which is the expected outcome according to Niu’s model. Also, both I S C and V O C are similar in value for particle concentration and ε e f f , meaning both models match. However, in Figure 2c,d, with R L close to P m a x , the values of the generated voltage for the particle-doped and equivalent ε e f f cases are significantly different, while the I trends are similar. Regardless, the tendencies for V and I with R L are within Niu’s model’s expectation, with I saturating at a maximum value for low R L , and V increasing with the increase in R L . Also, the decrease in V and I with the increase in ε r at constant σ agrees with Niu’s model.
An important remark is that in Figure 2a,c, V O C and V have different tendencies due to the V case corresponding to the situation where the electrodes are near the saturation and high R L contributes to a lower charge flow and does not allow the electrodes to discharge from the saturated state [27]. In this case, and according to Equation (2), if ε r increases, V decreases. On the other hand, the V O C case (Figure 2a), for which the charge of the electrode is zero (Equation (4)), predicts that V O C is independent of ε r , therefore remaining constant as ε e f f increases.

3.2. Varying Surface Charge Density

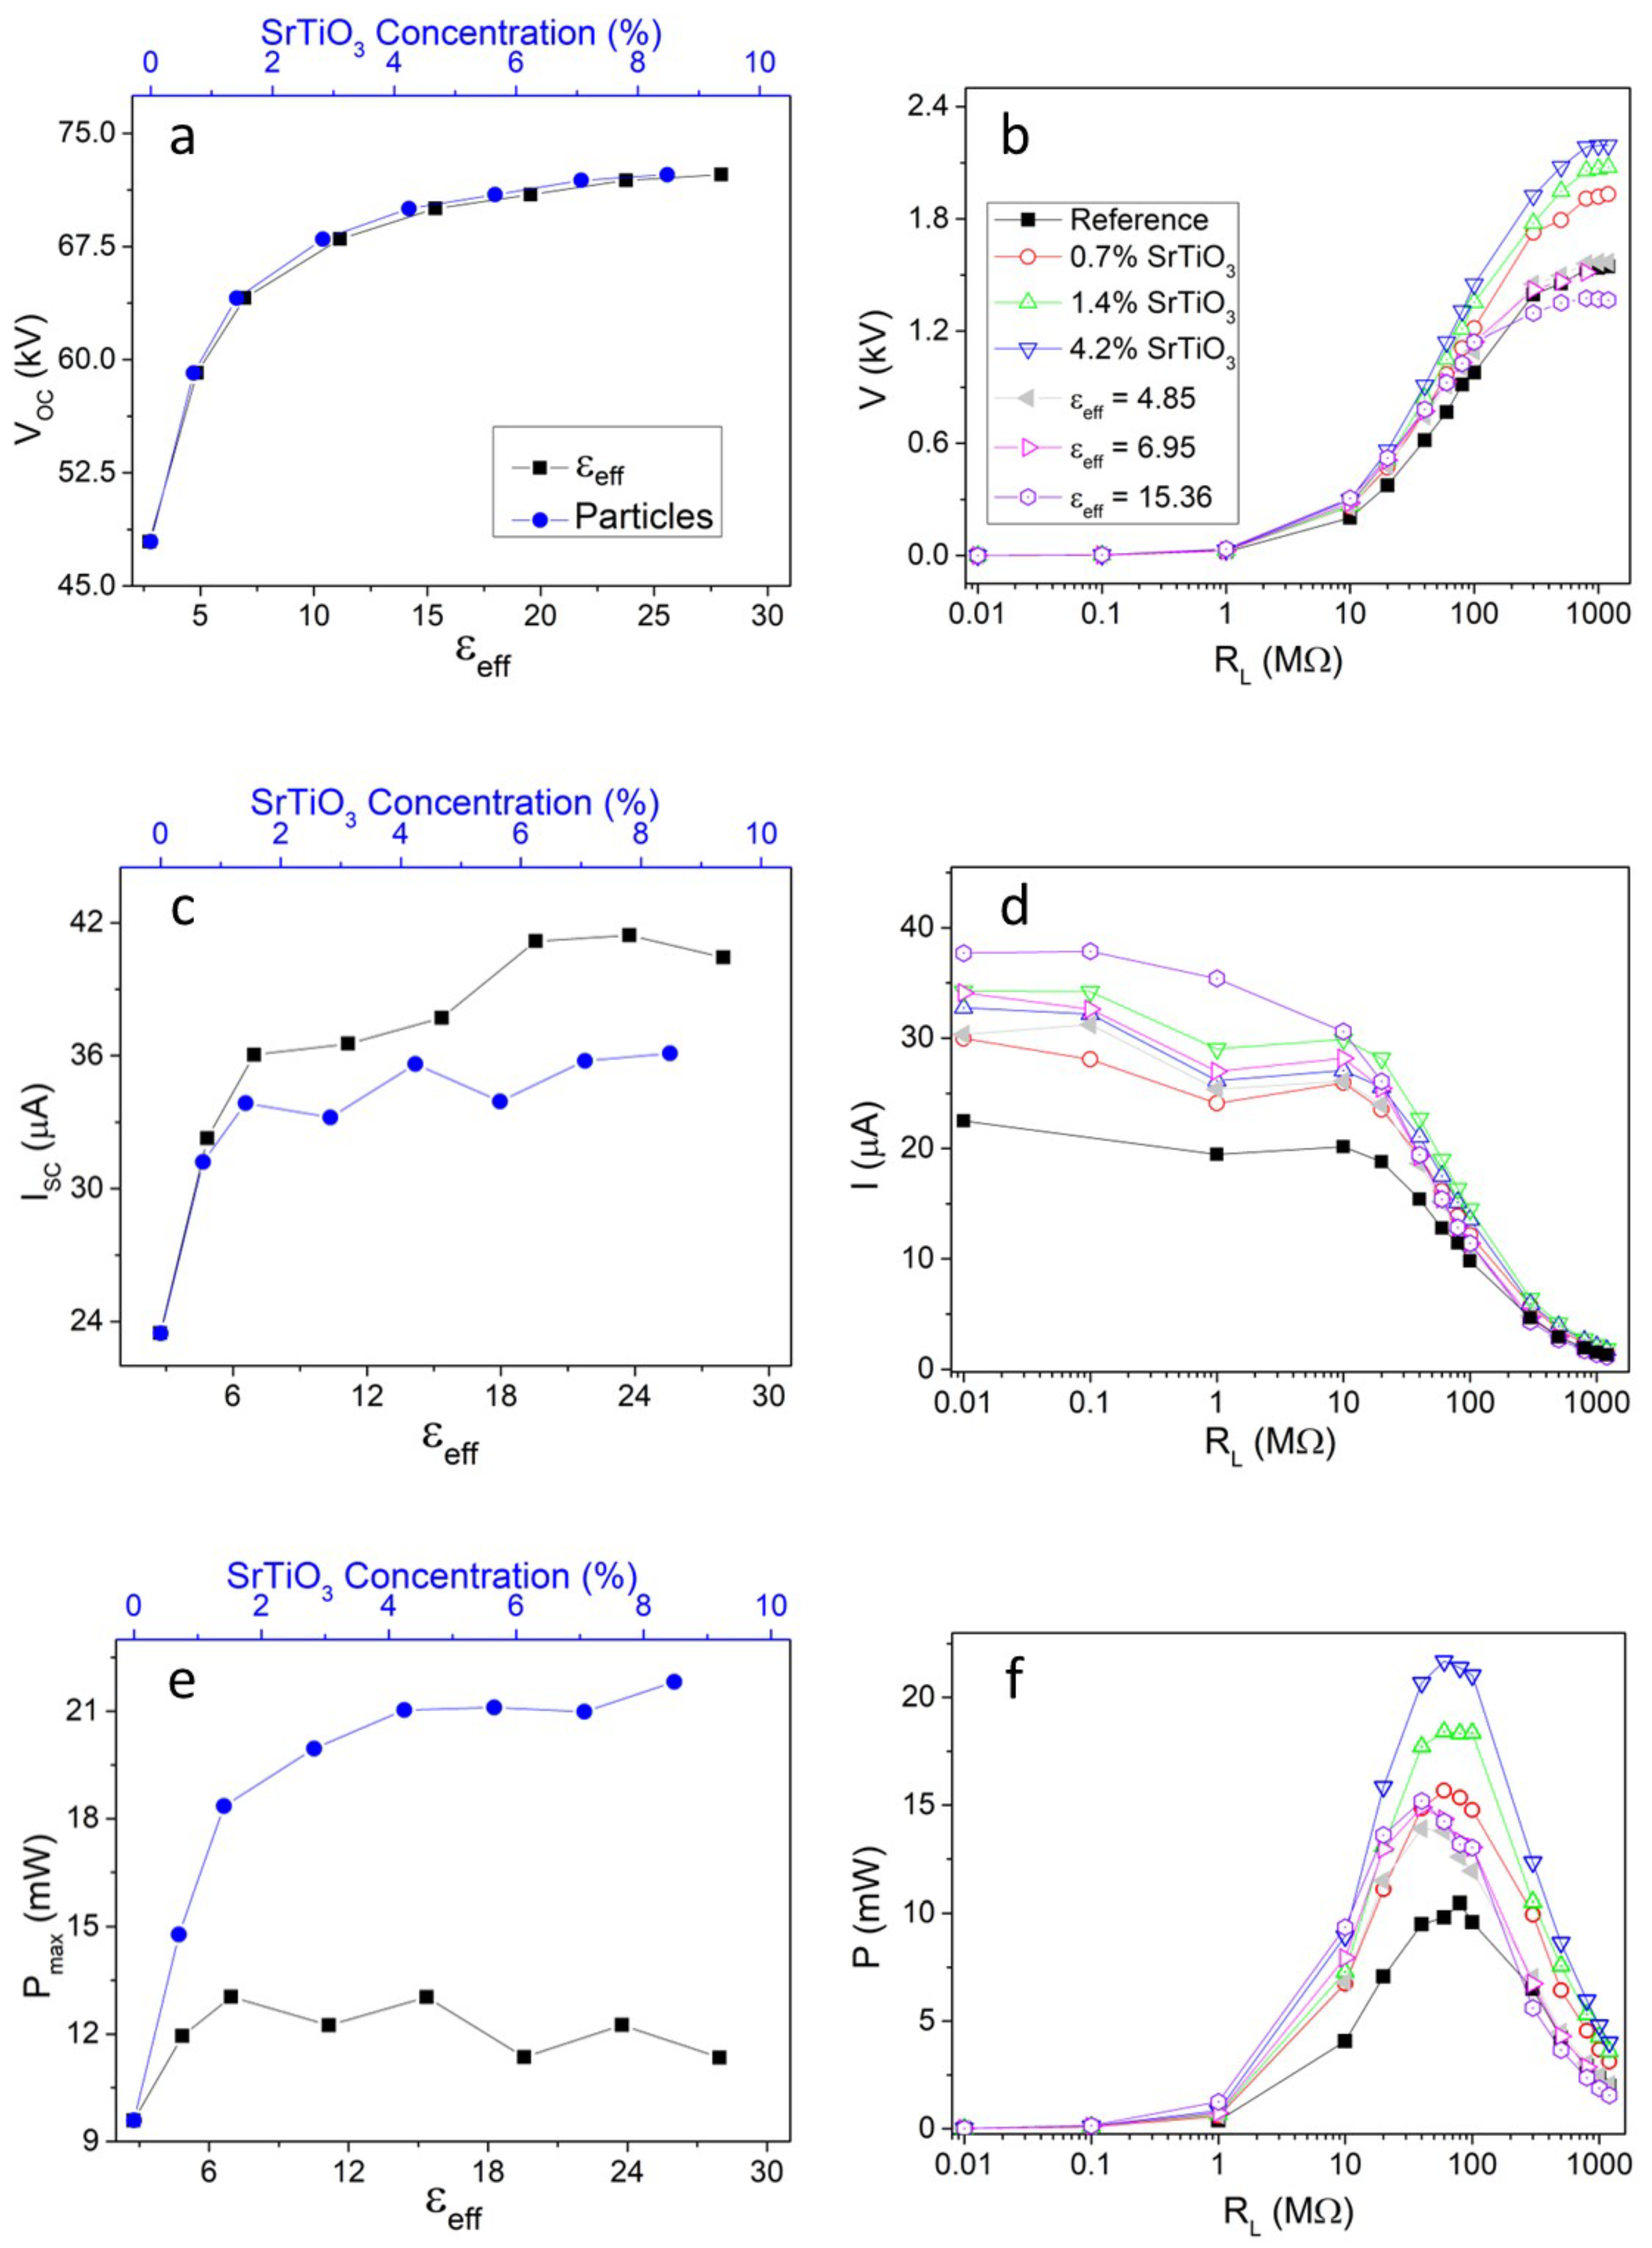
To match with the experimentally observed trends, we performed numerical simulations using the ε r and σ relation of (Equation (7)), resulting in clearly different V O C , I S C and P m a x behaviors (Figure 3). In this case, V O C and I S C (Figure 3a,c) increase with particle concentration and ε e f f in a similar way, agreeing with Niu’s model’s expected tendencies through the increase in σ with ε e f f . On the other hand, although P m a x also increases with particle concentration and ε e f f (Figure 3e), this increase is different for both cases, with the particle concentration case having a higher increase.
For R L near P m a x , the results show that the σ ( ε r ) increase leads to an increase in V, I and P (Figure 3b,d,f) both for increasing particle concentration and ε e f f . This is expected from Niu’s model’s predictions. However, when comparing the particle and ε e f f cases, there is a disagreement for V and P’s results, agreeing only in the obtained trends.
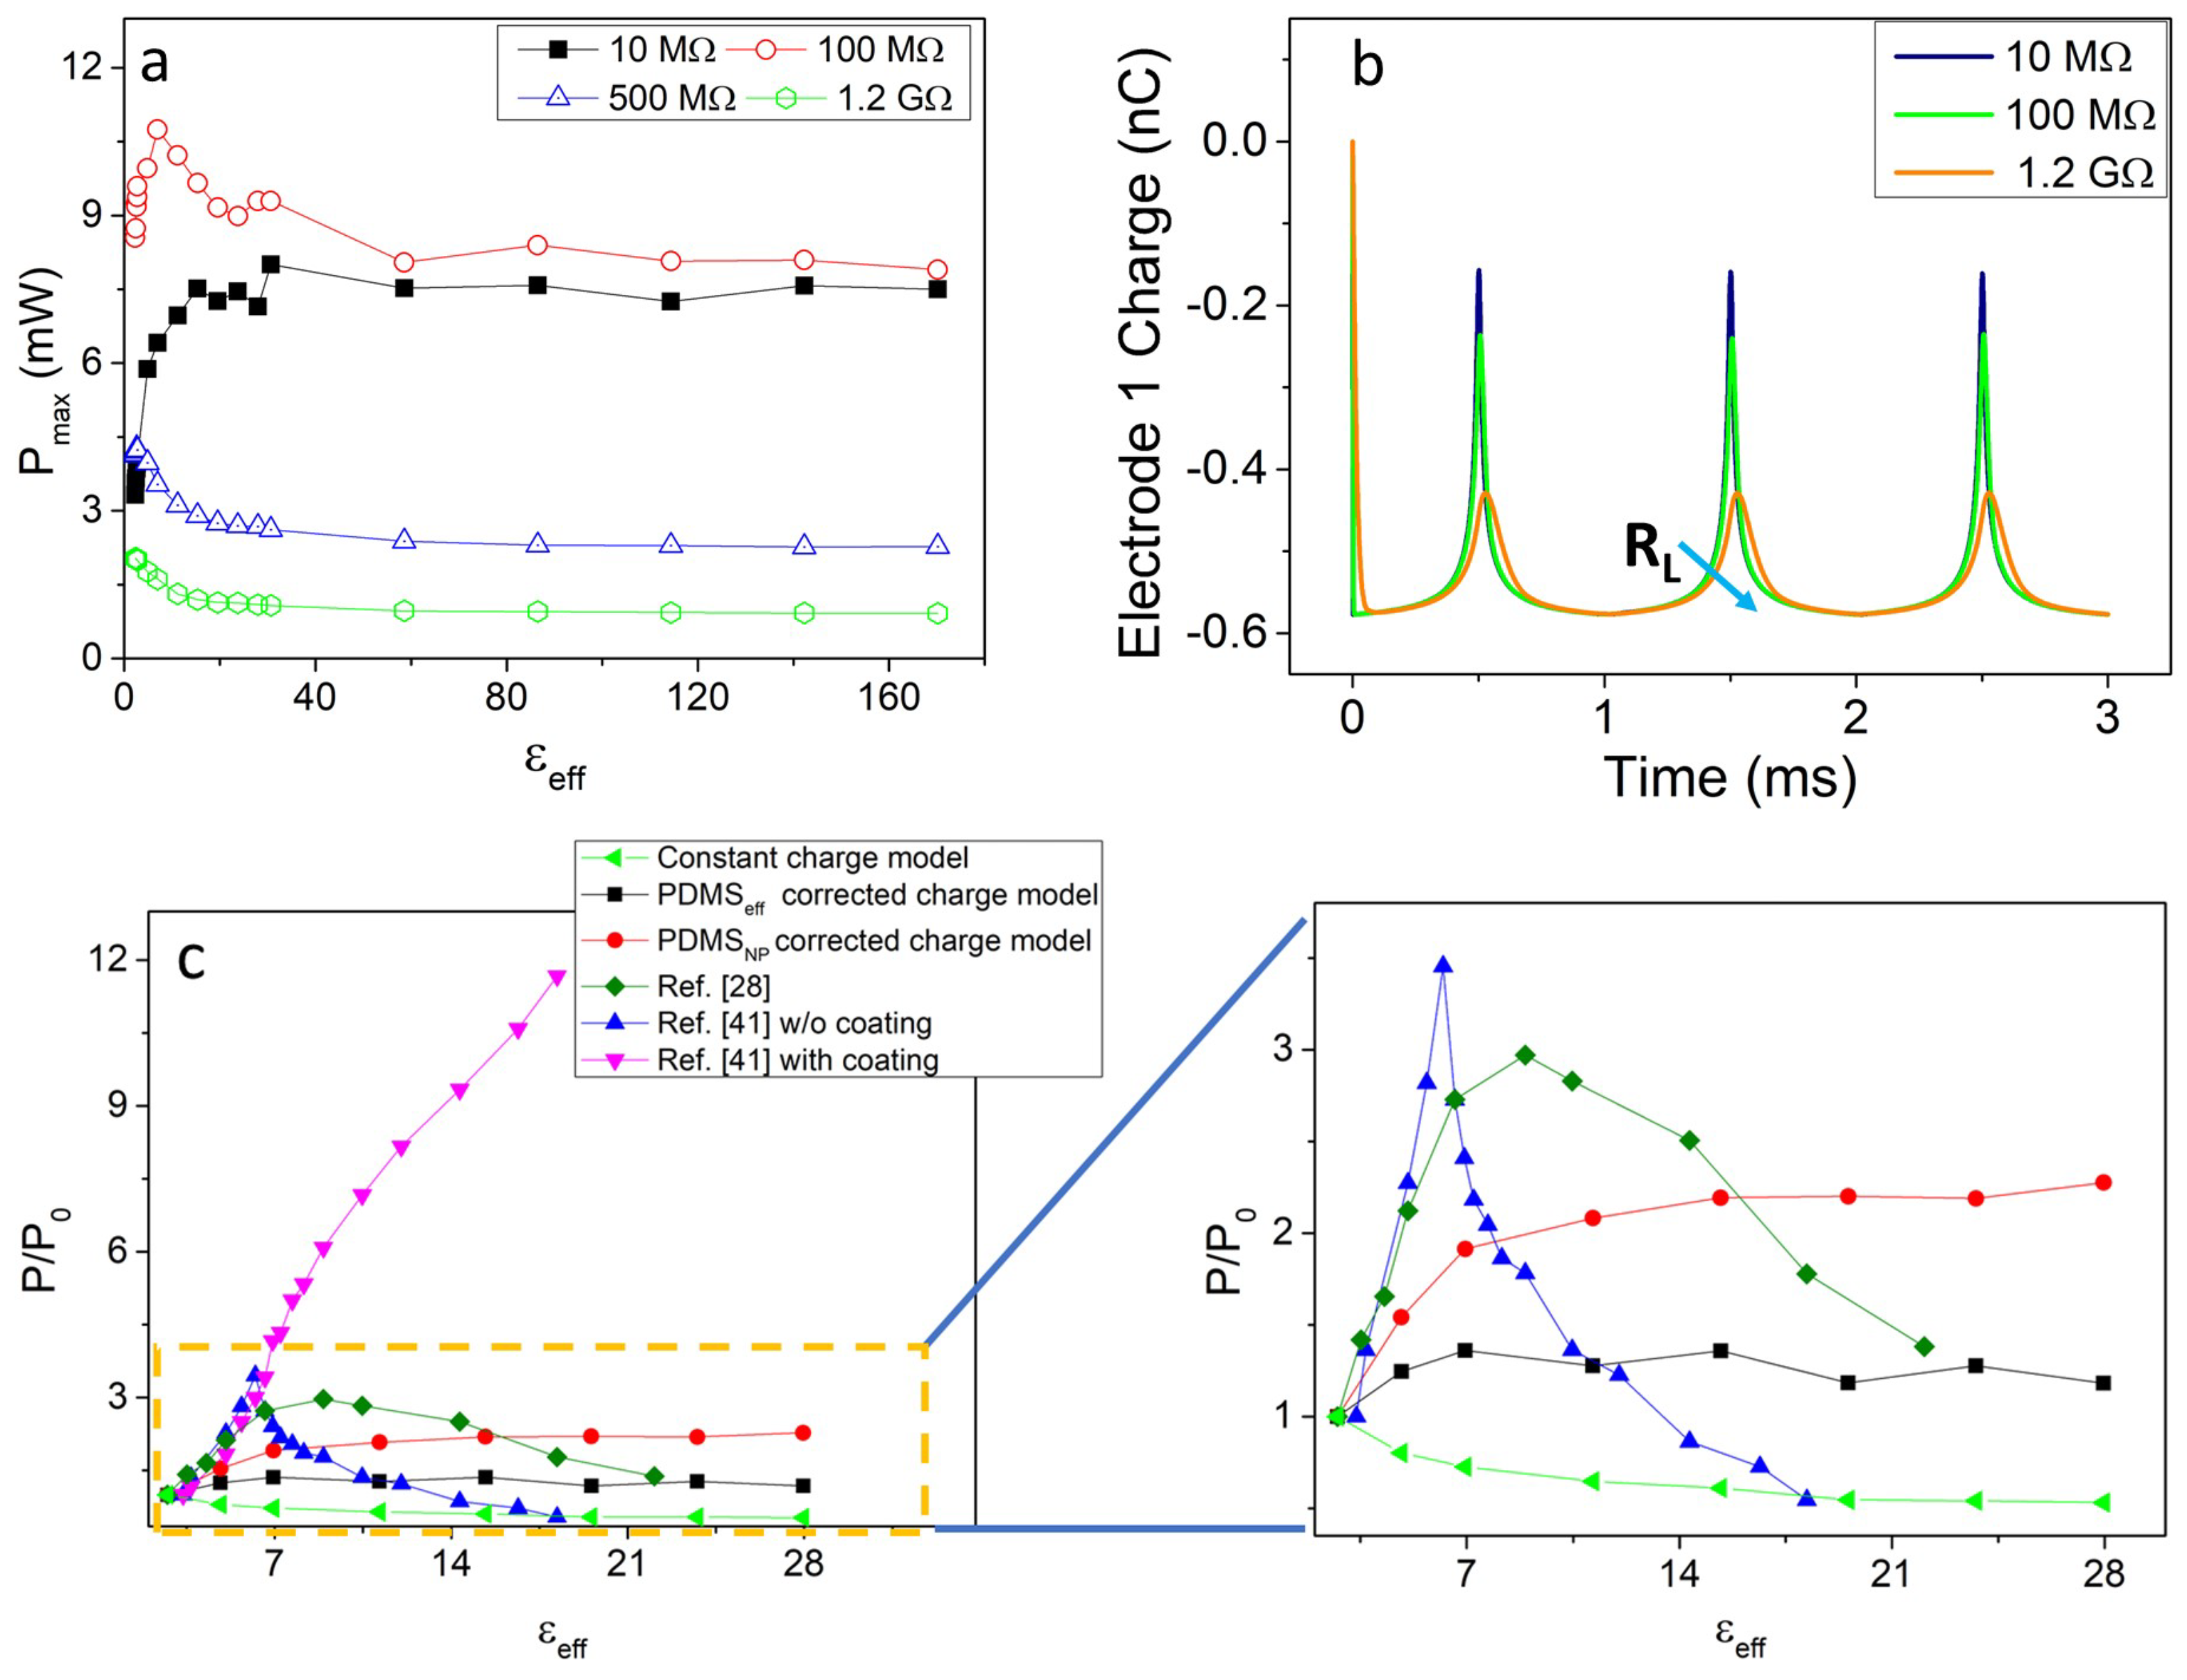
An important remark from the ε r and σ relation is that, because COMSOL does not support collisions, at the minimum distance considered (21 µm), both terms of Equation (2) are important because the minimum charge on the electrode (Q) is not negligible and the minimum distance is comparable with the Nylon and PDMS thicknesses (100 µm). This causes a change in the V and P trends at low and high R L (Figure 4a). At low R L , the σ term is the dominant one due to the charge in the electrode approaching zero. This leads to an increase in V and P with ε r . At high R L , the electrode becomes charge saturated and the charge on the electrode does not decrease much while at the minimum distance (Figure 4b), causing the decrease in V and P with ε r . At high ε e f f , P m a x is constant (Figure 4a), which agrees with Niu’s model (Equation (2)), due to ε e f f being much larger than Nylon’s permittivity (4.0), reducing Equation (2) to the metal–dielectric contact-separation TENG case.
A final remark about the charge model we developed is that it shows that it is possible to relate ε r and σ with dynamic finite element numerical simulation. However, despite the final trend being able to predict the available experimental data from literature [29,34,41], the developed model does not take into account additional effects that result in a decrease in σ , such as saturating the surface with nanoparticles [29,41] or current leakage [35]. Figure 4c shows a comparison between the numerical results obtained here and the experimental results obtained by Chen et al. [29] and Zhou et al. [41] normalized to the undoped case. The results from the literature usually show a maximum output at a critical ε e f f value, after which there is a decrease in the P / P 0 ratio with ε e f f , associated with nanoparticle saturation at the film surface. Ultimately, this may even lead to a decrease in P below that of the undoped sample [41]. A special approach was proposed in Ref. [41] by adding a thin PDMS coating on top of the nanoparticle-doped sample, so that the nanoparticle saturation at the surface does not hinder σ , allowing for it to increase with ε e f f .

4. Conclusions

This work enabled the study of TENGs with particle-doped PDMS using time-dependent finite element simulations. The results were compared with those of a material with an equivalent ε e f f . While particle-doped and equivalent ε e f f PDMS results do not match (except for V O C and I S C ), their tendencies are similar and in agreement with those of existent models. For the constant σ simulations, while the tendencies agree with existing models ( V O C and the I S C constant, and the decrease in V and I with ε r ), experimental research found that with the increase in ε r , V O C , I S C and P m a x increase as well. These tendencies were then observed only with the proposed σ correction and ε r dependence.
One important remark is that since COMSOL Multiphysics does not support collisions, requiring a minimum distance to be defined, important material properties such as Young’s modulus or adhesion strength are not taken into account.
This work thus opens new ways to use time-dependent finite-element simulations for TENGs with complex materials and paves the way to find an improved σ ( ε r ) relation for more accurate simulations.

Author Contributions

Conceptualization, C.C., I.G. and C.R.; Investigation, C.C.; writing—original draft preparation, C.C.; writing—review and editing, C.C., I.G., C.R. and J.V.; supervision, J.V. All authors have read and agreed to the published version of the manuscript.

Funding

The authors acknowledge funding from projects 2022.05030.PTDC (https://doi.org/10.54499/2022.05030.PTDC), UIDB/04968/2020 from FCT. This study is supported by the HORIZON-EIC-2022-PATHFINDERCHALLENGES-01project Blood2Power (grant agreement number 101115525) funded by the European Union. FSE/POPH, FEDER, COMPETE and ON2 are also acknowledged. C. Rodrigues is thankful to FCT for grant SFRH/BD/147811/2019.

Data Availability Statement

The data are available upon reasonable request from the corresponding authors.

Conflicts of Interest

This research received no external funding.

References

  1. Niu, S.; Wang, Z.L. Theoretical systems of triboelectric nanogenerators. Nano Energy 2014, 14, 161–192. [Google Scholar] [CrossRef]
  2. Lin, Z.; Chen, J.; Yang, J. Recent Progress in Triboelectric Nanogenerators as a Renewable and Sustainable Power Source. J. Nanomater. 2016, 2016, 5651613. [Google Scholar] [CrossRef]
  3. Luo, J.; Wang, Z.L. Recent progress of triboelectric nanogenerators: From fundamental theory to practical applications. EcoMat 2020, 2, e12059. [Google Scholar] [CrossRef]
  4. Wu, C.; Wang, A.C.; Ding, W.; Guo, H.; Wang, Z.L. Triboelectric Nanogenerator: A Foundation of the Energy for the New Era. Adv. Energy Mater. 2019, 9, 1802906. [Google Scholar] [CrossRef]
  5. Liu, Z.; Ciais, P.; Deng, Z.; Lei, R.; Davis, S.; Feng, S.; Zheng, B.; Cui, D.; Dou, X.; Zhu, B.; et al. Near-real-time monitoring of global CO2 emissions reveals the effects of the COVID-19 pandemic. Nat. Commun. 2020, 11, 5172. [Google Scholar] [CrossRef] [PubMed]
  6. Technical, I.; Shukla, P.; Skea, J.; Slade, R.; van Diemen, R.; Haughey, E.; Malley, J.; Pathak, M.; Pereira, J.P. Climate Change and Land: An IPCC Special Report on Climate Change, Desertification, Land Degradation, Sustainable Land Management, Food Security, and Greenhouse Gas Fluxes In Terrestrial Ecosystems; Intergovernmental Panel on Climate Change: Geneva, Switzerland, 2019; pp. 35–74. [Google Scholar]
  7. Toreti, A.; Bavera, D.; Acosta Navarro, J.; Cammalleri, C.; de Jager, A.; Di Ciollo, C.; Hrast Essenfelder, A.; Maetens, W.; Magni, D.; Masante, D.; et al. Drought in Europe—August 2022; Publications Office of the European Union: Luxembourg, 2022; JRC130493; p. 24. [Google Scholar] [CrossRef]
  8. Ma, M.; Kang, Z.; Liao, Q.; Zhang, Q.; Gao, F.; Zhao, X.; Zhang, Z.; Zhang, Y. Development, applications, and future directions of triboelectric nanogenerators. Nano Res. 2018, 11, 2951–2969. [Google Scholar] [CrossRef]
  9. Askari, H.; Hashemi, E.; Khajepour, A.; Khamesee, M.B.; Wang, Z.L. Towards self-powered sensing using nanogenerators for automotive systems. Nano Energy 2018, 53, 1003–1019. [Google Scholar] [CrossRef]
  10. Wang, S.; Lin, L.; Wang, Z.L. Triboelectric nanogenerators as self-powered active sensors. Nano Energy 2015, 11, 436–462. [Google Scholar] [CrossRef]
  11. Xia, K.; Zhu, Z.; Zhang, H.; Xu, Z. A triboelectric nanogenerator as self-powered temperature sensor based on PVDF and PTFE. Appl. Phys. A Mater. Sci. Process. 2018, 124, 520. [Google Scholar] [CrossRef]
  12. Rodrigues, C.; Nunes, D.; Clemente, D.; Mathias, N.; Correia, J.M.; Rosa-Santos, P.; Taveira-Pinto, F.; Morais, T.; Pereira, A.; Ventura, J. Emerging triboelectric nanogenerators for ocean wave energy harvesting: State of the art and future perspectives. Energy Environ. Sci. 2020, 13, 2657–2683. [Google Scholar] [CrossRef]
  13. Li, R.; Li, Y.; Zhao, Y.; Li, Y.; Li, Y. Harvest of ocean energy by triboelectric generator technology. Appl. Phys. Rev. 2018, 5, 031303. [Google Scholar] [CrossRef]
  14. Gonçalves, I.; Rodrigues, C.; Ventura, J. Sea State Adaptation Enhances Power Output of Triboelectric Nanogenerators for Tailored Ocean Wave Energy Harvesting. Adv. Energy Mater. 2023, 14, 2302627. [Google Scholar] [CrossRef]
  15. Rodrigues, C.; Gomes, A.; Ghosh, A.; Pereira, A.; Ventura, J. Power-generating footwear based on a triboelectric-electromagnetic-piezoelectric hybrid nanogenerator. Nano Energy 2019, 62, 660–666. [Google Scholar] [CrossRef]
  16. Dassanayaka, D.G.; Alves, T.M.; Wanasekara, N.D.; Dharmasena, I.G.; Ventura, J. Recent Progresses in Wearable Triboelectric Nanogenerators. Adv. Funct. Mater. 2022, 32, 2205438. [Google Scholar] [CrossRef]
  17. Liu, M.; Pu, X.; Jiang, C.; Liu, T.; Huang, X.; Chen, L.; Du, C.; Sun, J.; Hu, W.; Wang, Z.L. Large-Area All-Textile Pressure Sensors for Monitoring Human Motion and Physiological Signals. Adv. Mater. 2017, 29, 1–9. [Google Scholar] [CrossRef]
  18. Song, W.; Gan, B.; Jiang, T.; Zhang, Y.; Yu, A.; Yuan, H.; Chen, N.; Sun, C.; Wang, Z.L. Nanopillar Arrayed Triboelectric Nanogenerator as a Self-Powered Sensitive Sensor for a Sleep Monitoring System. ACS Nano 2016, 10, 8097–8103. [Google Scholar] [CrossRef] [PubMed]
  19. Wang, H.; Cheng, J.; Wang, Z.; Ji, L.; Wang, Z.L. Triboelectric nanogenerators for human-health care. Sci. Bull. 2021, 66, 490–511. [Google Scholar] [CrossRef]
  20. Zheng, Q.; Shi, B.; Li, Z.; Wang, Z.L. Recent Progress on Piezoelectric and Triboelectric Energy Harvesters in Biomedical Systems. Adv. Sci. 2017, 4, 1700029. [Google Scholar] [CrossRef]
  21. Niu, S.; Wang, S.; Lin, L.; Liu, Y.; Zhou, Y.S.; Hu, Y.; Wang, Z.L. Theoretical study of contact-mode triboelectric nanogenerators as an effective power source. Energy Environ. Sci. 2013, 6, 3576–3583. [Google Scholar] [CrossRef]
  22. Niu, S.; Liu, Y.; Wang, S.; Lin, L.; Zhou, Y.S.; Hu, Y.; Wang, Z.L. Theory of Sliding-Mode Triboelectric Nanogenerators. Adv. Mater. 2013, 25, 6184–6193. [Google Scholar] [CrossRef]
  23. Niu, S.; Liu, Y.; Wang, S.; Lin, L.; Zhou, Y.S.; Hu, Y.; Wang, Z.L. Theoretical investigation and structural optimization of single-electrode triboelectric nanogenerators. Adv. Funct. Mater. 2014, 24, 3332–3340. [Google Scholar] [CrossRef]
  24. Chen, H.; Xu, Y.; Zhang, J.; Wu, W.; Song, G. Theoretical System of Contact-Mode Triboelectric Nanogenerators for High Energy Conversion Efficiency. Nanoscale Res. Lett. 2018, 13, 346. [Google Scholar] [CrossRef]
  25. Shao, J.; Jiang, T.; Tang, W.; Chen, X.; Xu, L.; Wang, Z.L. Structural figure-of-merits of triboelectric nanogenerators at powering loads. Nano Energy 2018, 51, 688–697. [Google Scholar] [CrossRef]
  26. Shao, J.; Willatzen, M.; Wang, Z.L. Theoretical modeling of triboelectric nanogenerators (TENGs). J. Appl. Phys. 2020, 128, 111101. [Google Scholar] [CrossRef]
  27. Callaty, C.; Gonçalves, I.; Rodrigues, C.; Ventura, J. Modeling the performance of contact-separation triboelectric nanogenerators. Curr. Appl. Phys. 2023, 50, 100–106. [Google Scholar] [CrossRef]
  28. Hossain, N.A.; Razavi, M.J.; Towfighian, S. Analysis of mechanical deformation effect on the voltage generation of a vertical contact mode triboelectric generator. J. Micromech. Microeng. 2020, 30, 045009. [Google Scholar] [CrossRef]
  29. Chen, J.; Guo, H.; He, X.; Liu, G.; Xi, Y.; Shi, H.; Hu, C. Enhancing Performance of Triboelectric Nanogenerator by Filling High Dielectric Nanoparticles into Sponge PDMS Film. ACS Appl. Mater. Interfaces 2016, 8, 736–744. [Google Scholar] [CrossRef] [PubMed]
  30. Zhou, Y.; Deng, W.; Xu, J.; Chen, J. Engineering Materials at the Nanoscale for Triboelectric Nanogenerators. Cell Rep. Phys. Sci. 2020, 1, 100142. [Google Scholar] [CrossRef]
  31. Patsidis, A.C. Barium titanate/polydimethylsiloxane nano/ microcomposites fabrication, morphology, dielectric response and functionality. IET Nanodielectrics 2020, 3, 14–19. [Google Scholar] [CrossRef]
  32. Jang, S.; Oh, J.H. Rapid Fabrication of Microporous BaTiO3/PDMS Nanocomposites for Triboelectric Nanogenerators through One-step Microwave Irradiation. Sci. Rep. 2018, 8, 14287. [Google Scholar] [CrossRef]
  33. Tantraviwat, D.; Ngamyingyoud, M.; Sripumkhai, W.; Pattamang, P.; Rujijanagul, G.; Inceesungvorn, B. Tuning the Dielectric Constant and Surface Engineering of a BaTiO3/Porous PDMS Composite Film for Enhanced Triboelectric Nanogenerator Output Performance. ACS Omega 2021, 6, 29765–29773. [Google Scholar] [CrossRef] [PubMed]
  34. Kim, Y.J.; Lee, J.; Park, S.; Park, C.; Park, C.; Choi, H.J. Effect of the relative permittivity of oxides on the performance of triboelectric nanogenerators. RSC Adv. 2017, 7, 49368–49373. [Google Scholar] [CrossRef]
  35. Kim, J.; Ryu, H.; Lee, J.H.; Khan, U.; Kwak, S.S.; Yoon, H.J.; Kim, S.W. High Permittivity CaCu3Ti4O12 Particle-Induced Internal Polarization Amplification for High Performance Triboelectric Nanogenerators. Adv. Energy Mater. 2020, 10, 1903524. [Google Scholar] [CrossRef]
  36. Lee, J.W.; Ye, B.U.; Baik, J.M. Research Update: Recent progress in the development of effective dielectrics for high-output triboelectric nanogenerator. APL Mater. 2017, 5, 073802. [Google Scholar] [CrossRef]
  37. Chen, J.; Wang, J.; Xuan, W.; Dong, S.; Luo, J. Universal triboelectric nanogenerator simulation based on dynamic finite element method model. Sensors 2020, 20, 4838. [Google Scholar] [CrossRef] [PubMed]
  38. Hasan, S.; Kouzani, A.Z.; Adams, S.; Long, J.; Mahmud, M.A. Comparative study on the contact-separation mode triboelectric nanogenerator. J. Electrost. 2022, 116, 103685. [Google Scholar] [CrossRef]
  39. Wang, Z.; Liu, W.; Hu, J.; He, W.; Yang, H.; Ling, C.; Xi, Y.; Wang, X.; Liu, A.; Hu, C. Two voltages in contact-separation triboelectric nanogenerator: From asymmetry to symmetry for maximum output. Nano Energy 2020, 69, 104452. [Google Scholar] [CrossRef]
  40. Rodrigues, C.; Pires, A.; Gonçalves, I.; Silva, D.; OIiveira, J.; Pereira, A.; Ventura, J. Hybridizing Triboelectric and Thermomagnetic Effects: A Novel Low-Grade Thermal Energy Harvesting Technology. Adv. Funct. Mater. 2022, 32, 2110288. [Google Scholar] [CrossRef]
  41. Zhou, Q.; Takita, R.; Ikuno, T. Improving the Performance of a Triboelectric Nanogenerator by Using an Asymmetric TiO2/PDMS Composite Layer. Nanomaterials 2023, 13, 832. [Google Scholar] [CrossRef]
Figure 1. (a) Contact-separation TENG represented in COMSOL and corresponding zoom in the PDMS/bottom electrode where the SrTiO3 particles can be observed. The displayed SrTiO3 particle concentration on PDMS is 7.1%. (b) Two electrodes with opposing total σ and the dielectric medium where, at the borders with the electrodes, a charge equilibrium is reached.
Nanoenergyadv 04 00009 g001
Figure 2. (a) V O C and (b) I S C as a function of ε e f f and SrTiO3 particle concentration on PDMS. (c) V and (d) I for particle-doped and ε e f f PDMS as a function of R L . The ε e f f values were obtained from Equation (1), with the obtained values for each particle concentration being displayed in Table 2.
Nanoenergyadv 04 00009 g002
Figure 3. (a) V O C , (c) I S C and (e) P m a x as a function of ε e f f and of SrTiO3 particle concentration on PDMS. (b) V, (d) I and (f) P for particle-doped and ε e f f PDMS and as a function of R L . All figures have σ corrected according to Equation (7).
Nanoenergyadv 04 00009 g003
Figure 4. (a) P m a x as a function of ε e f f . (b) Time variation in the charge in the lower electrode for different R L values. (c) Power output (P) normalized to the power output of the PDMS solely value ( P 0 ) as a function of ε e f f of the obtained results compared with available literature.
Nanoenergyadv 04 00009 g004
Table 1. List of parameters and corresponding base values. The out-of-plane thickness is the same as the width of the nylon/PDMS/copper electrode, giving a TENG area of 1 × 10⁻⁶ m2. σ values were based on Chen et al. [29] experimental values (in the range 10−5–10−4 C/m2).
ParameterValue
Velocity 5.999 m/s
Period 1 × 10 3 s
Number of periods (cycles)3
Time per step 1 × 10 6 s
σ of nylon 6 × 10 4 C/m2
σ of PDMS 6 × 10 4 C/m2
ε r of nylon4
ε r of PDMS 2.75
Width/Height of the air box0.1 m
Height/thickness of nylon/PDMS/electrodes of cooper 1 × 10 4 m
Width of PDMS/nylon/electrodes of cooper 1 × 10 3 m
Maximum distance between nylon and PDMS surfaces 3 × 10 3 m
Minimum distance between planes 2.1 × 10 5 m
Table 2. List of SrTiO3 particle concentrations and ε e f f values.
Concentration ε eff
0.7 % 4.9
1.4 % 7.0
2.8 % 11.1
4.2 % 15.4
5.7 % 19.6
7.1 % 23.8
8.5 % 28.0
Disclaimer/Publisher’s Note: The statements, opinions and data contained in all publications are solely those of the individual author(s) and contributor(s) and not of MDPI and/or the editor(s). MDPI and/or the editor(s) disclaim responsibility for any injury to people or property resulting from any ideas, methods, instructions or products referred to in the content.