Abstract
Physical activity practice and excessive screen time affect adolescent girls’ body satisfaction and body image. This study aimed to estimate the association between screen time and physical activity in relation to body dissatisfaction and body image among girls from different Brazilian regions, considering both the direct effect and the influence of sociodemographic characteristics and school affiliation. This is a cross-sectional study based on secondary data analysis. The outcomes were body dissatisfaction and body image dissatisfaction due to excessive thinness and excessive fat. Physical activity and screen time were independent variables. The moderating variables included sociodemographic characteristics and school affiliation. Direct effects were observed in active girls with a lower odds ratio (OR) of dissatisfaction due to excessive thinness (Southeast region, OR: 0.56, 95% CI: 0.34–0.90; South region, OR: 0.43, 95% CI: 0.19–0.43), whereas those with high screen times were more likely to report dissatisfaction due to excessive fat (Southeast region, OR: 1.80, 95% CI: 1.35–2.40; Northeast region, OR: 1.97, 95% CI: 1.28–3.03). Effect modification was observed based on sociodemographic characteristics and school affiliation. These behaviors were directly associated with body dissatisfaction, and age, school affiliation, skin color, and maternal education were important moderators of the relationship between physical activity and screen time.
1. Introduction
Body dissatisfaction can be understood as a negative evaluation of one’s own body, related to personal appearance [1,2]. Dissatisfaction with body image refers to the evaluation of the representation of the body, such as in relation to size and shape [3]. The pattern of body dissatisfaction and body image has been associated with low self-esteem, reduced emotional health, and the development of eating disorders among adolescent girls [1,3]. The potential harms associated with body dissatisfaction highlight this outcome as a significant public health issue [4,5].
In Brazil, the Federal Constitution, the Statute of Children and Adolescents, the Unified Health System and the Health in School Program constitute legal devices that aim to achieve comprehensive protection, as well as enabling health care and respect for the bodies of adolescents [6]. Despite these frameworks, there is a reduction in the self-perception of adolescents who perceive their appearance as normal, with an increase in the prevalence of those who self-assess their bodies as thin or very thin and as fat or very fat [7], which may be related to the exclusive focus on individual aspects, such as risk behaviors, and not on a broader health perspective [8], such as social and environmental constructs. In the Brazilian context, body dissatisfaction among adolescent girls reaches approximately 65.6%, with a gradual increase in dissatisfaction as they grow older [1,6].
Regarding body image, it is also observed that girls exhibit greater dissatisfaction with their current body image [9,10]. Thus, it is important to note the relevance of not only investigating body dissatisfaction, but also, simultaneously, dissatisfaction with body image, as they are distinct constructs that complement each other.
Associated with these aspects, it is important to note that the development of adolescent females is marked by significant social, physiological, and behavioral changes [11,12]. The adoption of health-risk behaviors such as inadequate nutrition, the use of harmful substances, sedentary behavior, and, above all, insufficient physical activity is frequently observed in this population [13,14,15]. In Brazil, it is estimated that the prevalence of physical activity practice is low [16,17], with lower prevalence both among girls in capital cities (9.8%) and among those in cities in the interior of the state (9.1%) in comparison with adolescent males (capital: 26.5%; interior cities: 26.8%) [17]. Regarding screen time, a systematic review study identified a prevalence of 70.9% of excessive screen time among Brazilian adolescents of both sexes [18].
In this context, studies have observed harmful effects resulting from the absence or low levels of physical activity [19], particularly excess body weight, obesity, and changes in dietary patterns [19], which may contribute to dissatisfaction with body and self-image. Furthermore, body dissatisfaction among girls appears to be influenced by screen exposure, as media-driven esthetic standards can increase the risk of eating disorders and low self-esteem, ultimately impacting body self-perception [1,14,20].
Given the scarcity of national studies addressing the relationship between physical activity, screen time, and dissatisfaction with body and self-image among adolescent girls, it is essential to investigate this association while considering different Brazilian regional contexts (climate, vegetation, population density, human development index, culture and economic aspects) and the influence or moderation of various characteristics. Understanding these relationships can support the development of public policies and programs that encourage physical activity and reduce excessive screen time, taking into account the country’s cultural and sociodemographic particularities. Such efforts aim to promote a more positive body image among adolescent girls.
The present study aimed to estimate the association between screen time and physical activity in relation to body dissatisfaction and self-image among girls from different regions of Brazil, considering both the direct effect and the influence of sociodemographic characteristics and school engagement.
2. Materials and Methods
2.1. Study Characterization
This is a secondary data analysis of a cross-sectional epidemiological study. The information was obtained from the National School Health Survey (PeNSE), conducted by the Health Surveillance Secretariat of the Brazilian Ministry of Health, with support from the Ministry of Education. PeNSE is a nationwide survey designed to assess aspects related to the behavior and health of Brazilian schoolchildren. The study was approved by the National Research Ethics Committee on Human Subjects of the Ministry of Health and obtained informed consent from all participants and their legal guardians, as per approval number 3.249.268, issued on 8 April 2019.
2.2. Target Population and Sample
The target population of the study comprised adolescents aged 13 to 17 years who were enrolled in and regularly attending the 7th grade of elementary school through to the 3rd year of high school in public and private schools located in both urban and rural areas. This age group was considered to ensure comparability of the research indicators with information monitored internationally. The study employed a two-stage cluster sampling design, with schools selected in the first stage and classrooms in the second. A total of 159,245 students from 4242 schools and 6612 classrooms participated in the survey with valid questionnaires.
The stratification of schools considered both their geographical location and administrative dependency. Geographically, schools were grouped based on their location in the capitals of the 26 Brazilian states and the federal capital, Brasília, or in municipalities outside the state capitals. This approach resulted in a total of fifty-three geographical strata—two for each state and one for the Federal District.
The schools were classified according to their administrative dependency (public or private) within each geographical stratum, resulting in a total of 106 sampling strata. The sample sizing was conducted based on the number of students required to ensure estimates with a controlled level of precision for each of these strata. Based on this calculation, the number of classrooms and schools needed to compose the sample was determined, ensuring a reliable and representative depiction of each sampling stratum.
The sample size of students was calculated to estimate a prevalence of approximately 0.5 (50%) with a coefficient of variation (CV) of 4%. This approach aimed to ensure a meaningful representation of the target population and minimize sampling errors, thereby providing more reliable and robust results for analysis and interpretation [21].
The selection of classrooms within each school from the updated registry was conducted with equal probabilities (simple random sampling) and aligned with the predetermined number of selected classrooms for each allocation stratum. This process ensured an accurate and reliable representation of the target population, reflecting the diversity and specific characteristics of each geographical and administrative stratum.
The student sample consisted of all students from the selected classrooms in each of the schools chosen in the first stage of selection. All students present on the day of data collection were automatically included to complete the survey questionnaire. Finally, the final sample for this study, which focused exclusively on female adolescents, comprised 63,324 participants.
2.3. Procedures and Instruments
Data collection took place from April to September 2019 using a mobile data collection device (Positivo brand–Curitiba, Brazil). The student version of the questionnaire was completed by the students under the supervision of trained administrators. To ensure the questionnaire’s adequacy, prior tests on completion time and cognitive studies were conducted to limit the number of questions and refine wording for better comprehension by students. These tests indicated the need for adjustments to improve question clarity. Among these adjustments, an assistance icon was added to the electronic questionnaire, displayed on the question screen, providing additional explanations or examples in text or image format to facilitate understanding.
In 2019, the student questionnaire included the following thematic sections and corresponding number of questions: general information (19 questions); nutrition (26 questions); physical activity (10 questions); tobacco use (14 questions); alcohol consumption (9 questions); other drugs (6 questions); home and school situations (10 questions); mental health (6 questions); sexual and reproductive health (13 questions); hygiene and oral health (6 questions); safety (24 questions); use of health services (9 questions); body image (6 questions); and an opinion section with 1 question.
2.4. Study Variables
The dependent variable in this study was the self-assessment of body satisfaction and body image (Table 1), based on the following questions: (a) How do you feel about your body? The response options were very satisfied; satisfied; indifferent; dissatisfied; very dissatisfied; (b) Regarding your body, how do you perceive yourself? The response options were very thin; thin; normal; overweight; very overweight.

Table 1.
Details of the classification of the dependent variable referring to self-assessment of body satisfaction and body image.
Based on these two questions, the study outcomes were defined as follows: dissatisfied with the body and perception of thinness (very thin/thin), coded as 1 in the database, and dissatisfied with the body and perception of excess weight (overweight/very overweight), coded as 2 in the database. All other response options were grouped as the reference category (value 0). This classification was employed considering that associations with various comorbidities may be linked to body and self-image dissatisfaction due to the perception of being very thin/thin or overweight/very overweight [22,23]. The study shows that subjective measures of self-assessment present positive evidence of concurrent validity [24].
The independent variables in this study were physical activity and screen time. For physical activity, the study considered information on active commuting (walking or cycling) to and from school, participation in physical education classes, and engagement in physical activities outside of school physical education classes. Based on these data, a physical activity variable was constructed, taking into account the total weekly duration of physical activity. This variable was then dichotomized as follows: physically active (300 min or more per week), coded as 1 in the database; insufficiently active (up to 299 min per week), coded as 0 in the database [25].
Screen time was assessed using the following question: (a) How many hours per day do you usually spend sitting while watching television, playing video games, using a computer, cellphone, or tablet, or engaging in other seated activities? Saturdays, Sundays, holidays, and time spent sitting at school were not to be considered. The response options were as follows: Up to 1 h per day; More than 1 h up to 2 h per day; More than 2 h up to 3 h per day; More than 3 h up to 4 h per day; More than 4 h up to 5 h per day; More than 5 h up to 6 h per day; More than 6 h up to 7 h per day; More than 7 h up to 8 h per day; More than 8 h per day. This variable was dichotomized as follows: excessive screen time (>3 h), coded as 1 in the database; adequate screen time (<3 h), coded as 0 in the database. This classification was based on recommendations for adolescents aged 11 to 18 years [26].
The variables used to estimate the effect modifier were age group (13 to 15 years, 16 to 17 years); self-reported skin color, dichotomized into white and racialized (racialized refers to a collective group that shares common experiences, histories, and identification modalities. This classification also considers phenotypic characteristics that may contribute to social disadvantage [27]. In this study, the racialized group included black, Asian, and indigenous participants); maternal education, categorized as up to incomplete high school and complete high school or higher education; school location, categorized as urban or rural; school administrative dependency, categorized as public or private. These variables were considered potential effect modifiers due to their social and individual relevance in Brazil, particularly in the relationship between physical activity, screen time, and body satisfaction.
These effect modification variables were also considered control variables, along with the following: consumption of vegetables and greens (up to 4 days and 5 or more days per week); consumption of sweets (did not consume sweets in the last 7 days and yes); consumption of fruits and fresh salads (up to 4 days and 5 or more days per week); consumption of soft drinks (up to 4 days and 5 or more days per week); consumption of fast food from street vendors or food stalls (did not consume in the last 7 days and yes); reason/cause for experiencing bullying, categorized as no bullying, because of my color or race, because of my religion, because of my facial appearance, because of my body appearance, because of my sexual orientation, because of my region of origin, and other reasons/causes; feelings of sadness, categorized as never/rarely and sometimes/most of the time/always; attempt to change weight, categorized as not trying to change weight, trying to lose weight, trying to gain weight, and trying to maintain current weight; use of vomiting or laxatives (yes and no); use of weight-loss products (yes and no); and use of muscle-gain products (yes and no).
These characteristics were considered as potential control variables because dietary habits (such as consumption of vegetables and greens, sweets, fruits and fresh salads, and fast food from street vendors or food stalls) are directly linked to health-related behaviors and weight control practices. Similarly, body-related attitudes (such as attempts to change weight, use of vomiting or laxatives, consumption of weight-loss products, and consumption of muscle-gain products) are key predictors of body perception [7]. Additionally, mental health-related contexts were considered, including reasons/causes for experiencing bullying and feelings of sadness, as these variables are directly associated with health-related behaviors.
2.5. Data Analysis
The PeNSE microdata are available in Excel format, and the analyses were conducted using Stata software, version 17.0. Post-stratification weights were applied due to the two-stage complex sampling design (school and class), using the survey module.
The geographic region variable was used in the stratification of the analyses, with the following Brazilian geographic regions: North, Northeast, Central-West, Southeast, and South. Therefore, all analyses were applied in a similar way, but separately for the geographic regions to which the adolescent girls belonged. Descriptive analyses of absolute and relative frequencies were performed, and the measure of association used was the odds ratio (OR), complemented by a 95% confidence interval (95% CI), using multinomial logistic regression. This analysis was adopted because the dependent variable presents three categories with mutually exclusive classification options (nominal variable). The direct association between the independent variables and the dependent variable was estimated in both crude and adjusted analyses, controlling for all control variables.
Subsequently, the interaction effect between each effect-modifying variable and the independent variables in relation to the dependent variable was examined, while adjusting for all control variables by OR (95% CI) using multinomial logistic regression. The interaction terms represent the multiplication of the independent variable by the moderating variable (age, school administrative dependency, school location, self-reported skin color, and maternal education). These results are presented in the tables. The existence of an association between the interaction term and the dependent variable indicates that the moderating variable interferes in the association between the independent variable and the dependent variable. Among the interaction terms with 95% CI that did not include 1, the association was further stratified by the effect-modifying variables with the presentation of the OR and 95% CI for each category of the moderating variable. These results are presented in the Results section. All the associations were considered significant when the 95% CI did not include 1.
3. Results
The description of the sample of Brazilian adolescent girls according to the country and its regions is presented in Table 2. It is observed that more than half of the participants were under 15 years old, with the highest concentration from the Southeast region. Regarding maternal education, a higher prevalence of mothers with complete high school or higher education was noted in the Southeast. The majority of adolescents were enrolled in schools located in urban areas and under public administration.
Table 2.
Description of the sample of adolescent girl by Brazil and Brazilian regions in 2019.
Concerning skin color, most adolescents self-identified as racialized. The consumption of soft drinks and sweets was lower among adolescents from the South and Central-West regions. More than half of the adolescents did not report experiencing bullying; however, among those who did, the main reason cited was the physical appearance of their face and body.
A high frequency of reported feelings of sadness was observed among adolescents, with a higher prevalence in the North and Northeast regions. Among adolescents who engaged in extreme weight control behaviors, weight loss measures were more frequently reported.
Regarding physical activity, adolescent girls engage in less physical activity (Figure 1). The South region stands out as the only one in the country where the proportion of sufficiently active adolescents exceeds the national average. In the Southeast, the proportions of adolescents who meet and do not meet physical activity recommendations are similar. With respect to the prevalence of screen time spent sitting for three or more hours per day among Brazilian adolescent girls, the Southeast region had a higher occurrence than the national average. The results indicated that girls from the North and Northeast regions of Brazil had lower prevalence rates of screen time exceeding three hours per day (Figure 1).
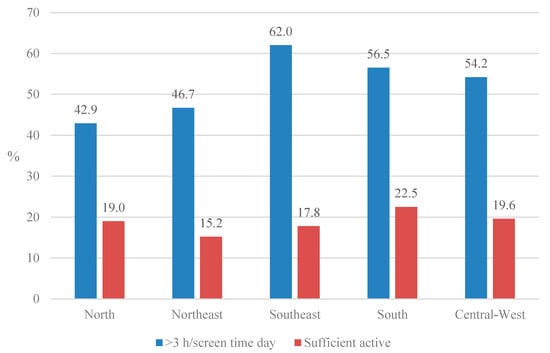
Figure 1.
Prevalence of screen time and physical activity in girls in Brazilian regions in 2019.
With regard to the prevalence of body image dissatisfaction (Figure 2), adolescent girls from all Brazilian regions showed greater dissatisfaction related to excess body fat. On the other hand, those from the North and Northeast regions exhibited lower prevalence rates of dissatisfaction associated with excess body fat.
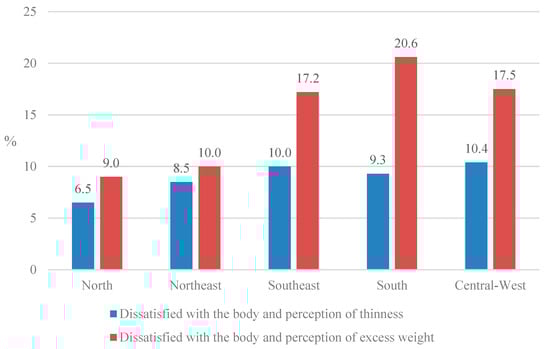
Figure 2.
Prevalence of dissatisfaction with the body and body image in girls in Brazilian regions in 2019.
Table 3 presents the crude and adjusted analyses regarding the association between physical activity and screen time with body dissatisfaction and body image dissatisfaction, both in relation to excessive thinness and excessive fat. In the crude analysis, considering sufficient physical activity, adolescent girls from the Northeast region showed a higher likelihood of dissatisfaction due to excess fat (OR: 1.62; 95% CI: 1.19–2.22). However, in the adjusted analysis, lower odds of dissatisfaction due to excessive thinness were observed among physically active adolescent girls in the Southeast and South regions (OR: 0.56; 95% CI: 0.34–0.90; OR: 0.43; 95% CI: 0.19–0.43, respectively).
Table 3.
Crude and adjusted analysis of the association between physical activity and screen time with dissatisfaction due to excessive thinness and excess fat in young women from Brazilian regions in 2019.
In the crude analysis (Table 3), regarding excessive screen time, dissatisfaction due to excessive thinness was associated with all regions except the North. Conversely, dissatisfaction due to excess fat was associated with all Brazilian regions. Regarding excessive screen time, there was an association with higher odds of dissatisfaction due to excess fat in all regions. For dissatisfaction due to excessive thinness, the association was significant in the Northeast, South, and Central-West regions.
Table 4 presents the moderating effect of age, represented by the interaction terms, on the association between physical activity, screen time, and the outcomes of body dissatisfaction and body image dissatisfaction among female adolescents. It was observed that age moderated the association between excessive screen time and dissatisfaction due to excessive thinness among adolescent girls in the North region. In this association, girls aged 16 and 17 years had higher odds of dissatisfaction due to excessive thinness (OR: 1.61; 95% CI: 1.04–2.49), whereas no association was found for the younger age group (OR: 1.02; 95% CI: 0.54–1.94).
Table 4.
Interaction terms of the adjusted * association between physical activity and screen time with dissatisfaction due to excessive thinness and excess fat, moderated by age, in young women from Brazilian regions in 2019.
The moderating effect of school administrative dependency on the association between physical activity and screen time with body dissatisfaction and body image dissatisfaction among adolescent girls is presented in Table 5. Girls with higher screen time demonstrated an association with dissatisfaction due to excessive thinness in the North region, with a modifying effect for those attending private schools (OR: 2.47; 95% CI: 1.40–4.37), but not for those in public schools (OR: 1.00; 95% CI: 0.64–1.58). In this region, active girls in public schools had 2.25 times (95% CI: 1.18–4.30) higher odds of dissatisfaction due to excessive fatness. Meanwhile, no association was observed among those attending private schools (OR: 0.64; 95% CI: 0.28–1.43).
Table 5.
Interaction terms of the adjusted * association between physical activity and screen time with dissatisfaction due to excessive thinness and excess fat, moderated by type of administrative dependency, in young women from Brazilian regions in 2019.
Among girls from the Southeast region, an interaction was observed between school administrative dependency and screen time in relation to dissatisfaction due to excessive thinness; however, no association was found among those attending public (OR: 1.57; 95% CI: 0.95–2.60) or private schools (OR: 0.73; 95% CI: 0.36–1.46). On the other hand, regarding dissatisfaction due to excessive fatness, an association was identified among girls from public schools (OR: 1.85; 95% CI: 1.39–2.48), but not among those from private schools (OR: 1.12; 95% CI: 0.70–1.80).
In the South region, an interaction was found between school administrative dependency and physical activity in the association with dissatisfaction due to excessive fatness. Physically active girls from public schools had 1.72 times (95% CI: 1.17–2.51) higher odds of dissatisfaction due to excessive fatness.
Conversely, in the Central-West region, an interaction between school administrative dependency and screen time was observed in the association with dissatisfaction due to excessive fatness. High screen time was associated with increased odds of dissatisfaction among girls attending both public (OR: 1.88; 95% CI: 1.43–2.47) and private schools (OR: 1.33; 95% CI: 1.06–1.66).
The moderating effect of school location on the association between physical activity and screen time with body dissatisfaction and body image dissatisfaction among adolescent girls is presented in Table 6. In the North region, an interaction between school location and physical activity was observed in relation to dissatisfaction due to excessive thinness. However, no association was found among girls attending urban schools (OR: 0.64; 95% CI: 0.25–1.64) or rural schools (OR: 3.52; 95% CI: 0.14–87.72). Among active girls in the Southeast region, an interaction was observed with lowers odds of dissatisfaction due to excessive thinness between urban school location (OR: 0.53; 95% CI: 0.32–0.89). An interaction was also identified between school location, screen time, and dissatisfaction due to excessive fatness (urban, OR: 1.85; 95% CI: 1.39–2.45). In the South region, an interaction was found between school location and physical activity in the association with dissatisfaction due to excessive thinness (urban, OR: 0.39; 95% CI: 0.17–0.87) and between school location and screen time in the association with dissatisfaction due to excessive thinness (urban, OR: 2.08; 95% CI: 1.20–3.61). In the Central-West region, an interaction was observed between school location and screen time in the association with dissatisfaction due to excessive fatness (urban, OR: 1.77; 95% CI: 1.35–2.32; rural, OR: 5.54; 95% CI: 1.40–21.94).
Table 6.
Interaction terms of the adjusted * association between physical activity and screen time with dissatisfaction due to excessive thinness and excess fat, moderated by school situation, in young women from Brazilian regions in 2019.
The moderating effect of self-reported skin color on the association between physical activity and screen time with body dissatisfaction and body image dissatisfaction among adolescent girls is presented in Table 7. An interaction was observed between self-reported skin color and physical activity in relation to dissatisfaction due to excessive thinness among girls in the North region. However, an association was found only among white girls (OR: 0.20; 95% CI: 0.07–0.52), while no association was observed among racialized girls (OR: 1.58; 95% CI: 0.52–4.80). In this same region, regarding dissatisfaction due to excessive fatness, physically active white girls had lower odds of dissatisfaction (OR: 0.30; 95% CI: 0.11–0.84), whereas racialized girls had higher odds (OR: 2.96; 95% CI: 1.40–6.26). Additionally, among girls in the North region, an interaction was observed between self-reported skin color and screen time in relation to dissatisfaction due to excessive fatness. An association was found among racialized girls (OR: 1.70; 95% CI: 1.09–2.65), but not among white girls (OR: 1.77; 95% CI: 0.83–3.77).
Table 7.
Interaction terms of the adjusted * association between physical activity and screen time with dissatisfaction due to excessive thinness and excess fat, moderated by self-reported skin color, in young women from Brazilian regions in 2019.
Table 8 presents the moderating effect of maternal education, represented by the interaction terms, on the association between physical activity, screen time, and the stages of body dissatisfaction and body image dissatisfaction among adolescent females. Physically active girls of the Northeast region whose mothers had at least completed high school showed lower odds of dissatisfaction due to excessive thinness (OR: 0.29; 95% CI: 0.12–0.70). However, no association was observed among girls whose mothers had incomplete high school education (OR: 1.10; 95% CI: 0.43–2.81).
Table 8.
Interaction terms of the adjusted * association between physical activity and screen time with dissatisfaction due to excessive thinness and excess fat, moderated by maternal education level, in young women from Brazilian regions in 2019.
4. Discussion
This study estimated the association between screen time and physical activity in relation to body dissatisfaction and body image concerns among adolescent girls across different regions of Brazil, considering the effect of sociodemographic characteristics and school affiliation. The prevalence of dissatisfaction related to excess body fat among Brazilian adolescents was found to be high in all regions, with the highest occurrence in the South and the lowest in the North and Northeast regions. Conversely, the North region was associated with the lowest prevalence of dissatisfaction due to excessive thinness. Adolescent girls tend to express greater dissatisfaction with their weight [28]. This heightened prevalence of dissatisfaction may pose health risks, as it can lead to attempts to lose weight through the adoption of unhealthy eating behaviors [7].
It is important to consider the influence of cultural and social contexts, represented by the different Brazilian regions, on adolescents’ self-perception of body image [28]. When analyzed by region, girls from the South stood out with the highest prevalence of dissatisfaction due to excess body fat. These differences may reflect the influence of nutritional, environmental, and genetic factors on adolescents’ body image perception [29]. Regions with better living conditions, such as the South, may contribute to greater height and weight among adolescents compared to other regions, in addition to being more influenced by beauty ideals [30].
The self-perception of body image among Brazilian adolescent girls is influenced by multiple factors, including media exposure, such as social networks, socially imposed standards, and sociodemographic aspects like maternal education, school administrative status, age, and ethnicity, all of which contribute to shaping this perception [31,32]. According to the Brazilian Institute of Geography and Statistics [30], assessing the effect of key characteristics such as school administrative dependency helps identify disparities among different groups, which is essential for developing public policies and targeted interventions for each group [33].
4.1. Physical Activity and Its Association with Body Dissatisfaction and Body Image in Brazilian Adolescent Girls
In the direct association with physical activity, a higher likelihood of dissatisfaction due to excess fat was observed in the Northeast region (OR: 1.62; 95% CI: 1.19–2.22). Culturally, young women are encouraged to engage in physical activity as a means of weight control or weight loss, which may contribute to a higher prevalence of perceiving themselves as overweight or significantly overweight [7]. Physical activity can be employed as a strategy to achieve an ideal standard of beauty. This pursuit of esthetic ideals may, in turn, increase body dissatisfaction and levels of physical activity [32]. Adolescents who engage in physical activity primarily as a means of weight control tend to exhibit higher levels of body dissatisfaction [29].
The administrative affiliation of schools (public or private) may influence adolescent behavior. Active young girls from public schools of the North region from Brazil were found to have 2.25 times (95% CI: 1.18–4.30) higher dissatisfaction due to excess body fat. Notable convergences in the association between physical activity and body image dissatisfaction related to excess fat were also observed in South (OR: 1.72; 95% CI: 1.17–2.51) regions, as active young girls from public schools in these areas were associated with a higher likelihood of dissatisfaction due to excess fat. School structure, resources, educational planning, and available educational policies also play a role in shaping these behaviors [33,34].
It was observed that the type of school setting moderated the association between physical activity and dissatisfaction due to excessive thinness in the North, Southeast, and South regions. Similar to administrative dependency, school setting is a socioeconomic predictor [35]. A recent study analyzing the active behavior of young people from various South American countries highlighted that socioeconomic status is related to students’ engagement in physical activities, particularly in the context of Physical Education classes. Students from families with a higher economic status tend to participate in more physical activities and have greater access to educational institutions with better structural conditions [36].
For adolescents girls in the Southeast region, an interaction was observed between the school setting and physical activity in relation to dissatisfaction due to excessive thinness (urban OR: 0.53; 95% CI: 0.32–0.89). This result may be attributed to urban areas offering better infrastructure, such as parks, plazas, and designated spaces for leisure-time physical activity [37]. Additionally, it is believed that this outcome may be influenced by adolescents in this social context being more inclined to conform to prevailing esthetic standards of thinness. Consequently, their motivation for engaging in physical activity may be linked to achieving a slimmer silhouette, aligning with current beauty ideals [10,38]. In this regard, the concern is not necessarily about appearing thin but rather about reducing visible signs of excess body fat.
It was observed that skin color had a moderating effect on the association between physical activity and body image dissatisfaction among Brazilian adolescents in the North region. White girls reported a lower likelihood of dissatisfaction due to excessive thinness (OR: 0.20; 95% CI: 0.07–0.52), indicating a protective factor, whereas no association was found for racialized individuals (OR: 1.58; 95% CI: 0.52–4.80). Regarding dissatisfaction due to excess body fat, being a physically active white young woman was a protective factor (OR: 0.30; 95% CI: 0.11–0.84) compared to racialized young women, who showed higher odds of dissatisfaction (OR: 2.96; 95% CI: 1.40–6.26). According to Mendonça et al. [39], there is greater internalization of thinness standards and more frequent engagement in dietary restrictions among white women compared to black women, which may explain our findings.
Regarding risk factors for dissatisfaction due to both excessive thinness and excessive body fat, a study conducted with black women found that physical activity was more prevalent in domestic tasks, followed by commuting activities—both of which are more physically demanding—while leisure-time physical activity had a lower prevalence [40]. In terms of the association between skin color and body dissatisfaction, racialized young women showed a higher likelihood of dissatisfaction due to excess body fat. This risk factor reflects a reality in which individuals are treated based on phenotypic skin characteristics and face social discrimination, often linked to the greater social appreciation of white skin. This lack of representation may lead them to perceive constant physical imperfections, driving them to seek modifications to their skin and bodies to align with idealized beauty standards. Consequently, this can result in dissatisfaction, whether from feeling overweight or underweight.
Maternal education played a moderating role in the association between adolescent physical activity and body dissatisfaction in the Northeast region. The present study found that physically active young women were less likely to report dissatisfaction due to thinness when their mothers had at least completed high school (OR: 0.29; 95% CI: 0.12–0.70). However, no significant association was observed among young women whose mothers had not completed high school (OR: 1.10; 95% CI: 0.43–2.81).
These findings suggest that mothers with higher levels of education tend to have greater access to information about health, well-being, and the benefits of physical activity [41], which may positively influence their daughters’ habits. Additionally, mothers with higher education levels may be better equipped to support and encourage their daughters in engaging in physical activities, fostering a family environment that values an active lifestyle. This dynamic may lead to lower levels of dissatisfaction with thinness, given that regular physical activity is associated with improved self-image and self-esteem [42].
On the other hand, the lack of a significant association between physical activity and body dissatisfaction among girls whose mothers have incomplete secondary education may indicate a context of limited access to information and resources, which could hinder adolescents from benefiting from the positive effects of physical activity on body perception and mental health [34,43]. In summary, maternal education may influence not only the understanding of the benefits of physical activity but also the ability to foster an environment that promotes healthy habits, thereby contributing to the modulation of body dissatisfaction among adolescents.
Higher maternal education increases the likelihood of overcoming situations of social vulnerability, changing family habits, and engaging in physical activities, such as developing leisure-time practices. A study conducted by Rodrigues et al. [3] reported that education is associated in different ways with physical activity: while lower education levels are linked to greater occupational and commuting physical activity, higher education levels are associated with increased engagement in leisure-time physical activity. Thus, it is assumed that maternal education is also related to the level of knowledge about environmental development and enrichment at each stage of children’s and adolescents’ growth. This factor serves as a key predictor of other family resources, as it contributes to a more stable family structure and ensures the well-being of children, providing better health conditions and actions related to body self-image [44,45].
It is important to characterize the practice of physical activity within the regional context of Brazil. For instance, the North region exhibited the lowest proportion of municipalities receiving funding for physical activity promotion programs, indicating a lack of infrastructure and opportunities for leisure-time physical activity [39]. Additionally, it was found that students from public schools consistently show a higher prevalence of active commuting to school [31]. These findings suggest that one of the main reasons why adolescents in the North region are sufficiently active is due to active commuting rather than structured physical activity programs.
4.2. Screen Time and Its Association with Body Dissatisfaction and Body Image in Brazilian Adolescent Girls
Screen time was directly associated with greater dissatisfaction due to excess fat (OR: 1.92; 95% CI: 1.55–2.37) and thinness (OR: 1.73; 95% CI: 1.23–2.45) in Brazil. The associations observed in different Brazilian regions suggest that prolonged screen time among adolescent girls is linked to a negative perception of their bodies [12]. This dissatisfaction with body image is directly related to sociocultural pressures driven by esthetic standards, which influence body perception and the desire to attain an unattainable body ideal [46].
In the North region, girls aged 16 and 17 who had high screen time were more likely (OR: 1.61; 95% CI: 1.04–2.49) to feel dissatisfied with their thinness. Although this association was observed, age may not always be related to screen behavior [47] and body dissatisfaction in other local contexts [48]. In general, older adolescents tend to have higher rates of sedentary behavior [49]. It is possible that adolescents in this age group do not find other activities, including physical exercise, particularly engaging, perceiving them as irrelevant to their expectations. This preference for sedentary activities, such as prolonged screen time, may contribute to greater body dissatisfaction. The influence of screen time on body image dissatisfaction can be compounded by developmental and psychosocial factors. As adolescents age, they experience increased exposure to digital media, peer comparisons, and social pressures related to appearance. The digital environment plays a critical role in shaping self-perception, and its impact may be more pronounced among older adolescents, who spend more time engaging with online content that reinforces unattainable beauty standards.
Given these findings, interventions targeting excessive screen time and promoting balanced digital consumption among older adolescents may help reduce body dissatisfaction. Encouraging engagement in physical activities, fostering critical awareness of digital media, and creating supportive environments for self-acceptance can be effective strategies to counteract the negative effects of prolonged screen exposure.
Furthermore, regarding the moderating effect of age in the North region, the association with dissatisfaction due to thinness may be influenced by regional anthropometric conditions, as adolescent girls in this region tend to have a lower average height and a lower prevalence of excess weight. Additionally, physical space limitations for sports activities may also play a role. On the other hand, the North region has the highest prevalence of active commuting.
These regional characteristics may shape adolescents’ perception of thinness, as factors such as body composition, lifestyle, and environmental conditions influence self-image [7,32]. Greater reliance on active commuting, combined with lower overall weight averages, may contribute to an increased perception of thinness among adolescents, reinforcing concerns about body image.
Considering the type of administrative dependence, an association was found between screen time and body dissatisfaction among adolescent girls. In Brazil, adolescents attending public schools had higher odds of dissatisfaction due to thinness (OR: 1.78; 95% CI: 1.25–2.52) and excess weight (OR: 1.95; 95% CI: 1.57–2.42) when exposed to prolonged screen time, whereas no association was observed among students from private schools.
As previously mentioned, school dependence serves as an economic indicator, as families with adolescents in private schools tend to have greater financial resources and higher parental education levels compared to those in public schools. This highlights the impact of socioeconomic challenges on health and well-being [50]. Adolescents in socially vulnerable contexts face distinct pressures regarding their body image, which may result in greater dissatisfaction due to feeling either underweight or overweight compared to perceived societal ideals [30].
Furthermore, regarding the interaction between administrative dependence and screen time spent in a seated position in association with body image dissatisfaction, adolescent girls from public schools in the Southeast region had higher odds of dissatisfaction due to excess weight (OR: 1.85; 95% CI: 1.39–2.48). Additionally, in the Central-West region, prolonged screen time was associated with greater chances of this dissatisfaction among girls from both public (OR: 1.88; 95% CI: 1.43–2.47) and private schools (OR: 1.33; 95% CI: 1.06–1.66).
A study conducted with high school students from public schools demonstrated greater exposure to sedentary behavior, which was attributed to more hours spent sitting for educational activities. This prolonged sitting time was identified as a predisposing factor for high consumption of soft drinks, stress and loneliness in girls [46], which potentially explains the findings of the present study regarding the Southeast region.
The moderating effect of school setting on the association between screen time and body dissatisfaction, specifically regarding excess weight, was observed in young women from the Southeast region, particularly in urban areas (OR: 1.85; 95% CI: 1.39–2.45). Similarly, this association was identified among girls from the Central-West region, where screen time was linked to dissatisfaction due to excess weight (urban, OR: 1.77; 95% CI: 1.35–2.32).
In rural areas of the Central-West, an association was also observed between screen time and dissatisfaction due to excess weight, characterizing a significant risk factor (OR: 5.54; 95% CI: 1.40–21.94). In rural locations, prolonged screen time behavior may be tied to fewer opportunities for leisure-time physical activity. These regional disparities across the country [47,48] contribute to body dissatisfaction, as limited access to structured recreational activities may lead to increased sedentary behavior and negative body perception.
Among girls from the South region, screen time was associated with dissatisfaction due to excessive thinness only in urban areas (OR: 2.08; 95% CI: 1.20–3.61). Several factors influence body dissatisfaction in adolescents, especially in regions with better living conditions, such as the South and Southeast. These areas offer greater chances of height and weight gain in this population compared to the North and Northeast. This may explain the lower prevalence of Southern adolescents who perceive themselves as too thin and the higher prevalence of those who see themselves as overweight.
There is a higher likelihood of body dissatisfaction and negative body image related to screen time among adolescents living in urban areas compared to those residing in rural areas [49]. It is plausible that adolescents in urban areas have greater access to technology, particularly regarding exposure to media and video games [29]. Furthermore, urban regions are generally characterized by better economic conditions compared to rural areas, which facilitates the acquisition of electronic devices for teenagers [30,37]. This access contributes to the increased prevalence of sedentary behavior among these adolescents [47].
It was observed that among racialized young women in the Northern region, screen time was associated with a higher likelihood of dissatisfaction due to excess body fat (OR: 1.70; 95% CI: 1.09–2.65). When analyzing this association moderated by skin color as a risk factor for racialized individuals, it is essential to consider the context of the Northern region, which has a higher representation of Indigenous students in its geographic distribution. These racialized students are often perceived based on their phenotypic skin characteristics and continue to face discrimination in the current social context. A greater valuation of white skin has been reported, as seen among university students [20]. Racialized individuals are frequently pressured to believe they have physical imperfections and seek to adjust or approximate an “ideal” skin and body type. Prolonged sedentary time spent on screen exposure intensifies this pursuit of conformity to prevailing beauty standards.
It is important to consider regional differences in screen time usage, as different sociocultural contexts can influence behaviors [33]. For example, the prevalence of screen time spent sitting for more than three hours per day among Brazilian adolescent girls was notably high in the Southeast region (62%), exceeding the national trend (56.8%). Regions with higher economic levels, more verticalized housing, and highly urbanized areas, such as capitals and large cities, are associated with increased exposure to sedentary behaviors. This trend can be explained by easier access to electronic devices and technology [30,33].
Therefore, when considering regional differences in body dissatisfaction among adolescents, it is essential to recognize that structural, socioeconomic, cultural, and environmental factors interact significantly in shaping self-image. The environment and infrastructure conditions, such as gyms, sports centers, and recreational leisure spaces, can directly influence physical activity patterns. In regions with limited access to such resources, physical activity is more often linked to active transportation rather than leisure, which affects body composition and may negatively impact body image perception.
Similarly, adolescents living in contexts of greater socioeconomic vulnerability tend to have less exposure to beauty ideals promoted by digital media, which may lessen, but not eliminate, the esthetic pressure. Furthermore, factors such as parental education and the educational level of the school community influence access to information about health and well-being, affecting both perception and the degree of body dissatisfaction.
Thus, it is understood that these regional disparities in body dissatisfaction are multifactorial, encompassing biological and anthropometric aspects, such as average height and weight, as well as structural and sociocultural conditions that may shape different patterns of dissatisfaction, whether due to thinness or excess body fat.
4.3. Limitations
This study has some limitations, including the use of a self-administered questionnaire in a school environment, which may have been influenced by contextual factors and peer interactions. Recall bias may also be a limiting factor, potentially leading to errors in reporting. This could result in incorrect inferences regarding screen time and minutes of physical activity. The body classifications used in this study are limited to individual interpretation and do not account for important factors such as nutritional status, body mass index, and sexual maturation of adolescents, all of which significantly influence body dimensions, proportions, and self-perception of body image. Therefore, it is essential to conduct further studies that incorporate these factors to better investigate the relationship between body self-perception and physical health among adolescent girls in different geographical contexts.
4.4. Strengths of This Study
The data from PeNSE 2019 support the development of indicators for characterizing the health profile of Brazilian adolescents and stand out for their national representativeness, encompassing both public and private schools. Given its broad sample size, this study significantly contributes to understanding the relationship between body dissatisfaction, body image perception, physical activity, and sedentary behavior. A key distinction of this study is its comprehensive analysis, which considers national-level data, covering all states, the Federal District, and multiple municipalities across Brazil.
The epidemiological variables examined across different geographic regions allow for a reconsideration of how individual experiences within social, familial, cultural, and biological contexts influence health promotion. Body image self-perception is a crucial indicator of adolescent health, and body satisfaction reports reflect the degree of affectivity toward one’s own body. This study is pioneering in investigating both aspects based on data from PeNSE. These findings are essential for identifying risk factors associated with development and unhealthy behavioral patterns within this population group.
The findings of this study, although specifically focused on adolescent girls from different regions of Brazil, have relevant implications that may be generalized to other populations with similar sociocultural and structural contexts, particularly in developing countries marked by regional inequalities. The evidence that factors such as screen time, physical activity level, school affiliation, skin color, and maternal education significantly influence body dissatisfaction suggests that health promotion interventions should consider the sociodemographic and environmental specificities of each context.
Although the data reflect Brazilian realities, the identified trends, such as the greater vulnerability of girls in less developed regions and the influence of media-driven beauty standards, are observed in different parts of the world, which broadens the applicability of the results to international settings. It is important to emphasize that the generalization of these findings should be made with caution, considering the cultural particularities, public policies, and resources available in each context. Therefore, this study not only contributes to understanding body dissatisfaction in Brazil but also provides an important foundation for global actions tailored to the diversity of social and geographic contexts.
5. Conclusions
Body dissatisfaction and concerns regarding body image are present across all regions of Brazil, with a higher prevalence related to excess body fat. Sociodemographic factors influence this relationship, highlighting regional differences in physical activity levels, screen time, and body dissatisfaction.
Most Brazilian adolescents do not meet the minimum physical activity recommendations, except in the South region. Screen time also varies, being higher in the Southeast and lower in the North and Northeast. Increased screen time was associated with a higher likelihood of dissatisfaction due to excess body fat. The relationship between physical activity and body dissatisfaction differs across regions: in the North and Northeast regions, it was associated with excess body fat, whereas in the Southeast region, it was linked to dissatisfaction with excessive thinness. Age, school affiliation, skin color, and maternal education played important moderating roles in determining both physical activity levels and screen time in relation to body image dissatisfaction.
Author Contributions
T.F.d.S. and D.L.V.S. contributed to the conception, methodology, and formal analysis of the study. D.L.V.S. and A.d.J.S. were responsible for the manuscript writing. T.F.d.S. conducted a critical review of the content, ensuring the quality and coherence of the work. All authors actively participated in the stages of the study, ensuring the integrity and clarity of the presented results. All authors have read and agreed to the published version of the manuscript.
Funding
This research received no external funding.
Institutional Review Board Statement
Ethical review and approval were waived for this study as the database used is publicly available and maintains data confidentiality without identifying or recognizing the participants.
Informed Consent Statement
Patient consent was waived as the database used is publicly available and maintains data confidentiality without identifying or recognizing the participants. Therefore, there was no risk to the individuals involved, ensuring compliance with applicable ethical standards.
Data Availability Statement
The data are publicly available, and the information from this research can be accessed at https://www.ibge.gov.br/estatisticas/sociais/educacao/9134-pesquisa-nacional-de-saude-do-escolar.html (accessed on 20 November 2024).
Conflicts of Interest
The authors declare no conflicts of interest.
References
- Calzo, J.P.; Sonneville, K.R.; Haines, J.; Blood, E.A.; Field, A.E.; Austin, S.B. The development of associations among body mass index, body dissatisfaction, and weight and shape concern in adolescent boys and girls. J. Adolesc. Health Off. Publ. Soc. Adolesc. Med. 2012, 51, 517–523. [Google Scholar] [CrossRef] [PubMed]
- Papageorgiou, A.; Fisher, C.; Cross, D. Why don’t I look like her? How adolescent girls view social media and its connection to body image. BMC Women’s Health 2022, 22, 261. [Google Scholar]
- Claro, R.M.; Santos, M.A.; Oliveira, C.M. Imagem corporal e atitudes extremas em relação ao peso em escolares Brasileiros (PeNSE 2012). Rev. Brasi Epidemio. 2014, 17, 146–157. [Google Scholar] [CrossRef] [PubMed]
- Fortes, L.S.; Meireles, J.F.; Neves, C.M.; Almeida, S.S.; Maria, E. Autoestima, insatisfação corporal e internalização do ideal de magreza influenciam os comportamentos de risco para transtornos alimentares? Rev. Nutr. 2025, 28, 253–264. [Google Scholar] [CrossRef]
- Ganesan, S.; Ravishankar, S.; Ramalingam, S. Are body image issues affecting our adolescents? A cross-sectional study among college going adolescent girls. Int. J. Community Med. Public Health 2025, 43, 42–46. [Google Scholar] [CrossRef]
- Oliveira, W.H.R.; Gonçalves, I.C.L. Direito à saúde da criança e do adolescente sob perspectiva do ECA. Rev. JRG Estud. Acadêmicos 2024, 7, e141203. [Google Scholar] [CrossRef]
- Antunes, J.T.; Lisboa, J.V. A autopercepção da imagem corporal dos adolescentes brasileiros nos anos de 2009 a 2019 segundo a Pesquisa Nacional de Saúde do Escolar (PeNSE). Cad. Saúde Pública 2024, 40, e00154723. [Google Scholar] [CrossRef]
- Lopes, I.E.; Nogueira, J.A.D.; Rocha, D.G. Eixos de ação do Programa Saúde na Escola e Promoção da Saúde: Revisão integrativa. Saúde Debate 2018, 42, 773–789. [Google Scholar] [CrossRef]
- Dumith, S.C.; Menezes, A.M.; Bielemann, R.M.; Petresco, S.S.; Linhares, R.S.; Amorim, T.C.; Duarte, D.V.; Araújo, C.L.; Santos, J.V. Insatisfação corporal em adolescentes: Um estudo de base populacional. Cien Saude Colet. 2012, 17, 2499–2505. [Google Scholar] [CrossRef][Green Version]
- Ribeiro, P.H.; Reichert, R.A.; Echeverria, W.S.; Melão, I.P.; Souza, L.S.; Martins, G.D.; Micheli, D. Body dissatisfaction: A study among Brazilian adolescents. Braz. J. Dev. 2022, 8, 10779–10786. [Google Scholar] [CrossRef]
- Dias, P.J.; Domingos, I.P.; Ferreira, M.C.; Muraro, A.P.; Sichieri, R.; Gonçalves-Silva, R.M. Prevalência e fatores associados aos comportamentos sedentários em adolescentes. Rev. Saude Publica 2014, 48, 266–274. [Google Scholar] [CrossRef] [PubMed][Green Version]
- Filho, R.C.; Lemes, T.M.E.; Sasaki, J.E.; Gordia, A.P.; Andaki, A.C. Comportamento sedentário em adolescentes brasileiros: Uma revisão sistemática. Rev. Bras. Ativ. Fis. Saúde 2020, 25, 1–13. [Google Scholar] [CrossRef]
- Guimarães, I.R.B.; de Sá, N.N.B.; Costa, G.S.; de Souza Figueira, M. Insatisfação com a imagem corporal e fatores de risco para doenças crônicas não transmissíveis entre adolescentes brasileiros. Rev. Bras. Rev. Saude 2022, 5, 14163–14186. [Google Scholar] [CrossRef]
- Guthold, R.; Stevens, G.A.; Riley, L.M.; Bull, F.C. Worldwide trends in insufficient physical activity from 2001 to 2016: A pooled analysis of 358 population-based surveys. Lancet Glob. Health 2018, 6, e1077–e1086. [Google Scholar] [CrossRef]
- Pires, M.L.; Fernandes, A.; Pereira, N.A. (In) satisfação com a imagem corporal e atitudes alimentares em estudantes do ensino secundário. Rev. Port. Enferm. Saude Ment. 2019, 7, 17–24. [Google Scholar] [CrossRef]
- Bezerra, M.A.A.; Sousa, J.S.R.; Simões Neto, J.C.; Gomes Filho, A.S.; Bottcher, L.B. Prevalência de inatividade física na adolescência: Revisão sistemática. Health Hum. 2019, 2, 1–9. [Google Scholar] [CrossRef]
- Soares, C.A.; Leão, A.A.; Freitas, M.P.; Pedro, C. and Wagner, MB. Temporal trend of physical activity in Brazilian adolescents: Analysis of the Brazilian National Survey of School Health. Cad. Saude Publica 2023, 39, e00063423. [Google Scholar] [CrossRef]
- Schaan, C.W.; Cureau, F.V.; Sbaraini, M.; Sparrenberger, K.; Kohl, H.W.I.I.; Schaan, B.D. Prevalência de tempo excessivo de tela entre adolescentes brasileiros: Revisão sistemática e meta-análise. J. Pediatr. Rio. J. 2019, 95, 155–165. [Google Scholar] [CrossRef] [PubMed]
- Mendonça, G.; Filho, A.P.; Barbosa, A.O.; Júnior, J.C. Padrões de comportamento sedentário em adolescentes do Nordeste. Rev. Bras. Ativ. Fis. Saúde 2018, 23, 1–9. [Google Scholar] [CrossRef]
- Cardoso, L.; Niz, L.G.; Aguiar, H.T.V.; Lessa, A.D.C.; Rocha, M.E.D.S.E.; Rocha, J.S.B.; Freitas, R.F. Insatisfação com a imagem corporal e fatores associados em estudantes universitários. J. Bras. Psiquiatr. 2020, 69, 156–164. [Google Scholar] [CrossRef]
- Cochran, W.G. Sampling Techniques; John Wiley & Sons, Inc.: Hoboken, NJ, USA, 1997; Available online: https://archive.org/details/cochran-1977-sampling-techniques/mode/2up (accessed on 22 October 2024).
- Fonseca, J.; Ribeiro, R.C.; Brito, K.B.; Portela, M.L. Imagem corporal e autoestima em adolescentes da rede pública estadual. Psicol. Estud. 2023, 28, e51648. [Google Scholar] [CrossRef]
- Lira, A.G.; Ganen, A.P.; Lodi, A.S.; Alvarenga, M.S. Uso de redes sociais, influência da mídia e insatisfação com a imagem corporal. J. Bras. Psiquiatr. 2017, 66, 164–171. [Google Scholar] [CrossRef]
- Tavernard, E.P.M.; Florêncio, C.B.S.; Pontes, F.A.R.; Silva, S.S.C. Autopercepción y adolescencia: Revisión sistemática de la literatura. Psicol. Clin. 2023, 35, 61–84. [Google Scholar]
- Silva, K.S.; Nahas, M.V.; Hoefelmann, L.P.; Lopes, A.S.; Oliveira, E.S. Associações entre atividade física, índice de massa corporal e comportamentos sedentários em adolescentes. Rev. Bras. Epidemiol. 2008, 11, 159–168. [Google Scholar] [CrossRef]
- Sociedade Brasileira de Pediatria. Manual de orientação para o uso consciente de telas e dispositivos digitais. SBP 2024. Available online: https://www.sbp.com.br/fileadmin/user_upload/24604c-MO__MenosTelas__MaisSaude-Atualizacao.pdf (accessed on 22 October 2024).
- Bessone, M. Que gênero de grupo são as raças? Naturalismo, construtivismo e justiça social. Plural 2020, 27, 331–354. [Google Scholar] [CrossRef]
- Machado, A.P.; dos Santos, P.D.A.; Canever, L.; Valentim, F.C.; Guimarães, P.R.V. Transtorno de autoimagem e insatisfação corporal em adolescentes de escola privada. Saúde Meio Ambiente Tecnol. Cuid. Interdiscip. 2021, 2, 9–21. [Google Scholar]
- Ferreira, C.S.; Andrade, F.B. Desigualdades socioeconômicas associadas ao excesso de peso e sedentarismo em adolescentes brasileiros. Cien Saude Colet. 2021, 26, 1095–1104. [Google Scholar] [CrossRef]
- Instituto Brasileiro de Geografia e Estatística (IBGE). Pesquisa Nacional de Saúde: 2019: Atenção Primária à Saúde e Informações Antropométricas: Brasil; IBGE: Rio de Janeiro, Brazil, 2020.
- Ferreira, R.W.; Varela, A.R.; Monteiro, L.Z.; Häfele, C.A.; Santos, S.J.; Wendt, A.; Silva, I.C. Desigualdades sociodemográficas na prática de atividade física de lazer e deslocamento ativo para a escola em adolescentes: Pesquisa Nacional de Saúde do Escolar (PeNSE 2009, 2012 e 2015). Cad. Saude Publica 2018, 34, e00037917. [Google Scholar] [CrossRef]
- Claumann, G.S.; Laus, M.F.; Felden, É.P.G.; Silva, D.A.S.; Pelegrini, A. Associação entre insatisfação com a imagem corporal e aptidão física relacionada à saúde em adolescentes. Cien Saude Colet. 2019, 24, 1299–1308. [Google Scholar] [CrossRef]
- Zanolli, N.M.B.C.; Cândido, A.P.C.; Oliveira, R.M.S.; Mendes, L.L.; Neto, M.P.; Souza, A.I.S. Fatores associados à insatisfação corporal de crianças e adolescentes de escola pública no município da Zona da Mata Mineira. Rev. APS 2019, 22, 1. [Google Scholar] [CrossRef]
- Santos, T.R.; Pirauá, A.L.; Farah, B.Q.; Silva, A.O.; Barros, M.V.; Ritti-Dias, R.M.; Oliveira, L.M. Qual o impacto das escolas de tempo integral ou semi-integral sobre o nível de atividade física e comportamento sedentário de adolescentes? Estudo transversal. Hum. Inov. 2020, 7, 297–304. [Google Scholar]
- Malta, D.C.; Stopa, S.R.; Santos, M.A.S.; Andrade, S.S.C.D.A.; Oliveira, M.M.D.; Prado, R.R.D.; Silva, M.M.A.D. Fatores de risco e proteção de doenças e agravos não transmissíveis em adolescentes de segunda raça/cor: PENSE. Rev. Bras. Epidemiol. 2017, 20, 247–259. [Google Scholar] [CrossRef] [PubMed]
- Araujo, R.H.; Werneck, A.O.; Barboza, L.L.; Ramírez-Vélez, R.; Martins, C.M.; Tassitano, R.M.; Silva, E.C.; de Jesus, G.M.; Matias, T.S.; de Lima, L.R.; et al. Prevalência e correlatos sociodemográficos de atividade física e tempo sentado entre adolescentes sul-americanos: Uma análise harmonizada de pesquisas transversais nacionalmente representativas. Int. J. Behav. Nutr. Phys. Act. 2022, 19, 52. [Google Scholar] [CrossRef]
- Instituto de Pesquisa Econômica Aplicada (IPEA). Agenda 2030: Metas Nacionais dos Objetivos de Desenvolvimento Sustentável—Proposta de Adequação; IPEA: Brasília, Brazil, 2018.
- Oliveira, M.R.; Machado, J.S.A. O peso insustentável da autoimagem: (re)apresentações na sociedade do espetáculo. Cien Saude Colet. 2021, 26, 2663–2672. [Google Scholar] [CrossRef]
- Mendonça, G.; Cheng, L.A.; deJunior, F.J.C. Padrões de prática de atividade física em adolescentes de um município da região Nordeste do Brasil. Cien Saude Colet. 2018, 23, 2443–2451. [Google Scholar] [CrossRef]
- Pitanga, J.F.; Lessa, I.; Barbosa, P.J.; Barbosa, S.J.; Costa, M.C.; Lopes, A.S. Fatores sociodemográficos associados aos diferentes domínios da atividade física em adultos de etnia negra. Rev. Bras. Epidemiol. 2012, 15, 363–375. [Google Scholar] [CrossRef] [PubMed][Green Version]
- Instituto Brasileiro de Geografia e Estatística (IBGE). Síntese de Indicadores Sociais: Uma Análise das Condições de Vida da População Brasileira; IBGE: Rio de Janeiro, Brazil, 2018.[Green Version]
- Fernandes, B.A.; Assis, A.F.; Leite, G.C.; Leite, L.B.; Aparecida, R.O.R. Comparação entre o nível de atividade física e autoestima de adolescentes praticantes e não praticantes de taekwondo. Cad. Educ. Fis. Esporte 2024, 22, e32773. [Google Scholar] [CrossRef]
- Rodrigues, P.F.; Melo, M.; Assis, M.; Oliveira, A. Condições socioeconômicas e prática de atividades físicas em adultos e idosos: Uma revisão sistemática. Rev. Bras. Ativ. Fis. Saude 2017, 22, 217–232. [Google Scholar] [CrossRef]
- Ackson, M.; Kiernan, K.; Mclanahan, S. Maternal education, changing family circumstances, and children’s skill development in the United States and UK. Ann. Am. Acad. Pol. Soc. Sci. 2017, 674, 59–84. [Google Scholar] [CrossRef]
- Fantineli, E.R.; Silva, M.P.D.; Campos, J.G.; Malta Neto, N.A.; Pacífico, A.B.; Campos, W.D. Imagem corporal em adolescentes: Associação com estado nutricional e atividade física. Cien Saude Colet. 2020, 25, 3989–4000. [Google Scholar] [CrossRef]
- Brandão, C.A.; Santos, L.S.; Ribeiro, D.S.; Rodrigues, M.J.; dos Santos, S.C.; Lima, E.O.; Guimarães, A.C.; do Nascimento Santos, J.B.; Menezes, A.S. Associação entre a exposição ao comportamento sedentário e fatores alimentares, sociais e de saúde mental em adolescentes da rede pública estadual de Sergipe. Pesqui. Soc. Desenv 2021, 10, e16110413938. [Google Scholar] [CrossRef]
- do Nascimento, J.Y.; Lima, C.V.; Giudicelli, B.B.; Lima, L.M.; Bandeira, P.F.; dos Santos Pinheiro, I.K.; Magalhães, K.C.; da Silva, D.R.; de Lucena Martins, C.M.; dos Santos Henrique, R.; et al. Fatores associados aos comportamentos ativo e sedentário em adolescentes brasileiros: Uma análise de redes. Rev. Bras. Ativ. Fis. Saude 2023, 28, 1–10. [Google Scholar] [CrossRef]
- Carvalho, G.X.D.; Nunes, A.P.N.; Moraes, C.L.; Veiga, G.V.D. Insatisfação com a imagem corporal e fatores associados em adolescentes. Cien Saude Colet. 2020, 25, 2769–2782. [Google Scholar] [CrossRef] [PubMed]
- Andrade Neto, F.; Eto, F.N.; Pereira, T.S.S.; Carletti, L.; Molina, M.D.C.B. Active and sedentary behaviours in children aged 7 to 10 years old: The urban and rural contexts, Brazil. BMC Public Health 2014, 14, 1174. [Google Scholar] [CrossRef]
- Malta, D.C.; Morais Neto, O.L.; Silva, M.M.A.D.; Rocha, D.; Castro, A.M.D.; Reis, A.A.C.D.; Akerman, M. Política Nacional de Promoção da Saúde (PNPS): Capítulos de uma caminhada ainda em construção. Cien Saude Colet. 2016, 21, 1683–1694. [Google Scholar] [CrossRef]
Disclaimer/Publisher’s Note: The statements, opinions and data contained in all publications are solely those of the individual author(s) and contributor(s) and not of MDPI and/or the editor(s). MDPI and/or the editor(s) disclaim responsibility for any injury to people or property resulting from any ideas, methods, instructions or products referred to in the content. |
© 2025 by the authors. Licensee MDPI, Basel, Switzerland. This article is an open access article distributed under the terms and conditions of the Creative Commons Attribution (CC BY) license (https://creativecommons.org/licenses/by/4.0/).