Article

Fat-Free Mass Normalization Impacts Cardiorespiratory Fitness in Overweight Adolescents

1
Department of Biology, Duke University, Durham, NC 27708, USA
2
Department of Biochemistry, University of Florida, Gainesville, FL 32611, USA
3
Department of Biology, University of North Carolina at Chapel Hill, Chapel Hill, NC 27514, USA
4
Department of Public Health and Exercise Science, Appalachian State University, Boone, NC 28608, USA
5
Department of Biotechnological and Applied Clinical Sciences, University of L’Aquila, 67100 L’Aquila, Italy
*
Author to whom correspondence should be addressed.
Adolescents 2025, 5(3), 48; https://doi.org/10.3390/adolescents5030048
Submission received: 3 June 2025 / Revised: 23 August 2025 / Accepted: 10 September 2025 / Published: 18 September 2025

Abstract

Accurate assessment of cardiorespiratory fitness (CRF) in adolescents is critical. However, normalizing oxygen consumption (VO2) to body mass (BM) may underestimate CRF in overweight (OW) youth by including metabolically inactive fat mass. This study examined differences in VO2 normalized by BM and fat-free mass (FFM) between normal weight (NW) and OW adolescents. Thirty-eight participants (19 NW, 19 OW; 12–17 years) underwent anthropometric, body composition, and cardiorespiratory fitness assessments. VO2 at the aerobic threshold (VO2AerT), anaerobic threshold (VO2AnT), and peak exercise (VO2peak) were measured and expressed in absolute terms and relative to BM and FFM. Group differences in the main outcomes were analyzed using a one-way ANOVA, and Pearson correlation was used to examine associations between VO2, BM and FFM. When normalized by BM, NW adolescents showed significantly higher VO2AerT (18.7 ± 3.6 vs. 14.5 ± 2.3), VO2AnT (28.8 ± 6.3 vs. 23.6 ± 4.7), and VO2peak (37.7 ± 6.7 vs. 29.1 ± 7.0) compared to OW peers (p < 0.05). No significant differences were found when VO2 values were normalized by FFM. A group difference was observed in the VO2peak vs. BM slope (p = 0.03) but not in the VO2peak vs. FFM slope. FFM normalization provides a more accurate assessment of CRF by accounting for differences in body composition, underscoring the importance of evaluating the aerobic capacity of metabolically active tissue rather than total body weight in youth populations.

1. Introduction

Over the past three decades, the prevalence of adolescent overweight and obesity in the U.S. has risen dramatically, presenting both a public health crisis and economic burden [1]. Early interventions targeting cardiovascular and metabolic health are essential to reduce long-term disease risk in this population [2,3,4].
While weight management is important, cardiorespiratory fitness (CRF) is independently associated with favorable health outcomes in youth [5]. CRF is typically assessed during a graded exercise test using peak oxygen uptake (VO2peak), often normalized to body mass (BM) to account for individual differences in size. However, this method may underestimate CRF in overweight (OW) individuals, as it incorporates metabolically inactive fat mass (FM), thereby lowering VO2 values regardless of true aerobic capacity [6,7,8]. To address this limitation, researchers have explored alternative normalization strategies, such as adjusting VO2 to lean body mass, fat-free mass (FFM), or standardizing against predicted BM at the 50th BMI percentile [9,10,11]. FFM, defined as total body mass minus FM, is an accessible measure in adolescents and is directly related to CRF, as it excludes metabolically inactive fat [12]. Thus, FFM is a practical and physiologically meaningful variable for assessing CRF.
In adolescents, submaximal markers of CRF such as VO2 at the aerobic threshold (VO2AerT) and anaerobic threshold (VO2AnT) are frequently used for individuals who cannot achieve maximal effort during a graded exercise test [13]. These submaximal indicators reflect metabolic efficiency and endurance capacity and are reliable proxies of CRF [3,13,14,15]. To our knowledge, few studies have investigated how normalizing submaximal parameters and VO2peak by FFM affects the interpretation of CRF in OW versus normal weight (NW) adolescents.
This study aims to determine whether normalization to FFM provides a more accurate and equitable assessment of CRF in these populations compared to the traditional normalization to body BM, both at maximal and submaximal intensities. We hypothesized that OW adolescents would demonstrate lower VO2peak, VO2AerT, and VO2AnT than their NW peers when expressed relative to BM, and that these differences would be largely attenuated when expressed relative to FFM.

2. Materials and Methods

Thirty-eight North Carolina adolescents (age 14 ± 2 years) were recruited for this cross-sectional, observational study. To ensure representation across socioeconomic levels and ethnic groups, participants were recruited from a state-funded program serving both rural and urban areas. Recruitment also targeted the local rural community in North Carolina, USA, through flyers, word of mouth, and email outreach. Participants were assigned to an NW (6 female and 13 male, 19 total) or OW (6 female and 13 male, 19 total) group based on body mass index (NW, BMI <85th percentile and OW, BMI ≥ 85th percentile for age and sex) and body fat percentage (BF%) (NW < 24% for males and <30% for females; OW ≥ 24% for males and ≥30% for females) [14,16]. Written informed consent was obtained from parents or legal guardians. Assent was obtained from all adolescent participants using a simplified assent form, with clarifications provided as needed. Consent and assent were provided in person upon arrival at the laboratory under the supervision of the principal investigator. Inclusion criteria included an age between 12 and 17 years. Exclusion criteria were age ≤11 or ≥18 years, or the presence of established renal, metabolic, or cardiovascular disease. Participants were instructed to avoid strenuous physical activity on the day of testing and to refrain from consuming caffeine, dietary supplements, or other stimulants for at least four hours beforehand. To ensure consistency in data collection while accommodating participant availability, tests were scheduled from 8:00 to 11:00 AM and from 4:00 to 6:00 PM.

2.1. Body Composition and Anthropometric Measurement

Height and BM were measured using a stadiometer and a calibrated scale to the nearest 0.1 cm and 0.1 kg, respectively. FM and FFM in absolute and relative values (FM%, FFM%) were assessed using BOD POD (COSMED USA, Concord, CA, USA) using the Siri equation and the predicted thoracic gas volume. Participants were given the opportunity to use the restroom prior to testing and were required to wear tight-fitting clothing and a swimmer’s cap, with shoes and jewelry removed during the assessment. Before each test, a warm-up, autorun, scale calibration, and volume calibration were performed following manufacturer’s recommendations. The BOD POD has been shown to obtain acceptable [17] and reliable FM% measurements [18] while providing a minimally invasive and non-operator-dependent assessment.

2.2. Cardiorespiratory Fitness Test

A graded exercise test to volitional exhaustion was used to assess CRF. Participants exercised on an electronically braked pediatric cycle ergometer (Lode Corrival, Groningen, The Netherlands) while respiratory gas exchange was monitored breath-by-breath using a portable metabolic cart (K5, Cosmed, Chicago, IL, USA). The cycle ergometer allowed precise control of the workload and minimized the risk of injury, while the reduced dimensions of the portable metabolic cart improved ease of exercise. During the graded test, participants rested for 2 min and then completed a 15 Watts per minute protocol at a cadence of 65–70 rpm, starting from unloaded pedaling at 0 Watts. The test ended when participants pedaled at a cadence slower than 50 rpm or decided to stop. Prior to each test, the metabolic cart was calibrated according to the manufacturer’s instructions, including turbine calibration with a 3-L syringe, gas calibration with reference concentrations of O2 (16.00% and 20.93%) and CO2 (5.0% and 0.04%), as well as CO2 scrubber and delay calibrations [19]. Raw breath-by-breath data were processed using a 6-point moving average and subsequently averaged over 10-s intervals. Heart rate (HR) was continuously monitored with a GARMIN chest strap device (GARMIN, Olathe, KS, USA). The ventilatory equivalent method was used as the primary criterion for the graphical determination of VO2AerT and VO2AnT, with the V-slope method as a secondary criterion [15]. Two independent investigators determined the thresholds, and results were confirmed by an experienced exercise physiologist if they differed by more than 30 s. The values of VO2AerT, VO2AnT, and VO2peak were calculated as 30-s averages, with VO2peak defined as the average of the highest VO2 values at the end of the test. The VO2AerT, VO2AnT, and VO2peak were expressed in absolute terms (mL/min), relative to BM (mL/kgBM/min), and relative to FFM (mL/kgFFM/min).

2.3. Statistical Analysis

Based on an a priori power analysis using previously published VO2peak (mL/kgBM/min) data from our laboratory, we calculated that a two-tailed comparison of independent means with an anticipated effect size of 0.910, an alpha level of 0.05, and a desired power of 0.8 would require 20 participants per group (NW and OW) to detect a statistically significant difference. Mean differences in primary (VO2peak, VO2AerT, and VO2AnT) and secondary (anthropometrics) outcomes between NW and OW participants were identified using a one-way ANOVA. Normality of the sample was assessed using the Shapiro–Wilk test and homogeneity of variances with Levene’s test. Effect sizes for between-group differences were calculated using Cohen’s d, with thresholds of 0.2, 0.5, and 0.8 interpreted as small, moderate, and large effects, respectively. Associations between independent (BM and FFM) and dependent (VO2peak, VO2AerT, and VO2AnT) variables were assessed using Pearson correlations and linear regressions. Differences in regression slopes between NW and OW adolescents were tested using Analysis of Covariance (ANCOVA) to determine whether the relationship between the dependent variable (VO2) and the covariate (BM or FFM) varied significantly between groups (grouping factor: NW, OW). Results were expressed as mean and SD. Statistical significance was defined as p < 0.05. The SPSS Software, IBM version 29.0.1.0 (IBM Corp., Armonk, NY, USA) was used to perform all analyses.

3. Results

Our sample was composed of participants representing different ethnicities including White (n = 24, 63.2%), Indian (n = 7, 18.4%), Asian (n = 4, 10.5%), and Black (n =3, 7.9%).
All anthropometric and fitness measurement raw data are reported in the Supplementary Table S1. Shapiro–Wilk tests indicated that most CRF indices were normally distributed (p > 0.05), except VO2AerT normalized by BM, VO2AnT, and VO2AnT normalized by BM (p < 0.05). Given the robustness of ANOVA in moderating deviations from normality, all variables were included in the analysis.
Table 1 presents the anthropometric profiles of the NW and OW groups. Compared to NW peers, OW adolescents had significantly higher BM (p < 0.01), BMI (p < 0.01), FM (p < 0.01), and FM% (p < 0.01). Conversely, FFM% was significantly lower in OW compared to NW participants (p < 0.01), while absolute FFM did not differ significantly between groups (p > 0.05).
Table 2 reports the mean differences in oxygen consumption parameters at the aerobic threshold (VO2AerT), anaerobic threshold (VO2AnT), and peak exercise (VO2peak) in NW and OW adolescents along with Cohen’s d statistics. When normalized to BM, VO2AerT, VO2AnT, and VO2peak were significantly lower in OW compared to NW (p < 0.01). No significant differences were observed when normalized to FFM. Between-group comparisons revealed large effects for BM-normalized indices (VO2AerT, VO2AnT, VO2peak; Cohen’s d = 0.94–1.39), while FFM-normalized indices showed negligible to small effects (Cohen’s d = −0.25 to 0.06). Absolute VO2 demonstrated moderate differences favoring NW adolescents (Cohen’s d = −0.37 to −0.60).
Figure 1 depicts differences in VO2AerT, VO2AnT, and VO2peak values between the NW and OW groups. Significant differences between NW and OW participants were observed in VO2AerT, VO2AnT, and VO2peak when normalized to BM (p < 0.05). Compared to OW participants, NW participants reported higher VO2AerT (18.7 ± 3.6 vs. 14.5 ± 2.3), VO2AnT (28.8 ± 6.3 vs. 23.6 ± 4.7), and VO2peak (37.7 ± 6.7 vs. 29.1 ± 7.0) when normalized to BM, whereas no significant differences in VO2AerT (22.4 ± 3.5 vs. 22.6 ± 3.2, p = 0.85), VO2AnT (34.6 ± 7.1 vs. 36.1 ± 4.6, p = 0.83), and VO2peak (45.1 ± 6.4 vs. 44.7 ± 6.6, p = 0.46) were observed when normalized to FFM.
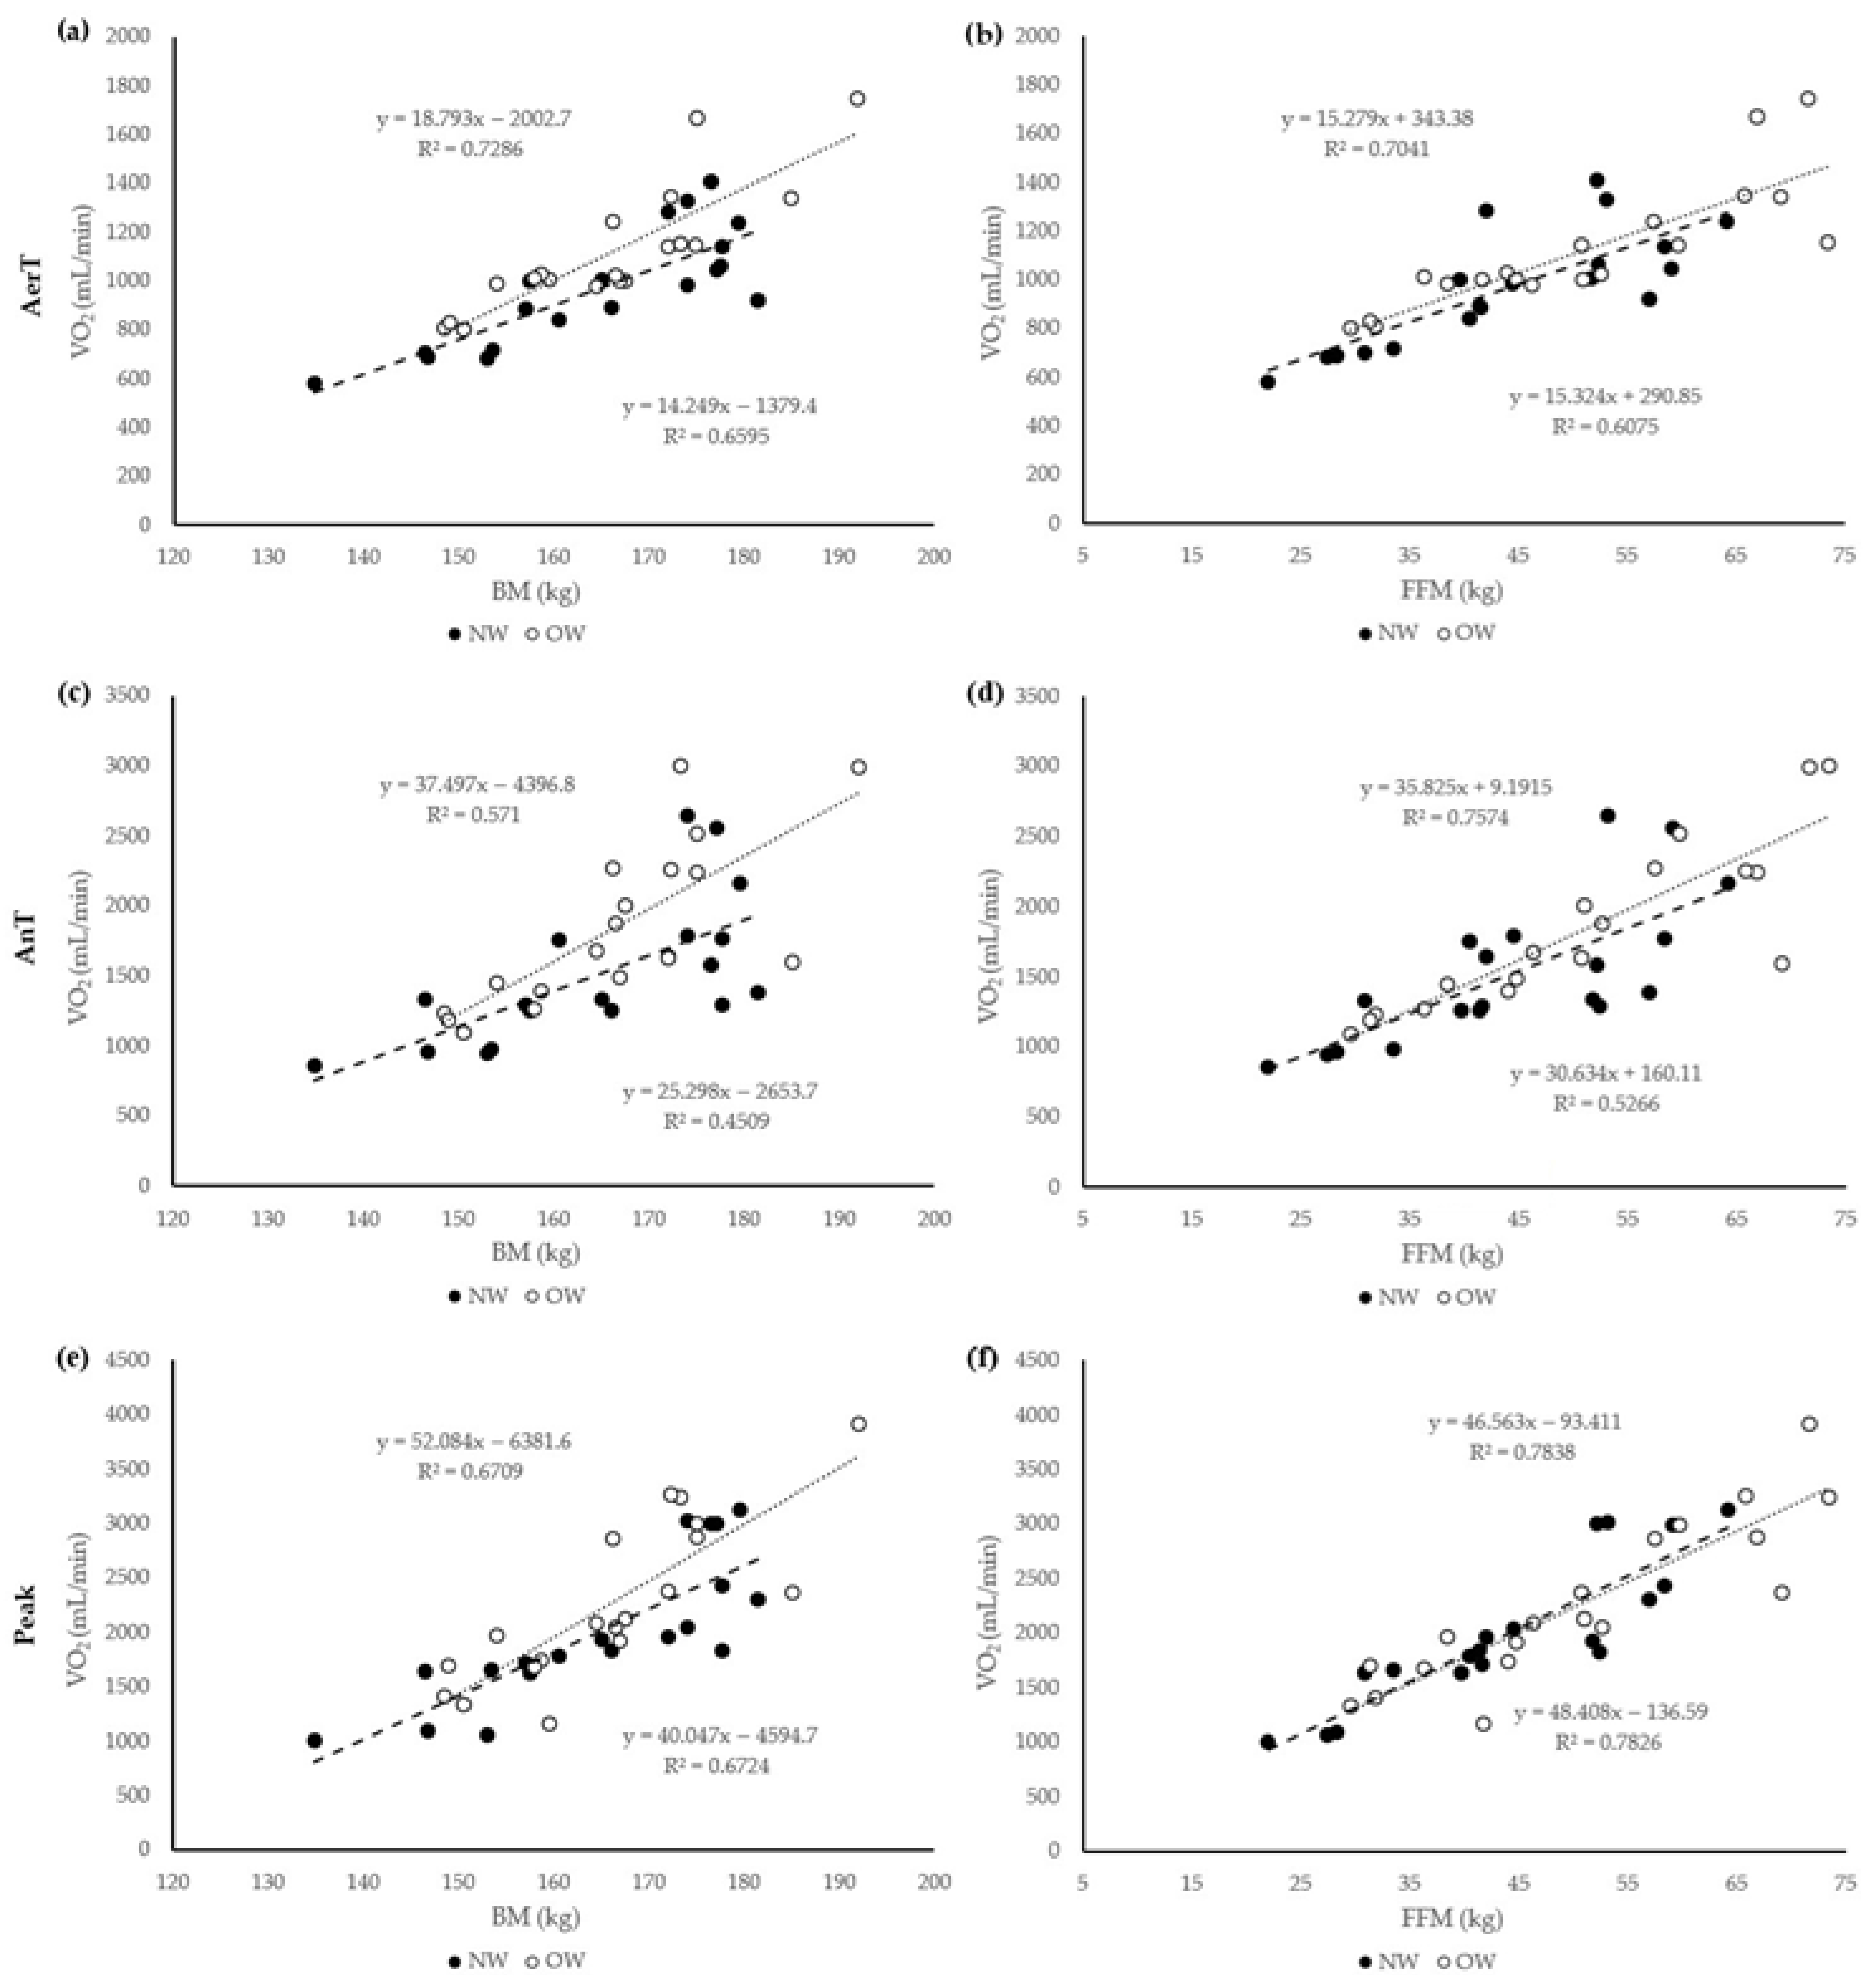
Figure 2 displays the relationships between VO2AerT, VO2AnT, and VO2peak with BM and FFM in NW and OW adolescents (panels a–f). VO2AerT showed moderate to very strong correlations with BM (r = 0.673, p < 0.01, NW and r = 0.818, p < 0.01, OW) and FFM (r = 0.779, p < 0.01, NW and r = 0.839, p < 0.01, OW). Similarly, VO2AnT showed moderate to very strong correlations with BM (r = 0.712, p < 0.01, NW and r = 0.771, p < 0.01, OW) and FFM (r = 0.726, p < 0.01, NW and r = 0.870, p < 0.01, OW). VO2peak showed very strong correlations with both BM (r = 0.820, p < 0.01, NW and r = 0.819, p < 0.01, OW) and FFM (r = 0.885, p < 0.01 for both groups). A significant difference in the slope of the VO2peak vs. BM relationship was found between NW and OW adolescents (p = 0.03).

4. Discussion

The purpose of this study was to evaluate the impact of normalizing VO2 by FFM versus BM on the assessment of CRF in OW and NW adolescents. When VO2AerT, VO2AnT, and VO2peak were normalized to BM, OW adolescents exhibited significantly lower values compared to their NW counterparts. However, these differences were no longer evident when VO2 parameters were expressed relative to FFM. These findings align with the group differences in anthropometric characteristics reported in Table 1. OW adolescents had significantly greater BM, BMI, FM, and FM%, and lower FFM% than NW peers, while absolute FFM did not differ. This indicates that excess fat mass, rather than reduced lean tissue, explains the lower BM-normalized VO2 in OW adolescents. In contrast, comparable FFM across groups supports the use of FFM-based normalization, which reflects metabolically active tissue and provides a fairer assessment of aerobic capacity.
Our results are consistent with previous studies showing that normalizing VO2 to BM underestimates aerobic capacity in individuals with excess adiposity, due to the inclusion of metabolically inactive FM [10,15,20,21]. Our results also support the work of Ekelund et al. (2004), who reported that VO2peak normalized to FFM is a more accurate indicator of CRF in obese adolescents [22]. However, the literature is less consistent regarding submaximal VO2. In contrast to Ekelund et al. (2004), we observed significant group differences in submaximal VO2 (both VO2AerT, VO2AnT) expressed relative to body mass [22]. This discrepancy may stem from methodological differences; for example, they tested obese adolescents using treadmill protocols, where excess fat mass can elevate the metabolic cost of weight-bearing exercise. Indeed, higher fat mass increases energy expenditure during locomotion without contributing to oxygen delivery or utilization, leading to deceptively high BM-relative VO2 values in obese individuals [6,23]. Previous research indicates that the muscles of overweight/obese children and adolescents often show impaired oxidative capacity, including reduced type I fiber area, slower VO2 kinetics, diminished mitochondrial efficiency, and microvascular dysfunction [24]. These alterations may manifest as reduced VO2 even when normalized to FFM. In contrast, our findings showed no such differences, as VO2 normalized to FFM was similar between NW and OW adolescents. Given the negative association between type I fiber proportion and BMI, we speculate that the absence of group differences may be explained by the fact that our participants were overweight but not obese [25]. Thus, the OW group may not yet have developed the muscle fiber and mitochondrial alterations typically reported in obesity.
Regression analyses revealed moderate to very strong correlations between VO2peak and both BM and FFM, with slightly stronger associations observed when VO2peak was expressed relative to FFM. Although correlations were consistently high across all conditions, the slopes of VO2peak versus BM differed significantly between NW and OW adolescents, whereas no such differences were observed for VO2peak versus FFM (Figure 2). These findings suggest that normalizing VO2peak to BM in OW adolescents may lead to inaccurate interpretations of CRF, while FFM normalization provides a more consistent and physiologically meaningful assessment across weight categories. These findings suggest that BM is a confounding variable in CRF assessments, as it includes metabolically inactive FM, which disproportionately affects overweight individuals [26]. Using FFM as a normalization factor provides information about the CRF of the working muscles, removing biases introduced by variations in adiposity.
These findings carry important implications for both clinical practice and public health. Accurate assessment of CRF in OW adolescents is crucial for identifying those at increased risk for obesity-related cardiometabolic conditions. Relying solely on BM-based normalization may underestimate fitness in OW individuals, potentially leading to misclassification and inappropriate or insufficient interventions. Normalizing VO2 by FFM provides a more physiologically meaningful evaluation of aerobic capacity, enabling healthcare professionals to tailor exercise prescriptions more effectively [12,27].
Our findings indicate that normalization to FFM reduces intergroup differences in VO2, including values obtained at the VO2AerT and VO2AnT. This observation underscores the utility of submaximal indicators of CRF, particularly in OW adolescents who may be unable to achieve valid maximal exertion during graded exercise testing [13,21]. Moreover, the use of individualized ventilatory thresholds, rather than fixed percentages of VO2peak, provides a physiologically grounded assessment of fitness at true metabolic transition points and minimizes the risk of misestimating submaximal CRF. Given that FFM is the primary determinant of oxygen consumption during exercise, FFM-based normalization serves as a valuable moderator not only of CRF but also of cardiovascular risk [11,22]. CRF normalized to FFM has shown stronger associations with metabolic health outcomes than BM-based measures [7,28].
These findings contribute to the understanding of the “fat-but-fit” paradigm, wherein OW individuals with high CRF exhibit cardiometabolic profiles comparable to or better than normal weight but sedentary individuals [5,29,30]. Active, insulin-sensitive muscle mass appears to buffer the metabolic effects of adiposity, enhancing glucose control, lipid profiles, and vascular function [31]. Recognizing and quantifying this distinction is critical for reducing stigma and ensuring appropriate care pathways for OW youth with high fitness levels.
Psychologically, FFM-based normalization can serve as an important motivational tool for adolescents and their families as it reflects the performance of metabolically active tissue, offering a more accurate measure of aerobic capacity. In contrast, BM-normalized VO2 often underestimates fitness in OW adolescents due to the influence of non-functional fat mass. This can lead to misclassification and reinforce negative perceptions about their physical abilities. FFM-based normalization may also support healthier self-perception in OW youth. BM-relative VO2 values can stigmatize adolescents by labeling them as unfit, regardless of true physiological capacity. FFM-normalized CRF offers a fairer comparison with NW peers, emphasizing function over size and encouraging a more empowering narrative around physical activity [32,33]. This approach can highlight the child’s aerobic potential, rather than framing health solely in terms of weight loss. As youth grow and reduce fat mass, BM-normalized CRF will improve, but FFM-relative VO2 provides a stable, developmentally appropriate measure of aerobic function. Long-term engagement may be further supported by combining exercise programs that promote aerobic capacity with nutritional strategies that foster healthy weight management. This new approach emphasizes the importance of physical activity and exercise in adolescents regardless of their body weight and may help promote active lifestyles throughout life.
This study has certain limitations that should be considered. The relatively small sample size (n = 38) and the absence of observed sex differences limit the generalizability of our findings. Moreover, because the OW group included adolescents classified as overweight but not obese, the conclusions may not fully extend to youth with obesity or to those with chronic medical conditions. The recruitment of participants from a single geographic region may also restrict the applicability of these results. Future studies should include larger and more diverse cohorts to better assess potential sex- and ethnicity-based differences in CRF normalization methods. Furthermore, factors such as training status, habitual physical activity, and dietary intake were not controlled, which may have influenced CRF measures. Similarly, participants’ diet, hydration status, and activity in the hours prior to testing were not recorded and relied on their adherence to our recommendations. Future research should consider these variables to refine the assessment of aerobic fitness in adolescent populations. Lastly, pubertal status was estimated rather than directly assessed, which could have impacted body composition and metabolic variables.

5. Conclusions

This study demonstrates that normalizing CRF indices by FFM rather than BM provides a more accurate representation of aerobic capacity in adolescents. The strong correlations between VO2 parameters and FFM underscore the role of lean tissue in determining CRF, reinforcing the necessity of FFM-based normalization for evaluating fitness across weight categories. Additionally, distinguishing between aerobic capacity and aerobic fitness through FFM-based normalization offers a more equitable assessment of fitness potential, reducing the discouragement associated with weight-based evaluations. FFM-based normalization can attenuate intergroup differences not only at peak effort but also at AerT and AnT, thereby enhancing the validity of submaximal CRF assessments in overweight adolescents who may be unable to achieve true maximal exertion during graded exercise testing. This approach has important implications for public health, as it can help adolescents and families adopt a more positive outlook on physical activity and weight management, ultimately fostering long-term engagement in health-promoting behaviors.

Supplementary Materials

The following supporting information can be downloaded at: https://www.mdpi.com/article/10.3390/adolescents5030048/s1, Table S1: Anthropometric and Fitness Measurement Data in Adolescents.

Author Contributions

Conceptualization, S.O., A.C., K.N., G.R., M.M. and V.B.; methodology, S.O., A.C., K.N., G.R., M.M. and V.B.; software, M.M. and V.B.; validation, M.M. and V.B.; formal analysis, M.M. and V.B.; investigation, M.M.; resources, M.M.; data curation, S.O., A.C., K.N. and G.R.; writing—original draft preparation, S.O., A.C., K.N. and G.R.; writing—review and editing, S.O., A.C., K.N., G.R. and V.B.; visualization, M.M. and V.B.; supervision, V.B.; project administration, S.O. and V.B. All authors have read and agreed to the published version of the manuscript.

Funding

This research received no external funding.

Institutional Review Board Statement

The study was conducted in accordance with the Declaration of Helsinki and approved by the Institutional Review Board of APPALACHIAN STATE UNIVERSITY (protocol code 18-0147, approved on 10 September 2018).

Informed Consent Statement

Informed consent was obtained from all subjects involved in the study. Written informed consent has been obtained from the participants’ parents and from the participants to publish this paper.

Data Availability Statement

The original contributions presented in the study are included in the Supplementary Materials, further inquiries can be directed to the corresponding author.

Acknowledgments

We wish to thank Adrienne Finkel for all the support during the study period for this article. Also, special thanks to all the participants and the parents for their cooperation and willingness to aid in our objective.

Conflicts of Interest

The authors declare no conflicts of interest.

Abbreviations

VO2Oxygen Consumption
VO2AerTVO2 at the aerobic threshold
VO2AnTVO2 at the anaerobic threshold
VO2peakVO2 at peak exercise
CRFCardiorespiratory Fitness
BMBody Mass
FMFat Mass
FFMFat-Free Mass
BMIBody Mass Index
BF%Body Fat Percentage
HRHeart Rate
NWNormal Weight
OWOverweight
ANCOVAAnalysis of Covariance

References

  1. Ogden, C.L.; Carroll, M.D.; Lawman, H.G.; Fryar, C.D.; Kruszon-Moran, D.; Kit, B.K.; Flegal, K.M. Trends in Obesity Prevalence Among Children and Adolescents in the United States, 1988–1994 Through 2013–2014. JAMA 2016, 315, 2292–2299. [Google Scholar] [CrossRef]
  2. Daniels, S.R.; Arnett, D.K.; Eckel, R.H.; Gidding, S.S.; Hayman, L.L.; Kumanyika, S.; Robinson, T.N.; Scott, B.J.; St Jeor, S.; Williams, C.L. Overweight in Children and Adolescents: Pathophysiology, Consequences, Prevention, and Treatment. Circulation 2005, 111, 1999–2012. [Google Scholar] [CrossRef]
  3. Poirier, P.; Giles, T.D.; Bray, G.A.; Hong, Y.; Stern, J.S.; Pi-Sunyer, F.X.; Eckel, R.H.; American Heart Association; Obesity Committee of the Council on Nutrition, Physical Activity, and Metabolism. Obesity and Cardiovascular Disease: Pathophysiology, Evaluation, and Effect of Weight Loss: An Update of the 1997 American Heart Association Scientific Statement on Obesity and Heart Disease from the Obesity Committee of the Council on Nutrition, Physical Activity, and Metabolism. Circulation 2006, 113, 898–918. [Google Scholar] [CrossRef]
  4. Lister, N.B.; Baur, L.A.; Felix, J.F.; Hill, A.J.; Marcus, C.; Reinehr, T.; Summerbell, C.; Wabitsch, M. Child and adolescent obesity. Nat. Rev. Dis. Primers 2023, 9, 24. [Google Scholar] [CrossRef]
  5. Kim, H.; Collier, S.R.; Bonavolontà, V.; Lassiter, A.; Wait, S.; Meucci, M. Cardiorespiratory Fitness Is an Indicator of Arterial Stiffness and Aortic Blood Pressure in Healthy Adolescents. Children 2024, 11, 1078. [Google Scholar] [CrossRef]
  6. Mondal, H. Effect of BMI, Body Fat Percentage and Fat Free Mass on Maximal Oxygen Consumption in Healthy Young Adults. J. Clin. Diagn. Res. 2017, 11, CC17–CC20. [Google Scholar] [CrossRef] [PubMed]
  7. Ortega, F.B.; Lavie, C.J.; Blair, S.N. Obesity and Cardiovascular Disease. Circ. Res. 2016, 118, 1752–1770. [Google Scholar] [CrossRef] [PubMed]
  8. Gaesser, G.A.; Angadi, S.S. Obesity treatment: Weight loss versus increasing fitness and physical activity for reducing health risks. iScience 2021, 24, 102995. [Google Scholar] [CrossRef] [PubMed]
  9. Blanchard, J.; Blais, S.; Chetaille, P.; Bisson, M.; Counil, F.P.; Huard-Girard, T.; Berbari, J.; Boulay, P.; Dallaire, F. New Reference Values for Cardiopulmonary Exercise Testing in Children. Med. Sci. Sports Exerc. 2018, 50, 1125–1133. [Google Scholar] [CrossRef]
  10. Bhammar, D.M.; Adams-Huet, B.; Babb, T.G. Quantification of Cardiorespiratory Fitness in Children with Obesity. Med. Sci. Sports Exerc. 2019, 51, 2243–2250. [Google Scholar] [CrossRef]
  11. Imboden, M.T.; Kaminsky, L.A.; Peterman, J.E.; Hutzler, H.L.; Whaley, M.H.; Fleenor, B.S.; Harber, M.P. Cardiorespiratory Fitness Normalized to Fat-Free Mass and Mortality Risk. Med. Sci. Sports Exerc. 2020, 52, 1532–1537. [Google Scholar] [CrossRef] [PubMed]
  12. Gabriel, B.M.; Zierath, J.R. The Limits of Exercise Physiology: From Performance to Health. Cell Metab. 2017, 25, 1000–1011. [Google Scholar] [CrossRef]
  13. Bongers, B.C.; Hulzebos, E.H.; Helbing, W.A.; Harkel, A.D.; Van Brussel, M.; Takken, T. Response profiles of oxygen uptake efficiency during exercise in healthy children. Eur. J. Prev. Cardiol. 2016, 23, 865–873. [Google Scholar] [CrossRef] [PubMed]
  14. American College of Sports Medicine; Riebe, D.; Ehrman, J.K.; Liguori, G.; Magal, M. (Eds.) ACSM’s Guidelines for Exercise Testing and Prescription, 10th ed.; Wolters Kluwer: Philadelphia, PA, USA, 2018; 472p. [Google Scholar]
  15. Meyer, T.; Lucía, A.; Earnest, C.P.; Kindermann, W. A Conceptual Framework for Performance Diagnosis and Training Prescription from Submaximal Gas Exchange Parameters—Theory and Application. Int. J. Sports Med. 2005, 26, S38–S48. [Google Scholar] [CrossRef] [PubMed]
  16. Hampl, S.E.; Hassink, S.G.; Skinner, A.C.; Armstrong, S.C.; Barlow, S.E.; Bolling, C.F.; Avila Edwards, K.C.; Eneli, I.; Hamre, R.; Joseph, M.M. Clinical Practice Guideline for the Evaluation and Treatment of Children and Adolescents With Obesity. Pediatrics 2023, 151, e2022060640. [Google Scholar] [CrossRef]
  17. Fields, D.A.; Goran, M.I.; McCrory, M.A. Body-composition assessment via air-displacement plethysmography in adults and children: A review. Am. J. Clin. Nutr. 2002, 75, 453–467. [Google Scholar] [CrossRef]
  18. Tseh, W.; Caputo, J.L.; Keefer, D.J. Validity and Reliability of the BOD POD® S/T Tracking System. Int. J. Sports Med. 2010, 31, 704–708. [Google Scholar] [CrossRef]
  19. Guidetti, L.; Meucci, M.; Bolletta, F.; Emerenziani, G.P.; Gallotta, M.C.; Baldari, C. Validity, reliability and minimum detectable change of COSMED K5 portable gas exchange system in breath-by-breath mode. PLoS ONE 2018, 13, e0209925. [Google Scholar] [CrossRef]
  20. Sharma, V.K.; Subramanian, S.K.; Arunachalam, V. Evaluation of body composition and its association with cardio respiratory fitness in south Indian adolescents. Indian J. Physiol. Pharmacol. 2013, 57, 399–405. [Google Scholar]
  21. Cooper, D.M.; Leu, S.-Y.; Taylor-Lucas, C.; Lu, K.; Galassetti, P.; Radom-Aizik, S. Cardiopulmonary Exercise Testing in Children and Adolescents with High Body Mass Index. Pediatr. Exerc. Sci. 2016, 28, 98–108. [Google Scholar] [CrossRef]
  22. Ekelund, U.; Franks, P.W.; Wareham, N.J.; Åman, J. Oxygen Uptakes Adjusted for Body Composition in Normal-Weight and Obese Adolescents. Obes. Res. 2004, 12, 513–520. [Google Scholar] [CrossRef]
  23. Maciejczyk, M.; Więcek, M.; Szymura, J.; Szyguła, Z.; Wiecha, S.; Cempla, J. The Influence of Increased Body Fat or Lean Body Mass on Aerobic Performance. PLoS ONE 2014, 9, e95797. [Google Scholar] [CrossRef]
  24. Inostroza-Mondaca, M.; Valdes, O.; Ramírez-Campillo, R.; Granacher, U. Muscle Strength, Muscle Morphology, and Oxidative Capacity in Normal Weight Versus Overweight and Obese Youth: A Systematic Review with Meta-Analysis. Research Square. 4 June 2025. Available online: https://www.researchsquare.com/article/rs-6497659/v1 (accessed on 15 May 2025).
  25. Damer, A.; El Meniawy, S.; McPherson, R.; Wells, G.; Harper, M.E.; Dent, R. Association of muscle fiber type with measures of obesity: A systematic review. Obes. Rev. 2022, 23, e13444. [Google Scholar] [CrossRef] [PubMed]
  26. Marques-Vidal, P.; Marcelino, G.; Ravasco, P.; Oliveira, J.M.; Paccaud, F. Increased body fat is independently and negatively related with cardiorespiratory fitness levels in children and adolescents with normal weight. Eur. J. Cardiovasc. Prev. Rehabil. 2010, 17, 649–654. [Google Scholar] [CrossRef]
  27. Norman, A.C.; Drinkard, B.; McDuffie, J.R.; Ghorbani, S.; Yanoff, L.B.; Yanovski, J.A. Influence of Excess Adiposity on Exercise Fitness and Performance in Overweight Children and Adolescents. Pediatrics 2005, 115, e690–e696. [Google Scholar] [CrossRef] [PubMed]
  28. Lee, D.C.; Sui, X.; Artero, E.G.; Lee, I.M.; Church, T.S.; McAuley, P.A.; Stanford, F.C.; Kohl, H.W., 3rd; Blair, S.N. Long-Term Effects of Changes in Cardiorespiratory Fitness and Body Mass Index on All-Cause and Cardiovascular Disease Mortality in Men: The Aerobics Center Longitudinal Study. Circulation 2011, 124, 2483–2490. [Google Scholar] [CrossRef] [PubMed]
  29. Barry, V.W.; Baruth, M.; Beets, M.W.; Durstine, J.L.; Liu, J.; Blair, S.N. Fitness vs. Fatness on All-Cause Mortality: A Meta-Analysis. Prog. Cardiovasc. Dis. 2014, 56, 382–390. [Google Scholar] [CrossRef]
  30. Blair, S.N.; Kampert, J.B.; Kohl, H.W.; Barlow, C.E.; Macera, C.A.; Paffenbarger, R.S.; Gibbons, L.W. Influences of cardiorespiratory fitness and other precursors on cardiovascular disease and all-cause mortality in men and women. JAMA 1996, 276, 205–210. [Google Scholar] [CrossRef]
  31. Lavie, C.J.; De Schutter, A.; Milani, R.V. Healthy obese versus unhealthy lean: The obesity paradox. Nat. Rev. Endocrinol. 2015, 11, 55–62. [Google Scholar] [CrossRef]
  32. Lubans, D.; Richards, J.; Hillman, C.; Faulkner, G.; Beauchamp, M.; Nilsson, M.; Kelly, P.; Smith, J.; Raine, L.; Biddle, S. Physical Activity for Cognitive and Mental Health in Youth: A Systematic Review of Mechanisms. Pediatrics 2016, 138, e20161642. [Google Scholar] [CrossRef]
  33. Biddle, S.J.H.; Asare, M. Physical activity and mental health in children and adolescents: A review of reviews. Br. J. Sports Med. 2011, 45, 886–895. [Google Scholar] [CrossRef]
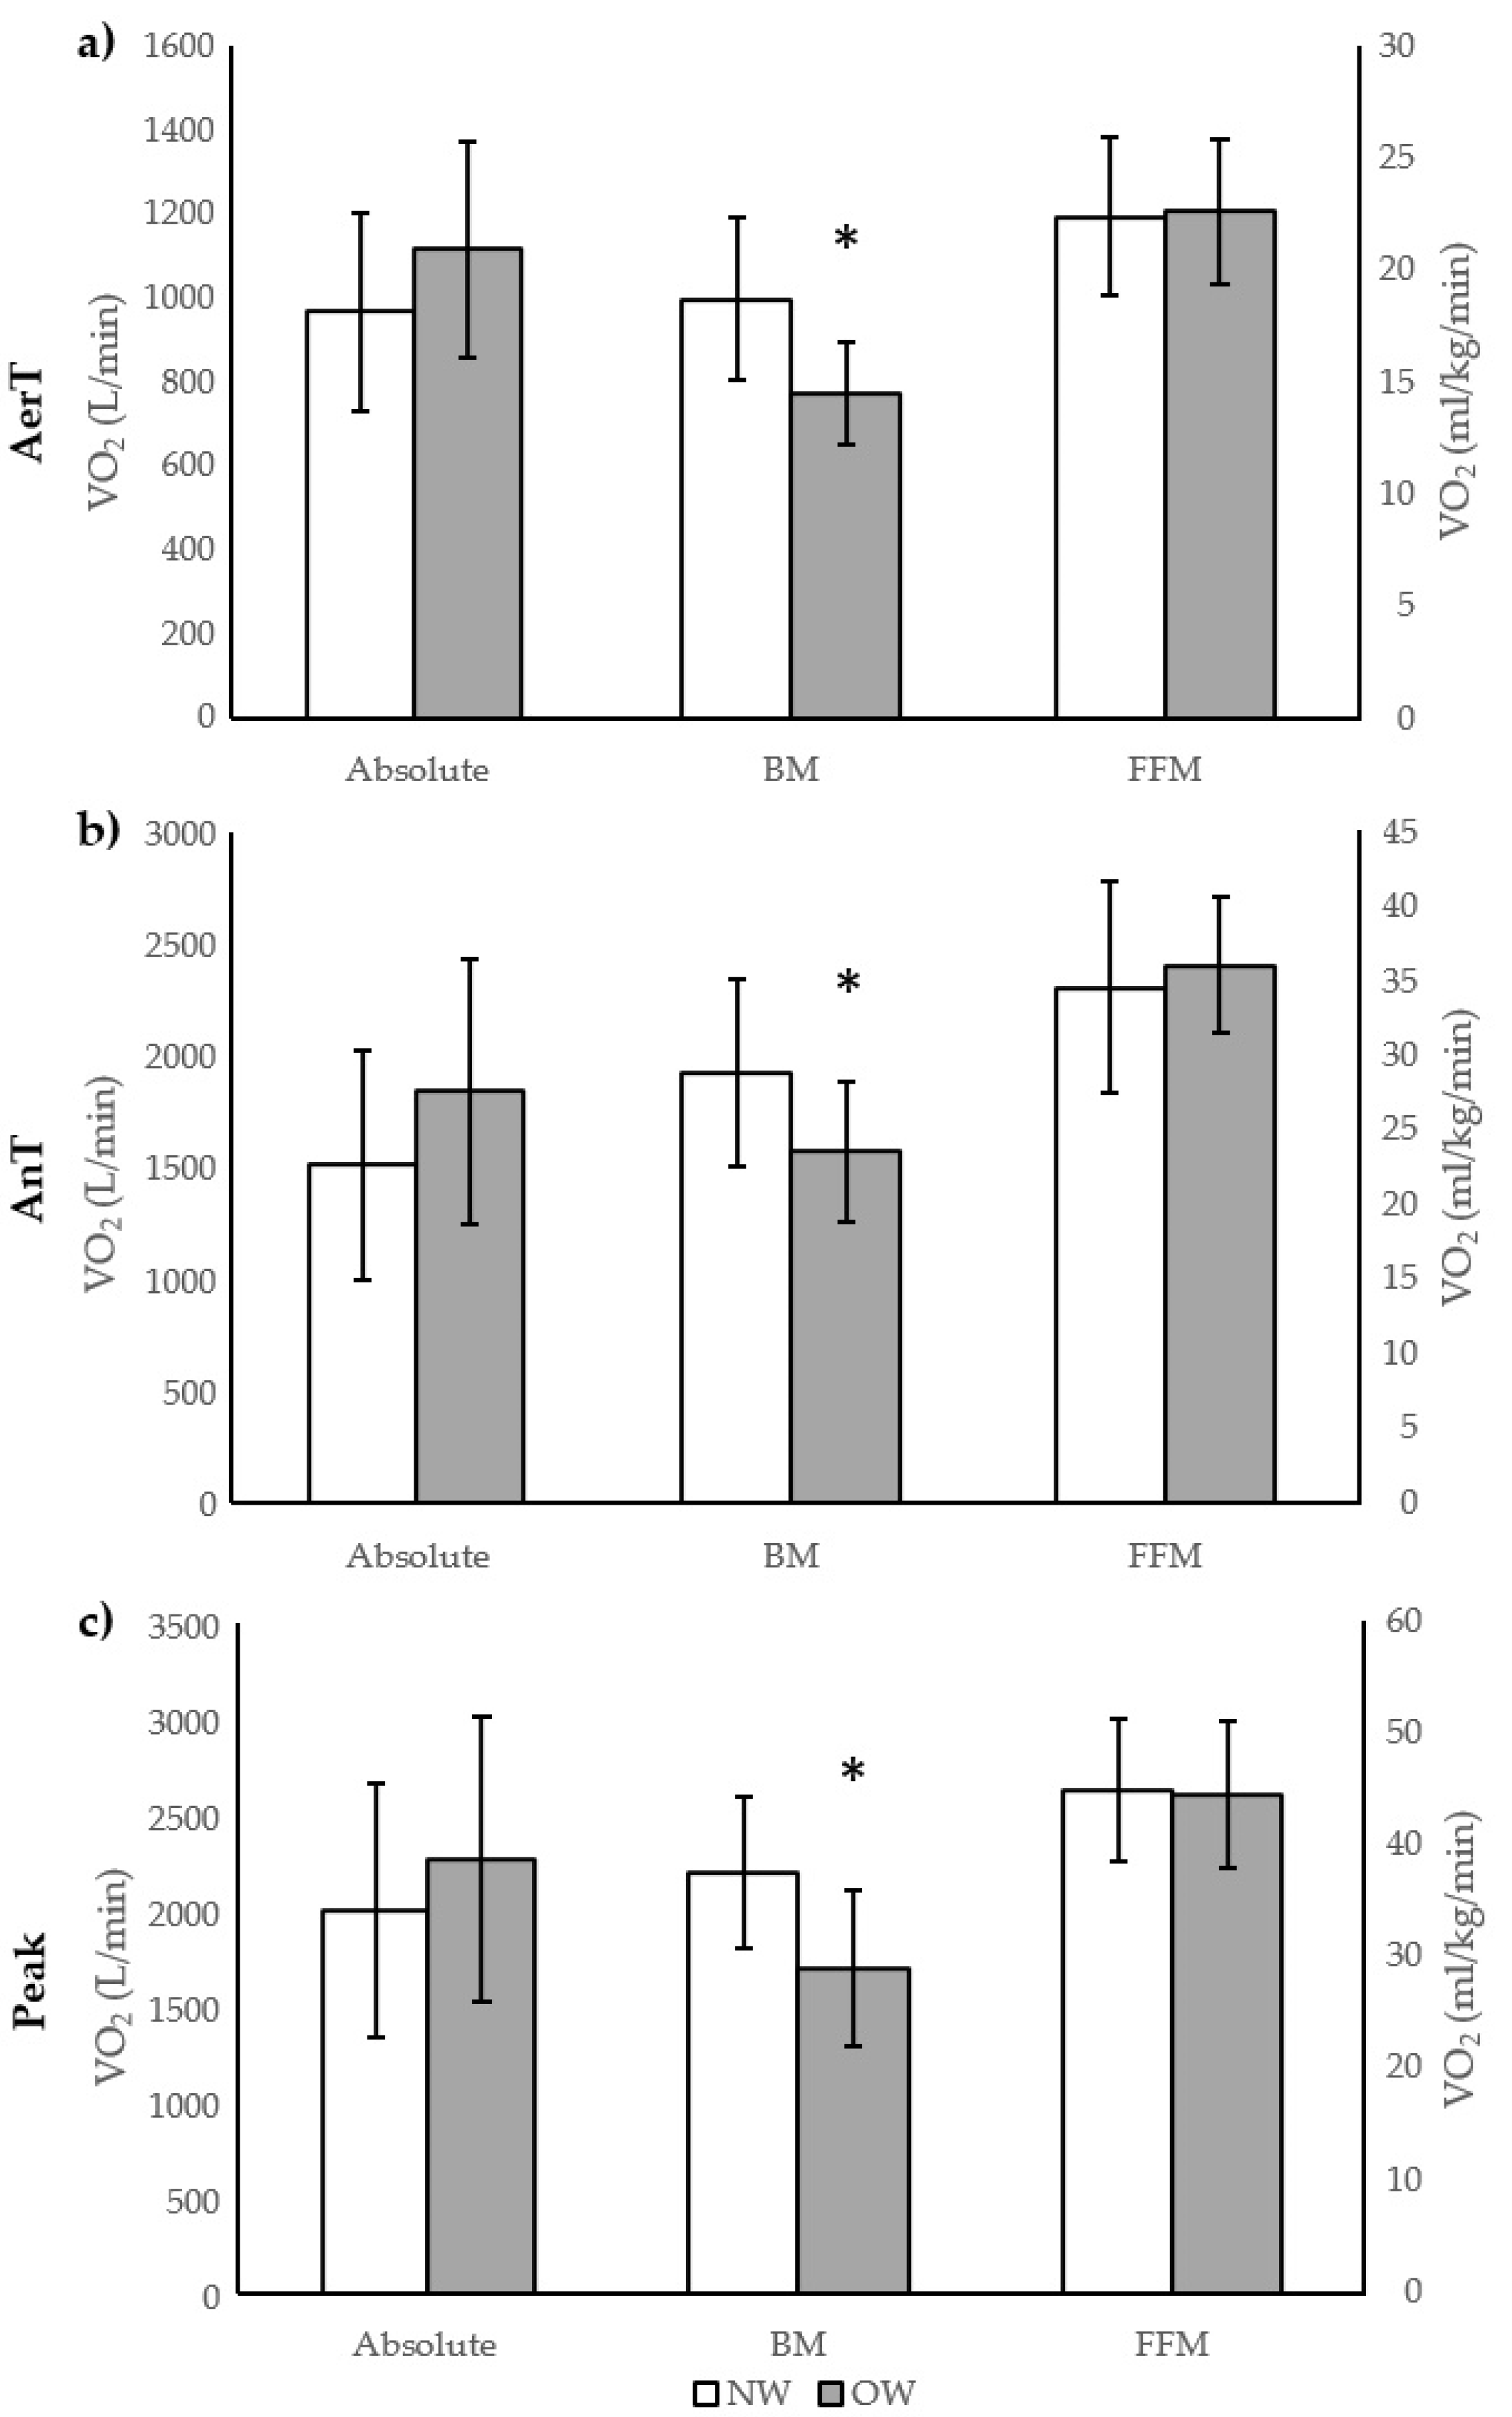
Figure 1. Oxygen consumption in absolute values and normalized by body mass and fat-free mass at the aerobic threshold (AerT) (a), anaerobic threshold (AnT) (b), and peak effort (c) in normal weight and overweight individuals. VO2, oxygen consumption; BM, body mass; FFM, fat-free mass; NW, normal weight; OW, overweight. * p < 0.01 compared to NW.
Adolescents 05 00048 g001
Figure 2. Associations between body mass and oxygen consumption (VO2) at the aerobic threshold (a), anaerobic threshold (c), and peak effort (e), and between fat-free mass and VO2 at the aerobic threshold (b), anaerobic threshold (d), and peak effort (f) in normal weight and overweight adolescents. AerT, aerobic threshold; AnT, anaerobic threshold; Peak, peak effort; BM, body mass; FFM, fat-free mass; NW, normal weight; OW, overweight.
Adolescents 05 00048 g002
Table 1. Anthropometric Characteristics of Normal Weight vs. Overweight Adolescents.
VariablesNWOW
Age (years)14.5 ± 2.314.0 ± 2.3
Height (cm)164.8 ± 13.5166.0 ± 11.7
Weight (kg)52.8 ± 13.179.2 ± 24.1 **
BMI19.1 ± 2.928.2 ± 5.7 **
FM (kg)8.6 ± 4.828.6 ± 14.2 **
FFM (kg)44.2 ± 12.150.7 ± 14.2
FM%16.4 ± 7.935.3 ± 10.3 **
FFM%83.6 ± 7.964.7 ± 10.3 **
RERpeak1.20 ± 0.121.16 ± 0.09
PWRpeak (Watt)164 ± 51178 ± 49
BMI, body mass index; FM, fat mass; FFM, fat-free mass; FM%, percentage of FM; FFM%, percentage of FFM; RERpeak, peak respiratory exchange ratio; PWRpeak, peak power; NW, normal weight; OW, overweight. ** p < 0.01 compared to NW.
Table 2. Oxygen Consumption Parameters in Normal Weight and Overweight Adolescents.
VariablesNWOWCohen’s d
VO2AerT (mL/min)968 ± 2381117 ± 258−0.60
VO2AerTFFM (mL/kg/min)22.4 ± 3.522.6 ± 3.2−0.07
VO2AerTBM (mL/kg/min)18.7 ± 3.614.5 ± 2.3 **1.39
VO2AnT (mL/min)1514 ± 5101842.4 ± 593−0.59
VO2AnTFFM (mL/kg/min)34.6 ± 7.136.1 ± 4.6−0.25
VO2AnTBM (mL/kg/min)28.8 ± 6.323.6 ± 4.7 **0.94
VO2peak (mL/min)2003 ± 6612266 ± 746−0.37
VO2peakFFM (mL/kg/min)45.1 ± 6.444.7 ± 6.60.06
VO2peakBM (mL/kg/min)37.7 ± 6.729.1 ± 7.0 **1.25
VO2AerT, oxygen consumption at the aerobic threshold; VO2AerTFFM, VO2AerT normalized by fat-free mass; VO2AerTBM, VO2AerT normalized by body mass; VO2AnT, oxygen consumption at the anaerobic threshold; VO2AnTFFM, VO2AnT normalized by fat-free mass; VO2AnTBM, VO2AnT normalized by body mass; VO2peak, peak oxygen consumption; VO2peakFFM, VO2peak normalized by fat-free mass; VO2peakBM, VO2peak normalized by body mass; NW, normal weight; OW, overweight. ** p < 0.01. Significance between NW and OW adolescents.
Disclaimer/Publisher’s Note: The statements, opinions and data contained in all publications are solely those of the individual author(s) and contributor(s) and not of MDPI and/or the editor(s). MDPI and/or the editor(s) disclaim responsibility for any injury to people or property resulting from any ideas, methods, instructions or products referred to in the content.