1. Introduction
Burnout syndrome in students is a widespread problem characterized by emotional, physical, and behavioral exhaustion derived from prolonged academic stress [
1]. Even though this phenomenon is occurring in school stages, it remains understudied in children and adolescents. Regarding mental health in children and adolescents, burnout syndrome can increase the risk of anxiety, depression, low self-esteem, feelings of hopelessness, and even suicidal ideation [
2].
This phenomenon is becoming increasingly relevant in public policies across different countries [
3], especially in Chile through the National Mental Health Plan [
4] and the 2024 Educational Reactivation Plan [
5]. Nevertheless, the mental health of children and adolescents is in crisis in the country, as reflected in recent publications that have reported high levels of anxiety, depression, and stress in the Chilean school population [
6].
Recent research has shown that following the COVID-19 pandemic period, greater difficulties emerged in mental health aspects related to depression, anxiety, emotional exhaustion, and other issues in children and adolescents [
7,
8]. In line with this, a study conducted with preschool and school children in Chile concluded that 20.6% of participants increased or developed psychiatric symptoms during the pandemic [
9].
In academia, emotional exhaustion may be triggered by factors like academic performance pressure, high parental and teacher expectations, workload overload, and the lack of rest or leisure time [
2,
10]. The chronic symptoms of emotional exhaustion are stress, which would lead to adverse effects on academic performance, attentional and concentration processes, lower problem-solving efficiency, and the risk of school dropout [
11].
However, of the factors of burnout, emotional exhaustion is becoming the most pertinent factor, as research indicates that higher levels of emotional exhaustion increase the chances of experiencing other areas of burnout [
12,
13]. This can lead to mental health problems [
14].
The component of emotional exhaustion is a state of fatigue and wear associated with psychological components caused by chronic stress [
15]. This leads to the sufferer feeling that they have exhausted all resources to cope with environmental demands [
16]. It is characterized by a persistent feeling of tiredness [
17], lack of energy [
18], difficulties in regulating emotions [
19], and a significant decrease in the ability to respond to contextual demands [
20].
Mental health must be a priority in all contexts, and it is essential to work together to ensure the wellbeing of young people [
21]. For this reason, an instrument with good psychometric indicators is required to measure the essence of the phenomenon and its repercussions in the lives of children and adolescents.
Emotional exhaustion has been measured with several scales, the Maslach Burnout Inventory (MBI) being the most widespread, with the following three main dimensions: emotional exhaustion, depersonalization, and self-realization [
22,
23]. The emotional exhaustion subscale (nine items, Likert format) has been adapted across contexts, including adaptions for students [
23,
24] and employees [
24]. The Spanish Burnout Inventory (SBI) measures burnout in four dimensions, specifically emphasizing psychological wear, which includes factors of emotional and physical fatigue, and is applicable in labor research [
25]. The Copenhagen Burnout Inventory (CBI) accurately measures work-related fatigue and exhaustion, enabling the pinpointing of intervention areas [
26]. In contrast, the Emotional Exhaustion Scale (ECE), which was designed for university settings, consists of ten Likert-type items that measure the emotional and physical aspects of academic stress, and has shown good psychometric properties in different populations [
27,
28]. However, none of these scales could be used in the child and adolescent population; thus, there is a need for a properly constructed and validated scale for application in the child and adolescent population.
First developed as the Emotional Exhaustion Scale (ECE) for university students, the scale has proven to be psychometrically sound across different populations. However, no preliminary investigation has been addressed for the use of this tool in the child and adolescent population, nor has any study been conducted to verify the validation of this tool for the Chilean environment. The knowledge gap framework opens up a new field of study on how education and psychology experts can identify and respond to emotional exhaustion in this at-risk population.
Now, it is necessary to test the factorial structure of the scale of emotional exhaustion in children and adolescents in Chile, in addition to assessing the reliability, internal consistency, and convergent validity of this instrument. This study directly contributes to the psychometric assessment of this population, providing an adequate psychometric instrument to quantify emotional exhaustion, and thus promoting the development of intervention and prevention strategies that may favor their emotional and academic wellbeing.
2. Materials and Methods
2.1. Design
An instrumental study design was developed using the cross-sectional survey method [
29] to capture data at one point in time, and thus followed a quantitative approach [
30]. The study followed guidelines for psychometric instrument validation in educational and psychological sciences [
31]. This involved an investigation of the factorial structure, reliability, and validity of the Emotional Exhaustion Scale (ECE) in a sample of Chilean children and adolescents.
2.2. Participants
A total of 543 Chilean children and adolescents, ages 10 to 18 (M = 13.00, SD = 1.77), made up the sample. Men made up 60.2% (n = 327) of the total participants, while women made up 39.8% (n = 216).
The distribution of participants according to their educational level showed that 12.5% (n = 68) were in fifth grade, while 9.8% (n = 53) were in sixth grade. A larger proportion of students were in seventh grade (23.8%, n = 129) and eighth grade (19.9%, n = 108), representing the majority of the sample.
In secondary education, 17.1% (n = 93) were in the first year of high school, 12.2% (n = 66) in the second year, 4.1% (n = 22) in the third year, and 0.7% (n = 4) were in the fourth year of high school.
This distribution reflects a greater representation of students in the final years of primary education (seventh and eighth grades), as well as a lower proportion in the upper levels of secondary education.
Participants were distributed mainly between the ages of 12 and 15, with the groups of 13 years (23%, n = 125) and 14 years (19.5%, n = 106) being the most numerous. The age distribution was as follows: 4.6% (n = 25) were 10 years old, 11% (n = 60) were 11 years old, and 12.5% (n = 68) were 12 years old.
In the ranges with the highest representation, 23% (n = 125) corresponded to 13-year-old students, 19.5% (n = 106) to 14-year-old students, and 16.9% (n = 92) to 15-year-old students. Older ages were less frequent, with 8.3% (n = 45) of participants being 16 years old, 2.9% (n = 16) being 17 years old, and 1.1% (n = 6) being 18 years old.
Overall, the sample encompassed a balanced representation in terms of gender and educational levels, focusing mainly on primary and secondary education students, with a higher proportion in the intermediate age ranges.
2.3. Instruments
The Emotional Exhaustion Scale (ECE) was used [
28]. The ECE consists of items for the psychometric evaluation of levels of emotional exhaustion of university students from an academic context, being derived conceptually from the emotional exhaustion subscale of the Maslach Burnout Inventory (MBI) and from Freudenberger’s [
32] burnout model, the ECE is composed of 10 items addressing emotional and physical dimensions related to academic fatigue. Examples of items are as follows: tests or evaluations generate excessive tension in me; the demands of my studies leave me emotionally drained; there are days when I perceive more fatigue and it costs me to concentrate, etc.
Items are scored on a 5-point Likert-type scale, where 1 represents “almost never” and 5 represents “almost always”. The total score of the scale ranges from 10 to 50 points, and higher scores indicate higher emotional exhaustion. This instrument has shown good psychometric properties in students and populations from different studies, obtaining valid evidence for use in the Chilean university population [
27], and being a relevant tool in assessing how academic demands generate a more significant emotional impact on students.
Convergent and discriminant validity were assessed using the Personal Wellbeing Index (PWI) [
33] and the Trait Meta-Mood Scale (TMMS-24) [
34]. The PWI is a self-report instrument designed to measure subjective wellbeing across several life domains, such as standard of living, health, achievements, relationships, safety, community-connectedness, and future security. Respondents rate their satisfaction in each domain on an 11-point Likert-type scale, ranging from 0 (“Not satisfied at all”) to 10 (“Completely satisfied”). The total PWI score is calculated as the average of the domain scores, with higher values indicating greater perceived wellbeing. Furthermore, this scale is validated for the Chilean population [
35].
The TMMS-24 is a self-report scale that evaluates perceived emotional intelligence through the following three dimensions: Emotional Attention, Emotional Clarity, and Emotional Repair. The instrument consists of 24 items, with 8 items per dimension, rated on a 5-point Likert-type scale from 1 (“Strongly disagree”) to 5 (“Strongly agree”). Higher scores in each dimension reflect a greater perceived ability in that aspect of emotional intelligence. Furthermore, this scale is validated for the Chilean population [
36].
2.4. Procedure
The study was conducted following a structured procedure in four stages, ensuring compliance with ethical principles and participant confidentiality.
An email was sent to a database of schools provided by the Ministry of Education (MINEDUC), inviting educational institutions to participate in the study. The goals and processes of the project were outlined in the email. Interested principals of the school were approached to institutionalize permission. To this end, they were asked for an official certificate allowing the conduct of the study in the respective institutions.
In schools where institutional authorization was obtained, informed consent forms were distributed to the legal guardians of all eligible children and adolescents across the 13 participating schools. Consent forms were sent to parents or guardians both in paper format and via email. Of these, 621 signed consent forms were returned, and only those students whose legal guardians provided written consent were invited to participate in the study. In the schools in which institutional authorization was obtained, informed consent was handed out to legal guardians of the children and adolescents. This document will detail the purpose of the study, procedures, the risks of participation, and confidentiality measures taken.
Before completing the questionnaires, the study was explained to all participating children and adolescents, emphasizing the voluntary nature of their involvement and their right to withdraw at any time. Informed assent was then requested from each student. Only those who provided both parental consent and personal assent were included in the final sample. Students who did not provide informed assent, even if their parents had consented, were excluded from the analysis. The study was explained to the children and adolescents prior to completing the questionnaires, and their informed assent was requested, ensuring that they understood their willingness to participate was entirely voluntary.
For data collection, each participating school was assigned a specific Google Forms link for students to respond online to the questionnaires. Data were collected anonymously and treated confidentially, following international ethical guidelines for research among minors. Similarly, participants were guaranteed anonymity at every stage of the study. In total, 78 questionnaires were excluded because the students did not provide informed assent, despite having parental consent. As a result, the final sample consisted of 543 students who provided both parental consent and personal assent. Completed questionnaires that were not prepared with informed assent were discarded.
2.5. Data Analysis
The evaluation of the psychometric properties of the Emotional Exhaustion Scale (ECE) in a sample of Chilean children and adolescents was carried out in four stages of data analysis.
The first step consisted of computing descriptive statistics for the items of the scale, including indicators of centrality (mean and median), dispersion (standard deviation), and normality (skewness and kurtosis). The correlation matrix among items was also defined to investigate the interprofile relationship of variables and to check the adequacy of the data for factor analyses.
Next, exploratory factor analysis was conducted on a random subsample of participants (n = 216). Furthermore, the Kaiser–Meyer–Olkin (KMO) sampling adequacy index and Bartlett’s test of sphericity were used to assess the adequacy of the data for this analysis. Extraction was performed using Principal Axis Factoring, and an oblique rotation (Oblimin) was applied to permit correlation between factors. The aim of this analysis was to derive the underlying factor structure of the scale and assess the dimensionality of the instrument. Items were retained in each factor if their standardized loading was above 0.40, unless theoretical considerations justified their inclusion.
Next, a confirmatory factor analysis (CFA) was performed on a separate subsample (n = 326) to confirm the factor structure indicated by the EFA. We compared the following two theoretical frameworks: a unidimensional model and a bidimensional model with correlated factors. The evaluation of models was conducted using the Maximum Likelihood method and fit indices of the Comparative Fit Index (CFI), Tucker–Lewis Index (TLI), Root Mean Square Error of Approximation (RMSEA), and Akaike Information Criterion (AIC). These analyses determined which model was a better fit for the structure of the scale.
Measurement invariance across age groups (children vs. adolescents) was assessed using multi-group CFA, evaluating configural, metric, scalar, and strict invariance models. This analysis determined whether the EES-CA operates equivalently across developmental stages, supporting the validity of group comparisons.
Convergent and discriminant validity of the scale were assessed through correlations between the dimensions of the EES-CA and the total scores of the Personal Wellbeing Index (PWI) and the Trait Meta-Mood Scale (TMMS-24). This process aimed to determine the relationship between emotional exhaustion, as measured by the EES-CA, and other relevant psychological constructs, specifically subjective wellbeing and perceived emotional intelligence. Low or non-significant correlations with these instruments would support the discriminant validity of the EES-CA, indicating that emotional exhaustion is a construct distinct from general wellbeing and emotional intelligence.
All analyses were conducted using SPSS 2025 (IBM Corp., Armonk, NY, USA, Released, 2025) and JASP (JASP Team, 2025), and only data from participants who provided both parental consent and personal assent were included in the final analyses.
2.6. Ethical Criteria
This study was approved by the Central Bioethics Committee of Universidad Andrés Bello under registry number 024/2022. It is important to note that no personally identifiable information was collected from participants.
Prior to participation, all individuals provided informed consent, confirming their voluntary involvement in the study. No participants received any form of compensation for their participation.
3. Results
3.1. Descriptive Statistics and Correlations
The descriptive analysis of the 10 items of the Emotional Exhaustion Scale (ECE) (see
Table 1) showed mean values ranging from 2.28 (Item 4) to 3.81 (Item 8), with standard deviations between 1.252 (Item 6) and 1.423 (Item 9). The skewness and kurtosis values for all items fell within acceptable ranges for normality, with skewness values from −0.793 (Item 8) to 0.747 (Item 4) and kurtosis values from −1.340 (Item 9) to −0.654 (Item 5), indicating no severe deviations from normality.
The correlation matrix revealed statistically significant positive correlations among all items (p < 0.01). The correlation coefficients ranged from 0.245 (Items 2 and 3) to 0.597 (Items 9 and 10), suggesting a moderate to strong relationship between the items. Notably, Items 9 and 10 exhibited the highest correlation (r = 0.597), while the lowest significant correlation was observed between Items 2 and 3 (r = 0.245).
These results indicate adequate internal consistency and item interrelatedness, supporting the appropriateness of these items for the exploratory and confirmatory factor analyses.
3.2. Factor Structure
The sample used in the analysis was considered adequate, according to the value of the Kaiser–Meyer–Olkin test, which was 0.912 (p < 0.001). Additionally, Bartlett’s test of sphericity was significant (χ2 = 842.115, df = 45, p < 0.001), confirming that the correlations between items were sufficiently large for factor analysis. An exploratory factorial analysis was performed using the principal axis factoring method with oblimin rotation. Initially, the analysis identified a single factor with an eigenvalue of 4.87, explaining 48.67% of the variance. However, since this percentage was slightly below the acceptable threshold, a second analysis was conducted, forcing the extraction of two factors.
The exploratory factor analysis identified two main components with eigenvalues greater than 1, which together explained 58.49% of the total variance. The first component obtained an eigenvalue of 4.87, explaining 48.67% of the variance, while the second component presented an eigenvalue of 0.98, which added 9.81% of the explained variance (
Table 2).
The remaining components had eigenvalues less than 1, with a marginal contribution to the total variance, as shown in the explained variance table. This result supports the bidimensionality of the scale, with the two main factors capturing most of the underlying structure.
Furthermore, the values after rotation showed that the first component maintained a high proportion of the explained variance (4.28), while the second component showed 3.57, confirming the relevance of the two identified factors for interpreting the data.
The scree plot analysis revealed the presence of two factors with eigenvalues greater than 1, supporting the two-factor structure of the Emotional Exhaustion Scale (
Figure 1). The first factor had an eigenvalue of 4.87, explaining 48.67% of the total variance, while the second factor had an eigenvalue of 0.98, contributing an additional 9.81% to the explained variance. Together, these two factors accounted for 58.49% of the total variance, as observed in the elbow point of the scree plot, where the slope of the curve levels off after the second component. The factors were identified and named as follows: Scholar Stress and Emotional Fatigue, based on the content of the items. These findings provided evidence for a bidimensional structure of the scale, as detailed in
Table 3.
Table 3 presents the rotated component matrix and the factor loadings for each item. As a general rule, items with standardized factor loadings above 0.40 were retained, following established psychometric guidelines [
37,
38]. However, in some cases, items with slightly lower loadings were retained based on their theoretical relevance and contribution to the content validity of the factor, as well as their satisfactory performance in the confirmatory factor analysis. For items with cross-loadings, assignment was based on the highest loading and conceptual alignment with the factor. These criteria are detailed below.
The Maximum Likelihood method was used in the factor extraction phase, identifying two main factors. The first factor, called Scholar Stress (SS), and the second, called Emotional Fatigue (EF), were clarified using a Varimax rotation to facilitate their interpretation. The naming of the factors was based on the content of the items with the highest factor loadings in each component, as well as their coherence with the theoretical literature on emotional exhaustion and burnout in school contexts.
The first factor was named Scholar Stress (SS), as it groups items that refer to situations of pressure, academic overload, and school demands perceived by students. This conceptualization is consistent with previous theoretical models that identify academic stress as a central dimension of school burnout [
25,
39,
40].
The second factor was named Emotional Fatigue (EF), since the items associated with this component reflect feelings of tiredness, emotional exhaustion, and lack of energy to cope with school demands. This dimension aligns with the classic definition of emotional exhaustion proposed in the burnout literature [
25,
41], where emotional fatigue is considered the core of the syndrome.
In summary, the assignment of the factor names is based both on the specific content of the items and on their correspondence with the main theoretical and empirical models of burnout and emotional exhaustion in the school context.
During this process, the initial and extraction communalities for each reagent were observed, which allowed for the determination of the proportion of the variance of each variable explained by the extracted factors. The factor matrix was carefully examined to interpret the loading of each reagent on the identified factors.
Finally, the internal consistency of the scale was assessed by calculating Cronbach’s alpha, obtaining a value of 0.888, indicating high reliability. Additionally, McDonald’s omega was estimated, which turned out to be 0.883, providing an additional measure of reliability and reinforcing the robustness of the developed scale. These results suggest that the scale, with its components of “Emotional Fatigue” and “Emotional Hopelessness”, has a valid and reliable factorial structure, suitable for measurement in the educational context.
3.3. Confirmatory Factor Analysis
Confirmatory factor analysis was performed to evaluate the factorial structure of the Emotional Exhaustion Scale in Children and Adolescents. Two models were compared, which are as follows: the original unifactorial model (Ramos) validated for higher education students (Martinez) and a proposed bifactorial model.
Table 4 presents the fit indices for both models.
The results indicate that the bifactorial model presents a superior fit to the unifactorial model. The chi-square statistic was significantly lower for the bifactorial model (χ2 = 91.74, df = 34) compared to the unifactorial model (χ2 = 133.20, df = 35). The chi-square/degrees of freedom ratio (χ2/df) for the bifactorial model was 2.70, falling within the acceptable range (<3), while the unifactorial model exceeded this threshold (χ2/df = 3.81).
The incremental fit indices showed favorable values for the bifactorial model. The Comparative Fit Index (CFI = 0.96) reached the recommended threshold (>0.95), while the unifactorial model presented a slightly lower value (CFI = 0.93). Similarly, the Tucker–Lewis Index (TLI = 0.95) and the Non-Normed Fit Index (NNFI = 0.95) were superior in the bifactorial model compared to the unifactorial model (TLI = 0.91; NNFI = 0.91). The Normed Fit Index (NFI) also favored the bifactorial model (NFI = 0.94) over the unifactorial model (NFI = 0.91).
Regarding absolute fit indices, the Root Mean Square Error of Approximation (RMSEA) for the bifactorial model was 0.07 (90% CI [0.06, 0.09]), meeting the recommended criterion (<0.08). In contrast, the unifactorial model presented an RMSEA of 0.09 (90% CI [0.08, 0.11]), exceeding the acceptable threshold. The Standardized Root Mean Square Residual (SRMR) was adequate in both models, although slightly better in the bifactorial model (SRMR = 0.04) than in the unifactorial model (SRMR = 0.05).
The Akaike Information Criterion (AIC) and Bayesian Information Criterion (BIC) also favored the bifactorial model (AIC = 9838.98; BIC = 9956.47) over the unifactorial model (AIC = 9878.44; BIC = 9992.14), indicating better parsimony of the proposed model.
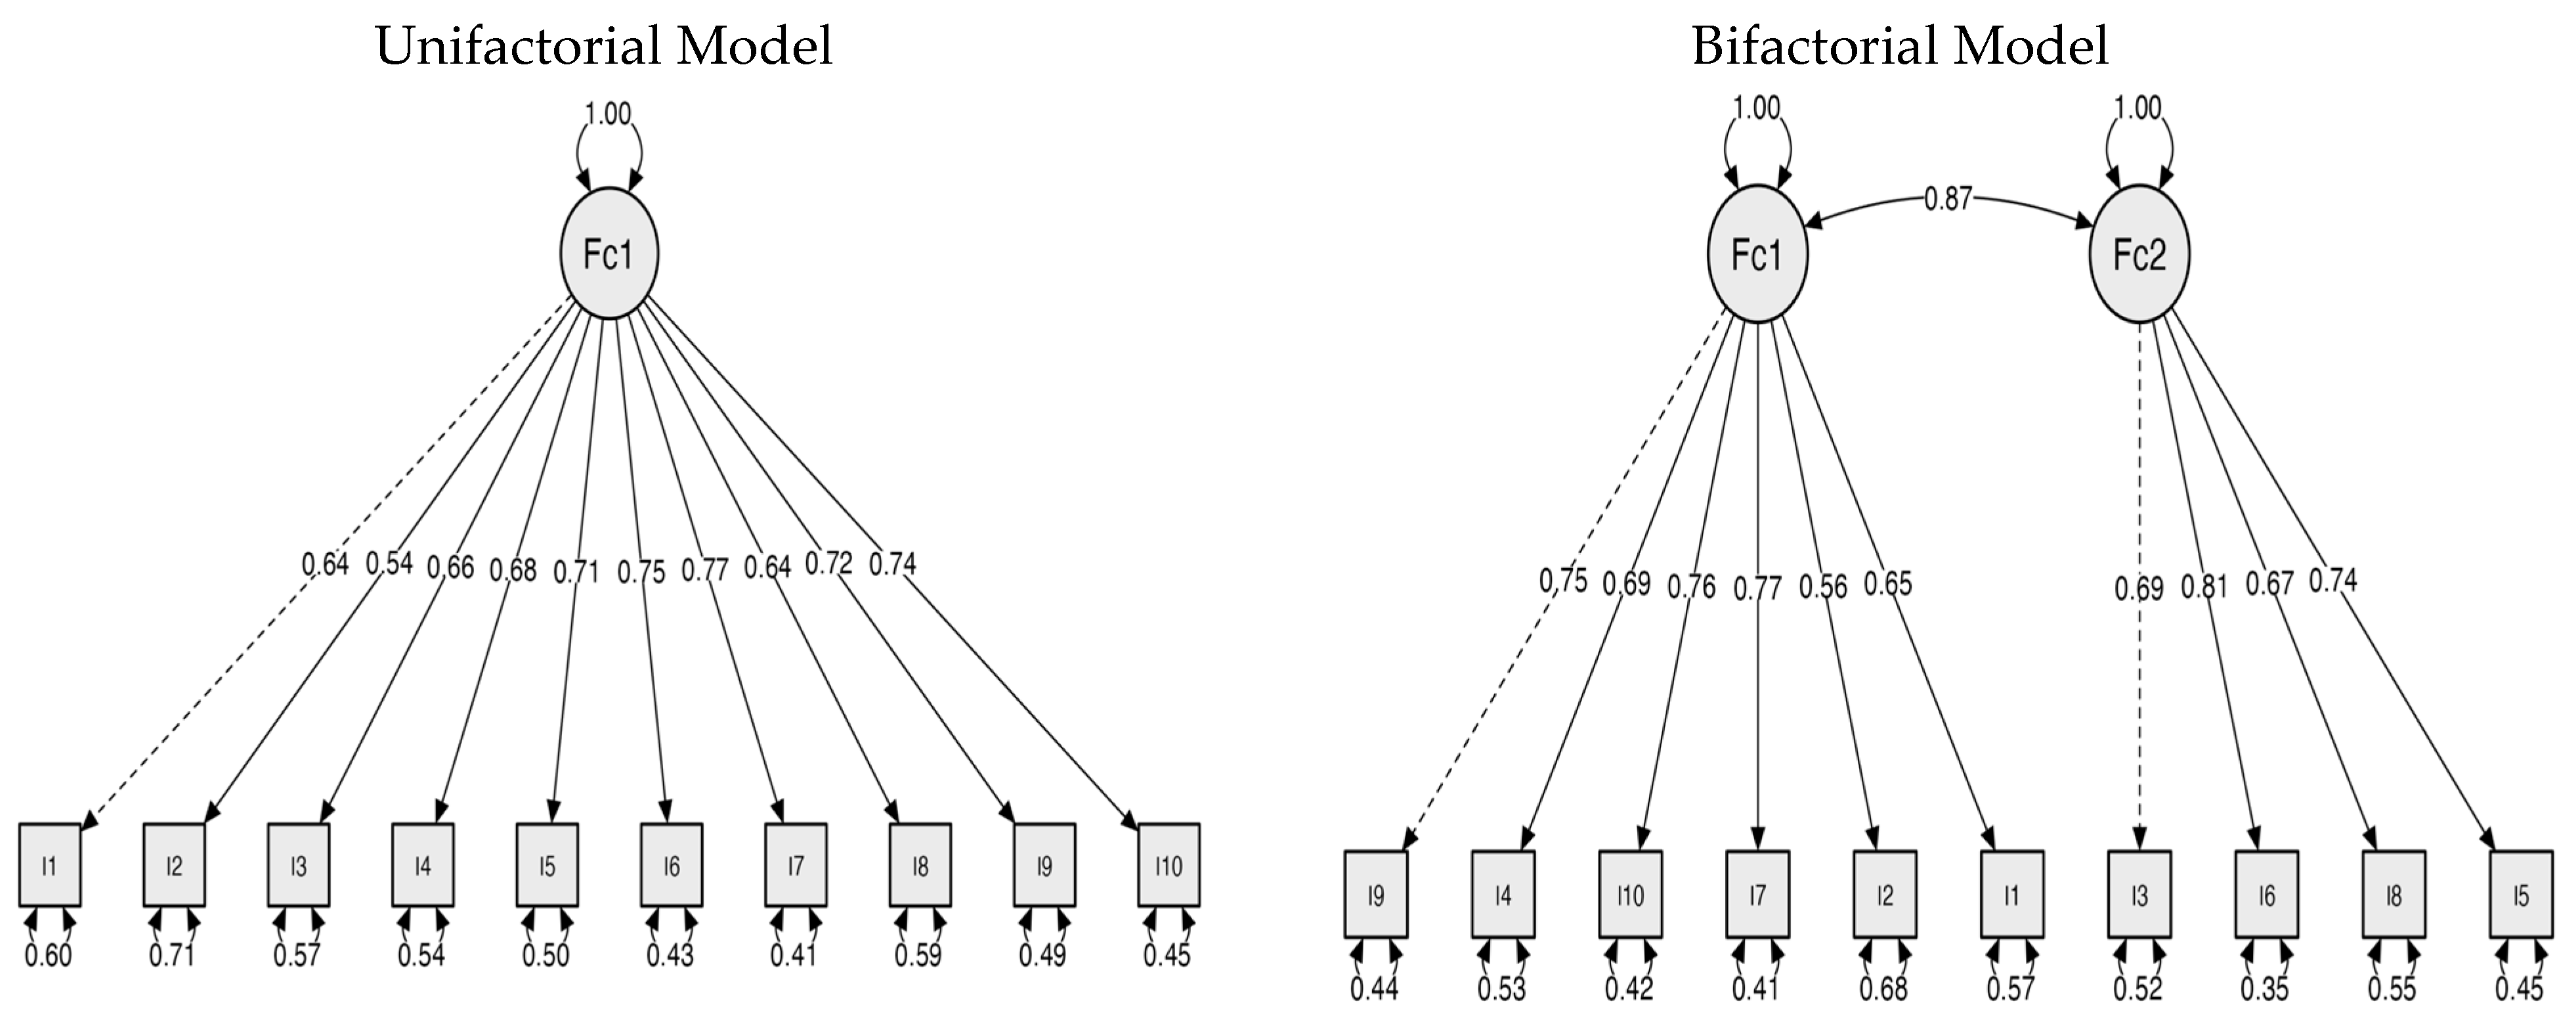
Figure 2 shows the path diagrams of both models. In the unifactorial model, a single latent factor explains all items (Items 1–10), with non-standardized factor loadings between 0.95 and 1.30. Although all loadings are substantial, the relatively high residual variances (between 0.70 and 1.35) suggest that there are aspects of some items that are not adequately captured by this model.
The bifactorial model proposes two correlated latent factors. The correlation between factors (r = 0.87) indicates that both dimensions, although distinguishable, are conceptually related. The first factor, which we call “Scholar Stress”, includes items related to academic pressure (Item 9, Item 4, Item 10, Item 7, Item 2, and Item 1), with non-standardized loadings between 0.74 and 1.00. The second factor, “Emotional Fatigue,” comprises items associated with physical and emotional manifestations of exhaustion (Item 3, Item 6, Item 8, and Item 5), with loadings between 0.94 and 1.28.
The residual variances in the bifactorial model (between 0.58 and 1.29) are generally lower than in the unifactorial model, indicating that this structure better explains the variability of responses. The distribution of items between the two factors is conceptually coherent, with a clear distinction between aspects related to academic stress and the affective–somatic manifestations of exhaustion.
Together, these results provide robust evidence supporting the bifactorial structure of the Emotional Exhaustion Scale in Children and Adolescents, suggesting that this construct can be better understood as a bidimensional phenomenon in this population, differentiating between academic stressors and their physical–emotional manifestations.
3.4. Measurement Invariance Across Age Groups
To assess whether the EES-CA operates equivalently across different developmental stages, we conducted a multi-group confirmatory factor analysis (CFA) to test measurement invariance between children (ages 10–12) and adolescents (ages 13–18). Four increasingly restrictive models were evaluated, which are as follows: configural, metric, scalar, and strict invariance. The results are presented in
Table 5.
The configural model demonstrated a good fit to the data (CFI = 0.959, TLI = 0.946, RMSEA = 0.072), indicating that the factor structure is similar across age groups. The metric invariance model, which constrains factor loadings to be equal, also showed an excellent fit (ΔCFI = 0.002), supporting the equivalence of item–factor relationships between groups. The scalar invariance model, which additionally constrains item intercepts, yielded a slightly higher ΔCFI (0.015), marginally exceeding the conventional threshold of 0.01. However, given that the overall fit indices remained acceptable and the increase in ΔCFI was minimal, scalar invariance can be considered sufficiently supported for practical purposes. Finally, the strict invariance model, which also constrains residual variances, demonstrated an acceptable fit (ΔCFI = 0.009), indicating that the scale’s measurement precision is comparable across age groups.
Taken together, these results provide strong evidence that the EES-CA is invariant across children and adolescents, supporting the validity of group comparisons and the robustness of subsequent analyses.
3.5. Convergent Validity
The discriminant validity of the EES-CA (see
Table 6), was evaluated using the Personal Wellbeing Index (PWI) and the Trait Meta-Mood Scale (TMMS-24). As expected, the correlations between the EES-CA dimensions (Scholar Stress and Emotional Fatigue) and the PWI were low and negative (r = −0.192 and r = −0.279, respectively;
p < 0.01), indicating that higher levels of school emotional exhaustion are associated with lower subjective wellbeing, but that these constructs are distinct. Similarly, the correlations between the EES-CA dimensions and the total score of the TMMS-24 were very low and not significant (r = 0.014 and r = −0.061, respectively), suggesting that emotional exhaustion is largely independent from perceived emotional intelligence. These findings support the discriminant validity of the EES-CA, confirming that it measures a construct that is distinct from general wellbeing and emotional intelligence.
4. Discussion
This study aimed to validate the Emotional Exhaustion Scale for Children and Adolescents (EES-CA), providing a psychometrically sound instrument for assessing emotional exhaustion in school-aged populations (see
Appendix A.1 and
Appendix A.2). The analyses demonstrated that the EES-CA exhibits excellent reliability, with Cronbach’s alpha (α) = 0.888 and McDonald’s omega (ω) = 0.883, indicating high internal consistency. A two-dimensional factor structure was identified, consisting of Scholar Stress (SS) and Emotional Fatigue (EF), which together explained 58.49% of the total variance.
Confirmatory Factor Analysis (CFA) confirmed the superiority of the bifactorial model over the unifactorial structure, demonstrating a satisfactory fit to the data, as follows: χ2(34) = 91.739, p < 0.001, with a chi-square ratio over degrees of freedom (χ2/df) of 2.70. The goodness-of-fit indices indicated a robust model fit, with CFI = 0.960, TLI = 0.947, NFI = 0.939, RMSEA = 0.072 [0.055–0.090], and SRMR = 0.038, suggesting an adequate model fit. The convergent validity of the scale was established through its significant correlations with the DASS-21 measures of depression, anxiety, and stress.
The two identified factors—Scholar Stress (SS) and Emotional Fatigue (EF)—are both critical components in assessing children and adolescents’ emotional wellbeing, yet they capture distinct psychological dimensions. Scholar Stress primarily relates to the pressure and tension associated with academic demands, encompassing feelings of being overwhelmed by evaluations, lack of time, and excessive academic workload. In contrast, Emotional Fatigue reflects the physical and emotional manifestations of exhaustion, indicating a deeper sense of depletion and somatic symptoms related to prolonged stress.
Additionally, Scholar Stress can lead to further depression, anxiety, and chronic stress, affecting the mental health of the students and leading to dire consequences for the student’s performance [
34]. Furthermore, this concern has gained relevance in light of the COVID-19 pandemic, in which a high prevalence of mental health disorders has been reported among children and adolescents in Chile [
6]. The chronic stress brought on by academic pressure can, likewise, have adverse effects on physical health, such as sleep disorders, headaches, and a compromised immune system [
35]. Students affected by Scholar Stress may find it difficult to stay focused and engaged, leading to reduced learning outcomes in school [
36].
Moreover, Scholar Stress can lead students to withdraw and become less involved in the educational process, which can undermine their educational experience and worsen the classroom climate. This dimension correlates with outcomes such as reduced academic satisfaction and lower commitment to educational purpose; it increases the risk of dropping out of classes and school [
37]. Scholar Stress not only affects students at school, but also permeates their personal relationships and family life, thus reducing their quality of life overall [
38].
On the contrary, Emotional Fatigue can mean that students feel chronic tiredness, loss of energy, and emotion regulation failure [
39]. This dimension corresponds to the somatic and affective expressions of exhaustion, which can lead to a diminished ability to meet the demands of the environment [
40]. Fatigue is associated with feelings of depletion and lack of vitality and the tendency for students to develop depression and anxiety, which can lead to deterioration in their overall mental health [
41].
This emotional state compliments lessened academic productivity, such that learners believe their effort is in vain, influencing the quality of their learning and zeal for education [
42]. In addition, Emotional Fatigue can hinder students’ capacity for developing healthy relationships with both peers and teachers, which leads to the risk of a less collaborative and supportive educational atmosphere [
43]. Such emotional distress may increase stress levels and lead to burnout, presenting as irritability and being overwhelmed [
35].
The Emotional Exhaustion Scale for Children and Adolescents (EES-CA) was constructed to specifically address emotional exhaustion among school-aged individuals, and, as such, has specific benefits. First, the EES-CA is contextually adapted to the educational context, offering a specialized approach that captures the wide range of specific difficulties encountered by children and adolescents during their school years. Furthermore, in conjunction with its status as a short-scale instrument, this minimization ensures that the instrument does not overly burden respondents, allowing it to be administered efficiently in multiple educational arenas. By validating the EES-CA, it fills an important gap within the field, allowing for future explorations of how emotional exhaustion manifests in terms of students’ wellbeing and academic life.
4.1. Limitations and Projections of the Study
We were unable to identify any published scales measuring emotional exhaustion in adolescents, aside from the Emotional Exhaustion Scale for Children and Adolescents (EES-CA), which was found to show validity and reliability, but only for a specific sample of Chilean students. Therefore, the generalizability of our findings is limited, as cultural and contextual differences may influence both the manifestation of emotional exhaustion and the factorial structure of the scale. For instance, previous research has shown that cultural factors can affect how burnout symptoms are expressed and perceived.
Future research should validate the EES-CA in diverse populations, including students from different countries, regions, and socioeconomic backgrounds, to ensure its cross-cultural applicability. Such studies are essential to determine whether the factor structure and item interpretation remain consistent across cultural contexts. Additionally, longitudinal studies are needed to assess the stability of the scale over time and its predictive validity regarding academic performance and mental health outcomes.
4.2. Future Projections
The EES-CA has the ability to continue to develop research of emotional burnout in school-aged populations. Tackling the EES-CA in other geographic or cultural contexts will help to confirm its applicability across various student groups. Furthermore, additional studies could investigate correlations between emotional exhaustion and other important variables, for instance, school context, relationships between teachers and pupils, and pupils’ individual traits.
Furthermore, creating targeted interventions depending on findings from EES-CA may be a vital step to take in preventing emotional exhaustion in education. The bifactorial structure further indicates that optimization seeds may have to address both academic stressors as well as emotional–physical sequelae as two potentially independent dimensions.
The results of this study should be taken into account by educational policymakers, and strategies should be developed to ensure students are healthy and to prevent academic failure caused by unhealthy students; this requires encouragement of a balance between academic and personal life, decreasing burdensome workloads, and nurturing a supportive and cooperative environment in the educational setting.
A fundamental aspect for future research and practice is the possibility of designing and implementing evidence-based interventions tailored to the specific needs identified by the EES-CA. For students with high Scholar Stress scores, strategies such as academic skills workshops, time management training, and psychoeducational programs focused on coping with academic demands are recommended. At the institutional level, initiatives to reduce excessive workload and promote a balanced academic environment can help mitigate sources of stress.
For students with elevated Emotional Fatigue, interventions should focus on emotional regulation and overall wellbeing. Mindfulness-based programs, relaxation techniques, and social–emotional learning (SEL) have demonstrated effectiveness in reducing emotional exhaustion and strengthening resilience in school populations. For example, mindfulness interventions have been shown to decrease symptoms of fatigue and improve emotional regulation in adolescents. Additionally, encouraging regular breaks, promoting healthy sleep habits, and fostering supportive relationships among peers and teachers can help address the physical and emotional manifestations of exhaustion.
By linking EES-CA scores to these evidence-based strategies, the scale not only serves as a diagnostic tool, but also guides the implementation of personalized interventions, ultimately supporting students’ academic success and overall wellbeing.
4.3. Practical Implications
EES-CA provides an essential tool for educational administrators, school psychologists, and mental health professionals for early identification and detection of emotional exhaustion in children and adolescents. Additionally, it opens the door for the creation of wellbeing and psychological support initiatives aimed at this group. Furthermore, EES-CA outcomes can further aid educators in the design and adaptation of educational programs that target specific components that are vital to students’ emotional health.
The bifactorial structure of the EES-CA offers a broader perspective on emotional exhaustion before the age of adulthood, separating academic stressors (Scholar Stress) from their physical–emotional consequences (Emotional Fatigue). This differentiation can lead to more-targeted interventions that address the sources of stress and its effects on students’ wellbeing.
In summary, the EES-CA enables a more nuanced understanding of emotional exhaustion in school-aged populations and provides actionable information for the development of both preventive and remedial strategies in educational settings.
5. Conclusions
We conclude that the Emotional Exhaustion Scale for Children and Adolescents (EES-CA) is a valid and reliable instrument in the Chilean context. Using an extensive series of psychometric tests, we have shown that emotional exhaustion among school children is a bidimensional construct defined by Scholar Stress and Emotional Fatigue, rather than a unidimensional construct or process.
The EES-CA had good psychometric properties (α = 0.888; ω = 0.883) and a two-factor structure that explained 58.49% of total variance. Confirmatory factor analysis indicated that the bifactorial model was superior, with all fit indices satisfying the established criteria for a good model fit (CFI = 0.960; TLI = 0.947; RMSEA = 0.072). The scale further exhibited high convergent validity, as evidenced by significant associations with the DASS-21 measures of depression, anxiety, and stress.
The development of two broad but connected factors—Scholar Stress and Emotional Fatigue—offers insight into the nature of emotional exhaustion in children and adolescents. Scholar Stress is the stress the individual makes from the pressure of their academic demands and Emotional Fatigue is when this pressure and stress become manifested in both physical and emotional ways. This distinction is especially helpful for designing interventions aimed at addressing both the causes of stress and its effects on students’ wellbeing.
By enabling better detection of issues where educators can intervene, the EES-CA fills a critical gap in post-pandemic education, where children and adolescents are dealing with persistent mental health issues. This study fills this crucial gap by providing a psychometrically robust tool for measuring burnout, with a focus on the specific challenges faced by school-age children.
We hope that the EES-CA will serve as an essential resource for educational psychologists, school counselors, and mental health practitioners who work with children and adolescents. This type of model can not only be applied in the context of assessment, but it can also used to guide preventative approaches and interventions designed to foster emotional wellbeing in schools. Future studies should examine the cross-cultural applicability of the scale, as well as its predictive validity for academic outcomes and long-term mental health markers.
Overall, results from the current study confirm that the EES-CA is a valid, reliable, and theoretically-based measure of emotional exhaustion in school-aged children, marking an important step forward in examining emotional exhaustion in school-aged youth and in contributing to the wellbeing of children and adolescents within schools.


 ,
, 


