
Anthropometric and Physical Fitness Profile of Adolescent Inter-County Ladies’ Gaelic Football Players


Abstract
:1. Introduction
2. Materials and Methods
2.1. Experimental Approach
2.2. Participants
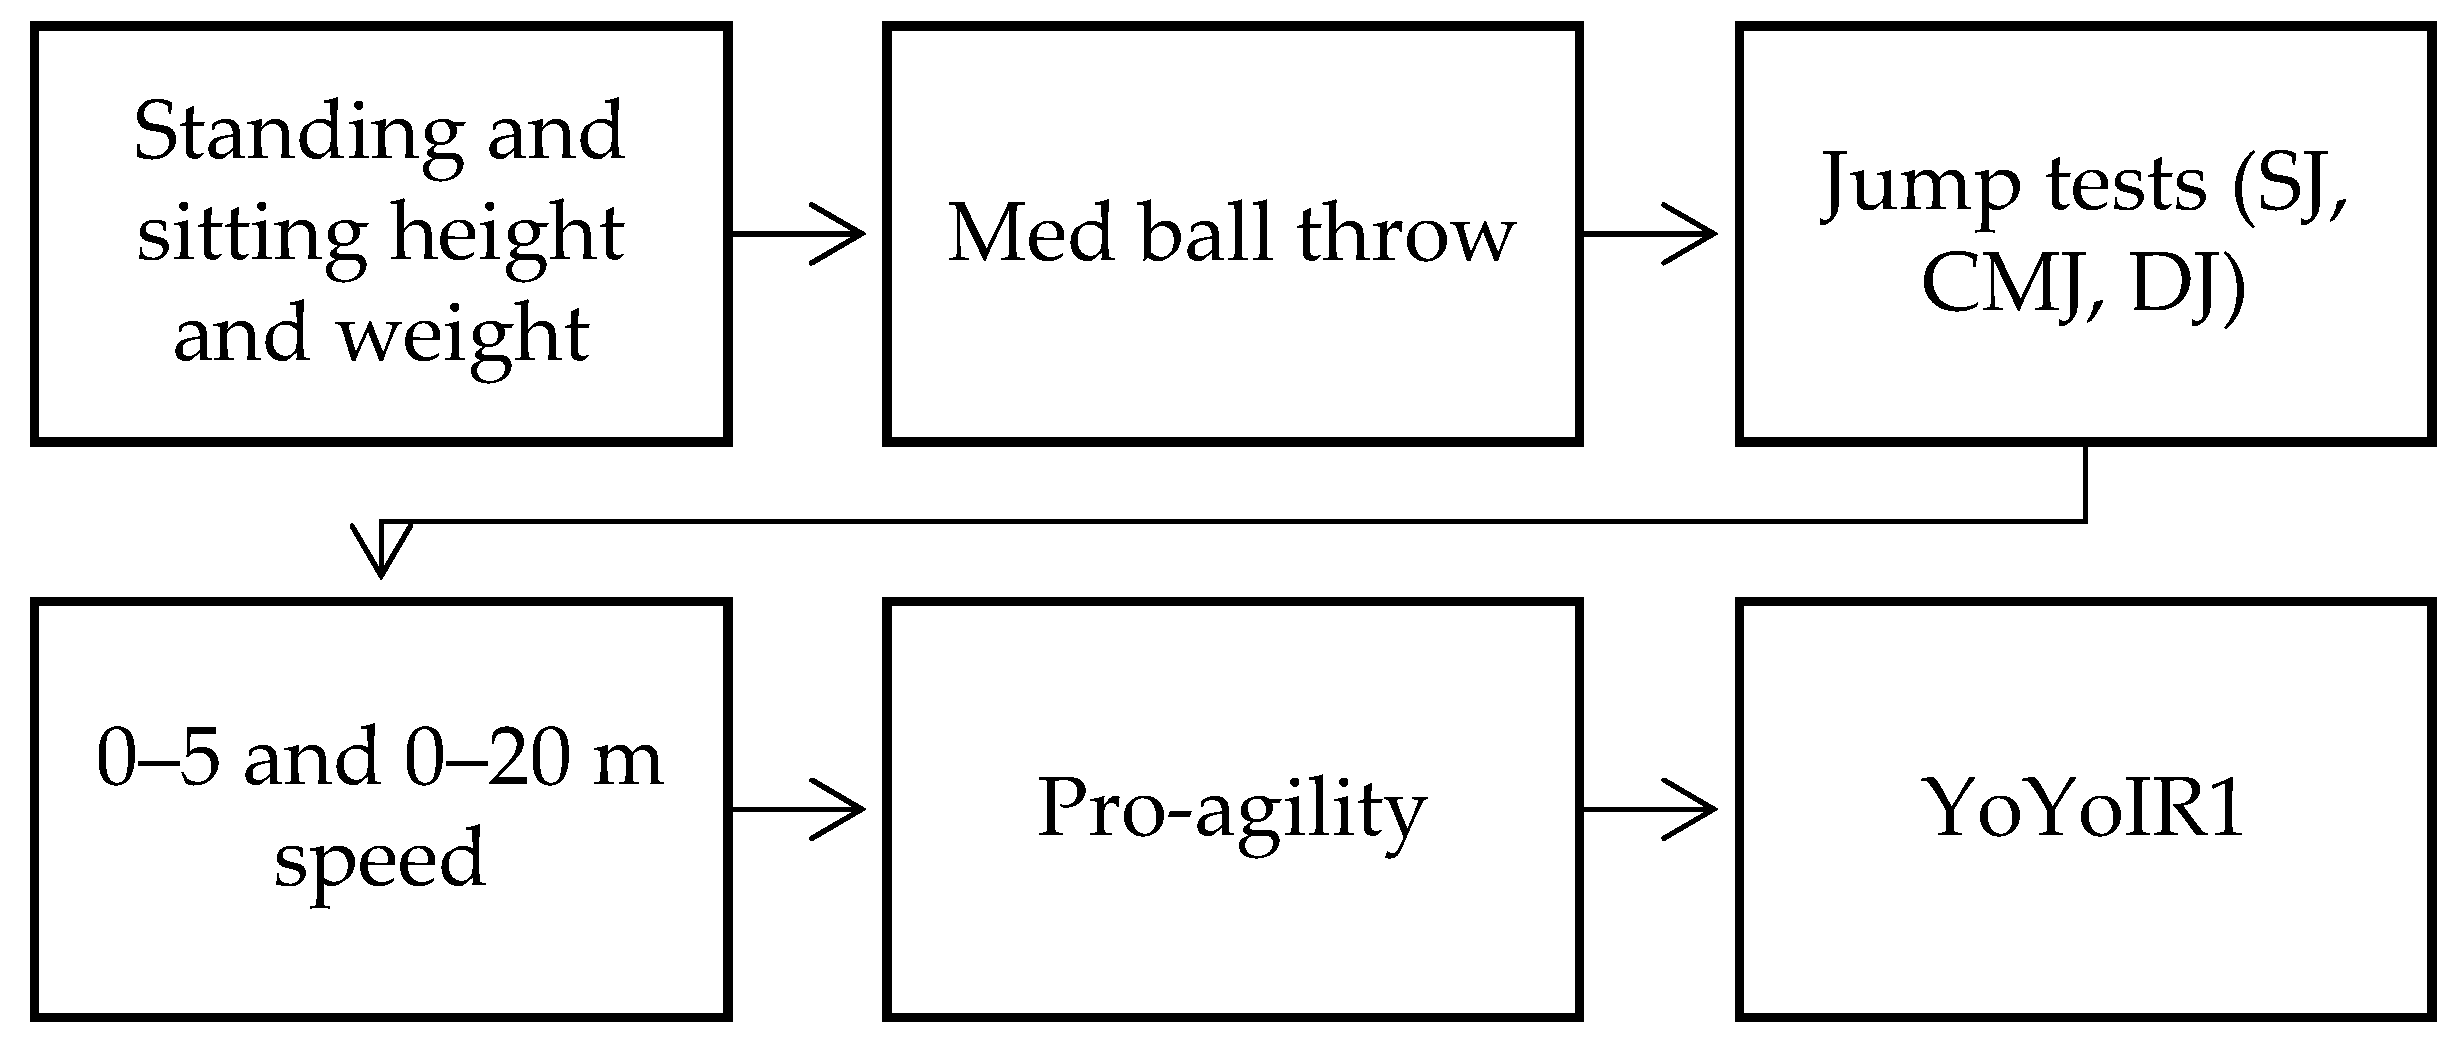
2.3. Procedure
2.4. Anthropometric Measurements
2.5. Jump Tests (SJ, CMJ, and DJ)
2.6. Medicine Ball Throw
2.7. Sprinting and Change of Direction
2.8. YoYo Intermittent Recovery Test Level 1
2.9. Statistical Analysis
3. Results
3.1. Anthropometric Data
3.2. Test–Retest Reliability
3.3. Physical Fitness Performance Data
4. Discussion
5. Limitations and Future Research
6. Conclusions
Author Contributions
Funding
Institutional Review Board Statement
Informed Consent Statement
Data Availability Statement
Acknowledgments
Conflicts of Interest
References
- O’Connor, S.; Bruce, C.; Teahan, C.; McDermott, E.; Whyte, E. Injuries in collegiate ladies Gaelic footballers: A 2-season prospective cohort study. J. Sport Rehabil. 2020, 30, 261–266. [Google Scholar] [CrossRef]
- Duggan, J.D.; Moody, J.; Byrne, P.; McGahan, J.H.; Kirszenstein, L. Considerations and Guidelines on Athletic Development for Youth Gaelic Athletic Association Players. Strength Cond. J. 2022, 44, 76–96. [Google Scholar] [CrossRef]
- Competitions—Ladies Gaelic Football. Available online: https://ladiesgaelic.ie/the-lgfa/roll-of-honours/competitions/ (accessed on 1 June 2023).
- Cullen, B.D.; Cregg, C.J.; Kelly, D.T.; Hughes, S.M.; Daly, P.G.; Moyna, N.M. Fitness profiling of elite level adolescent Gaelic football players. J. Strength Cond. Res. 2013, 27, 2096–2103. [Google Scholar] [CrossRef]
- Brown, J.; Waller, M. Needs Analysis, Physiological Response, and Program Guidelines for Gaelic Football. Strength Cond. J. 2014, 36, 73–81. [Google Scholar] [CrossRef]
- Wright, M.D.; Laas, M.M. Strength training and metabolic conditioning for female youth and adolescent soccer players. Strength Cond. J. 2016, 38, 96–104. [Google Scholar] [CrossRef]
- Lloyd, R.S.; Oliver, J.L. The youth physical development model: A new approach to long-term athletic development. Strength Cond. J. 2012, 34, 61–72. [Google Scholar] [CrossRef]
- Stratton, G.; Oliver, J.L. The impact of growth and maturation on physical performance. In Strength and Conditioning for Young Athletes; Routledge: London, UK, 2019; pp. 3–20. [Google Scholar]
- Malina, R.M.; Kozieł, S.M.; Králik, M.; Chrzanowska, M.; Suder, A. Prediction of maturity offset and age at peak height velocity in a longitudinal series of boys and girls. Am. J. Hum. Biol. 2021, 33, e23551. [Google Scholar] [CrossRef] [PubMed]
- O’Brien-Smith, J.; Bennett, K.J.; Fransen, J.; Smith, M.R. Same or different? A comparison of anthropometry, physical fitness and perceptual motor characteristics in male and female youth soccer players. Sci. Med. Footb. 2020, 4, 37–44. [Google Scholar] [CrossRef]
- Papaiakovou, G.; Giannakos, A.; Michailidis, C.; Patikas, D.; Bassa, E.; Kalopisis, V.; Kotzamanidis, C. The effect of chronological age and gender on the development of sprint performance during childhood and puberty. J. Strength Cond. Res. 2009, 23, 2568–2573. [Google Scholar] [CrossRef] [PubMed]
- Vescovi, J.D.; Rupf, R.; Brown, T.D.; Marques, M.C. Physical performance characteristics of high-level female soccer players 12–21 years of age. Scand. J. Med. Sci. Sports 2011, 21, 670–678. [Google Scholar] [CrossRef]
- Sommerfield, L.M.; Harrison, C.B.; Whatman, C.S.; Maulder, P.S. Relationship between strength, athletic performance, and movement skill in adolescent girls. J. Strength Cond. Res. 2022, 36, 674–679. [Google Scholar] [CrossRef]
- Emmonds, S.; Heyward, O.; Jones, B. The challenge of applying and undertaking research in female sport. Sports Med.-Open 2019, 5, 1–4. [Google Scholar] [CrossRef]
- Costello, J.T.; Bieuzen, F.; Bleakley, C.M. Where are all the female participants in Sports and Exercise Medicine research? Eur. J. Sport Sci. 2014, 14, 847–851. [Google Scholar] [CrossRef] [PubMed]
- Cowley, E.S.; Olenick, A.A.; McNulty, K.L.; Ross, E.Z. “Invisible Sportswomen”: The Sex Data Gap in Sport and Exercise Science Research. Women Sport Phys. Act. J. 2021, 29, 146–151. [Google Scholar] [CrossRef]
- Bradley, P.S.; Vescovi, J.D. Velocity thresholds for women’s soccer matches: Sex specificity dictates high-speed running and sprinting thresholds—Female athlete in motion (FAiM). Int. J. Sports Physiol. Perform. 2015, 10, 112–116. [Google Scholar] [CrossRef] [PubMed]
- Boyle, E.; Warne, J.; Collins, K. Anthropometric and performance profile of elite Gaelic football players comparing position and role. Sport Sci. Health 2021, 17, 763–770. [Google Scholar] [CrossRef]
- Collins, K.; Doran, D.A.; Reilly, T.P. The physiological demands of competitive hurling match-play. In Contemporary Ergonomics and Human Factors; Anderson, M., Ed.; CRC Press: London, UK, 2010; pp. 591–595. [Google Scholar]
- Keane, J.; Malone, S.; Keogh, C.; Young, D.; Coratella, G.; Collins, K. A comparison of anthropometric and performance profiles between elite and sub-elite hurling players. Appl. Sci. 2021, 11, 954. [Google Scholar] [CrossRef]
- O’Brien, P.; Martin, D.; Bradley, J. Differences in performance indicators between winners and losers in senior inter county hurling championship. Int. J. Perform. Anal. Sport 2021, 21, 630–640. [Google Scholar] [CrossRef]
- Roe, M.; Blake, C.; Gissane, C.; Collins, K. Injury scheme claims in Gaelic games: A review of 2007–2014. J. Athl. Train. 2016, 51, 303–308. [Google Scholar] [CrossRef] [PubMed]
- Beasley, K.J. Nutrition and Gaelic football: Review, recommendations, and future considerations. Int. J. Sport Nutr. Exerc. Metab. 2015, 25, 1–13. [Google Scholar] [CrossRef]
- Keane, A.; Scott, M.A.; Dugdill, L.; Reilly, T. Fitness test profiles as determined by the Eurofit Test Battery in elite female Gaelic football players. J. Strength Cond. Res. 2010, 24, 1502–1506. [Google Scholar] [CrossRef] [PubMed]
- Kelly, G.; McKenna, O.; Courtney, S.; Collins, K.; Bradley, J.; Martin, D. Benchmarking successful performances in elite Ladies Gaelic football. Int. J. Perform. Anal. Sport 2022, 22, 51–65. [Google Scholar] [CrossRef]
- Tucker, L.; Reilly, T. Physiological and anthropometric characteristics of female Gaelic football players. In Science and Football V: Proceedings of the Fifth World Congress of Science and Football; E and FN Spon: London, UK, 2005; pp. 27–30. [Google Scholar]
- Malone, S.; McGuinness, A.; Duggan, J.D.; Murphy, A.; Collins, K.; O’Connor, C. The running performance of elite ladies Gaelic football with respect to position and halves of play. Sport Sci. Health 2022, 19, 959–967. [Google Scholar] [CrossRef]
- Byrne, L.M.; Byrne, P.J.; Byrne, E.K.; Byrne, A.P.; Coyle, C. Cross-Sectional Study of the Physical Fitness and Anthropometric Profiles of Adolescent Hurling, Camogie, and Gaelic Football Players. J. Strength Cond. Res. 2021, 36, 3422–3431. [Google Scholar] [CrossRef]
- Mujika, I.; Santisteban, J.; Impellizzeri, F.M.; Castagna, C. Fitness determinants of success in men’s and women’s football. J. Sports Sci. 2009, 27, 107–114. [Google Scholar] [CrossRef]
- Datson, N.; Weston, M.; Drust, B.; Atkinson, G.; Lolli, L.; Gregson, W. Reference values for performance test outcomes relevant to English female soccer players. Sci. Med. Footb. 2022, 6, 589–596. [Google Scholar] [CrossRef] [PubMed]
- Gissis, I.; Papadopoulos, C.; Kalapotharakos, V.I.; Sotiropoulos, A.; Komsis, G.; Manolopoulos, E. Strength and speed characteristics of elite, subelite, and recreational young soccer players. Res. Sports Med. 2006, 14, 205–214. [Google Scholar] [CrossRef] [PubMed]
- Yao, X.; Curtis, C.; Turner, A.; Bishop, C.; Austerberry, A.; Chavda, S. Anthropometric profiles and physical characteristics in competitive female English premiership rugby union players. Int. J. Sports Physiol. Perform. 2021, 16, 1234–1241. [Google Scholar] [CrossRef]
- Emmonds, S.; Scantlebury, S.; Murray, E.; Turner, L.; Robsinon, C.; Jones, B. Physical characteristics of elite youth female soccer players characterized by maturity status. J. Strength Cond. Res. 2020, 34, 2321–2328. [Google Scholar] [CrossRef]
- Farley, J.B.; Keogh, J.W.; Woods, C.T.; Milne, N. Physical fitness profiles of female Australian football players across five competition levels. Sci. Med. Footb. 2022, 6, 105–126. [Google Scholar] [CrossRef]
- Mirwald, R.L.; Baxter-Jones, A.D.; Bailey, D.A.; Beunen, G.P. An assessment of maturity from anthropometric measurements. Med. Sci. Sports Exerc. 2002, 34, 689–694. [Google Scholar]
- Pueo, B.; Jimeney-Olmedo, J.M.; Lipińska, P.; Buśko, K.; Penichet-Tomas, A. Concurrent validity and reliability of proprietary and open-source jump mat systems for the assessment of vertical jumps in sport sciences. Acta Bioeng. Biomech. 2018, 20, 51–57. [Google Scholar]
- Jarvis, P.; Turner, A.; Read, P.; Bishop, C. Reactive strength index and its associations with measures of physical and sports performance: A systematic review with meta-analysis. Sports Med. 2021, 52, 301–330. [Google Scholar] [CrossRef] [PubMed]
- Markovic, G.; Dizdar, D.; Jukic, I.; Cardinale, M. Reliability and factorial validity of squat and countermovement jump tests. J. Strength Cond. Res. 2004, 18, 551–555. [Google Scholar] [PubMed]
- Beckham, G.; Lish, S.; Keebler, L.; Longaker, C.; Disney, C.; DeBeliso, M.; Adams, K.J. The reliability of the seated medicine ball throw for distance. J. Phys. Act. Res. 2019, 4, 131–136. [Google Scholar] [CrossRef]
- Paul, D.J.; Nassis, G.P. Physical fitness testing in youth soccer: Issues and considerations regarding reliability, validity, and sensitivity. Pediatr. Exerc. Sci. 2015, 27, 301–313. [Google Scholar] [CrossRef]
- Forster, J.W.; Uthoff, A.M.; Rumpf, M.C.; Cronin, J.B. Pro-agility unpacked: Variability, comparability and diagnostic value. Int. J. Sports Sci. Coach. 2022, 17, 1225–1240. [Google Scholar] [CrossRef]
- Schmitz, B.; Pfeifer, C.; Kreitz, K.; Borowski, M.; Faldum, A.; Brand, S.M. The Yo-Yo intermittent tests: A systematic review and structured compendium of test results. Front. Physiol. 2018, 9, 870. [Google Scholar] [CrossRef]
- Cohen, J. Statistical Power Analysis for the Behavioural Sciences, 2nd ed.; University of Toronto: Hillside, NJ, USA, 1988. [Google Scholar]
- Doyle, B.; Browne, D.; Horan, D. Differences in anthropometric and physical performance characteristics between U17, U19, and Senior Irish female international football players. Int. J. Sports Sci. Coach. 2021, 16, 352–359. [Google Scholar] [CrossRef]
- Ramos, G.P.; Nakamura, F.Y.; Penna, E.M.; Wilke, C.F.; Pereira, L.A.; Loturco, I.; Coimbra, C.C. Activity profiles in U17, U20, and senior women’s Brazilian national soccer teams during international competitions: Are there meaningful differences? J. Strength Cond. Res. 2019, 33, 3414–3422. [Google Scholar] [CrossRef]
- Malina, R.M.; Kozieł, S.M. Validation of maturity offset in a longitudinal sample of Polish girls. J. Sports Sci. 2014, 32, 1374–1382. [Google Scholar] [CrossRef] [PubMed]
- Malina, R.M.; Choh, A.C.; Czerwinski, S.A.; Chumlea, W.C. Validation of maturity offset in the Fels Longitudinal Study. Pediatr. Exerc. Sci. 2016, 28, 439–455. [Google Scholar] [CrossRef] [PubMed]
- Ramos, G.P.; Nakamura, F.Y.; Penna, E.M.; Mendes, T.T.; Mahseredjian, F.; Lima, A.M.; Garcia, E.S.; Prado, L.S.; Coimbra, C.C. Comparison of physical fitness and anthropometrical profiles among Brazilian female soccer national teams from U15 to senior categories. J. Strength Cond. Res. 2021, 35, 2302–2308. [Google Scholar] [CrossRef] [PubMed]
- Castagna, C.; Castellini, E. Vertical jump performance in Italian male and female national team soccer players. J. Strength Cond. Res. 2013, 27, 1156–1161. [Google Scholar] [CrossRef] [PubMed]
- Biggar, C.; Larson, A.; DeBeliso, M. Establishing normative reference values for the Utah Seated Medicine Ball Throw Protocol in Adolescents. bioRxiv 2021. [Google Scholar] [CrossRef]
- Duggan, J.D.; Keane, K.; Moody, J.; Byrne, P.J.; Malone, S.; Collins, K.; Ryan, L. Strength and Conditioning Recommendations for Female Athletes: The Gaelic Footballer. Strength Cond. J. 2023. Advance online publication. [Google Scholar] [CrossRef]


| Group | Standing Height (cm) | Sitting Height (cm) | Weight (kg) | Age @ PHV (Years) | Maturity Offset (Years) | |
|---|---|---|---|---|---|---|
| U14 (n = 33) | Mean | 162 | 83 | 57.7 | 12.2 | 1.5 |
| SD | 5.5 | 2.7 | 7.1 | 0.3 | 0.3 | |
| Range | 24 | 11 | 28.5 | 1.3 | 1.6 | |
| Minimum | 153 | 76 | 43.3 | 11.6 | 0.7 | |
| Maximum | 177 | 87 | 71.8 | 12.9 | 2.3 | |
| U16 (n = 64) | Mean | 166 | 85 | 59.5 | 12.6 | 2.5 |
| SD | 5.5 | 3.4 | 6.8 | 0.4 | 0.6 | |
| Range | 29 | 15 | 36.9 | 1.9 | 2.2 | |
| Minimum | 152 | 77 | 41.8 | 11.8 | 1.3 | |
| Maximum | 181 | 92 | 78.7 | 13.7 | 3.5 | |
| U18 (n = 59) | Mean | 168 | 86 | 63.0 | 13.4 | 3.6 |
| SD | 5.1 | 3.0 | 8.2 | 0.4 | 0.5 | |
| Range | 26 | 15 | 42.5 | 2.2 | 2.0 | |
| Minimum | 155 | 81 | 49.5 | 12.2 | 2.6 | |
| Maximum | 181 | 96 | 92.0 | 14.4 | 4.6 |
| Mean Difference | Std. Error | Sig. | 95% Confidence Interval | ||||
|---|---|---|---|---|---|---|---|
| Lower Bound | Upper Bound | ||||||
| Standing Height | U14 | U16 | −3.608 * | 1.153 | 0.006 | −6.40 | −0.82 |
| U18 | −5.512 * | 1.170 | 0.000 | −8.34 | −2.68 | ||
| U16 | U14 | 3.608 * | 1.153 | 0.006 | 0.82 | 6.40 | |
| U18 | −1.904 | 0.971 | 0.156 | −4.25 | 0.45 | ||
| U18 | U14 | 5.512 * | 1.170 | 0.000 | 2.68 | 8.34 | |
| U16 | 1.904 | 0.971 | 0.156 | −0.45 | 4.25 | ||
| Weight | U14 | U16 | −1.8304 | 1.5896 | 0.754 | −5.678 | 2.017 |
| U18 | −5.3035 * | 1.6124 | 0.004 | −9.206 | −1.401 | ||
| U16 | U14 | 1.8304 | 1.5896 | 0.754 | −2.017 | 5.678 | |
| U18 | −3.4731 * | 1.3387 | 0.031 | −6.714 | −0.233 | ||
| U18 | U14 | 5.3035 * | 1.6124 | 0.004 | 1.401 | 9.206 | |
| U16 | 3.4731 * | 1.3387 | 0.031 | 0.233 | 6.714 | ||
| Age @ PHV | U14 | U16 | −0.4320 * | 0.0824 | 0.000 | −0.632 | −0.232 |
| U18 | −1.2137 * | 0.0836 | 0.000 | −1.416 | −1.011 | ||
| U16 | U14 | 0.4320 * | 0.0824 | 0.000 | 0.232 | 0.632 | |
| U18 | −0.7818 * | 0.0694 | 0.000 | −0.950 | −0.614 | ||
| U18 | U14 | 1.2137 * | 0.0836 | 0.000 | 1.011 | 1.416 | |
| U16 | 0.7818 * | 0.0694 | 0.000 | 0.614 | 0.950 | ||
| SJ (cm) | CMJ (cm) | DJ (cm) | Speed 5 m (s) | Speed 20 m (s) | Pro-agility (s) | MBT (m) | |
|---|---|---|---|---|---|---|---|
| Pearson correlation | 0.952 * | 0.941 * | 0.927 * | 0.934 * | 0.965 * | 0.916 * | 0.906 * |
| Sig. (2-tailed) | <0.001 | <0.001 | <0.001 | <0.001 | <0.001 | <0.001 | <0.001 |
| N | 15 | 15 | 15 | 15 | 15 | 15 | 15 |
| N | Mean | SD | Std. Error | 95% Confidence Interval for Mean | Minimum | Maximum | |||
|---|---|---|---|---|---|---|---|---|---|
| Lower Bound | Upper Bound | ||||||||
| MBT (m) | U14 | 33 | 3.4 | 0.3 | 0.1 | 3.3 | 3.5 | 2.8 | 4.0 |
| U16 | 63 | 3.5 | 0.3 | 0.0 | 3.4 | 3.6 | 3.0 | 4.3 | |
| U18 | 58 | 3.6 | 0.4 | 0.0 | 3.5 | 3.7 | 2.8 | 4.4 | |
| YoYoIR1 Distance (m) | U14 | 32 | 750 | 306 | 54 | 640 | 860 | 240 | 1440 |
| U16 | 62 | 868 | 308 | 39 | 790 | 946 | 240 | 1680 | |
| U18 | 54 | 944 | 348 | 47 | 849 | 1039 | 320 | 2200 | |
| Speed 5 m (s) | U14 | 32 | 1.19 | 0.10 | 0.02 | 1.15 | 1.22 | 1.02 | 1.39 |
| U16 | 62 | 1.16 | 0.08 | 0.01 | 1.14 | 1.18 | 1.00 | 1.36 | |
| U18 | 57 | 1.16 | 0.10 | 0.01 | 1.14 | 1.19 | 0.94 | 1.45 | |
| Speed 20 m (s) | U14 | 32 | 3.52 | 0.18 | 0.03 | 3.45 | 3.59 | 3.19 | 3.83 |
| U16 | 62 | 3.53 | 0.15 | 0.02 | 3.50 | 3.57 | 3.17 | 4.08 | |
| U18 | 57 | 3.58 | 0.25 | 0.03 | 3.51 | 3.65 | 3.11 | 4.48 | |
| Pro-agility (s) | U14 | 32 | 5.71 | 0.29 | 0.05 | 5.61 | 5.81 | 5.20 | 6.62 |
| U16 | 62 | 5.73 | 0.35 | 0.04 | 5.64 | 5.82 | 5.08 | 6.82 | |
| U18 | 55 | 5.59 | 0.31 | 0.04 | 5.51 | 5.68 | 4.94 | 6.30 | |
| SJ (cm) | U14 | 32 | 25.0 | 3.4 | 0.6 | 23.7 | 26.2 | 16.8 | 31.9 |
| U16 | 62 | 23.2 | 3.0 | 0.4 | 22.4 | 23.9 | 14.8 | 29.4 | |
| U18 | 57 | 24.3 | 4.8 | 0.6 | 23.0 | 25.6 | 13.0 | 35.0 | |
| CMJ (cm) | U14 | 32 | 27.5 | 3.7 | 0.6 | 26.1 | 28.8 | 19.6 | 35.1 |
| U16 | 62 | 26.3 | 3.5 | 0.4 | 25.4 | 27.2 | 17.4 | 36.5 | |
| U18 | 57 | 27.3 | 5.0 | 0.7 | 25.9 | 28.6 | 14.5 | 38.6 | |
| DJ Contact Time (s) | U14 | 32 | 0.222 | 0.027 | 0.005 | 0.212 | 0.232 | 0.170 | 0.285 |
| U16 | 62 | 0.225 | 0.034 | 0.004 | 0.216 | 0.234 | 0.157 | 0.359 | |
| U18 | 56 | 0.219 | 0.026 | 0.004 | 0.212 | 0.226 | 0.151 | 0.265 | |
| DJ Height (cm) | U14 | 32 | 25.5 | 3.4 | 0.6 | 24.2 | 26.7 | 17.9 | 34.3 |
| U16 | 62 | 25.7 | 3.7 | 0.5 | 24.7 | 26.6 | 17.0 | 36.9 | |
| U18 | 56 | 26.4 | 4.9 | 0.7 | 25.0 | 27.7 | 15.9 | 36.8 | |
| RSI | U14 | 32 | 1.2 | 0.2 | 0.0 | 1.1 | 1.2 | 0.8 | 1.9 |
| U16 | 62 | 1.2 | 0.2 | 0.0 | 1.1 | 1.2 | 0.7 | 2.0 | |
| U18 | 56 | 1.2 | 0.3 | 0.0 | 1.1 | 1.3 | 0.7 | 1.9 | |
| Mean Difference | Std. Error | Sig. | 95% Confidence Interval | ||||
|---|---|---|---|---|---|---|---|
| Lower Bound | Upper Bound | ||||||
| MBT | U14 | U16 | −0.0589 | 0.0692 | 1.000 | −0.226 | 0.109 |
| U18 | −0.1516 | 0.0702 | 0.098 | −0.322 | 0.018 | ||
| U16 | U14 | 0.0589 | 0.0692 | 1.000 | −0.109 | 0.226 | |
| U18 | −0.0927 | 0.0586 | 0.348 | −0.235 | 0.049 | ||
| U18 | U14 | 0.1516 | 0.0702 | 0.098 | −0.018 | 0.322 | |
| U16 | 0.0927 | 0.0586 | 0.348 | −0.049 | 0.235 | ||
| YoYoIR1 Distance | U14 | U16 | −117.742 | 70.296 | 0.288 | −288.00 | 52.52 |
| U18 | −194.444 * | 72.047 | 0.023 | −368.95 | −19.94 | ||
| U16 | U14 | 117.742 | 70.296 | 0.288 | −52.52 | 288.00 | |
| U18 | −76.703 | 60.114 | 0.612 | −222.30 | 68.90 | ||
| U18 | U14 | 194.444 * | 72.047 | 0.023 | 19.94 | 368.95 | |
| U16 | 76.703 | 60.114 | 0.612 | −68.90 | 222.30 | ||
| Speed 5 m | U14 | U16 | 0.02458 | 0.02036 | 0.688 | −0.0247 | 0.0739 |
| U18 | 0.02374 | 0.02067 | 0.758 | −0.0263 | 0.0738 | ||
| U16 | U14 | −0.02458 | 0.02036 | 0.688 | −0.0739 | 0.0247 | |
| U18 | −0.00084 | 0.01717 | 1.000 | −0.0424 | 0.0407 | ||
| U18 | U14 | −0.02374 | 0.02067 | 0.758 | −0.0738 | 0.0263 | |
| U16 | 0.00084 | 0.01717 | 1.000 | −0.0407 | 0.0424 | ||
| Speed 20 m | U14 | U16 | −0.01418 | 0.04346 | 1.000 | −0.1194 | 0.0911 |
| U18 | −0.05908 | 0.04410 | 0.547 | −0.1659 | 0.0477 | ||
| U16 | U14 | 0.01418 | 0.04346 | 1.000 | −0.0911 | 0.1194 | |
| U18 | −0.04490 | 0.03664 | 0.667 | −0.1336 | 0.0438 | ||
| U18 | U14 | 0.05908 | 0.04410 | 0.547 | −0.0477 | 0.1659 | |
| U16 | 0.04490 | 0.03664 | 0.667 | −0.0438 | 0.1336 | ||
| Pro-agility | U14 | U16 | −0.01822 | 0.07081 | 1.000 | −0.1897 | 0.1533 |
| U18 | 0.11823 | 0.07233 | 0.313 | −0.0569 | 0.2934 | ||
| U16 | U14 | 0.01822 | 0.07081 | 1.000 | −0.1533 | 0.1897 | |
| U18 | 0.13645 | 0.06026 | 0.075 | −0.0095 | 0.2824 | ||
| U18 | U14 | −0.11823 | 0.07233 | 0.313 | −0.2934 | 0.0569 | |
| U16 | −0.13645 | 0.06026 | 0.075 | −0.2824 | 0.0095 | ||
| SJ | U14 | U16 | 1.7900 | 0.8415 | 0.105 | −0.248 | 3.828 |
| U18 | 0.6594 | 0.8539 | 1.000 | −1.408 | 2.727 | ||
| U16 | U14 | −1.7900 | 0.8415 | 0.105 | −3.828 | 0.248 | |
| U18 | −1.1306 | 0.7094 | 0.339 | −2.848 | 0.587 | ||
| U18 | U14 | −0.6594 | 0.8539 | 1.000 | −2.727 | 1.408 | |
| U16 | 1.1306 | 0.7094 | 0.339 | −0.587 | 2.848 | ||
| CMJ | U14 | U16 | 1.1337 | 0.9057 | 0.638 | −1.059 | 3.327 |
| U18 | 0.1948 | 0.9191 | 1.000 | −2.031 | 2.420 | ||
| U16 | U14 | −1.1337 | 0.9057 | 0.638 | −3.327 | 1.059 | |
| U18 | −0.9388 | 0.7635 | 0.662 | −2.788 | 0.910 | ||
| U18 | U14 | −0.1948 | 0.9191 | 1.000 | −2.420 | 2.031 | |
| U16 | 0.9388 | 0.7635 | 0.662 | −0.910 | 2.788 | ||
| DJ Contact Time | U14 | U16 | −0.002998 | 0.006487 | 1.000 | −0.01871 | 0.01271 |
| U18 | 0.003116 | 0.006604 | 1.000 | −0.01288 | 0.01911 | ||
| U16 | U14 | 0.002998 | 0.006487 | 1.000 | −0.01271 | 0.01871 | |
| U18 | 0.006114 | 0.005494 | 0.803 | −0.00719 | 0.01942 | ||
| U18 | U14 | −0.003116 | 0.006604 | 1.000 | −0.01911 | 0.01288 | |
| U16 | −0.006114 | 0.005494 | 0.803 | −0.01942 | 0.00719 | ||
| DJ Height | U14 | U16 | −0.1985 | 0.9096 | 1.000 | −2.401 | 2.004 |
| U18 | −0.8955 | 0.9261 | 1.000 | −3.138 | 1.347 | ||
| U16 | U14 | 0.1985 | 0.9096 | 1.000 | −2.004 | 2.401 | |
| U18 | −0.6970 | 0.7704 | 1.000 | −2.563 | 1.169 | ||
| U18 | U14 | 0.8955 | 0.9261 | 1.000 | −1.347 | 3.138 | |
| U16 | 0.6970 | 0.7704 | 1.000 | −1.169 | 2.563 | ||
| RSI | U14 | U16 | −0.00187 | 0.05624 | 1.000 | −0.1381 | 0.1343 |
| U18 | −0.06045 | 0.05726 | 0.879 | −0.1991 | 0.0782 | ||
| U16 | U14 | 0.00187 | 0.05624 | 1.000 | −0.1343 | 0.1381 | |
| U18 | −0.05857 | 0.04763 | 0.662 | −0.1739 | 0.0568 | ||
| U18 | U14 | 0.06045 | 0.05726 | 0.879 | −0.0782 | 0.1991 | |
| U16 | 0.05857 | 0.04763 | 0.662 | −0.0568 | 0.1739 | ||
Disclaimer/Publisher’s Note: The statements, opinions and data contained in all publications are solely those of the individual author(s) and contributor(s) and not of MDPI and/or the editor(s). MDPI and/or the editor(s) disclaim responsibility for any injury to people or property resulting from any ideas, methods, instructions or products referred to in the content. |
© 2023 by the authors. Licensee MDPI, Basel, Switzerland. This article is an open access article distributed under the terms and conditions of the Creative Commons Attribution (CC BY) license (https://creativecommons.org/licenses/by/4.0/).
Share and Cite
Molohan, T.; Behan, S.; MacNamara, Á. Anthropometric and Physical Fitness Profile of Adolescent Inter-County Ladies’ Gaelic Football Players. Adolescents 2023, 3, 625-639. https://doi.org/10.3390/adolescents3040044
Molohan T, Behan S, MacNamara Á. Anthropometric and Physical Fitness Profile of Adolescent Inter-County Ladies’ Gaelic Football Players. Adolescents. 2023; 3(4):625-639. https://doi.org/10.3390/adolescents3040044
Chicago/Turabian StyleMolohan, Teresa, Stephen Behan, and Áine MacNamara. 2023. "Anthropometric and Physical Fitness Profile of Adolescent Inter-County Ladies’ Gaelic Football Players" Adolescents 3, no. 4: 625-639. https://doi.org/10.3390/adolescents3040044
APA StyleMolohan, T., Behan, S., & MacNamara, Á. (2023). Anthropometric and Physical Fitness Profile of Adolescent Inter-County Ladies’ Gaelic Football Players. Adolescents, 3(4), 625-639. https://doi.org/10.3390/adolescents3040044