Article

A Simplified Approach to Understanding Body Cooling Behavior and Estimating the Postmortem Interval

1
Department of Chemical Engineering, University of Houston, Houston, TX 77204, USA
2
Department of Petroleum Engineering, University of Houston, Houston, TX 77023, USA
*
Author to whom correspondence should be addressed.
Retired.
Forensic Sci. 2022, 2(2), 403-416; https://doi.org/10.3390/forensicsci2020030
Submission received: 27 January 2022 / Revised: 16 March 2022 / Accepted: 18 April 2022 / Published: 6 May 2022
(This article belongs to the Special Issue Research Advances in Postmortem Interval Estimation)

Abstract

:
Ascertaining the postmortem interval or PMI has been an item of interest over many decades in forensic science for crime scene investigations. The challenge revolves around establishing the postmortem interval or PMI with a single temperature measurement, given the known initial and the final boundary condition of a human body and room temperature. Despite the advent of a succession of single, double, and triple-exponential analytical models, and more recently, the 3-D heat-transfer modeling, the uncertainty remains in the PMI estimation. This study presents a pragmatic way to solve this problem in a two-step approach. First, we attempted to understand the cooling rate in various body parts. Second, we proposed a hyperbolic modeling approach to fit the time-dependent temperature data to estimate the PMI. The latest digital data of Wilk et al.’s study provided the platform for validating our solution approach. Overall, the use of 20 subsets of three bodies involving Wilk et al. and five from one body of Bartgis et al. provided the required data. Although body imaging and 3-D modeling greatly facilitate our understanding of overall body-cooling behavior in the modern era in real-time, a simple semi-analytical tool can corroborate the model results for PMI.

1. Introduction

Many authors have suggested that a single-exponential thermodynamic model predicts the time of death (TOD) or postmortem interval (PMI) based on evidence from pigs, as shown in an early study of Rainy [1], and recently that of Kaliszan et al. [2]. While the general trend is not in dispute, predicting the desired precision needs improvement to ascertain the PMI.
Noakes et al. [3] used eight methods to estimate the postmortem interval, wherein two rule-of-thumb methods compared well with six other mathematical models published by independent investigators [4,5,6,7,8,9]. Marshall and Hoare [6] and Marshall [10,11], proposed a double-exponential model to describe the cooling curve’s Sigmoidal shape. Al-Alousi et al. offered a triple-exponential model for 117 forensic cases in a two-part article [12,13]. Mall and Eisenmenger presented a complex heat flow model using a finite-element numerical solution [14,15]. Subsequently, a Laplace-transform approach of Rodrigo proposed a compartment-based model and addressed the convection from skin according to Newton’s law of cooling [16]. This method provided the results within half an hour of PMI.
Using a wooden cylinder model and following the conductive heat-transfer principle, a Fourier series model of Smart provided a credible approach for estimating the PMI and suggested that the outer ear’s temperature measurements lead to reasonable estimation [17]. Similarly, Baccino et al. preferred the exterior-ear temperature based on the rule-of-thumb correlations and field experience [18]. Another study by Smart and Kaliszan also pointed out PMI estimation complications due to the temperature plateau effect and suggested constructing a temperature decline curve for better assessment [19].
Although more than one exponential term in the temperature-decline trend appeared in the literature, one article by Kaliszan demonstrated that one-exponential term suffices [20]. In subsequent studies, Kaliszan proposed measuring the eyeball temperature because of its faster decline rate [21,22]; this approach resulted in the PMI estimation accuracy of ±1 h for a 95% confidence interval [21]. Perhaps the rapid temperature decline rate ensures higher accuracy in measurements due to increased fidelity requiring fewer data points. Nelson suggested average-based methods for short-term estimates of PMI [23]. Still, it utilizes many parameters, which leads to improved fitting, but the process loses the estimation efficiency. A very recent study by Laplace et al. [24] showed that the average PMI estimation turned out to be 4.5 ± 2.5 h on 100 inpatient bodies. The Henssage [9] nomogram and Baccino’s [18,25] formulae produced these results. Overall, the use of conventional methods produces a large degree of uncertainty in PMI estimation.
More recently, new methodologies are emerging for PMI estimation based on corneal thickness and aqueous humor measurements. For instance, Napoli et al. [26] showed that the central corneal thickness measured by optical coherence tomography correlates strongly with PMI. In contrast, Locci et al. [27] used a 1H NMR metabolomics approach to estimate the PMI from aqueous humor (AH) in an ovine model. Based on the spectral data analysis with multivariate statistical tools, this approach involving postmortem biological modifications provided an error of about 1 + h of PMI on animals. Their subsequent study [28] showed a general solution alignment with expectation, but the error bar appears large. These studies offer an attractive platform given the eye compartment resists postmortem modifications. Also, studies have appeared relating postmortem vitreous concentrations of sodium and chloride. For example, Zilg et al. [29] studied 3000 cases to demonstrate that vitreous sodium and chloride levels decline at about 2.2 mmol/L per day upon death.
This study explores the feasibility of extrapolating the late-time temperature data to find the PMI with improved accuracy and identifies the body part that ensures reliable solution quality. Data from the literature helped augment our case in that the heat transfer rate, a result of that temperature decline rate, is specific to an individual body. For instance, the temperature decline rate depends on body weight, meaning lower weight exhibits a higher cooling rate. Overall, data from an internal organ (IO) or rectum formed the basis of this investigation. We showed that the heat transfer rate could provide an excellent physical perspective on the temperature decline rate through the cooling rate constant, which is the time-derivative of temperature. In this context, estimating the heat-flow rate from a given organ provides the necessary insight.
Also, we present a hyperbolic method for estimating the PMI, regardless of the body organ. We show that the hyperbolic trend can successfully describe the cooling trends from many body parts using a single expression. Although the temperature data from skin or eyeball are limited, synthetic data show the value proposition of monotonic or near-monotonic behavior. This trend thereby facilitates reliable extrapolation to the actual value of the PMI. We found that the proposed hyperbolic method yields PMI solutions primarily within 1.65 °C for the scope of this investigation. Given the limited accessibility of modern forensic data in actual cases, we consider the results of this study to be a proof of concept.

2. Materials and Methods

Given the dominance of convective heat transport, many investigators described the temperature of a human body after death using Newton’s law of cooling. The body temperature at time t after death can be quantified using the following equation:
T T a = ( T i T a ) exp ( k c t )
where T is the temperature of the human body at time t, Ta is ambient temperature, Ti is the temperature at the time of death, and kc represents cooling constant.
Considering body temperature measured at times t1 and t2, we can rewrite Equation (1) in the following forms:
T 1 T a = ( T i T a ) exp ( k c t 1 )
and
T 2 T a = ( T i T a ) exp ( k c t 2 )
Dividing Equation (3) by Equation (2) and simplifying, we have
T 1 T a T 2 T a = exp ( k c t 1 + k c t 2 )
Rearranging Equation (4) for the cooling constant, kc, leads to the following expression:
k c = ln ( T 1 T a T 2 T a ) t 2 t 1
Now, Equation (5) allows kc estimation using the body temperature measured at times t1 and t2. We present two case studies involving Equation (5) for actual and synthetic data in Section 3.2. This cooling constant paved the way for understanding the temperature data collection from various body parts and the body’s physical characteristics, such as weight.
With a 3-D whole body heat-transfer model, a recent study of Bartgis et al. [30] has shown that we can write the heat-flow rate in the postmortem period written as
q c = ρ t C t T t t
where qc is the heat loss for a unit volume of the tissue, ρt is the density, and Ct is the heat capacity of the tissue. Bartgis et al. [30] reported the density and heat capacity for the human internal organ are 1000 kg/m3 and 3500 J/kg-°C, respectively. We show the value proposition of qc estimation for different organs to understand the PMI estimation.
Given that Newton’s law of cooling implies exponential temperature decay with time, we explored other data-fitting options to enlarge the scope of this investigation. A recent article by Sharma et al. [31] suggests that the hyperbolic trend effectively captures the decline behavior of fluid and heat flow in porous media. Following that approach, we can write the temperature-decline behavior as:
T   ( t ) = T i ( 1 + bD   t ) 1 / b
In Equation (6), the time-depended temperature, T (t), relates to time, t, involving three parameters, Ti, b, and D. Note that Ti reflects the starting point of data fitting and is user input. The parameter D represents the hourly temperature-decline rate (1/h), and b is the time-derivative of D, which is dimensionless. Note that for exponential temperature decay or when Newton’s law of cooling applies, b equals zero, and Equation (6) takes the following form:
T   ( t ) = T i   e Dt
So, the exponential temperature decline is a particular case of hyperbolic decay, encompassing the entire decline trend domain. Synthetic data in the modern era suggest that temperature response varies with the point of body measurement. For instance, the temperature measured on the skin declines faster when compared with the brain and rectum or IO. Figure 1 displays the temperature responses from the model, as presented in Bartgis et al. [30], showing the apparent differences in trend, depending on the body part. In particular, the skin curve exhibits a monotonic trend with the steepest decline, which is exponential. In contrast, the other two responses show a slow decline trend at early times.
Our curiosity stemmed from these variable trends, and we learned how a single-temperature measurement could lead to PMI estimation. In our view, potential obstacles may surface, given that the earlier response (<5 h) differs from the latter. Perhaps this reality propelled previous investigators to use double-exponential terms, as shown by Marshall [10,11], or triple-exponential formulation, as in Al-Alousi et al. [12,13] models. Still, as Henssge [9] showed, the double-exponential model yielded the PMI estimation within ±3.2 h.
We explored an understanding of some of the well-known studies involving the pioneering work of de Saram et al. [4] and Lyle and Cleveland [32] and those in the modern era [12,13,20,22,30,33,34]. Except for the recent studies of Bartgis et al. [30] and Kanawaku et al. [33] with models, other studies involved human bodies. Most recently, Wilk et al. [34] provided real-time temperature measurements and validations of their numerical heat-transfer modeling approach for four bodies, wherein real-time temperature data gathering occurred in the morgue. We explored the overall results in a two-step approach. The first step attempted to gain insights into the overall results involving human bodies and synthetic data for 102 cases. In the second step, we present four examples illustrating the merit of collecting the time-dependent temperature data rather than just one data point using the hyperbolic approach.

3. Results

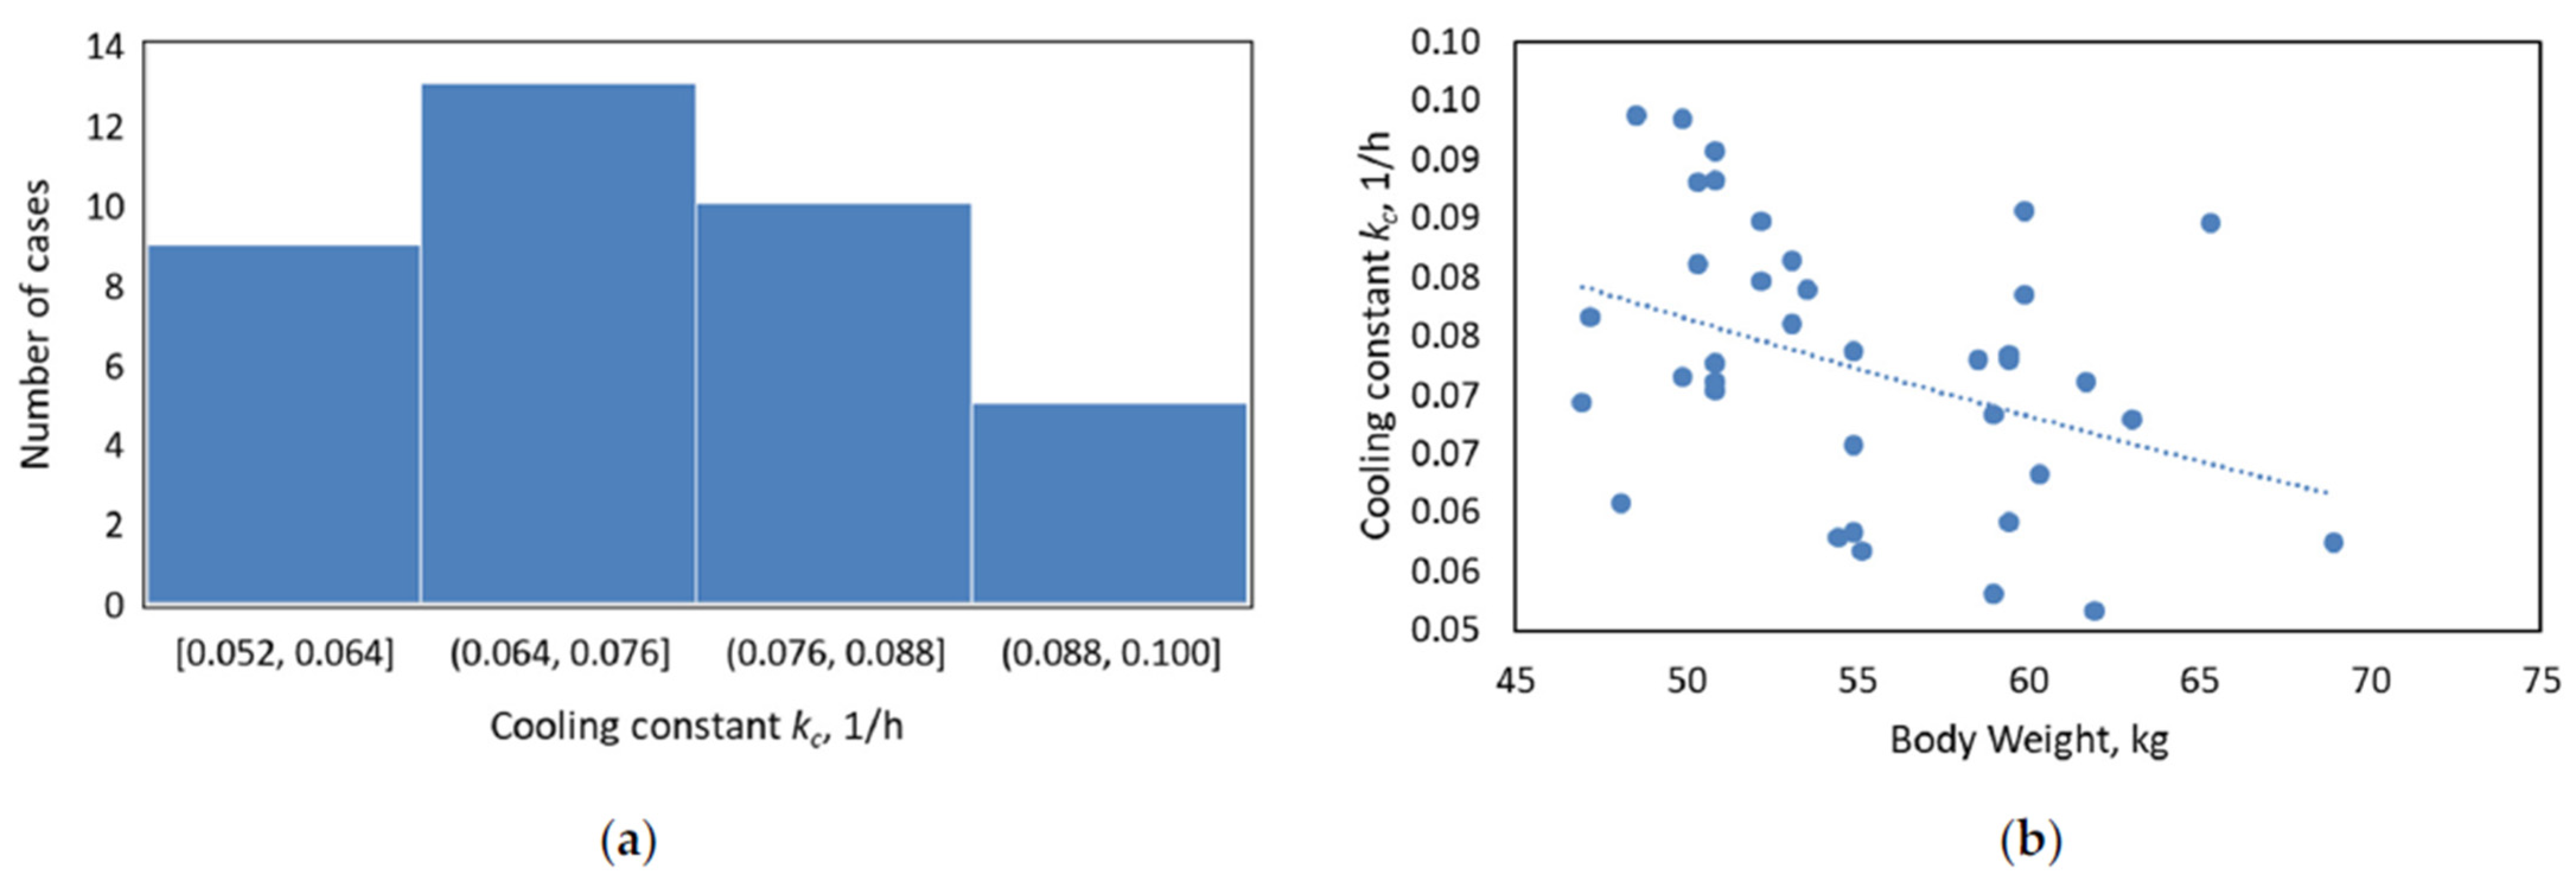
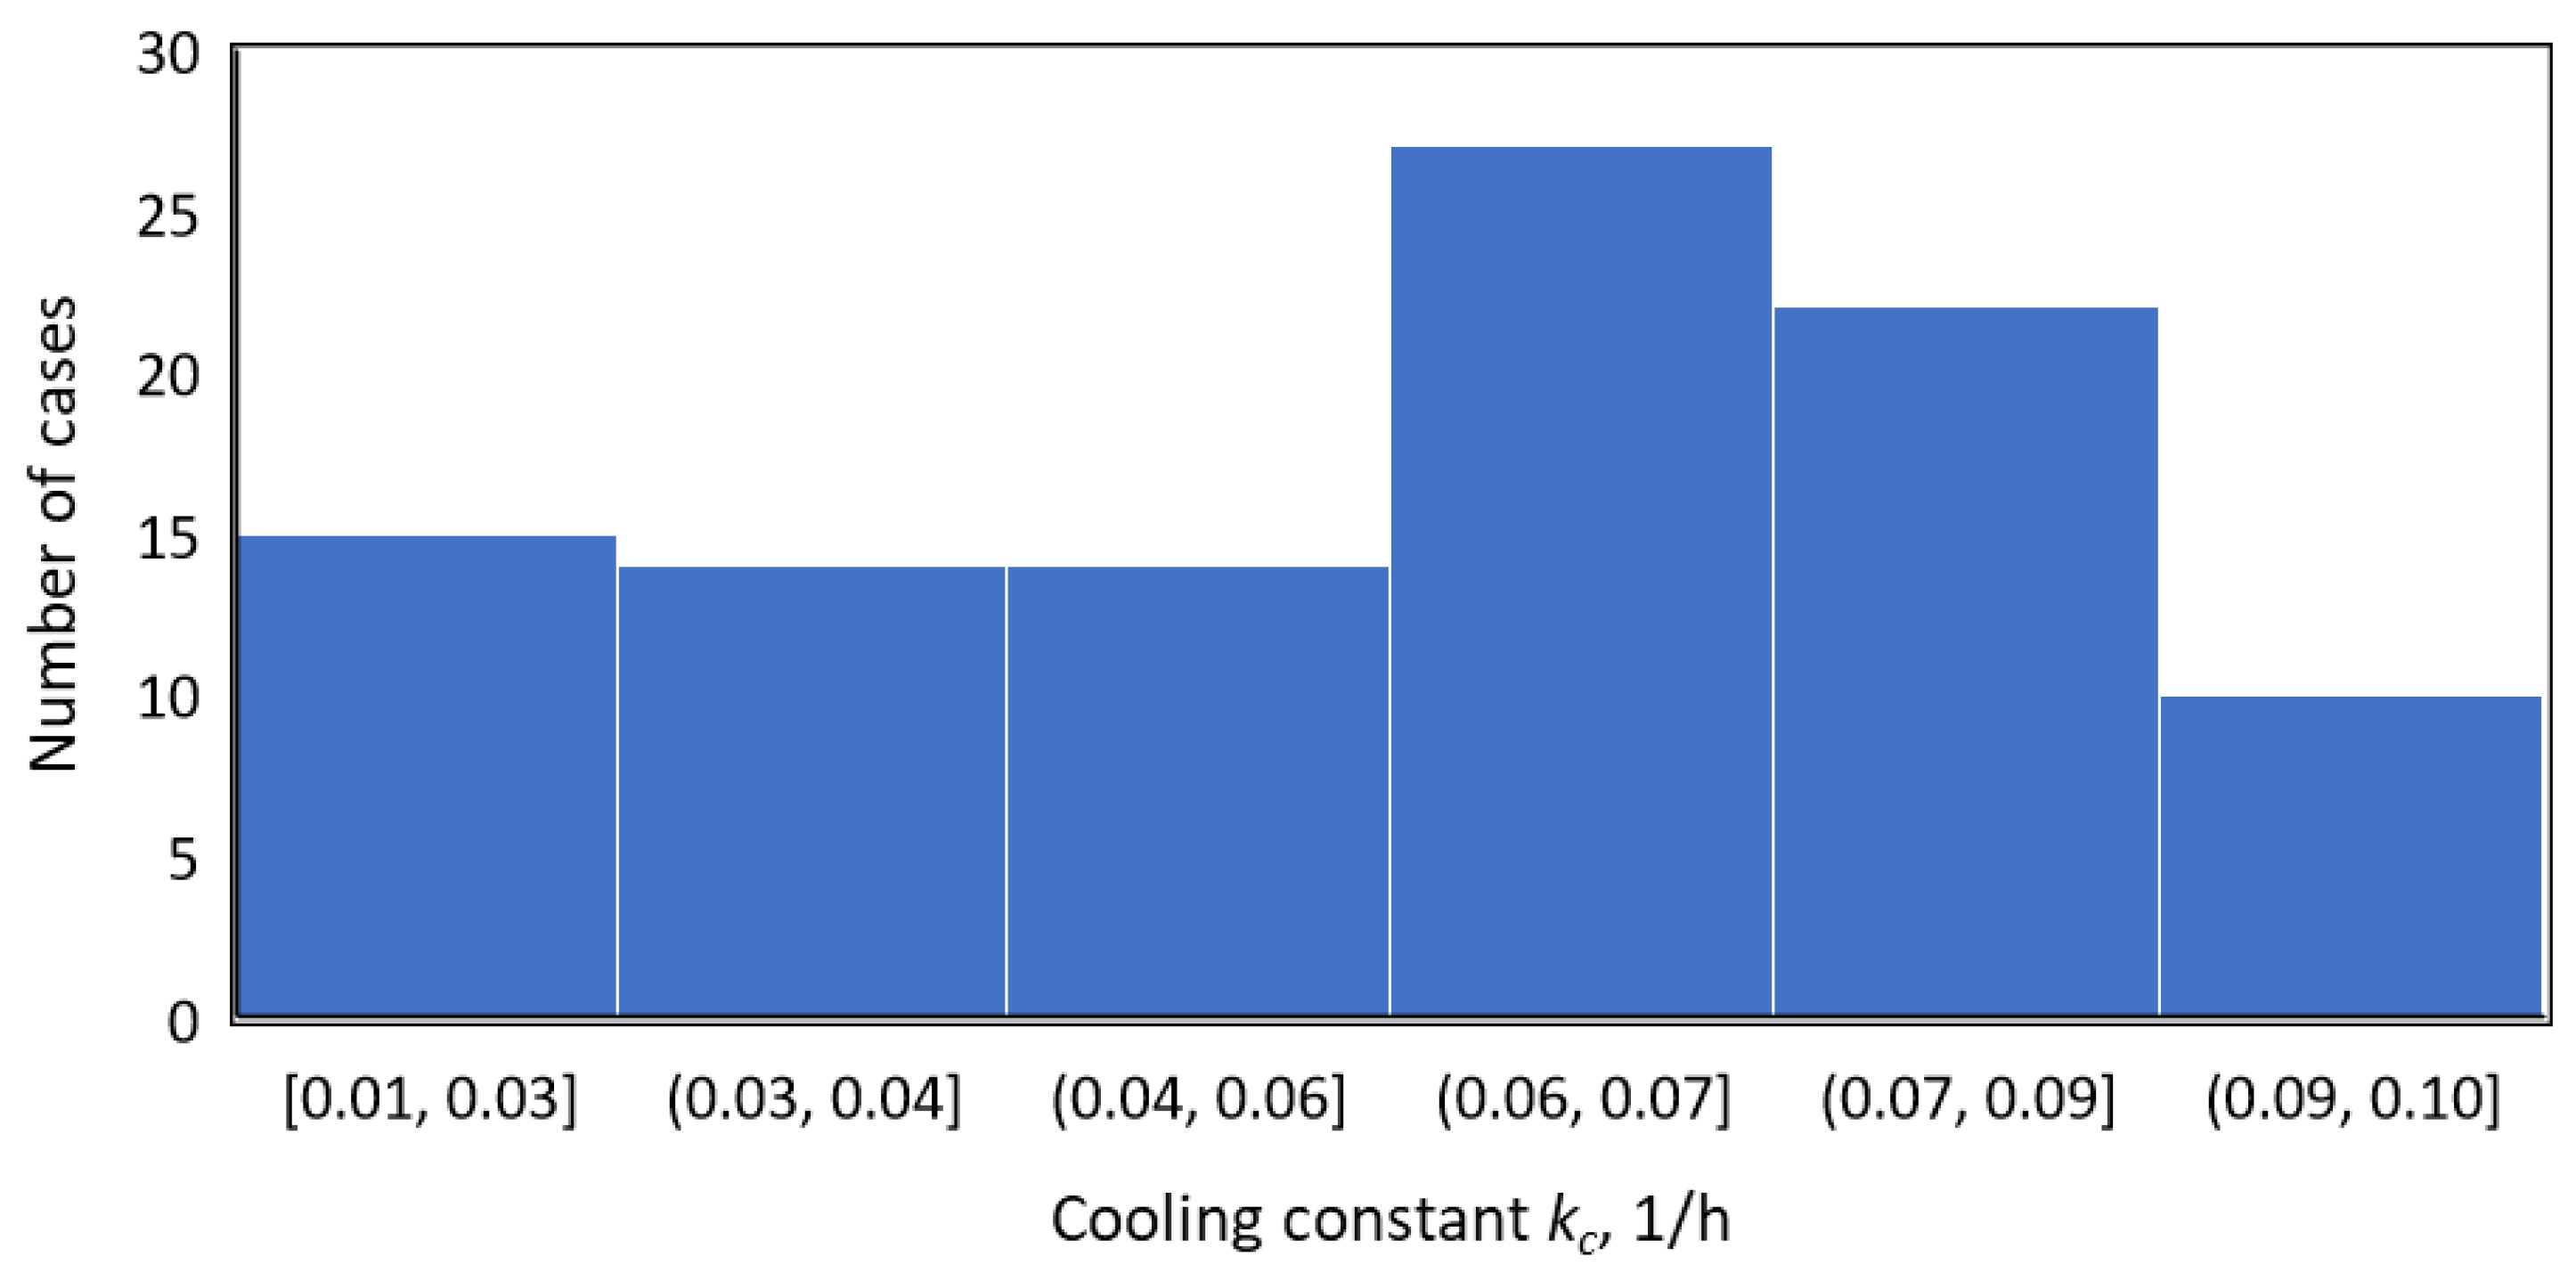
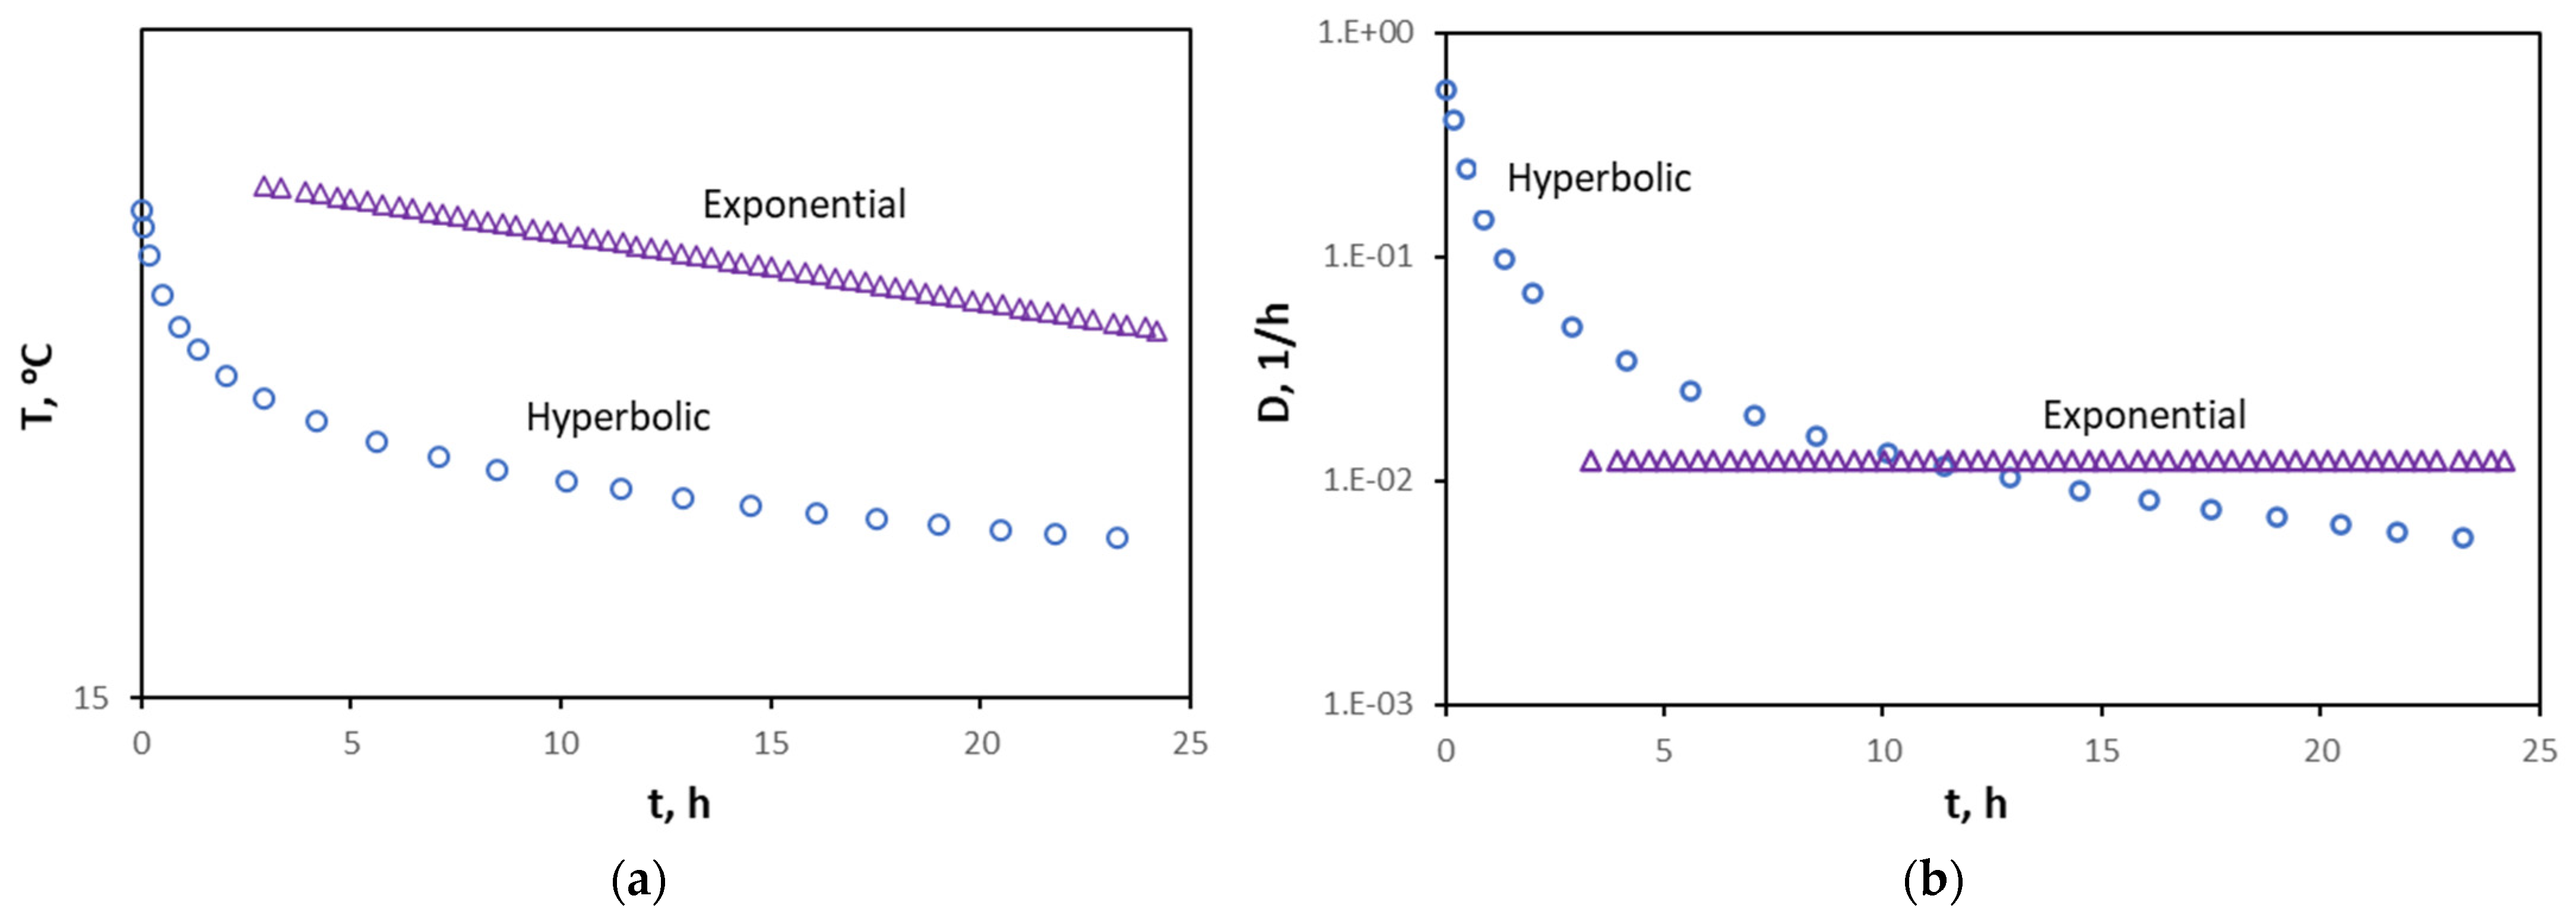
3.1. Understanding the Significance of Cooling Constant, kc

Given the importance of the cooling constant, we considered 102 cases. Thirty-seven of these cases involved those from de Saram et al. [4], 32 from Kaliszan [21], 33 from Kaliszan and Wujtewicz [22], and two from Al-Alousi et al. [13]. Equation (1) aided the evaluation of the cooling constants in each case. Without the initial rectal temperature of 37 °C, we assumed it to be 38 °C to retain enough data points for kc estimation in a meaningful statistical distribution. Figure 2 shows the distribution of the range of the cooling constant, kc. This distribution range of kc reflects the underlying reasons, such as body weight, height, gender, clothed, unclothed, and room temperature. Given this reality, we attempted to understand some of these variables on PMI, as shown in Appendix A.

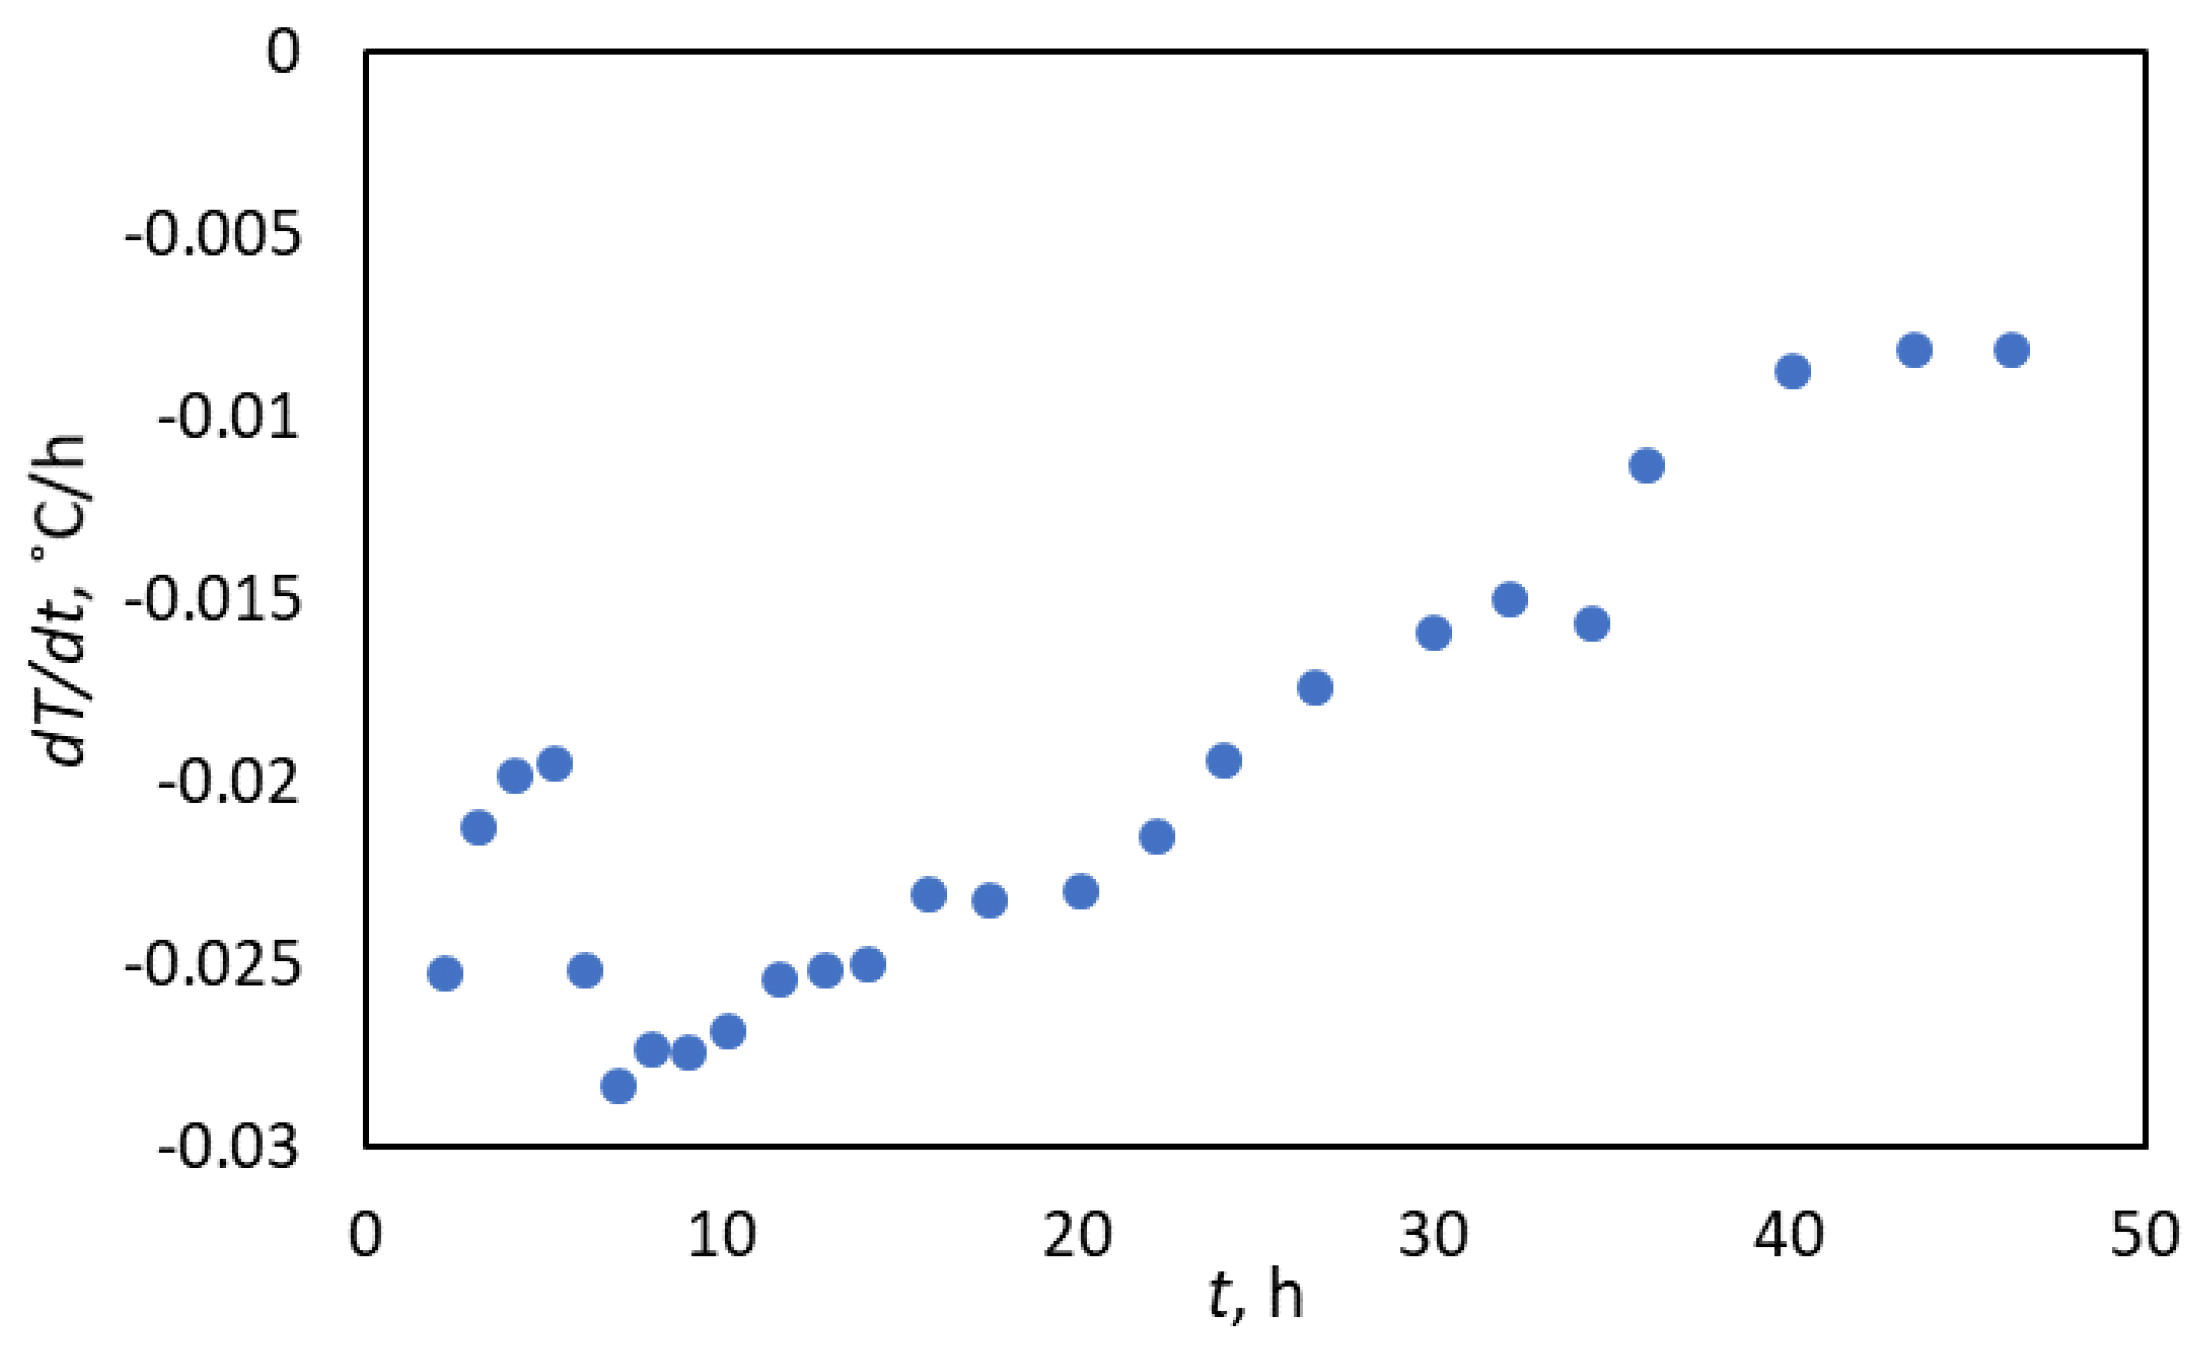
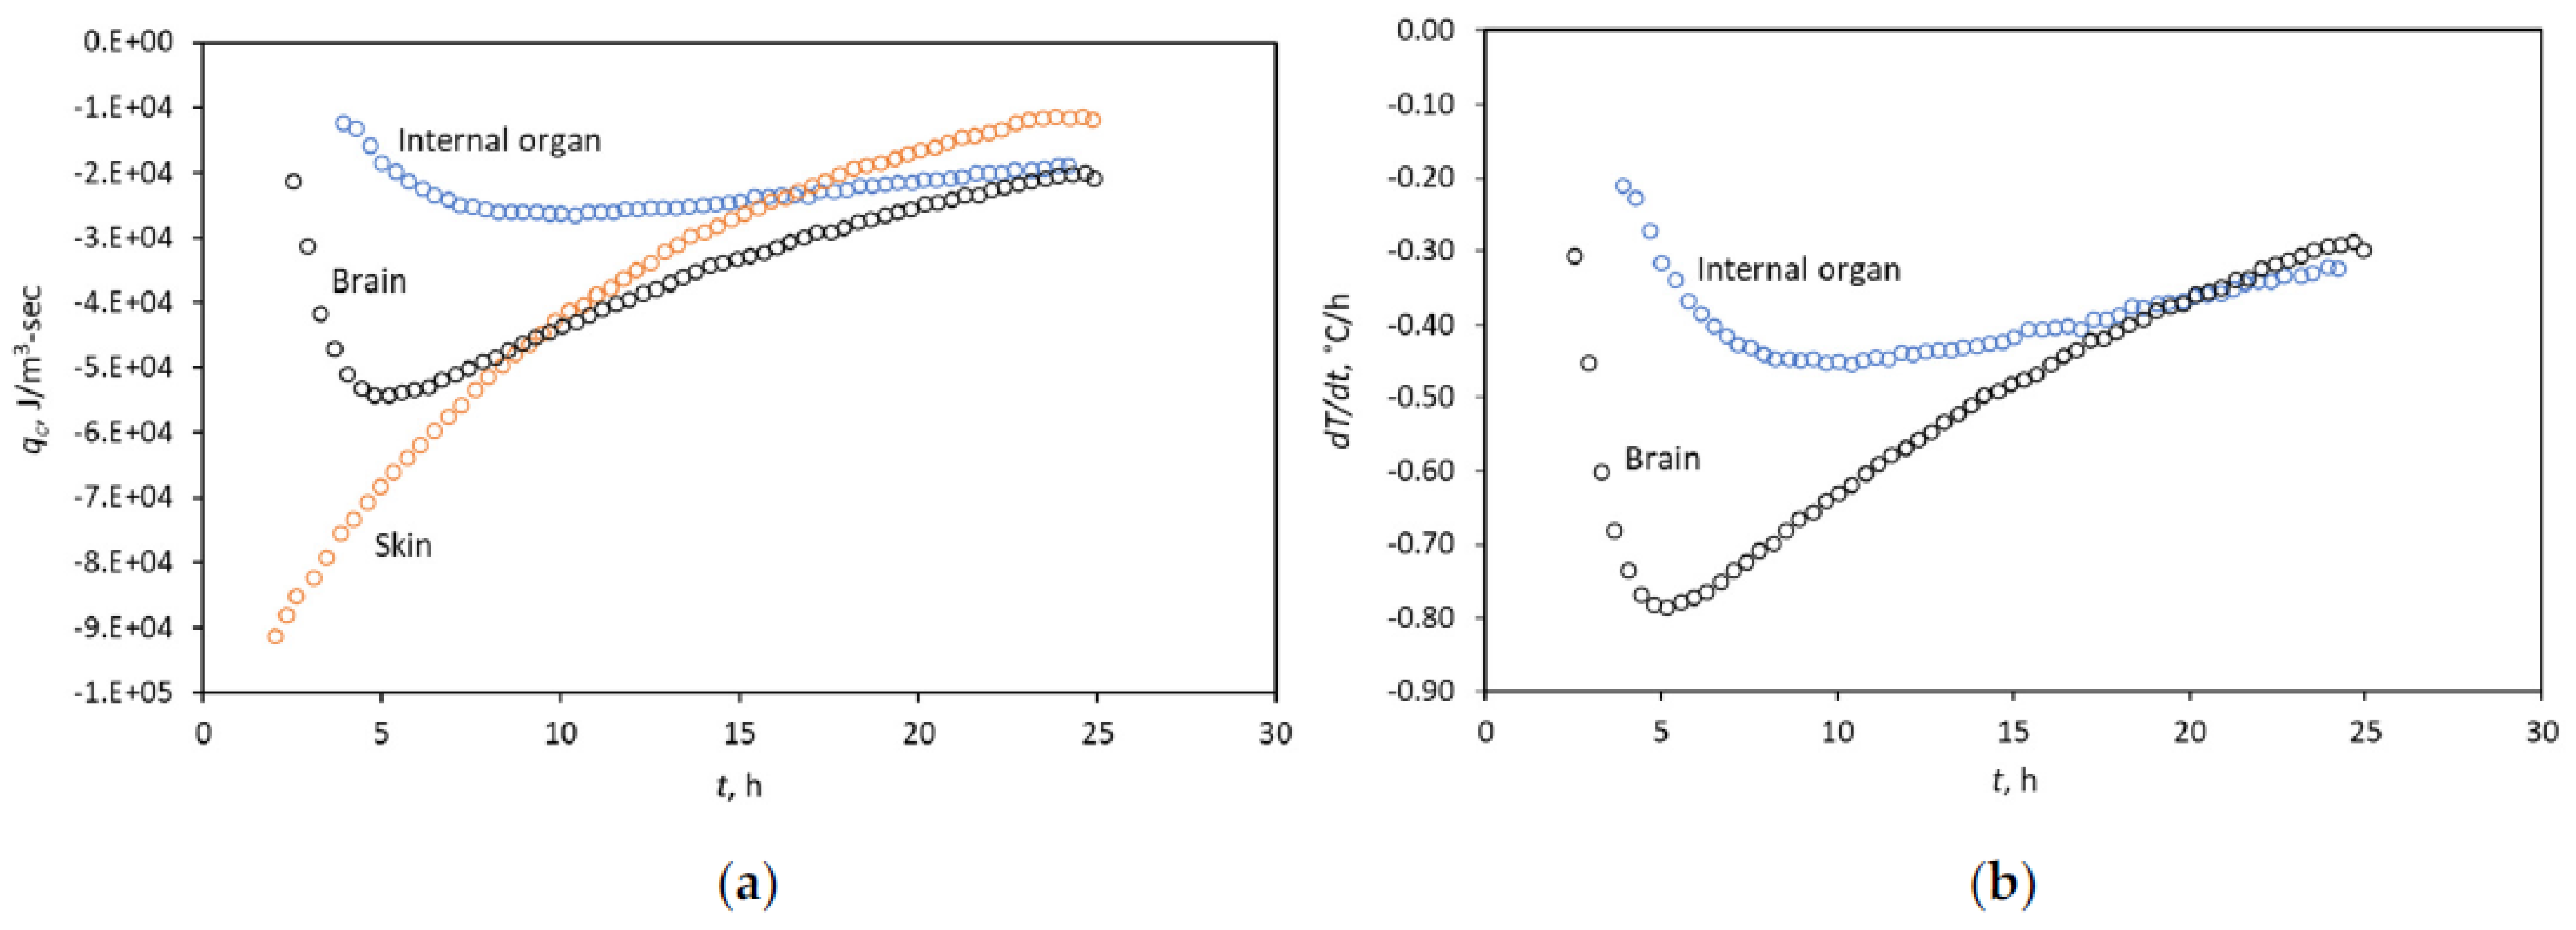
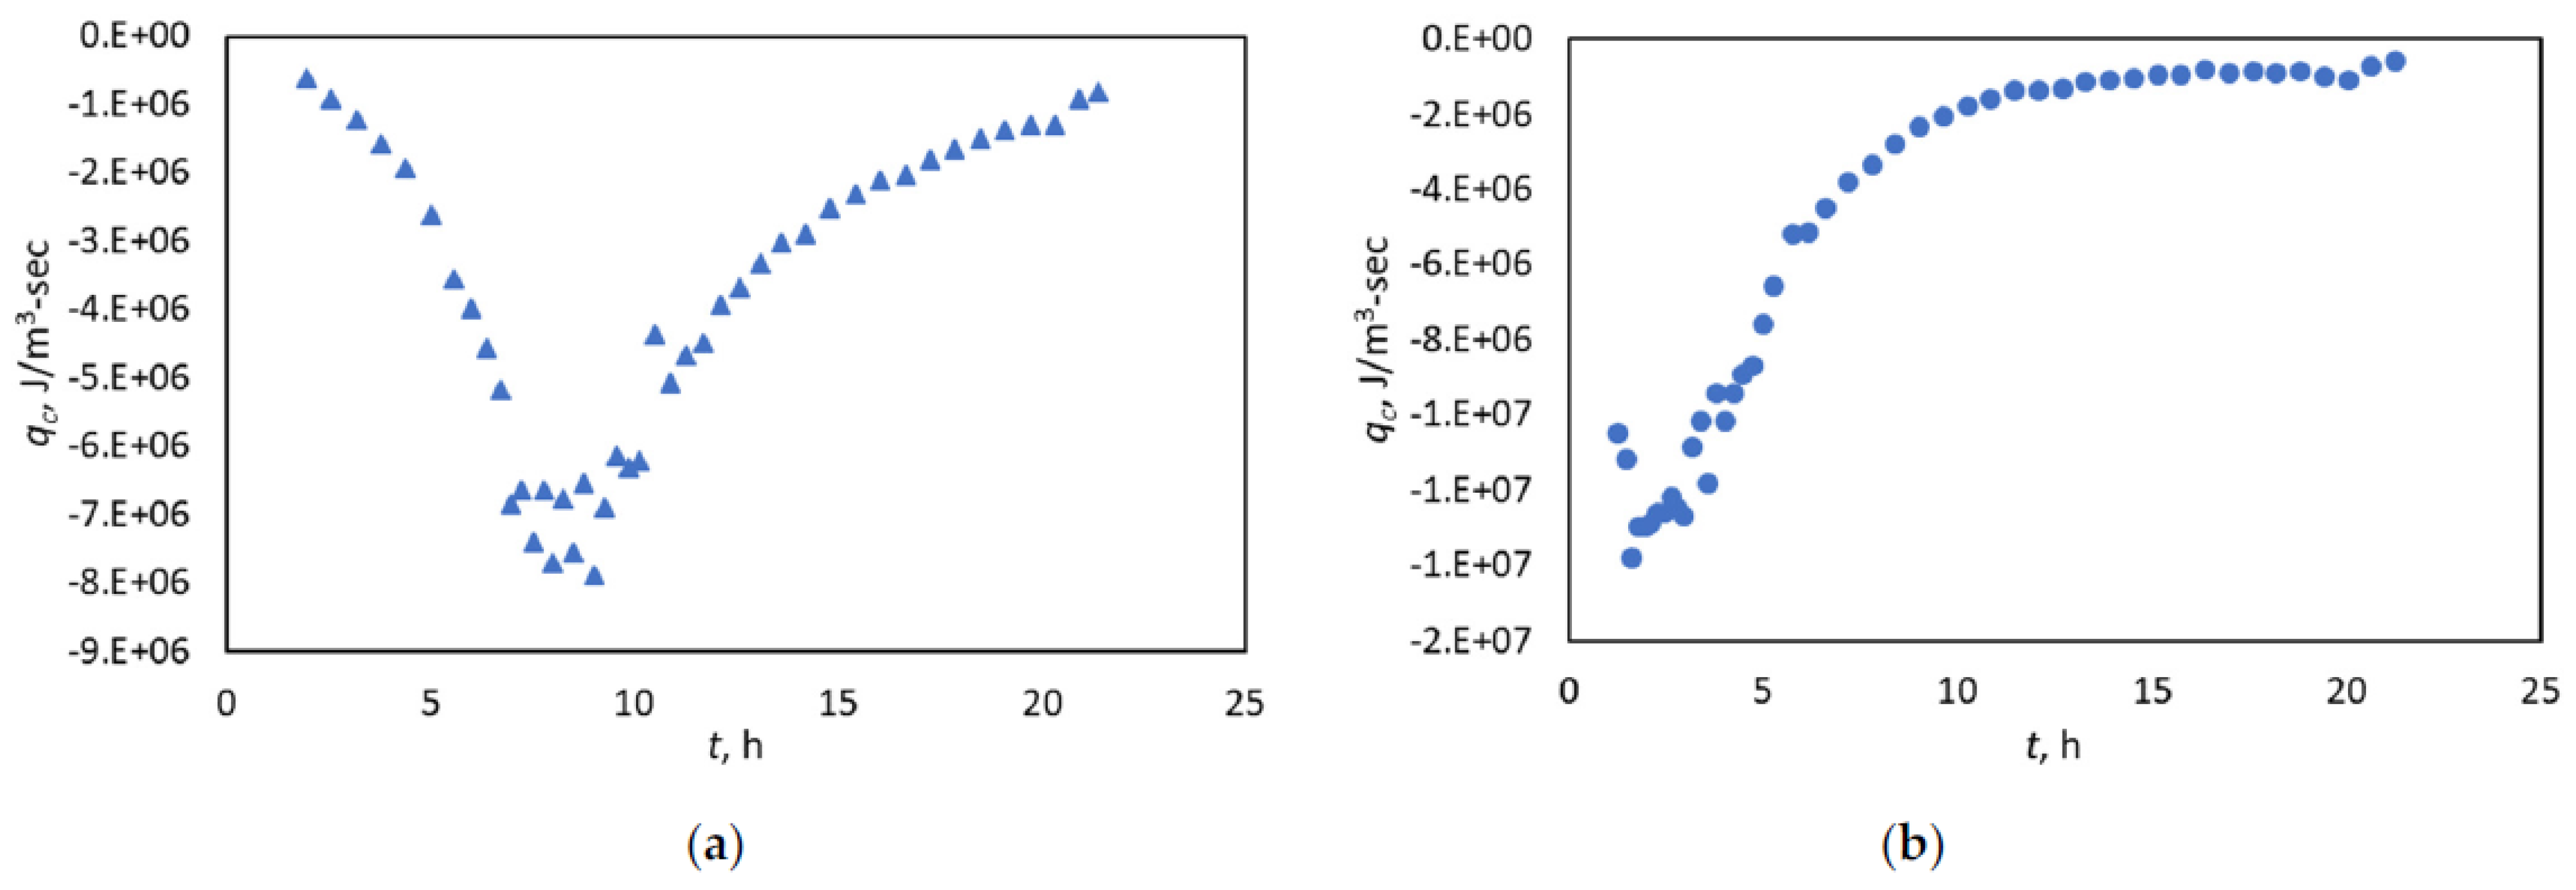
3.2. Diagnosing the Fitting Window with the Heat-Flow Rate

The synthetic data of Bartgis et al. [30], as displayed in Figure 1, generated with the 3-D heat-transfer model for different parts of the body, shows the following outcome of the heat-flow rate, qc. The non-monotonic signatures, as in Figure 3a, for both the brain and IO provide clues about two-time domains that need honoring while estimating the cooling constant. However, that is not so for the skin, where the monotonic signature appears. This non-monotonic trend helps ascertain the time window for estimating the cooling constant. Let us point out that estimation of the heat-flow rate is not needed; just the time-derivative of temperature suffices as Figure 3b exhibits, given that only the two parameters, ρt, and Ct, differ.
The non-monotonic trend of the temperature derivative also appeared for a case involving the liver, as a dataset from Al-Alousi et al. [12] showed; Figure 4 illustrates this point. Appendix A presents the relevant data for PMI estimation.
Finally, we present the heat-flow rate calculations of the IO and eye data that appeared in Kaliszan [21]; Figure 5a shows the IO trend, and that of the eye occurs in Figure 5b. The second exponential-fitting starts around 10 h in both cases, similar to the de Saram et al. [4] and Al Alousi and Anderson dataset [7]. As shown previously, the left side of the V-shaped signature assures reliable PMI results.
The critical point here is that in a closed system, such as in IO and brain, the early-time temperature data do not show a trend that one can extrapolate objectively to ascertain the PMI. In contrast, the temperature measured on the skin has a monotonous exponential tendency that leads to an objective solution. Of course, the ambient condition needs to be stable, such as an air draft that changes the room temperature for the linear extrapolation to be realistic. So, the lesson learned here is that real-time temperature data needs to be collected to ascertain the correct PMI over a long period.

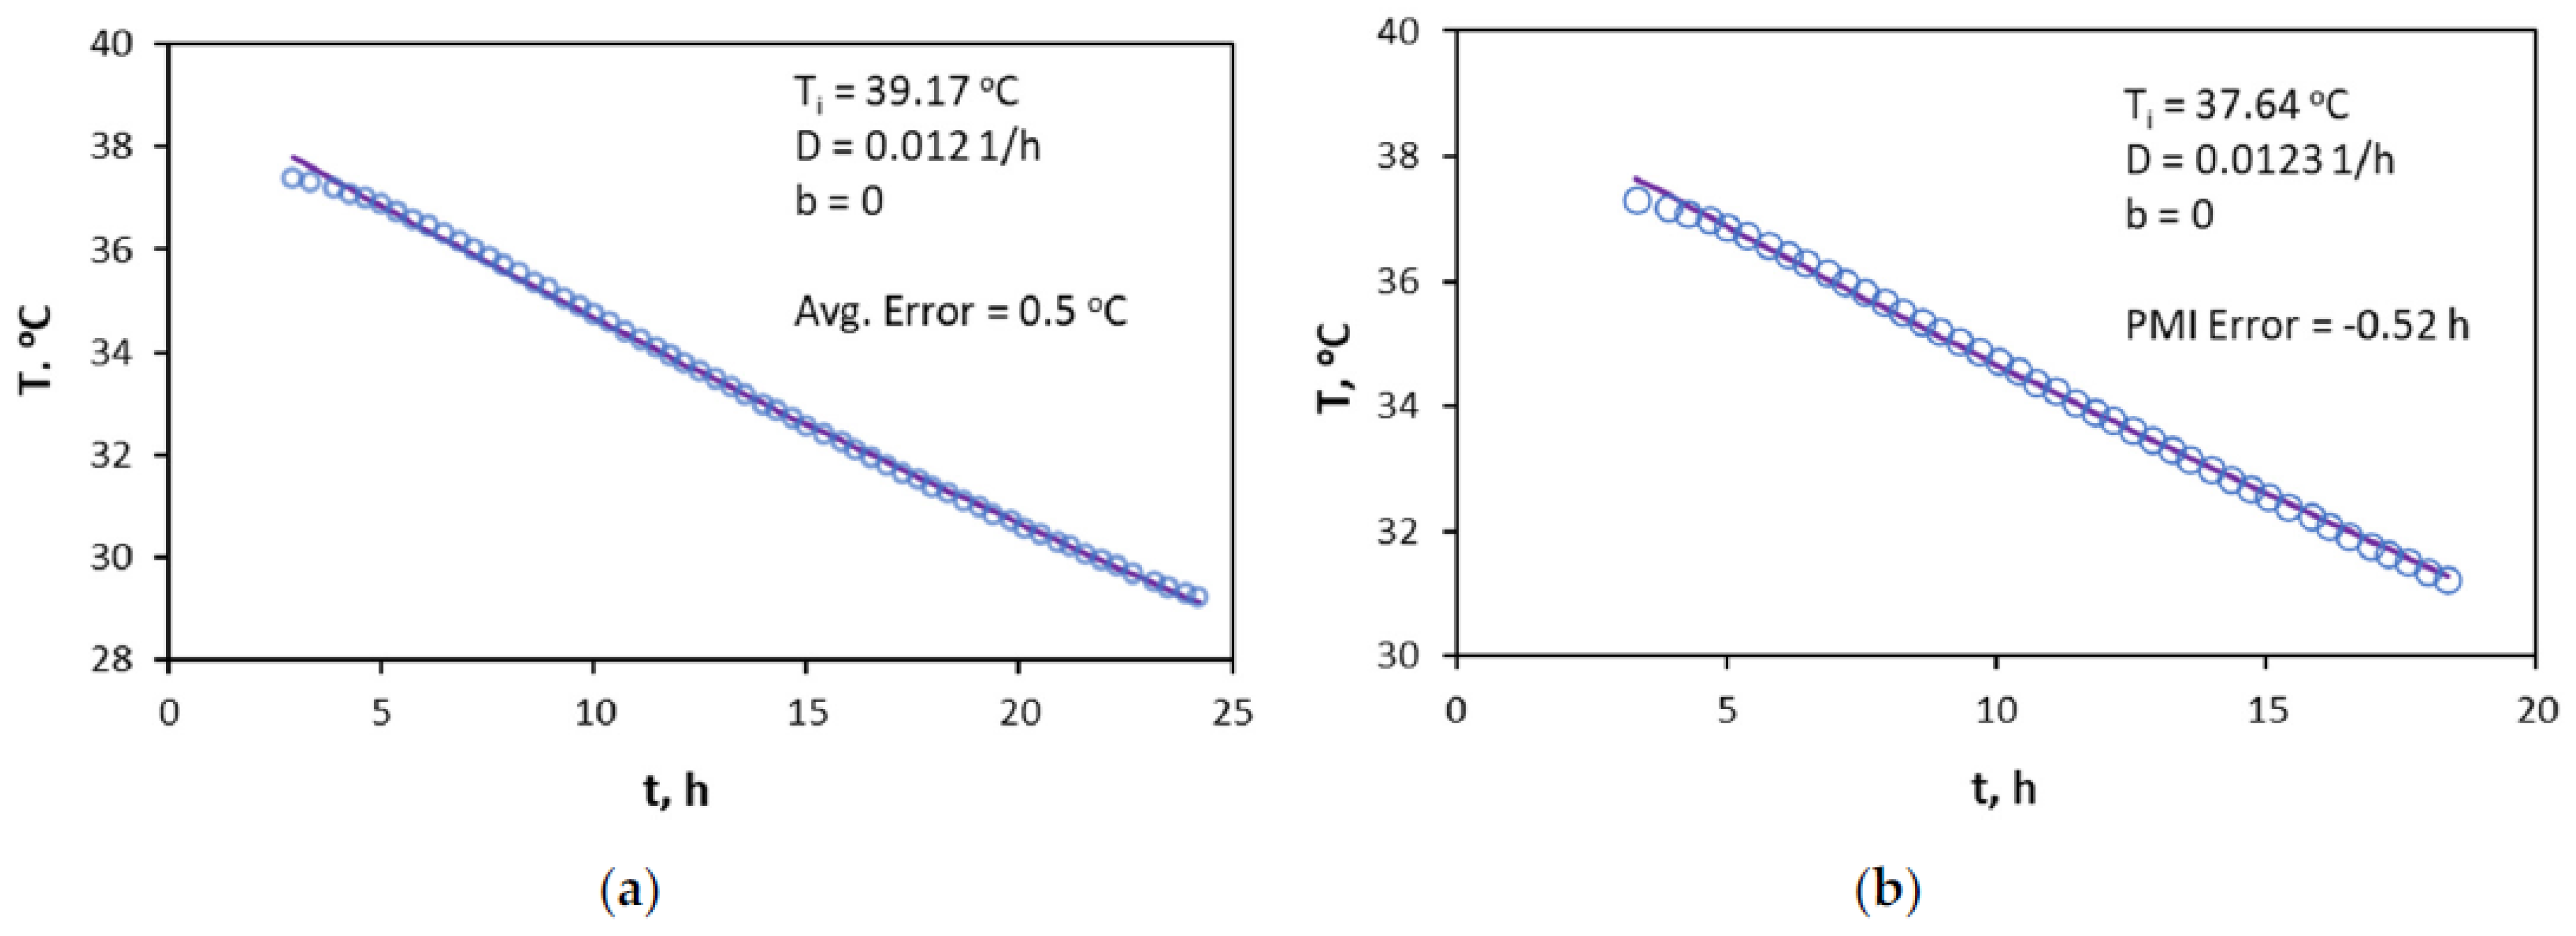
3.3. Application of the Hyperbolic Approach for PMI Estimation

Let us illustrate a couple of examples drawn from both the Bartgis et al. [30] and Wilk et al. [34] studies to demonstrate the performance of the hyperbolic approach for the PMI estimation. Figure 6a shows the efficacy of this tool when the high-density temperature data becomes available, such as that of Bartgis et al. The dimensionless decline parameter, b = 0, suggests an exponential decline for the brain, meaning Equation (8) applies. Figure 6b illustrates a similar fit with the data beyond five hours to gauge the PMI solution accuracy. In this case, the error turned out to be –0.52 h, which appears well within the acceptable accuracy. Note that this solution reflects a what-if scenario. Table 1 presents the overall solutions for 26 cases. The symbols represent data in Figure 6 and Figure 7, whereas the lines reflect the model response.
Wilk et al.’s [34] model response for four body parts appeared in the average-room-temperature environment and the low-temperature morgue. We attempt to reproduce only the model response in the pre-morgue situation. To that end, Figure 7a displays a Wilk et al. [34] dataset of Body B for the thigh. The overall fit appears to be of good quality with a hyperbolic trend of Equation (7), as the b value of 7.45 suggests. A similar hyperbolic trend persists for the dataset beyond 5 h, as Figure 8b indicates.
Despite the high-quality fit, the PMI error turned out to be 1.56 h. The lesson learned here is that the fit quality cannot assure a good PMI solution in a high b-value scenario. Nonetheless, the overall solution quality for 25 cases in Table 1 is very encouraging and reassuring for the applicability of the Arps method in diverse settings. The average PMI error for the 25 cases turns out to be 0.244 h, with a maximum error of 1.65 h. We note that some cases involve multiple time windows for the same dataset. We pursued this approach to gauge the proposed method’s efficacy.
Although the Arps’ hyperbolic approach works well from a stable room-temperature environment to a low-temperature morgue situation, the kink that appears during the body’s transition does not ensure a reasonable solution for the PMI. So, the proposed analytical approach works only in the one-temperature environment for realistic PMI estimation. In other words, the disruption of the monotonic temperature decay ushers a PMI solution uncertainty.
The contrasting temperature decline trends, as exhibited in the datasets of Bartgis et al. [30] and Wilk et al. [34], need understanding. Figure 8 illuminates the difference between the two. On the semilog plot in Figure 8a, the Bartgis et al. [30] data show the exponential trend by way of the straight line, following Newton’s law of cooling. In contrast, the Wilk et al. example exhibits a precipitous decline trend. As expected, the decline parameter D in the Arps’ equation supports the exponential trend with a singular value of D, wherein the b parameter is zero, as Figure 8b exhibits. Unsurprisingly, a declining D value appears for the non-monotonic change in the D value for the Wilk et al. [34] data. Note that given the commonality of the units for kc and D, 1/h, the D parameter in the Arps expression can be a surrogate of kc. Regardless, the Arps hyperbola can fit a range of decline trends with credible PMI solutions, which appears reassuring.
Let us keep in mind that Wilk et al. [34,35] studies have shown the availability of body imaging data, leading to high-frequency temperature output in various body parts. Despite their detailed numerical modeling approach [34], bodies B, C, and D mismatch with data gathered from chest, forehead, and thigh appear, except for the abdomen in all four cases. Overall, they showed that the PMI estimation accuracy remained largely constrained within one hour. In this context, the proposed hyperbolic approach provides a simple tool for validating the solution outcome generated by any other method during the pre-morgue situation. Note that one can fit the data in the post-morgue period with the hyperbola and extrapolate it to the initial condition. However, this outcome cannot yield the desired level of PMI accuracy due to the drastic change in the environmental condition during the transition period.
We estimated the hyperbola parameters using the Microsoft Excel solver’s functionality. Based on an initial assumption of b and D parameters, the solver minimized the sum of squared error between measured and predicted temperature for a given dataset. We constrained the upper limit of the b parameter to 10 to ensure credible solutions. We provide an Excel spreadsheet with specific instructions about estimating the PMI with time-lapse temperature measurements as Supplementary Materials.

4. Discussion

Although our exposure to modern datasets may be limiting, this investigation paved the way for learning a few valuable lessons for estimating the PMI. For instance, the cooling constant is person-specific; therefore, predicting the temperature-decline behavior demands time-variant data over several hours. Also, the early-time data (<7 h) behaves differently for the brain and IO than at late times involving more than 11 h. The change in temperature behavior can be detected by only taking its time-derivative. In contrast, the skin temperature declines monotonically, leading to fitting one exponential expression for a given body.
Bartgis et al. [30] show that the time constant also depends on the ambient condition. For instance, it can change from 8 h to 31 h when the brain’s ambient air temperature varies from 30 °C to 10 °C. They showed that the heat loss is lower for the IO. Overall, the ambient condition dictates the PMI window.
Lack of time-lapse data appears problematic on many fronts, mainly because the kc-parameter appears person-specific, in terms of age, gender, height, weight, clothing, among others, when the measurements occur in the internal organ. Groups of data, characterized by the kc-parameter in the de Saram et al. [4] datasets, support this notion. The body weight appears to be the most critical variable, meaning a body with a lower weight declines more rapidly than the one with a heavier weight.
We applied the well-known Henssge [9] nomogram technique for Bartgis et al. [30] internal organ and brain data. For this dataset, the body weight was 68 kg, and the ambient temperature of 20 °C. When we applied the nomogram method for the body temperature measurement of 31 °C, the PMI estimation turned out to be 10.1 ± 2.8 h, when the correct PMI corresponds to 19 h. Similarly, for the brain, the nomogram estimated PMI of 4.5 ± 1.5 h diverged from the correct PMI of 11.75 h. Overall, our limited use of the Henssge [9] nomogram suggests that the PMI solutions generated with this tool offer considerable uncertainty.
This study also suggests that the early-time data fitting can lead to realistic solutions when the temperature measurements occur in any body organ. A monotonic signature on the temperature-derivative plot involving a single-exponential trend appears for the skin. However, data fitting and extrapolation to time zero for the other body parts after 11 h present serious challenges, given the V-shaped temperature-derivative signature.
Given that our findings on applying the hyperbola anchors on synthetic data, the time-lapse data on actual human bodies become necessary to prove this conceptual approach. We note that the body’s movement to another temperature environment, such as a morgue, becomes an obstacle for applying this method. In that situation, the body imaging data reveals the necessary temperature data for the prior environment, as shown in Wilk et al. [34,35]. Then, one can use the proposed simple tool to validate the numerical model results in the pre-morgue situation.
Indeed, the Wilk et al. [34] article provided the necessary high-frequency data with new imaging technology to explore the application of other tools, such as the one proposed here. In contrast to the prior studies, Wilk et al. did not find any issue with any body part delivering non-monotonic signature with their numerical modeling approach. Perhaps a closer investigation needs doing to provide clarity on this issue. Their follow-up article [35] found that the average PMI solutions for five measurement locations to be −0.17 ± 1.63 h, whereas the reconstructed PMIs deviate no more than ±2.8 h. In this context, the results of this study show that the hyperbolic relation confines the PMI solution to within ±1.65 h. The overall PMI error for the 25 cases studied turns out to be 0.244 h.

5. Conclusions

In this study, we pursued using the hyperbolic approach for ascertaining PMI with synthetic data. Although this simple tool appears appealing, this proof of concept needs further validation with actual body-temperature data for applications in natural settings. The following conclusions seem pertinent here:
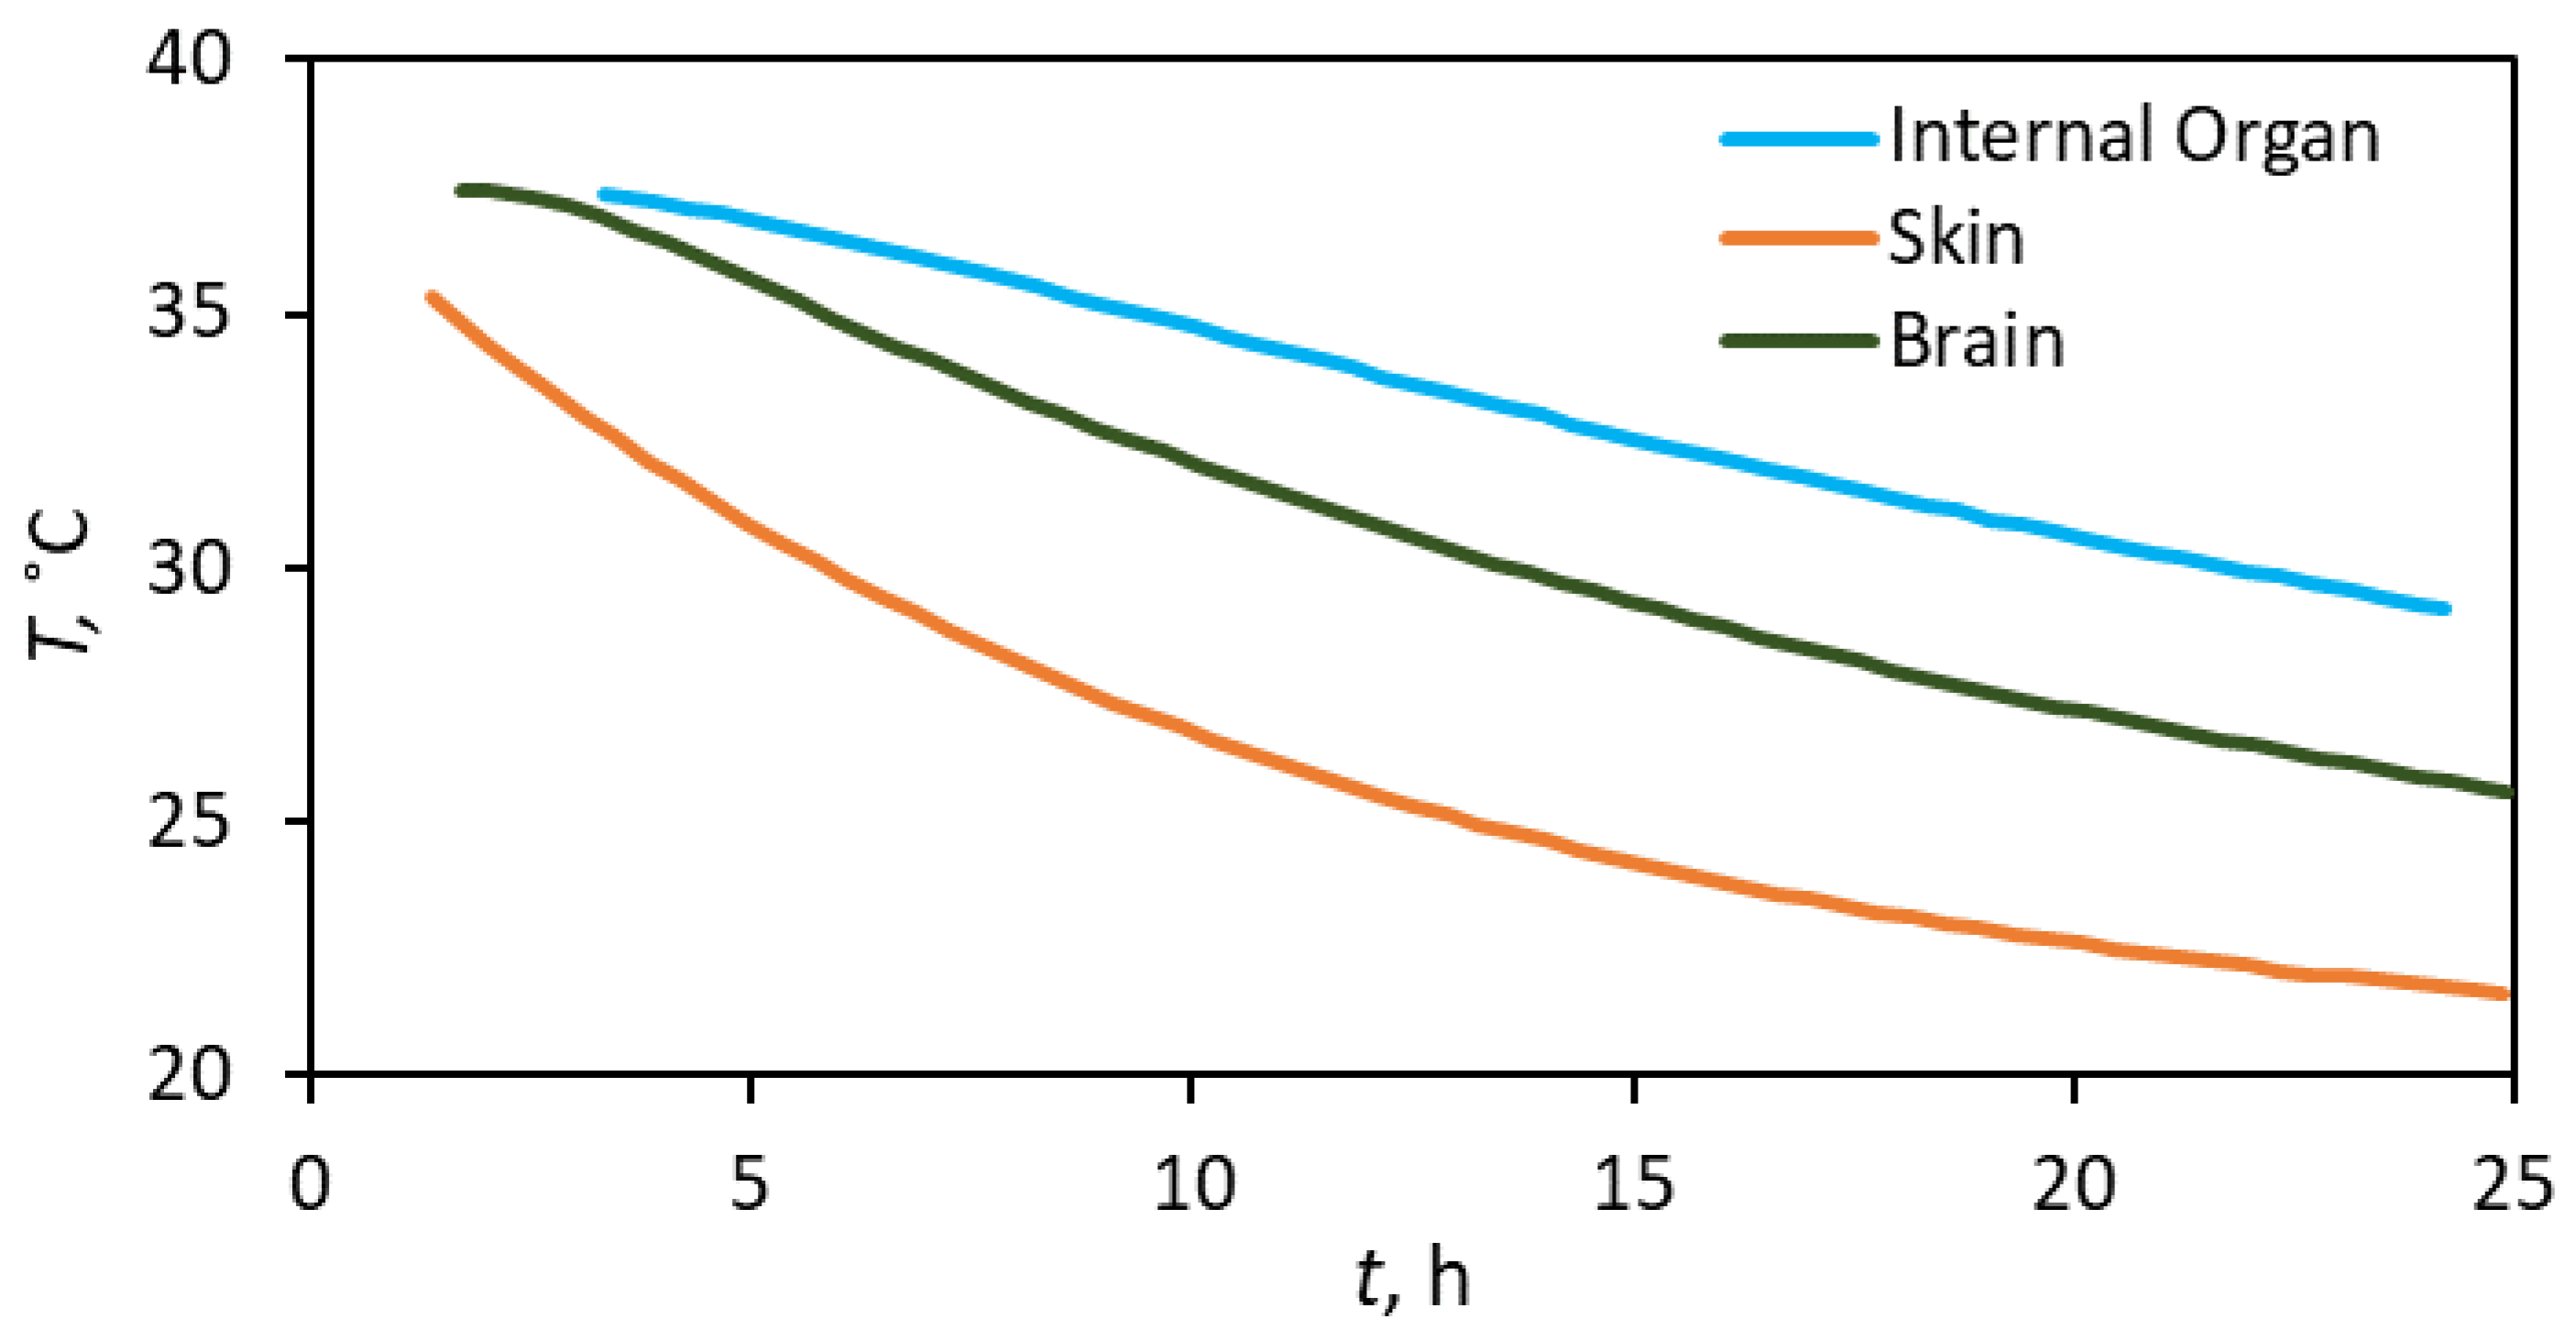
  • A rapid temperature decline rate occurs initially, followed by a slower pace, regardless of the body part. Therefore, the hyperbolic trend can describe the overall signature. As part of the general hyperbolic trend, the exponential decay may represent some aspects of the overall signature, but it does not appear systemic. Stated differently, the application of Newton’s law of cooling does not appear holistic in the body-temperature decline.
  • Ascertaining the PMI from a single-temperature data point appears challenging. Knowing both the initial body temperature and that of the room does not suffice, given that the cooling constant, kc, is dependent on an individual’s body characteristics and surrounding conditions. In other words, gathering time-lapse data appears a requirement for a reliable solution for estimating PMI.
  • The hyperbolic relation fits all monotonic trends, established either by temperature derivative or the heat-flow rate, regardless of the body part. This fitting leads to a high degree of PMI accuracy, that is, 0.24 h on average for the cases reported in this study.

Supplementary Materials

The following supporting information can be downloaded at: https://www.mdpi.com/article/10.3390/forensicsci2020030/s1, authors will share a spreadsheet to use the Arps fitting of data used in this study.

Author Contributions

Conceptualization, P.S. and C.S.K.; data curation, P.S. and C.S.K.; formal analysis, P.S. and C.S.K.; project administration, C.S.K.; writing, P.S. and C.S.K. All authors have read and agreed to the published version of the manuscript.

Funding

This research received no external funding.

Institutional Review Board Statement

Not applicable.

Informed Consent Statement

Not applicable.

Data Availability Statement

The datasets used in the study were digitized from the cited references. They can be made available upon request.

Conflicts of Interest

The authors have no conflict of interest.

Nomenclature

btime-derivative of D in Arps, dimensionless
Ctheat capacity of tissue, J/kg-°C
Dlog-time derivative of temperature in Arps, 1/h
kccooling constant, 1/h
qcheat-flow rate, J/m3.sec
ttime, h
Ttemperature, °C
Taambient temperature, °C
Tiinitial temperature at time of death, °C
dT/dttemperature gradient, °C/h
ρtdensity of tissue, kg/m3

Appendix A

Estimating the Cooling Constant with Limited Data

When we used some part of this dataset to gauge bodyweight influencing the kc, the general trend suggests that a lighter body declines faster than those with heavier counterparts, as Figure A1 testifies. This outcome makes intuitive sense from the standpoint of heat transfer in that a person with a higher body mass shields the interior, thereby decreasing the rate of cooling. Of course, other variables such as body fat may play roles that may be hard to discern, given that our dataset may be limiting. Let us present a few examples showing how limited time-lapse data can reveal the kc parameter.
Figure A1. The overall distribution of kc (a), kc appears to increase with decreasing body weight (b).
Forensicsci 02 00030 g0a1
Case 20 from de Saram et al. [4] had the following recordings of the IO temperatures, as shown in Table A1. Equation (5) can calculate the cooling constant using 12 a.m., 1 p.m., and 2 p.m. temperature recordings. The outcome of cooling constant calculations appears in Table A2. The results show the sensitivity of solution accuracy with increasing timespan vis-à-vis the cooling constant. A longer time interval between subsequent measurements improves the estimation of PMI. Another observation is that making multiple temperature recordings and using the average cooling rate also provided the same accuracy in PMI estimation.
This example illustrates that PMI estimation becomes more accurate with multiple recorded temperatures. The longer duration between two recordings helps minimize the PMI error, but if such measurements appear infeasible, the average cooling rate from multiple measures improves solution accuracy.
We performed similar calculations for the data collected from covered bodies, as Al-Alousi et al. [12] reported. Table A3 provides the results of the internal organ, and Table A4 that of the brain. As observed earlier, the merit of increasing the period to improve solution accuracy becomes transparent.
Let us review the steps taken to calculate the decline rate for the cases mentioned in Kaliszan [21] and Kaliszan and Wujtewicz [22]. For instance, in Case 1 of Kaliszan and Wujtewicz [22], the reported IO temperature was 36.3 °C, and the PMI of 2.0833 h. A regression analysis evaluated the cooling constant (0.075 °C/h) and the resultant PMI to be 2.3 h.
Table A1 shows the uncertainty of estimating the PMI depending on the time window of data trends. This uncertainty increases when the data range exceeds 10 h, as shown in Table A2. This outcome becomes evident, given the V-shaped signature of the overall trend occurs around 9 h.
Table A1. Reported data for Case 20 (after de Saram et al. [4]).
Time of Death8:30:00 a.m.
Temperature at time of death (Ti)38.22 °C
Ambient Temperature (Ta)30.61 °C
Temperature at 12 a.m.36.61 °C
Temperature at 1 PM36.17 °C
Temperature at 2 PM35.83 °C
Table A2. Internal organ temperature results (after de Saram et al. [4]).
Time Intervalkc (1/h)Estimated PMI (h)Actual PMI (h)Difference (min)
12 a.m.–1 p.m.0.076963.093.525
1 p.m.–2 p.m.0.0618753.843.5−21
12 a.m.–2 p.m.0.0694183.433.54
Avg (12 a.m.–1 p.m.) and (1 p.m.–2 p.m.)0.0694183.403.54
Table A3. Internal organ temperature results (after Al Alousi et al. [12]).
Time Intervalkc (1/h)Estimated PMI (h)Actual PMI (h)Difference (min)
2 to 4 h0.052.192.13−4
2 to 6 h0.052.212.13−5
Table A4. Brain temperature results (after Al Alousi et al. [12]).
Time Intervalkc (1/h)Estimated PMI (h)Actual PMI (h)Difference (min)
1 to 2 h0.170.801.2024
1 to 4 h0.150.941.2015
1 to 5 h0.141.021.2011

References

  1. Rainy, H. On the cooling of dead bodies as indicating the length of time since death. Glasg. Med. J. 1968, 1, 323–330. [Google Scholar]
  2. Kaliszan, M.; Hauser, R.; Kaliszan, R.; Wiczling, P.; Buczyñski, J.; Penkowski, M. Verification of the exponential model of body temperature decrease after death in pigs. Exp. Physiol. 2005, 90, 727–738. [Google Scholar] [CrossRef] [PubMed]
  3. Noakes, L.D.; Flint, T.; Williams, J.H.; Knight, B.H. The application of eight reported temperature-based algorithms to calculate the postmortem interval. Forensic Sci. Int. 1992, 54, 109–125. [Google Scholar] [CrossRef]
  4. De Saram, G.; Webster, G.; Kathirgamatamby, N. Post-mortem temperature at time of death. J. Crim. Law Criminol. Police Sci. 1955, 46, 562–577. [Google Scholar] [CrossRef]
  5. Fiddes, F.; Patten, T.A. Percentage method for representing the fall in body temperature. J. Forensic Med. 1958, 5, 2–15. [Google Scholar]
  6. Marshall, T.K.; Hoare, F. Estimating the time since death—The rectal cooling after death and its mathematical representation. J. Forensic Sci. 1962, 7, 56–81. [Google Scholar]
  7. Al-Alousi, L.M.; Anderson, R.A. A non-invasive method for postmortem temperature measurements using a microwave probe. Forensic Sci. Int. 1994, 64, 35–46. [Google Scholar] [CrossRef]
  8. Green, M.; Wright, J. Postmortem interval estimation from body temperature data only. Forensic Sci. Int. 1985, 28, 35–46. [Google Scholar] [CrossRef]
  9. Henssge, C. Death time estimation in case work. I. The rectal temperature time of death nomogram. Forensic Sci. Int. 1988, 36, 209–236. [Google Scholar] [CrossRef]
  10. Marshall, T.K. Estimating the time of death. J. Forensic Sci. 1962, 7, 210–221. [Google Scholar]
  11. Marshall, T.K. Temperature methods of estimating the time of death. Med. Sci. Law 1965, 4, 224–232. [Google Scholar] [CrossRef] [PubMed]
  12. Al-Alousi, L.M.; Anderson, R.A.; Worster, D.M.; Land, D.V. Factors influencing the precision of estimating the postmortem interval using the triple-exponential formulae (TEF) Part I. A study of the effect of body variables and covering of the torso on the postmortem brain, liver and rectal cooling rates in 117 forensic cases. Forensic Sci. Int. 2002, 125, 223–230. [Google Scholar] [PubMed]
  13. Al-Alousi, L.M.; Anderson, R.A.; Worster, D.M.; Land, D.V. Factors influencing the precision of estimating the postmortem interval using the triple-exponential formulae (TEF) Part II. A study of the effect of body temperature at the moment of death on the postmortem brain, liver and rectal cooling rates in 117 forensic cases. Forensic Sci. Int. 2002, 125, 231–236. [Google Scholar] [CrossRef] [PubMed]
  14. Mall, G.; Eisenmenger, W. Estimation of time since death by heat-flow Finite-Element model. Part I: Method, model, calibration and validation. Leg. Med. 2005, 7, 1–14. [Google Scholar] [CrossRef] [PubMed]
  15. Mall, G.; Eisenmenger, W. Estimation of time since death by heat-flow Finite-Element model. Part II: Application to non-standard cooling conditions and preliminary results in practical casework. Leg. Med. 2005, 7, 69–80. [Google Scholar] [CrossRef]
  16. Rodrigo, M.R. Time of death estimation from temperature readings only: A Laplace transform approach. Appl. Math Lett. 2015, 39, 47–52. [Google Scholar] [CrossRef]
  17. Smart, J.L. Estimation of time of death with a Fourier series unsteady-state heat transfer model. J. Forensic Sci. 2010, 55, 1481–1487. [Google Scholar] [CrossRef]
  18. Baccino, E.; Martin, L.D.S.; Schuliar, Y.; Guilloteau, P.; Rhun, M.L.; Morin, J.F.; Leglise, D.; Amice, J. Outer ear temperature and time of death. Forensic Sci. Int. 1996, 83, 133–146. [Google Scholar] [CrossRef]
  19. Smart, J.L.; Kaliszan, M. The postmortem temperature plateau and its role in the estimation of time of death. A review. Leg. Med. 2012, 14, 55–62. [Google Scholar] [CrossRef]
  20. Kaliszan, M. First practical applications of eye temperature measurements for estimation of time of death in casework. Report of three cases. Forensic Sci. Int. 2012, 219, e13–e15. [Google Scholar] [CrossRef]
  21. Kaliszan, M. Studies on time of death estimation in the early postmortem period—Application of a method based on eyeball temperature measurement to human bodies. Leg. Med. 2013, 15, 278–282. [Google Scholar] [CrossRef] [PubMed]
  22. Kaliszan, M.; Wujtewicz, M. Eye temperature measured after death in human bodies as an alternative method of time of death estimation in the early postmortem period. A successive study on new series cases with exactly known time of death. Leg. Med. 2019, 38, 10–13. [Google Scholar] [CrossRef] [PubMed]
  23. Nelson, E.L. Estimation of short-term postmortem interval utilizing core body temperature: A new algorithm. Forensic Sci. Int. 2000, 109, 31–38. [Google Scholar] [CrossRef]
  24. Laplace, K.; Baccino, E.; Peyron, P.-A. Estimation of the time since death based on body cooling: A comparative study of four-temperature based models. Int. J. Leg. Med. 2021, 135, 2479–2487. [Google Scholar] [CrossRef]
  25. Baccino, E.; Cattaneo, C.; Jouineau, C.; Poudoulec, J.; Martrille, L. Cooling rates of the ear and brain in pig heads submerged in water: Implications for postmortem interval estimation of cadavers found in still water. Am. J. Forensic Med. Pathol. 2007, 28, 80–85. [Google Scholar] [CrossRef]
  26. Napoli, P.E.; Nioi, M.; Gabiati, L.; Laurenzo, M.; De-Giorgio, F.; Scorcia, V.; Grassi, S.; d’Aloja, E.; Fossarello, M. Repeatability and reproducibility of postmortem central corneal thickness measurements using a portable optical coherence tomography system in humans: A prospective multicenter study. Sci. Rep. 2020, 10, 14508. [Google Scholar] [CrossRef]
  27. Locci, E.; Stocchero, M.; Noto, A.; Chighine, A.; Natali, L.; Napoli, P.E.; Caria, R.; De-Giorgio, F.; Nioi, M.; D’Aloja, E. A 1H NMR metabolomic approach for the estimation of the time since death using aqueous humour: An animal model. Metabolomics 2019, 15, 76. [Google Scholar] [CrossRef]
  28. Locci, E.; Stocchero, M.; Gottardo, R.; De-Giorgio, F.; Demontis, R.; Nioi, M.; Chighine, A.; Tagliaro, F.; D’Aloja, E. Comparative use of aqueous humour 1H NMR metabolomics and potassium concentration for PMI estimation in an animal model. Int. J. Leg. Med. 2021, 135, 845–852. [Google Scholar] [CrossRef]
  29. Zilg, B.; Alkass, K.; Berg, S.; Druid, H. Interpretation of postmortem vitreous concentrations of sodium and chloride. Forensic Sci. Int. 2016, 263, 107–113. [Google Scholar] [CrossRef]
  30. Bartgis, C.; LeBrun, M.; Ma, R.; Zhu, L. Determination of time of death in forensic science via a 3-D whole body heat transfer model. J. Therm. Biol. 2016, 62, 109–115. [Google Scholar] [CrossRef]
  31. Sharma, P.; Al Saedi, A.; Kabir, C.S. Assessing the hyperbolic trend in well response involving pressure, fluid and heat-flow rates. J. Nat. Gas Sci. Eng. 2020, 78, 103292. [Google Scholar] [CrossRef]
  32. Lyle, H.; Cleveland, F. Determination of the time of death by heat loss. J. Forensic Sci. 1956, 1, 11–24. [Google Scholar]
  33. Kanawaku, Y.; Kanetake, J.; Komiya, A.; Maruyama, S.; Funayama, M. Computer simulation for post-mortem cooling process in the outer ear. Leg. Med. 2007, 9, 55–62. [Google Scholar] [CrossRef] [PubMed]
  34. Wilk, L.S.; Hoveling, R.J.M.; Edelman, G.J.; Hardy, H.J.J.; van Schouwen, S.; van Venrooij, H.; Aalders, M.C.G. Reconstructing the time since death using noninvasive thermometry and numerical analysis. Sci. Adv. 2020, 6, eaba4243. [Google Scholar] [CrossRef]
  35. Wilk, L.S.; Edelman, G.J.; Roos, M.; Clerkx, M.; Dijkman, I.; Melgar, J.V.; Oostra, R.-J.; Aalders, M.C.G. Individualised and non-contact postmortem interval determination of human bodies using visible and thermal 3D imaging. Nat. Commun. 2021, 12, 5997. [Google Scholar] [CrossRef]
Figure 1. Skin temperature recording exhibits the steepest decline among the three measurements points (after Bartgis et al. [30]).
Forensicsci 02 00030 g001
Figure 2. The cooling constant (kc) distribution for 102 cases involving internal organs.
Forensicsci 02 00030 g002
Figure 3. Heat flow rate estimation of the three body parts with the synthetic data (a), and temperature derivative identifies the cooling trend (b), after Bartgis et al. [30].
Forensicsci 02 00030 g003
Figure 4. Temperature derivate identifies the cooling trend in the liver, after Al Alousi et al. [12].
Forensicsci 02 00030 g004
Figure 5. The heat-flow rate response of the Kaliszan [21] dataset; the faster cooling rate for the eye (b) than internal organ (a).
Forensicsci 02 00030 g005
Figure 6. Good overall fit quality appears for the brain (a), and a small PMI-estimation error beyond three hours (b).
Forensicsci 02 00030 g006
Figure 7. Gauging overall fit quality for Case B Thigh (a) and the PMI estimation error beyond five hours (b).
Forensicsci 02 00030 g007
Figure 8. The semi-log plot exhibits contrasting temperature decline behaviors in the two cases (a), and the D parameter reaffirms the two trends (b). In this figure, Hyperbolic represents Wilk et al. [34] (Case D Forehead), whereas Exponential shows Bertgis et al. [30] (Brain) data.
Forensicsci 02 00030 g008
Table 1. PMI analysis with the Arps method (Equation (6)) for various body parts.
SourceBody PartStart of Fitting Window, hEstimated PMI, hActual PMI, hΔPMI, hb-Factor, DimensionlessD, 1/h
Bertgis et al.Internal Organ32.83.30.500.012
Bertgis et al.Internal Organ53.75.01.300.012
Bertgis et al.Internal Organ98.29.31.200.012
Bertgis et al.Brain33.83.3−0.500.017
Bertgis et al.Brain55.85.2−0.600.017
Bertgis et al.Brain910.19.3−0.800.017
Wilk et al.Case B-Abdomen33.23.50.38.50.032
Wilk et al.Case B-Abdomen55.35.60.38.50.020
Wilk et al.Case B-Abdomen910.09.7−0.38.10.012
Wilk et al.Case B-Forehead33.63.1−0.55.30.039
Wilk et al.Case B-Forehead55.45.60.25.80.027
Wilk et al.Case B-Forehead97.89.41.66.70.018
Wilk et al.Case B-Thighs35.13.0−2.14.50.030
Wilk et al.Case B-Thighs56.75.1−1.64.70.024
Wilk et al.Case B-Thighs98.89.91.16.10.017
Wilk et al.Case B-Chest33.23.1−0.1100.028
Wilk et al.Case B-Chest55.15.20.1100.018
Wilk et al.Case B-Chest99.59.40.0100.010
Wilk et al.Case C-Forehead32.13.31.2100.046
Wilk et al.Case C-Forehead55.45.2−0.2100.018
Wilk et al.Case C-Abdomen910.810.0−0.850.014
Wilk et al.Case D-Forehead33.14.21.1100.032
Wilk et al.Case D-Forehead55.15.60.5100.019
Wilk et al.Case D-Abdomen32.93.50.69.110.034
Wilk et al.Case D-Abdomen55.86.50.89.170.018
Wilk et al.Case D-Abdomen98.59.40.99.10.012
Publisher’s Note: MDPI stays neutral with regard to jurisdictional claims in published maps and institutional affiliations.

