Article

Anopheles neivai (Diptera: Culicidae) Morphogenetic Analysis from the Pacific Coast to the Premontane Humid Forest of Colombia

by
Nicole Vargas-García
1,*,
Sebastián Canas-Bermúdez
1,
Ranulfo González-Obando
1,
Heiber Cárdenas
2 and
Nelson Rivera-Franco
3
1
Grupo de Investigaciones Entomológicas (GIE), Departamento de Biología, Facultad de Ciencias Naturales y Exactas, Universidad del Valle, Cali 25360, Colombia
2
Grupo de Estudios Ecogenéticos y de Biología Molecular, Departamento de Biología, Facultad de Ciencias Naturales y Exactas, Universidad del Valle, Cali 25360, Colombia
3
Laboratorio en Técnicas y Análisis Ómicos Tao-Lab, Departamento de Biología, Facultad de Ciencias Naturales y Exactas, Universidad del Valle, Cali 25360, Colombia
*
Author to whom correspondence should be addressed.
Taxonomy 2025, 5(3), 48; https://doi.org/10.3390/taxonomy5030048
Submission received: 27 July 2025 / Revised: 31 August 2025 / Accepted: 3 September 2025 / Published: 5 September 2025

Abstract

In specific altitude ranges, biotic and abiotic factors can impact vector mosquitoes’ adaptation capacity, affecting their population differentiation. This study analyses if there exist morphological and genetic differences in four Anopheles (Kerteszia) populations in specific altitude ranges from the Colombian pacific coast to the premontane humid forests in Valle del Cauca, Colombia. Likewise, it is compared if the vector mosquito groups analyzed were genetically similar to the ones available in the region. Traditional and geometric morphometric analysis and the molecular marker CO-I were used. The research found that vector mosquitoes’ littoral populations differentiated morphologically according to their cross veins wing shapes compared to the other three groups in higher altitudes. Their genetic distances fluctuate between 4.95% and 6.84%, indicating that vector mosquitoes’ littoral populations belong to Anopheles neivai s.s. while the ones of higher altitudes are related to An. neivai 8—a lineage previously proposed based solely on molecular data. The study concludes that vector mosquitoes at the pacific Colombian coast from the littoral area in lower altitudes maintain a vast genetic variability with uniform populations; however, in higher altitudes, vector mosquitoes acquire molecular and morphological differences that may include the settlement of other lineages.

1. Introduction

Altitude provides a combination of biotic and abiotic factors that affect mosquitoes’ bionomics [1]. The availability of feeding sources such as mammals, birds, and reptiles varies according to altitude gradients [2]. Therefore, variations in blood feeding frequency can influence mosquito population density. Additionally, the heterogeneity and abundance of breeding sites have often been associated with intraspecific and interspecific competition, which can affect adult mosquito size and, consequently, the transmission dynamics of mosquito-borne diseases [3,4]. Furthermore, temperature variations during mosquito larval development alter wing size [5]. Therefore, one of the methods employed in this study was geometric morphometric analysis of wing shape variation.
Wing morphometrics in Anopheles mosquitoes is an increasingly important tool in medical entomology and vector ecology, as it quantifies wing shape and size to reveal subtle population-level variations driven by environmental factors [6,7]. Such differences—often undetectable by traditional morphology—are associated with temperature [8], humidity, vegetation, water bodies [9], and altitude [6,7], which are all critical in shaping vector distribution and behaviour. Understanding these links is essential for identifying local populations with enhanced transmission potential [6], distinguishing cryptic species with differing epidemiological roles [9], and assessing the effects of climate change and habitat alteration on malaria dynamics [10]. Furthermore, geometric morphometrics offers a robust statistical framework to analyze phenotypic variation and infer evolutionary processes, such as natural selection or genetic drift, in response to environmental pressures [6,9].
Whether altitude affects mosquito wing morphology remains unclear. In Colombia, few studies have examined such morphological adjustments in the context of climate change [8,11]. Mosquito vectors can undergo physiological adaptations in response to environmental demands [7]. Phenotypic plasticity plays a key role in their ability to acclimate and adapt to changing environments [1]. Moreover, morphological variation and environmental factors may influence the extent of gene flow, potentially increasing population differentiation among mosquito vectors [12]. Higher altitudes may pose emerging public health risks, particularly in megadiverse regions with socioeconomically vulnerable populations.
Therefore, Anopheles (K) neivai s.l. was selected for analysis due to its broad geographical and historical distribution across the Americas. Populations of this species, found from southern Mexico to Bolivia, Brazil, and northern Peru [13], have been grouped into eight lineages based on COI barcode region analyses [14]. In Colombia, their distribution spans altitudes from 0 to 1600 m, corresponding mainly to An. neivai s.s. original topotypes [15]. However, some molecular studies suggest the existence of a distinct lineage at higher altitudes [14,16], contrasting with populations found in the lowland regions.
Like other mosquitoes of the Kerteszia subgenus, An. neivai s.s. is characterized by adaptation and distribution patterns that are closely associated with bromeliads during their larval development [17,18]. In Colombia, they are still considered a secondary malaria vector. Their unique habitat and crepuscular behaviour [19] have tightly linked An. neivai to malaria transmission [16,18,19]. Residual malaria caused by An. neivai remains a growing public health concern in Colombia. This is partly due to their biting behaviour and domiciliary activity, which are not effectively targeted by current vector elimination and control strategies established by the WHO and implemented by local and national authorities [20].
The objective of our study was to estimate the morphometric and genetic differences among populations of Anopheles (Kerteszia) neivai distributed across different altitudinal ranges, from the Colombian Pacific coast to the premontane humid forests of the Valle del Cauca department, in order to determine the impact of biotic and abiotic factors on their population differentiation and to assess the possible existence of distinct lineages within these vector populations. This objective stems from the study’s aim to compare populations across altitudinal gradients in order to identify morphological variations (such as wing vein shape) and to establish genetic relationships using molecular markers.
Through this research, we also aimed to contribute to the scientific knowledge base regarding An. neivai populations at higher altitudes, which have not been previously studied in the Colombian Pacific region [21,22,23]. To address our research questions, we focused on females and applied traditional morphometric methods, the geometric morphometric analysis of wings, and sequencing of the COI gene. Furthermore, we identified costal wing spot patterns in different populations. Finally, we evaluated possible evolutionary forces as neutral processes and selective pressures that may have influenced wing shape variation, using the QST-FST approach [24].

2. Materials and Methods

2.1. Study Sites

Sampling was conducted at four altitudinal gradients ranging from 0 to 1100 m above sea level in Valle del Cauca, Colombia (Figure 1).
The following altitudinal gradient correspond to La Barra (3°58′03.02″ N; 77°22′33.31″ W to 5 m above sea level, hereafter m a.s.l.), Bajo Calima (3°55′39.24″ N; 76°58′54.68″ W to 51 m a.s.l.), Pericos Natural Reserve (PNR) (3°51′21.66″ N; 76°47′12.25″ W to 550 m a.s.l.), and La Elsa (3°34′46.04″ N; 76°46′52.88″ W to 1100 m a.s.l.).
La Barra, Bajo Calima, and Pericos Natural Reserve (PNR) are located in a high-precipitation area that surpasses 7400 mm per year, with an average of 302 rainy days. Its average annual temperature is 26.7 °C with 90% humidity. Its characteristic vegetation is tropical humid forest [25,26]. La Barra differs from the other two locations due to its ecosystems of Pacific coastal mangrove and tropical humid jungle [27]. Bajo Calima has a secondary state of succession after decades of forest exploitation under Smurfit Kappa ‘Bajo Calima’ concession. Those lands were returned in 1993 [28]. Similarly, Pericos Natural Reserve (PNR) shares a past of lodged/forest exploitation but currently, it holds the status of natural protected area [29].
In contrast, La Elsa corresponds to a premontane humid forest [30]. Its annual precipitation reaches 3000 mm, with an average of 292 rainy days; its annual temperature is around 22.7 °C and its humidity is 84%. Around the populated locations exist a significant amount of deforested areas with some herbaceous vegetation alternated between the trees. The mosquito sampling station was located in a transitional zone between secondary and mature forest, where vegetation did not exceed 25 m in height [31].

2.2. Specimen Collecting/Data Collection

Female specimens were collected with a protected human landing catch method (HLC). Our field sample recollection took place between 17:00 and 19:00 h, from August to November (2019). Subsequently, samples were transferred to the laboratory of entomological studies (GIE) at Universidad del Valle in Cali, Colombia. Mosquitoes were taxonomically analyzed with Harrison’s identification key protocol [32]. Four to ten specimens per population were kept on 96% ethanol to execute DNA tests.
The right wings of the remaining individuals were removed and mounted on portable slides. Scaled photographic records were obtained using a Canon EOS Rebel T5i digital camera (Hsinchu, Taiwan) adapted to a Nikon Eclipse Ci microscope, with image stacking performed using Helicon Focus 5.3 (2013), producing two-dimensional images. Specimens were preserved on entomological pins and No. 2 slides at the Entomological Museum of the Universidad del Valle (MUSENUV).

2.3. Morphological Analysis: Traditional Morphology

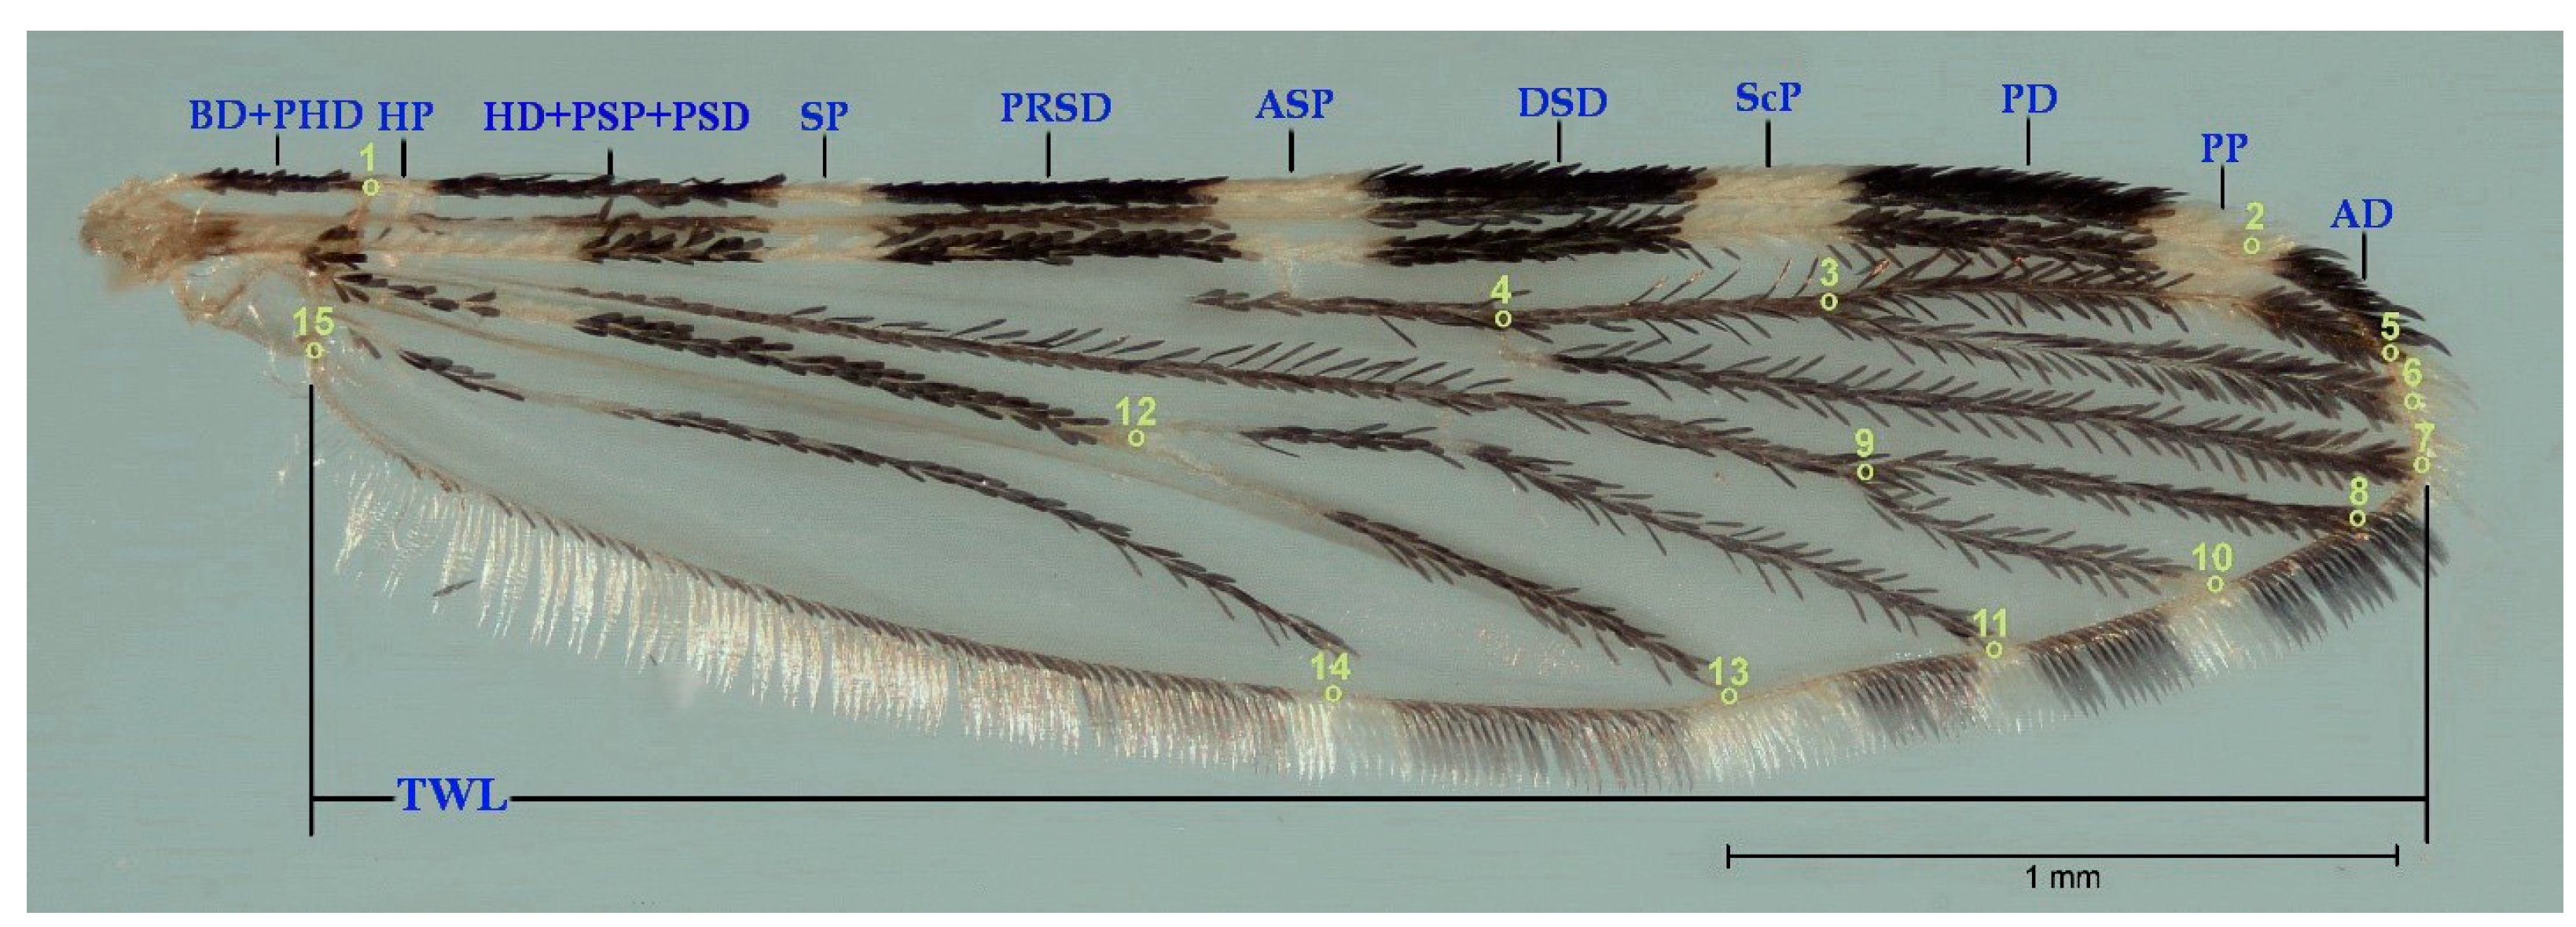
A total of 341 wing specimens were analyzed (La Barra: n = 71, Bajo Calima: n = 95, Pericos Natural Reserve (PNR): n = 75, and La Elsa: n = 100). We followed the nomenclature of Wilkerson and Peytons [33] (Figure 2) to evaluate four regions of the costal vein wing—basal, proximal, distal, and apical. Costal vein wing patterns were defined by their absence or fusion. Additionally, location pattern frequencies were estimated. Furthermore, variations in pigmentation scales along the R4+5 vein were recorded. All morphological analyses were made with I spot patterns (Figure 2) due to their high frequency in all mosquito populations.
In the study, we ran the Shapiro–Wilk and Levene tests to corroborate the regularity hypothesis of normal distribution and homoscedasticity evaluation. To analyze mosquito size, we used costal spot length proportions regarding total wing length to assess the most accurate co-relational model that best represents costal spot variations in proportion. A multiple linear regression was performed using the Stepwise regression method, testing the independence hypothesis between spots. It implemented the backward technique to determine predictor variables with higher R2 coefficient values. The variance percentage of the variable result set by the model in regard to the totality of the observed variance was used as standard to determine R2-adjusted model validity [34].
Per each spot, an ANOVA analysis was made using a simple linear model. Each costal spot was established as a dependent variable, while mosquito population was the predictable variable. With the exception of the ASP spot where it was assembled, a Generalized Linear Mixed Model (GLMM) corroborated by Akaike (AIC) criterion was used as response to the lack of homoscedasticity. Post hoc analysis with the Tukey method was also performed to identify the highest population proportion and variability of each costal spot. Likewise, this analysis contributed to determining the length of wings in mosquitoes. A size estimation was also made to corroborate relevant obtained data. The test was run with R 3.6.3. [35], lme4 [36], nlme [37], car [38], and ggplot2 [39] programmes.

2.4. Morphological Analysis: Geometric Morphometrics

In total, 296 specimens (La Barra: n = 68, Bajo Calima: n = 80, Pericos Natural Reserve (PNR): n = 73, and La Elsa: n = 75) were selected. Additionally, 15 landmark anatomical points were defined (type I) in terms of homologous character in order to gather wing variables without the intervention of size, rotation, and movement, as well as cross and longitudinal vein intersections along bifurcation and intersectional veins with the wing edge (Figure 2).
To produce a series of coordinates, a wing photography landmark allocation was performed with the CLIC Collecting Landmarks for Identification and Characterization module COO [40]. A repeatability test was performed with 120 mosquitoes’ wing aleatory samples, with which it was possible to ascribe two landmarks per image with the VAR module, allowing us to evaluate coordinate assignation reliability. The results were processed throughout the Procrustes and Thin-Plate Spline with the MOG superposition module method. Correspondingly, to improve the absence of homoscedasticity, a Generalized Least Square (GLS) model in AMOVA variance analysis was carried out to compare centroid size estimation between populations. An additional post hoc test was performed to evaluate mosquitoes’ population variations with the R 3.6.3. programme [35].
To visualize variations among individuals and their populations, principal components analysis (PCA) was conducted. In this regard, a discrimination analysis was performed including the canonical variable test (CVA) and Mahalanobis distance calculation ranges with standard variation in population pairs, reducing possible errors associated with each distance through calculus over 1000 permutations.
Taking into consideration the models mentioned above, it was identified which mosquito specimen analyzed the wing shape belonged to. By the use of simple reclassification and cross check verification reasoning, each sample that was not part of the discriminant analysis and an accurate number of assignments was recalculated, which were expressed as percentages. To interpret the strength of agreement of our data, we took into consideration the benchmark scale proposed by Landis and Koch [41], as follows: Moderate (41–60%), Substantial (61–80%), and Almost-perfect (81–100%).
A multivariable linear regression was conducted to evaluate the contribution of size (dependent variable) in relation to shape variation (allometry). In this analysis, centroid size was used as the independent variable. Additionally, the analysis was performed on a standardized scale using the PAD module [40].

2.5. Extraction, Amplification, and DNA Sequencing

To determine the concentration, a DNA extraction protocol for insects was run using Thermo Fisher Scientific—Nanodrop 2000 (Wilmington, DE, USA) [42,43]. The COI region was amplified with the LCO1490 and HCO2198 primers [44]. Each PCR reaction took place under the following conditions: Buffer 1X, MgCl2 2.0 mM, 0.25 µM of each primer, 0.2 mM de dNTPS, a Taq DNA polymerase unity, and 20 ng of total DNA for a final volume of 25 µL with PCR mix. The amplification was executed in a BioRad T100 Thermal Cycler (Hercules, CA, USA), according to the following sequence: initial denaturation at 94 °C per 10 min; 36 cycles of 94 °C per 30 s, 52 °C per 30 s, and 72 °C per 30 s, as well as final extension of 72 °C for 10 min. PCR amplification was verified by electrophoresis in agarose gel at 1.5%. The samples were stained with GelRed and visualized under ultraviolet light. The amplified products were sequenced for capillary electrophoresis (CE) in Macrogen Inc. (Seoul, Republic of Korea).

2.6. Alignment and Sequence Analysis

Two molecular analyses of the obtained sequences were conducted. The first analysis included 25 processed sequences from the four study sites: La Barra (n = 5), Bajo Calima (n = 6), Pericos Natural Reserve (PNR) (n = 10), and La Elsa (n = 4) (GenBank accession numbers are provided in Supplementary Material Table S1).
Likewise, 58 sequences of nine Anopheles neivai populations from the GenBank database were taken. The included localities were Petit-Saut (French Guyana) [45], Chiquimula and Puerto Barrios (Guatemala) [21], Acandí, Bahía Solano, Nuquí, Litoral del San Juan (Colombia), and Portobello (Panama) [23]. Several localities at Tumaco (Colombia) were grouped; equally, Buenaventura contains Joaquincito, Punta Soldado, Papayal, El Tigre, Humane, Bello Horizonte, San Cipriano, and the kilometres 24 and 27 of Valle del Cauca-Colombia [16], as described in Supplementary Material Table S1.
The sequences were edited and aligned with the MUSCLE algorithm [46,47]. Similarities were evaluated with the ones reported on GenBank through BLAST+ (version 2.10.1) [48]. Moreover, molecular variation indexes were estimated—nucleotide and haplotype indexes were estimated with the Ape package Analyses of phylogenetics and the evolution in R language programme R 3.6.3. [49]. Haplotype networks were built using Minimum Spanning Network [50] criterion with the PopArt programme [51]. A molecular variance AMOVA with pairwise difference analysis was also executed, and the fixation index (FST) was calculated using Arlequin programme 3.5 [52].
Additionally, a dendrogram was made using the Neighbour-Joining algorithm under the two-parameter (K2P) Kimura criterion with the MEGA X programme [53]. Genetic distances were determined and incorporated to other available genera sequences in GenBank: An. cruzii, An. bellator, An. homunculus, An. laneanus [54], An. Lepidotus, and An. pholidotus [32]. Additionally, for the further 83 sequences, a three-way AMOVA with Arlequin 3.5 [51] was completed; their populations were distributed into five groups considering their haplotype network.

2.7. FST Y QST Population Parameter Evaluation

With the aim of identifying possible evolutionary factors that influenced the four studied mosquito populations and their morphological variation in different altitudinal ranges, a comparison was established between QST quantitative values using traditional morphology (costal vein spot and wing proportion longitude) and geometrical morphology (shape of canon factors and centroid size) and FST molecular levels [55]. To determine QST variance components, we considered Equations (1)–(3). The FST parameters were calculated in the molecular analysis section.
Q ST = V G r o u p V T o t a l
Equation (1). Index estimation QST.
  • V G r o u p V T o t a l : proportion of variance explained by groups.
σ ^ S 2 = M . S . B M . S . W k 1
Equation (2). Estimation of the additive genetic variance among populations.
  • M . S . B : Mean squares between groups.
  • M . S . W : Mean squares within groups.
k 1 = 1 S 1 n . n i 2 n .
Equation (3). Coefficient that depends on the number of groups and the sample size within each group.

3. Results

3.1. Morphology Analysis

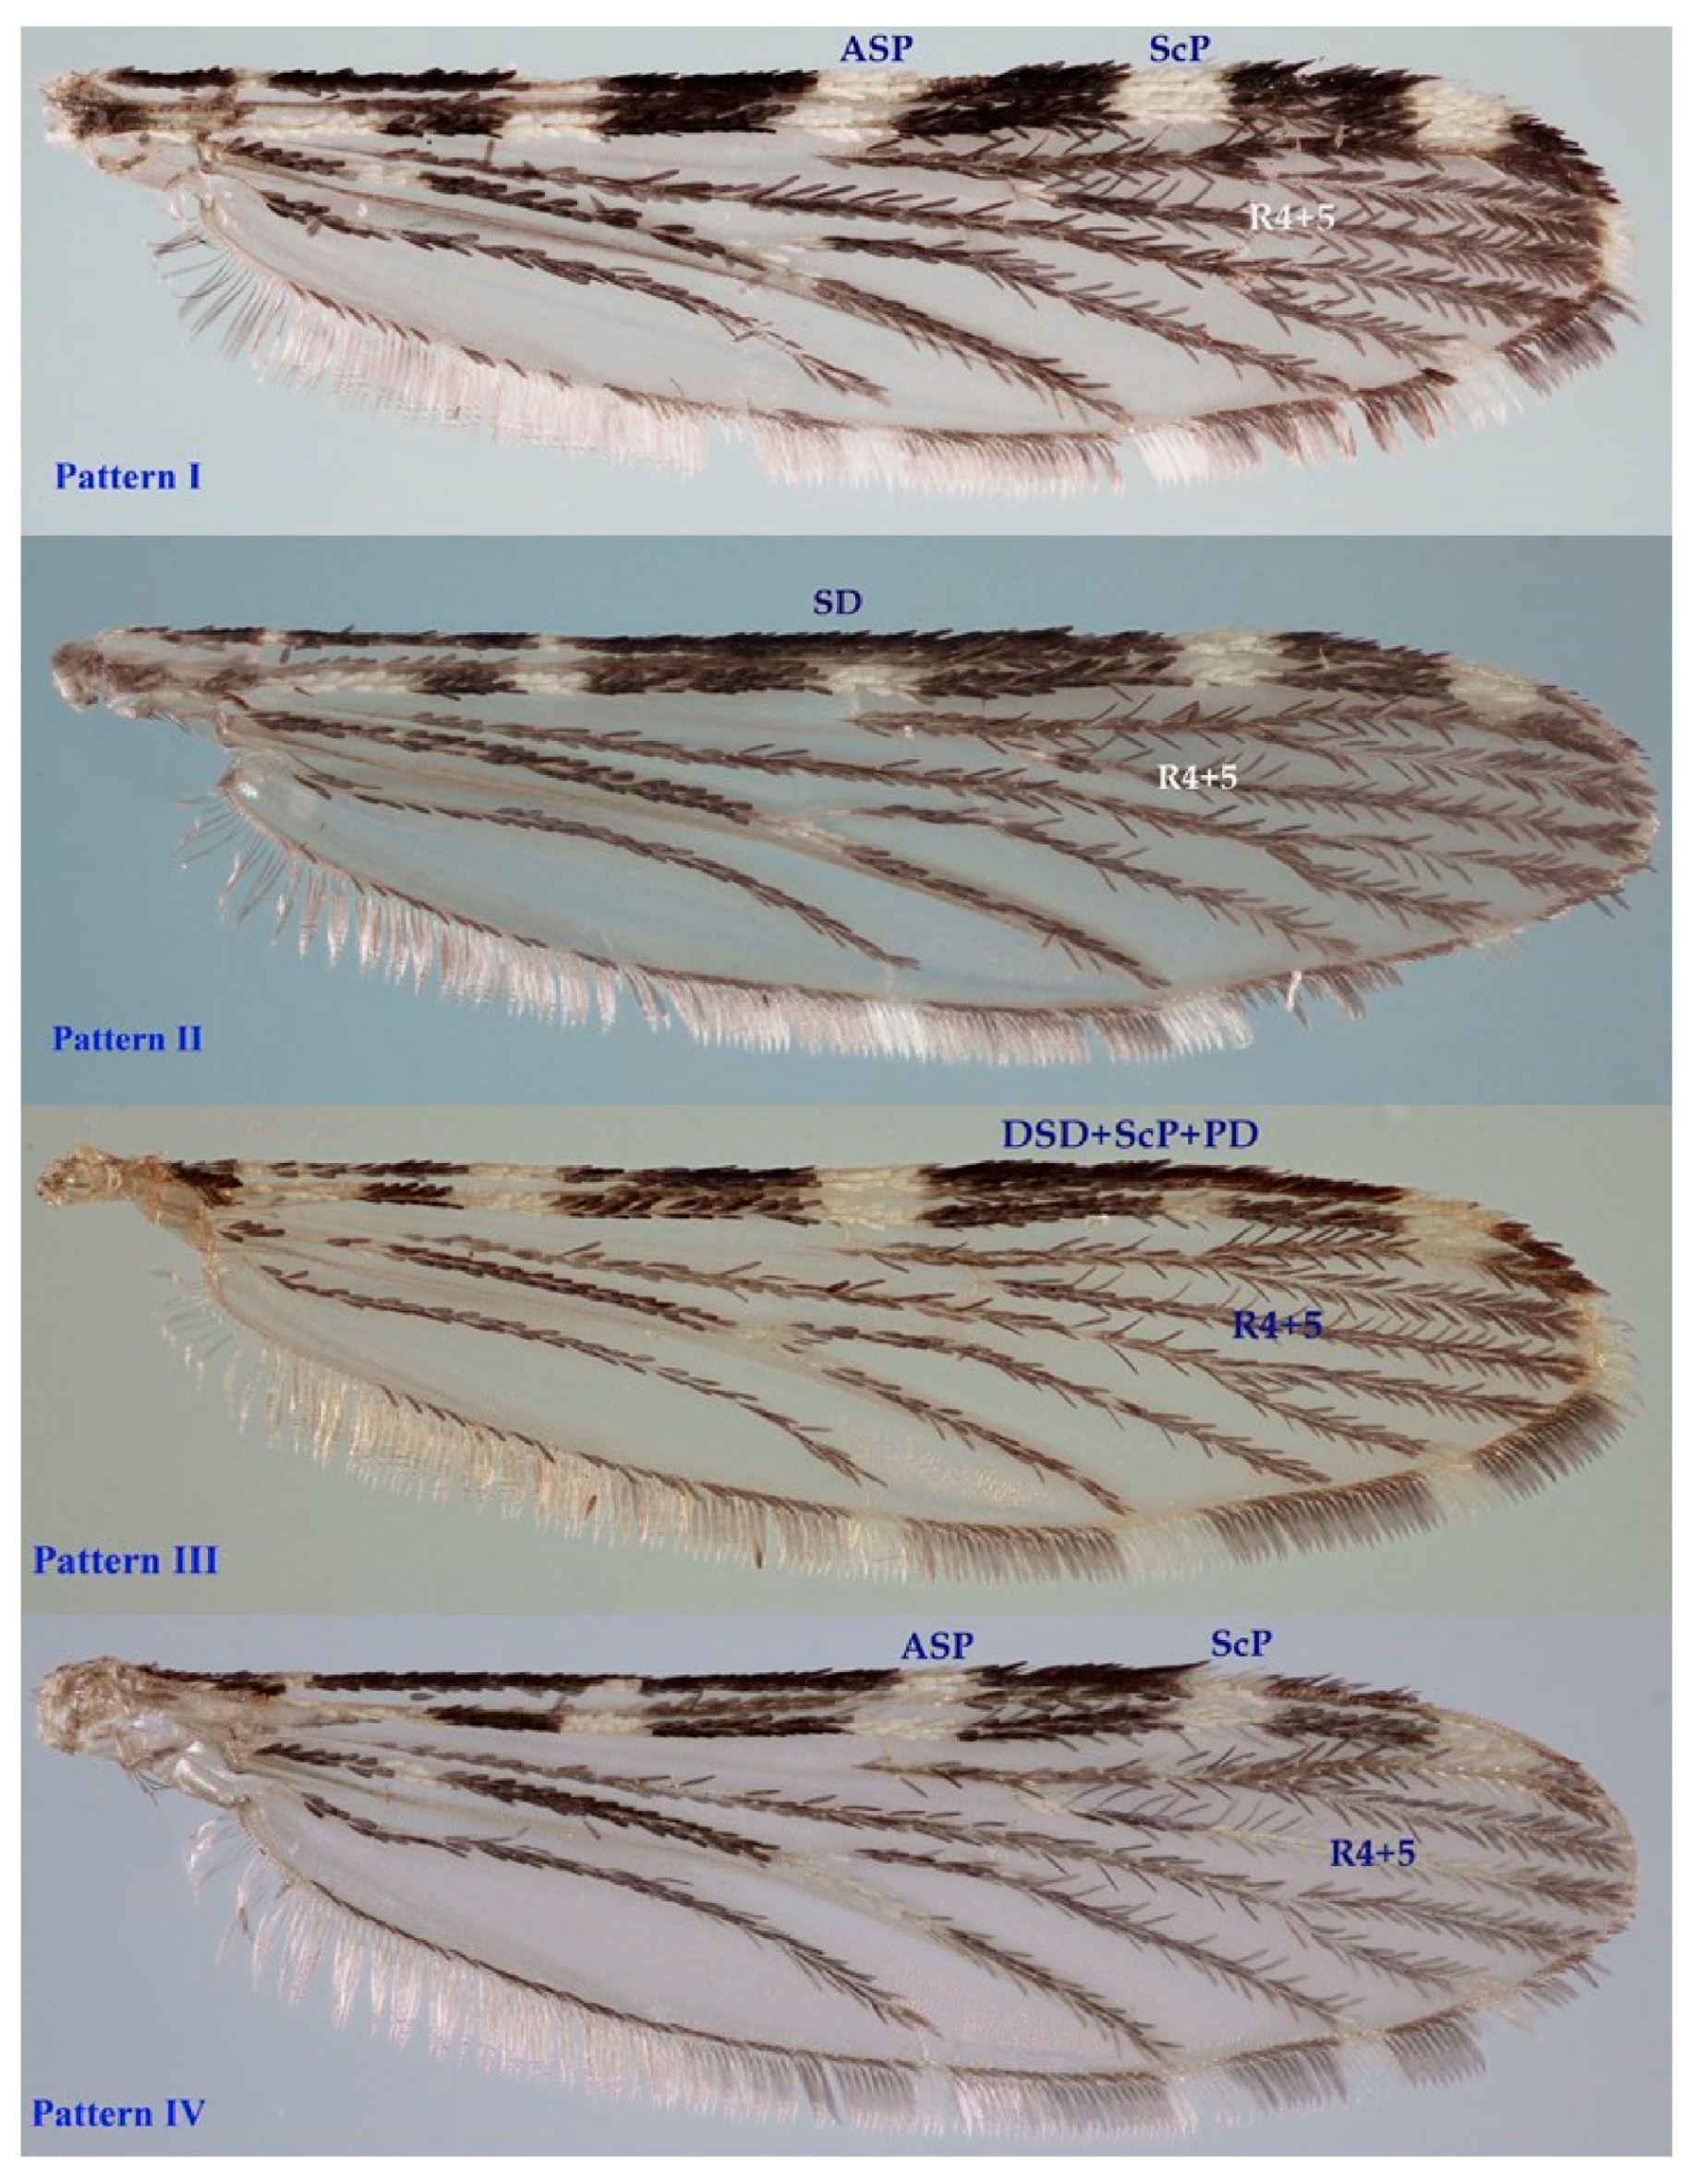
In the Bajo Calima population, we found four patterns of wing spots (Figure 3)—pattern I (92.5%; n = 74/80), pattern II (2.5%; n = 2/80), pattern III (2.5%; n = 2/80), and pattern IV (2.5%; n = 2/80). Only pattern I was identified in the other three populations.

3.2. Morphology Analysis: Traditional Morphology

The independence analysis of the costal spots suggested a strong relationship between adjacent spots, as shown in Table 1. Additionally, the correlation effect remained independent of the studied population, except for the BD + PHD fusion and the HP spot, where the population, which was used as a predictor variable, showed a significant influence coefficient. Notably, the correlation coefficient for each predictor variable was negative. This indicates that as the elongation of a contiguous spot increases, the size of the main spot decreases accordingly.
Through costal spot measurements, variance analysis, and post hoc tests, it was found that all mosquito populations were significantly different from one another, particularly the population from La Barra. In contrast, the Pericos Natural Reserve (PNR) population was the least distinctive. Significant differences were observed in nine out of eleven spots, with the exception of the distal sector dark (DSD) and apical dark (AD) spots (Table 2).
La Barra specimens differ due to their basal and proximal spot areas (fusion BD + PHD, fusion HD + PSP + PSD, SP and PRSD). Furthermore, individually, the samples presented divergences in their distal areas for ASP with Pericos Natural Reserve (PNR), SCP at La Elsa, and apical areas for PP with the Bajo Calima population. The least distinctive identified population was from the Pericos Natural Reserve, with two significantly different costal spots with Bajo Calima (BD + PHD and ASP), as well as two with La Elsa (HP and PD). Finally, Bajo Calima had four different costal spots with La Elsa (BD + PHD, HP, PD and PP) (Table 3).
We found that populations presented a larger size at higher altitudes, with various differences among them (F = 181.81, d.f. = 341, p < 0.0001; see TWL, Table 3: Post hoc results). La Elsa at 1100 m a.s.l. presented a larger wing length (µ = 2.86 ± 0.13 mm) with maximum registers that overpass 3.00 mm, followed by Pericos Natural Reserve (PNR) at 550 m a.s.l. (µ = 2.64 ± 0.14 mm). La Barra with 5 m a.s.l. exhibited longer wings (µ =2.47 ± 0.18 mm) than Bajo Calima with 51 m a.s.l. (µ= 2.36 ± 0.16 mm), with minimum registers around 2.00 mm.

3.3. Morphology Analysis: Geometric Morphometrics

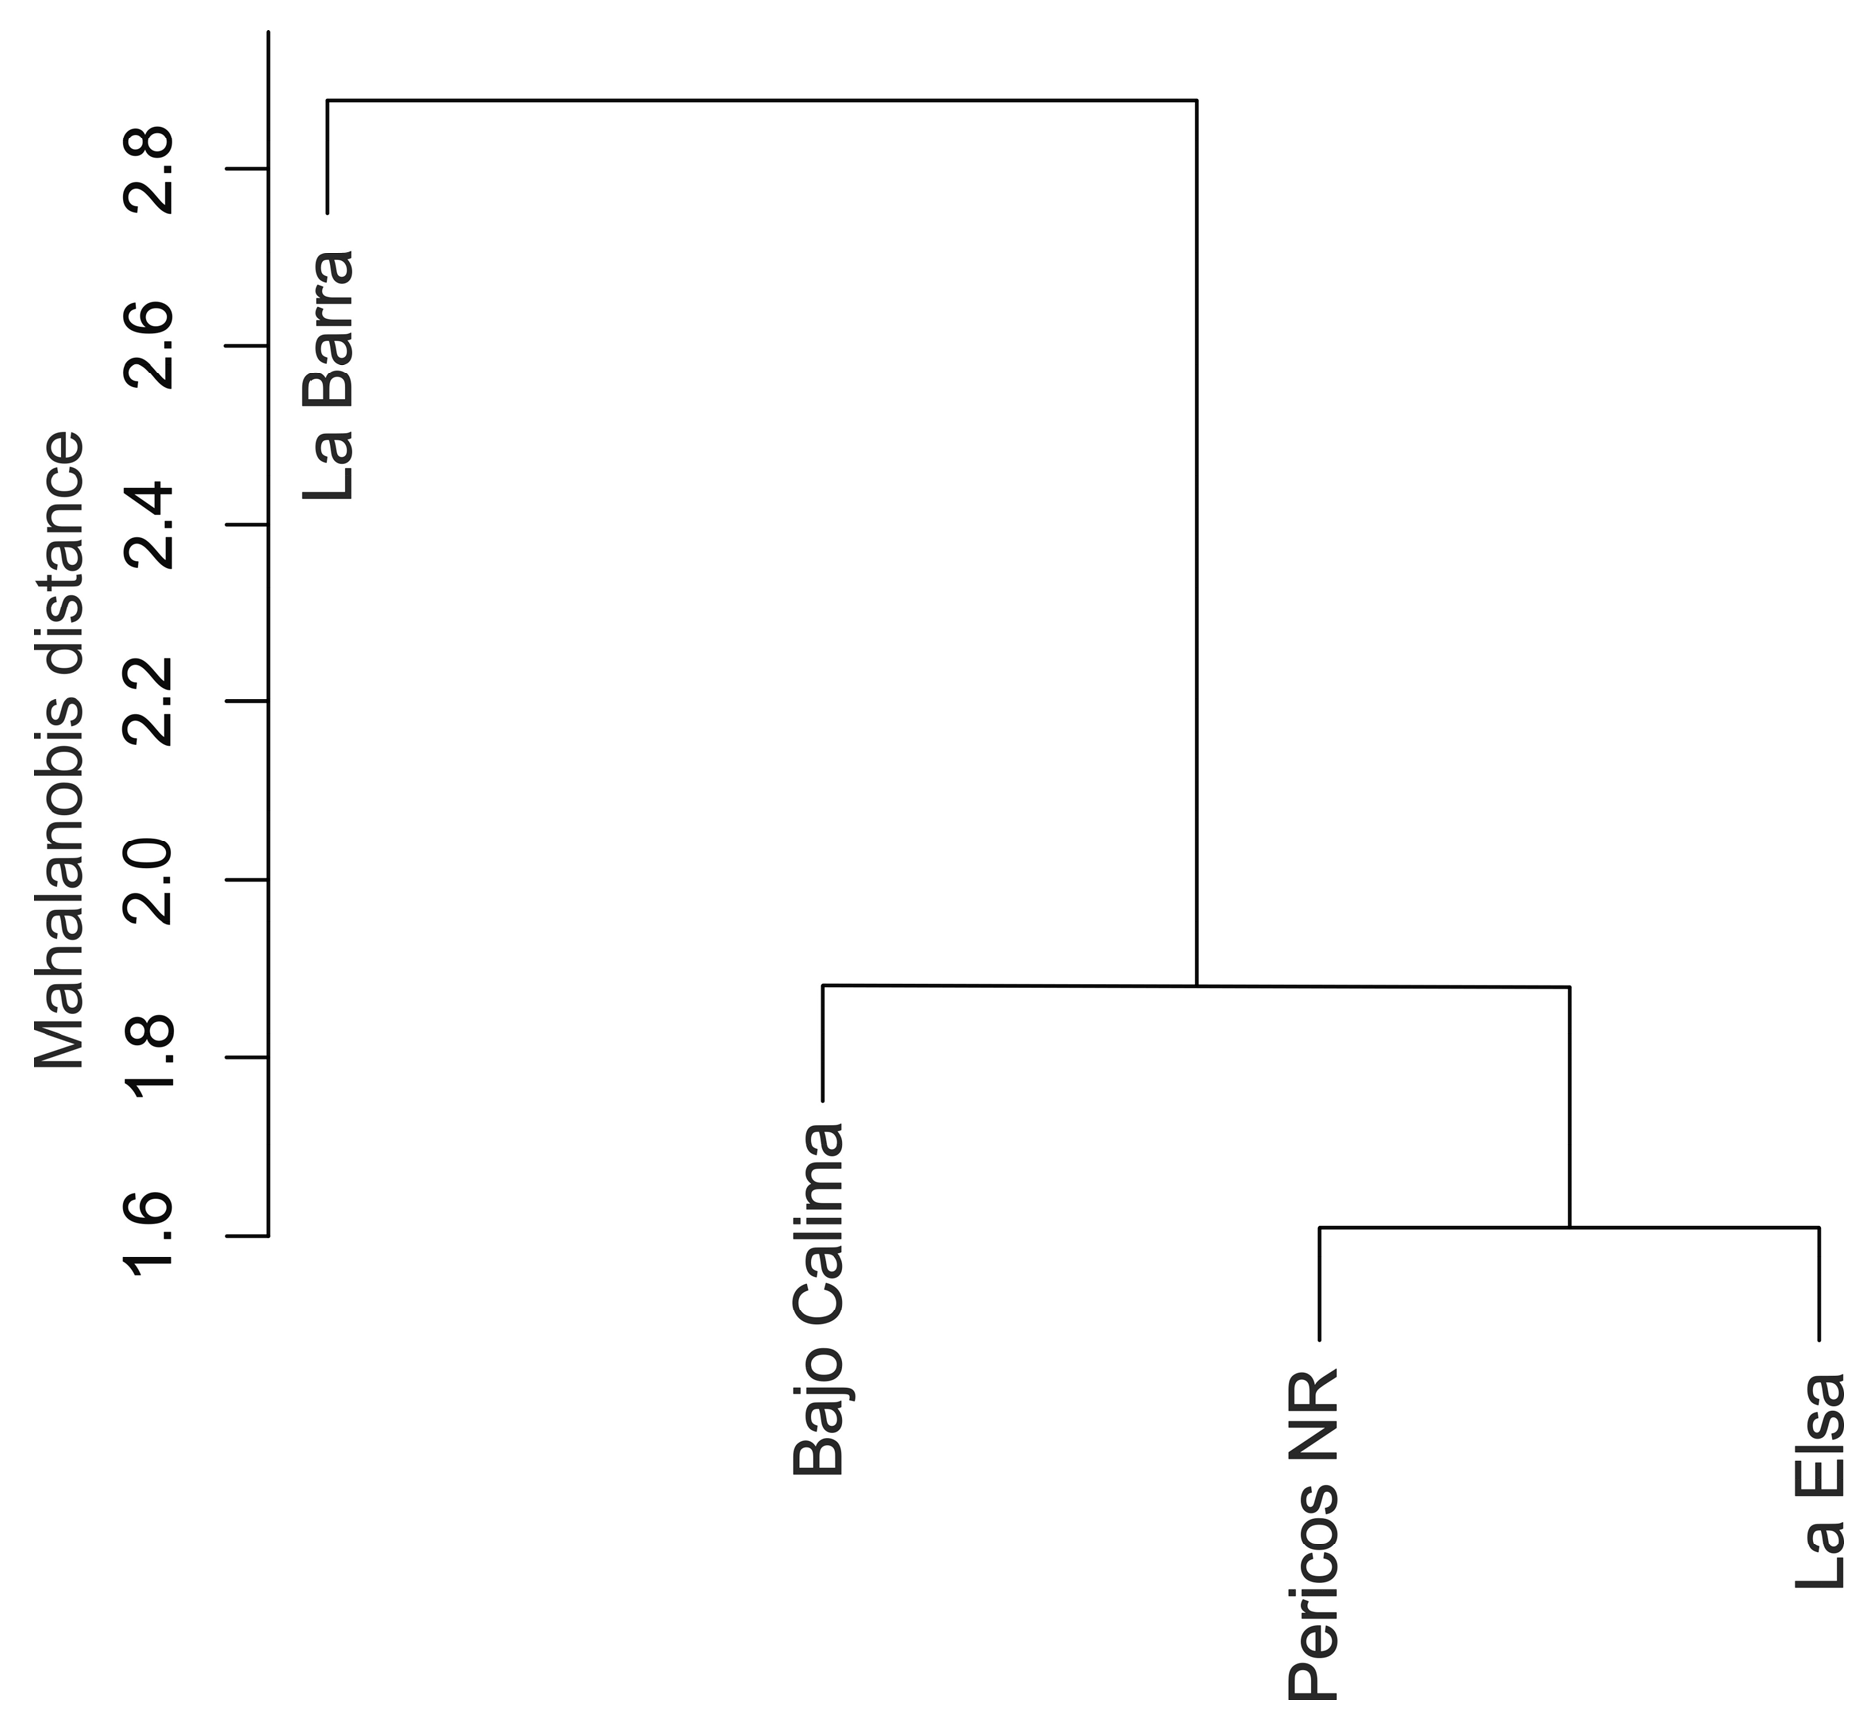
The discriminant analysis and Mahalanobis distances indicated that the La Barra population exhibited the greatest morphological differentiation, as shown in Figure 4. Specimens from higher altitudes were morphologically similar to each other, with Pericos Natural Reserve (PNR) forming an intermediate group. In contrast, the morphological distance increased between Bajo Calima and La Elsa.
The principal component analysis (Figure 5a) evidenced an overlap among populations. However, the canonical correlation analysis (Figure 5b) showed that this overlap was more pronounced between Pericos Natural Reserve (PNR) and La Elsa, while Bajo Calima overlapped to a lesser extent. In contrast, specimens from La Barra clustered together more distinctly, forming a well-defined group in the multivariate space.
Simultaneously, the simple reclassification analysis showed a relatively high classification accuracy for Bajo Calima (67%), Pericos Natural Reserve (PNR) (63%), and La Elsa (70%). In the cross-validated reclassification, classification accuracy remained substantial for Bajo Calima and La Elsa (both 60%), suggesting consistent morphological differentiation. Pericos Natural Reserve (PNR), on the other hand, exhibited a moderate classification rate of 49%, indicating an intermediate morphological profile. In contrast, individuals from La Barra showed the highest classification success, with 88% in the simple reclassification and 80% under cross-validated conditions, reflecting strong morphological distinctiveness.
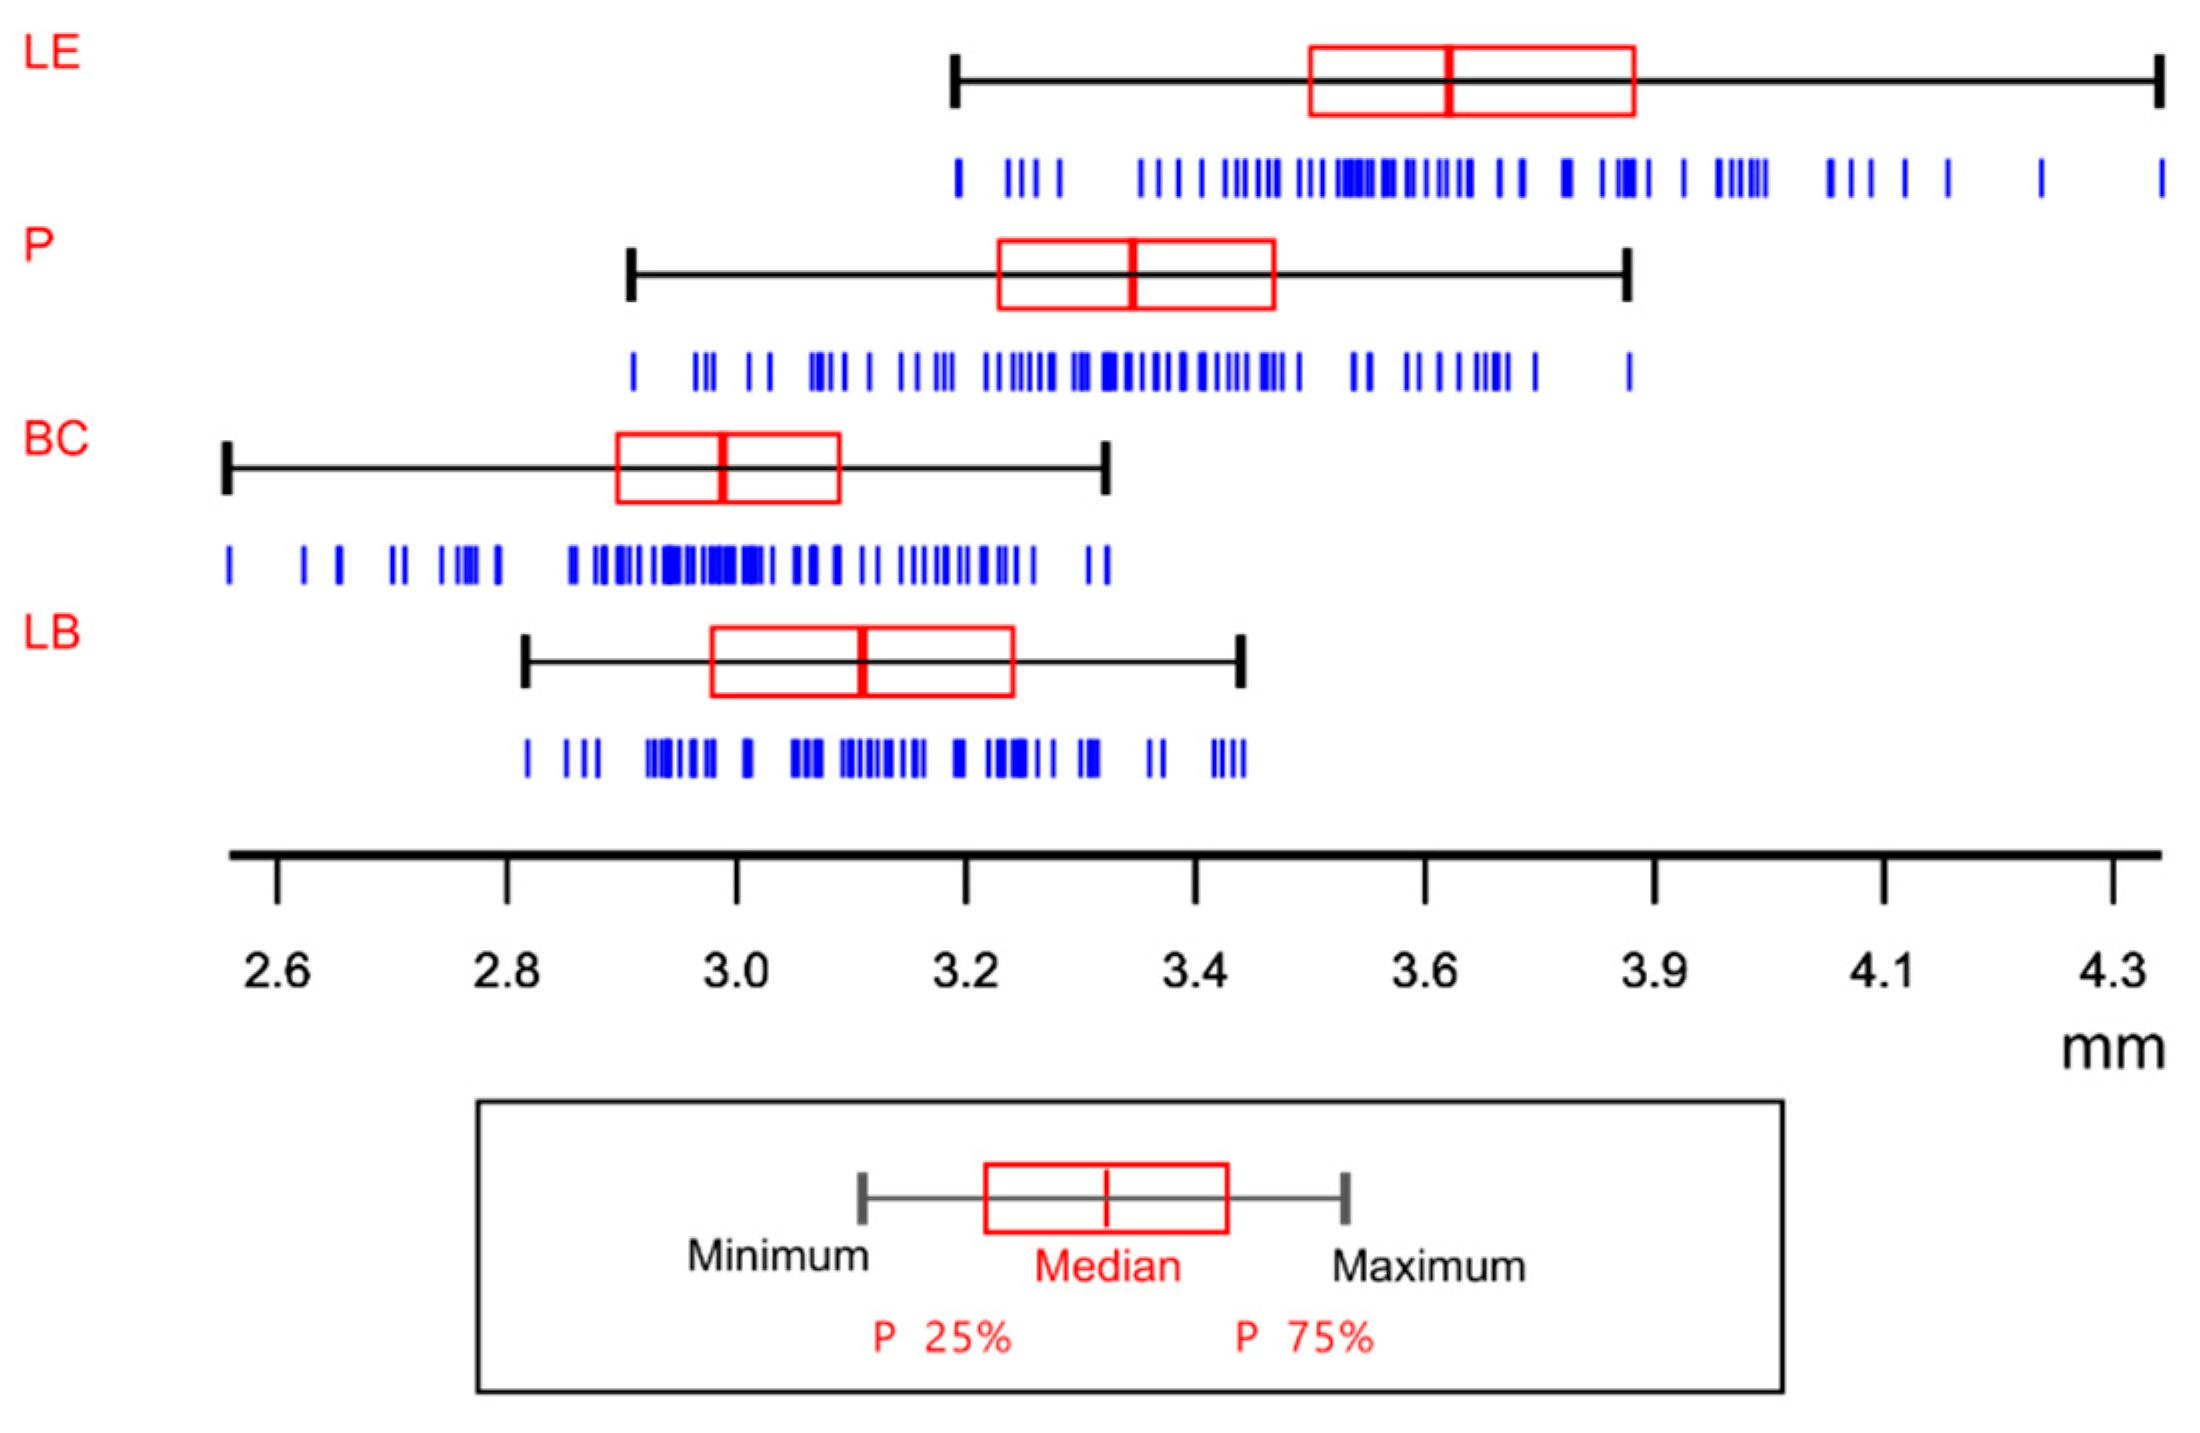
The centroid size analysis revealed significant differences among all mosquito populations; however, size had no detectable effect on wing shape. Differences in centroid size were consistent with total wing length in traditional morphometric comparisons (Figure 6), with statistically significant variation across populations (F = 159.64, d.f. = 1, p < 0.0001, QST = 0.70). Furthermore, the test for allometric effect indicated that size accounted for only 1% of the shape variation (t = 1.79, d.f. = 294, p = 0.0369); this is a marginal result, which is insufficient for suggesting a strong influence of size on shape (see Supplementary Material Figure S1).

3.4. Molecular Analysis

A 638 bp fragment of the CO-I region was obtained, revealing 67 polymorphic sites and 17 haplotypes. Pericos Natural Reserve and Bajo Calima exhibited a higher number of polymorphic sites (PNR = 47; BC = 41), while La Barra and La Elsa showed fewer (LB = 3; LE = 2), with each substitution corresponding to a distinct haplotype. Two haplotypes were shared: one between Bajo Calima and Pericos Natural Reserve, and another between Bajo Calima and La Barra (Figure 7).
Genetic parameters indicated a nucleotide diversity of π = 0.037 and a haplotype diversity of h = 0.95. The populations with the lowest values were La Elsa (π = 0.001, h = 0.5) and La Barra (π = 0.002, h = 0.7), in contrast to Bajo Calima (π = 0.022, h = 1.0) and Pericos Natural Reserve (π = 0.025, h = 0.93). Tajima’s neutrality test yielded a value of D = 1.38 (p > 0.16). Fu’s neutrality test results were as follows: Bajo Calima, Fs = −0.44, and Pericos Natural Reserve, Fs = −2.21—both with non-significant values. In contrast, significant values were observed in La Barra (Fs = −3.90) and La Elsa (Fs = −3.13).
According to the molecular variance analysis (AMOVA), 61.88% of the genetic variation occurs among populations, while 38.13% occurs within populations, with a fixation index of FST = 0.6188 (p < 0.0001). Pairwise population comparisons show high levels of genetic differentiation, especially for specimens from La Barra, as follows: La Barra vs. La Elsa (FST = 0.96; p < 0.0001), La Barra vs. Bajo Calima (FST = 0.73; p < 0.0001), and La Barra vs. Pericos Natural Reserve (FST = 0.70; p < 0.0001). Among the other three populations, La Elsa is more genetically distant from Bajo Calima (FST = 0.68; p < 0.0001), while it is genetically closer to Pericos Natural Reserve (FST = 0.51; p < 0.0001). In contrast, Bajo Calima and Pericos Natural Reserve show low differentiation (FST = 0.14; p > 0.05).
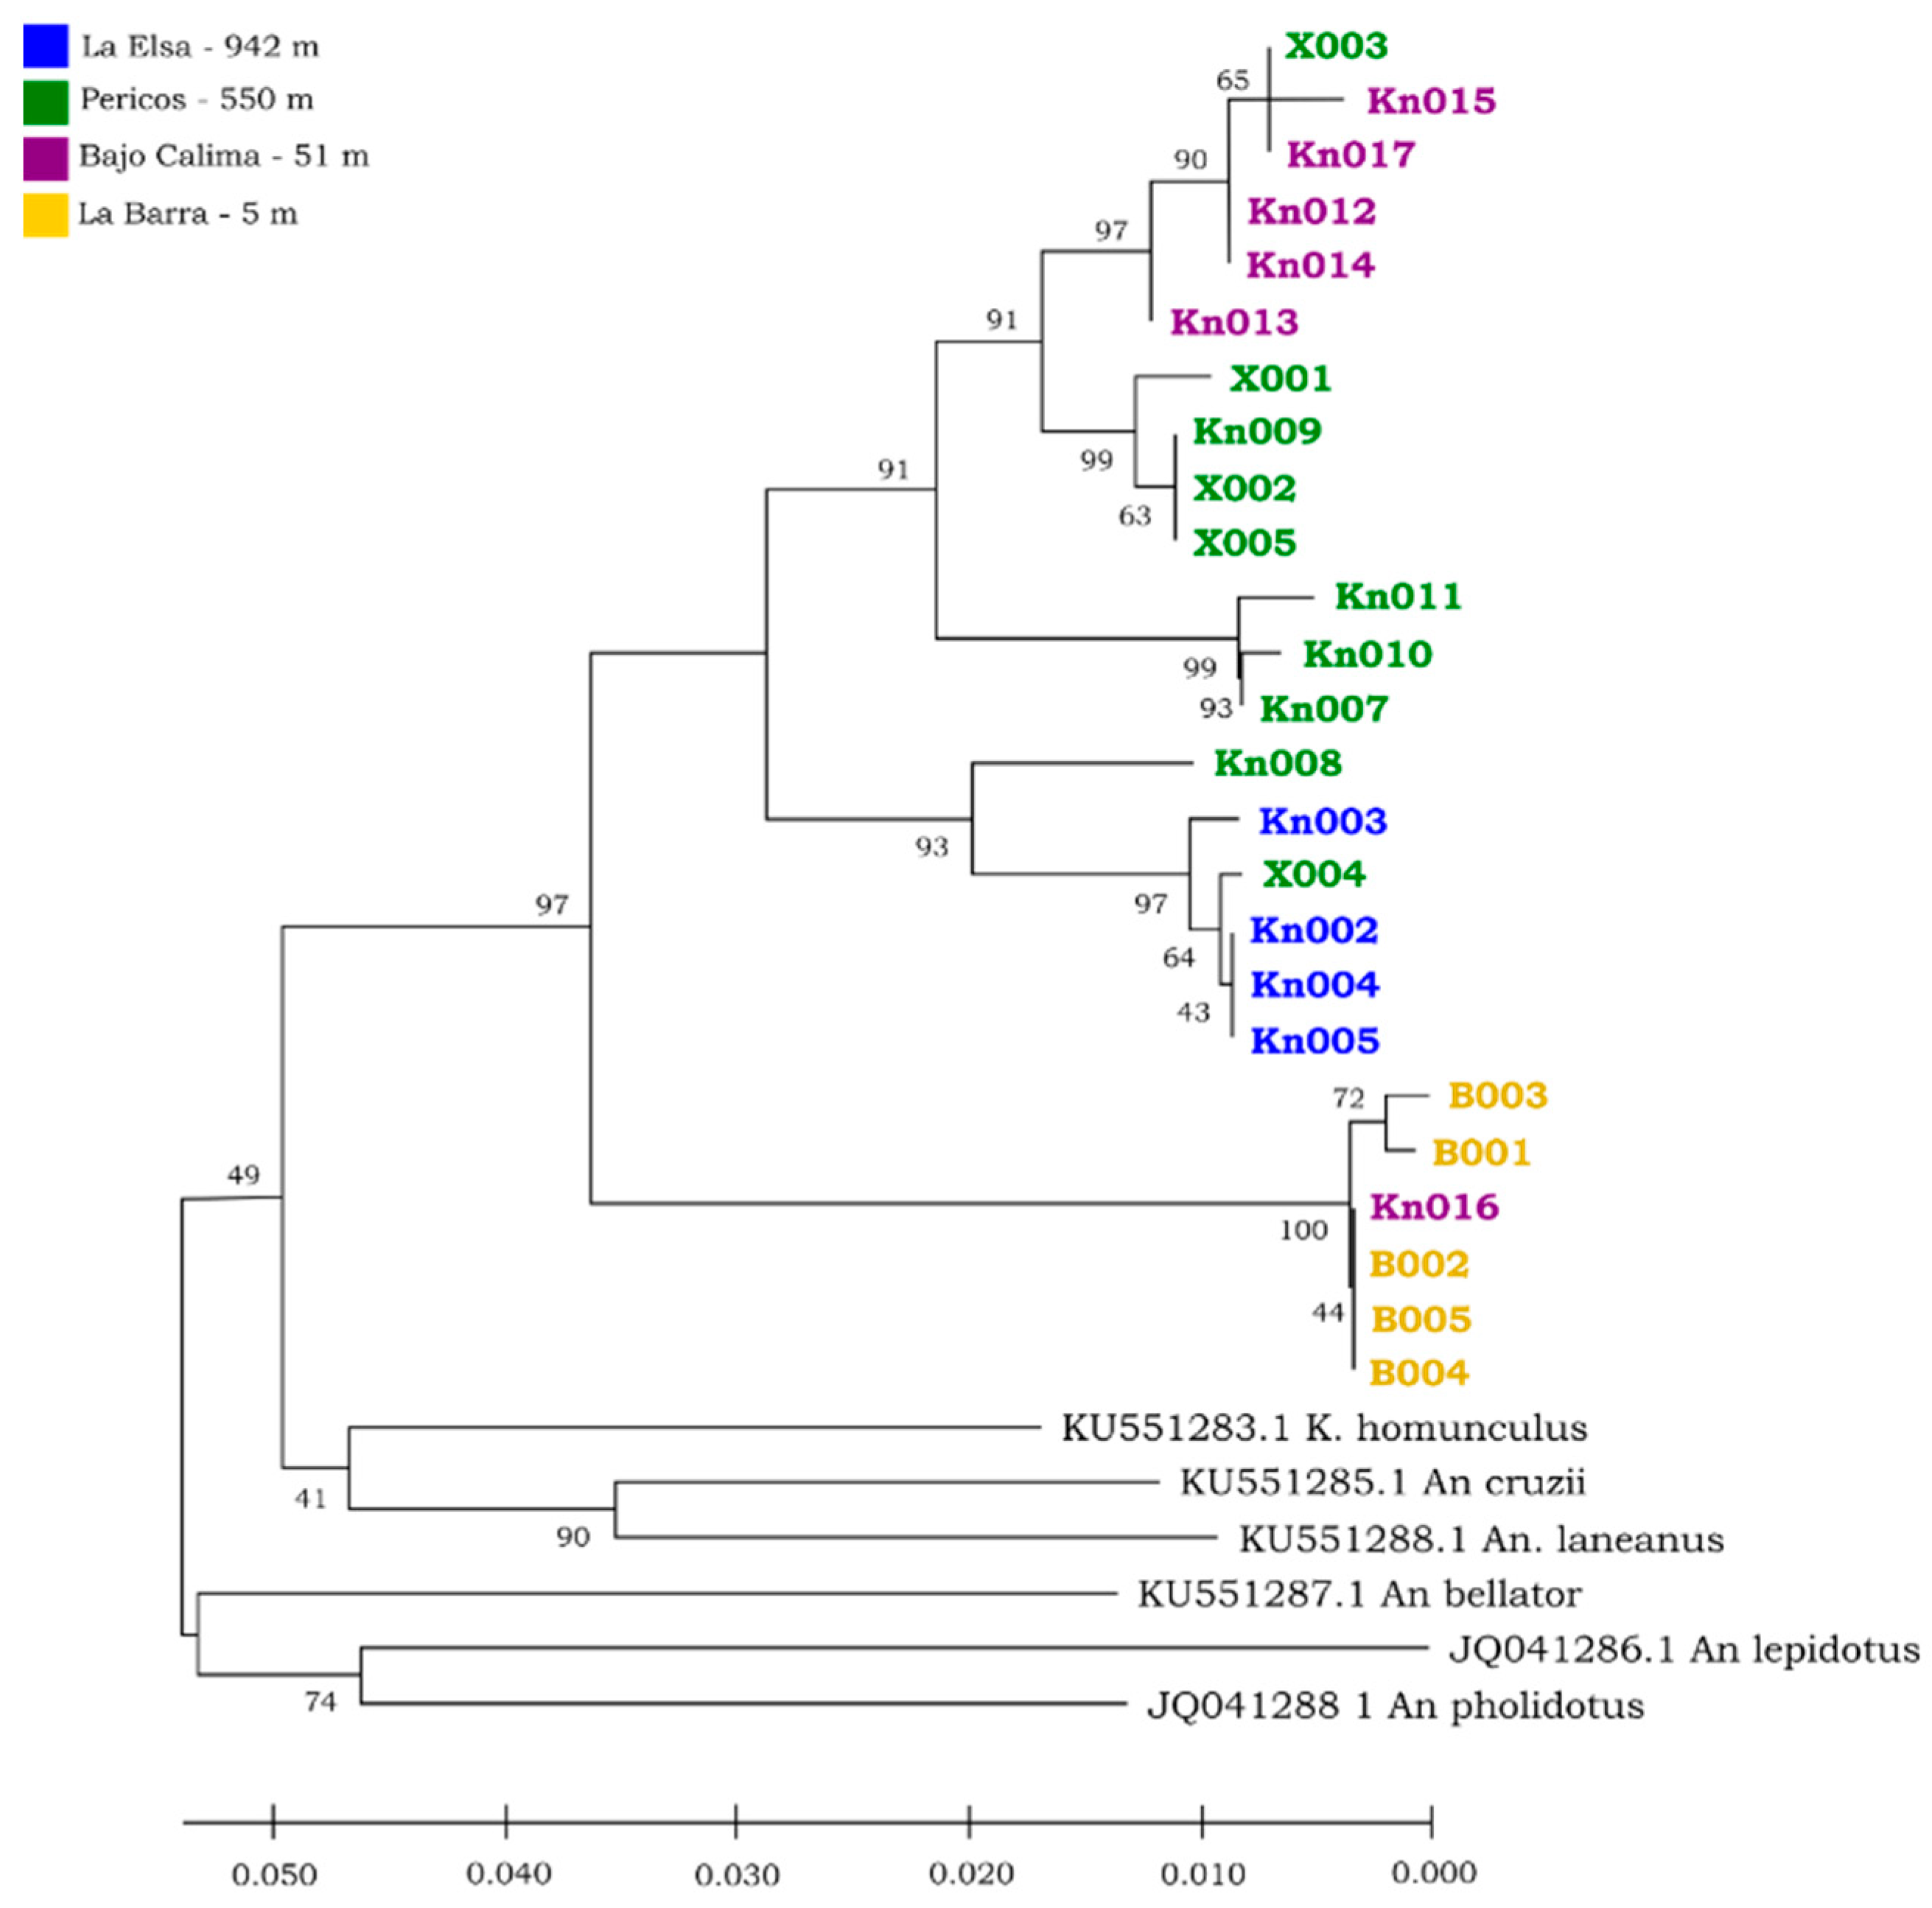
Genetic distances (K2P) among the four An. neivai populations ranged from 0.00% to 6.84%, while the distances among other species of the genus varied between 7.0% and 11.64% (Figure 8). Within La Barra, distances ranged from 0.00% to 0.34%. When comparing La Barra with the other three populations, genetic distances ranged between 4.95% and 6.84%, with an average of 6.10%.
Genetic distances among Bajo Calima, Pericos Natural Reserve, and La Elsa ranged from 0.00% to 4.78%, with an average of 2.65%. In Bajo Calima, we identified one specimen (Kn016) showing a genetic distance pattern similar to that observed in La Barra. Including this sequence, the average genetic distance within Bajo Calima was 2.25% (range: 0.00–6.45%). When excluded, the distances within this population ranged from 0.00% to 0.86%. Within Pericos Natural Reserve (PNR), the average distance was 2.54% (range: 0.00–4.78%), and 0.17% (range: 0.00–0.34%) for La Elsa.
Regarding other population comparisons, the average genetic distance between Bajo Calima and Pericos Natural Reserve was 2.21% (0.00–4.78%), between Bajo Calima and La Elsa was 2.32% (0.00–4.78%), and between Pericos Natural Reserve and La Elsa was 2.83% (0.00–4.78%). The dendrogram supports the consistency of the results previously obtained. It shows that the mosquito population from La Barra is clearly separated from that of La Elsa, Bajo Calima, and Pericos Natural Reserve, although one sequence remains on the same branch. Additionally, all sequences from La Elsa were grouped together, along with two individuals from Pericos Natural Reserve (PNR), while most of the sequences from Bajo Calima and PNR were placed on a broader branch.
For the coastal spots, the coefficient values of quantitative differentiation (QST) fluctuated between 0.0355 and 0.4508. All of them were lower than the molecular differentiation coefficient (FST = 0.6188). The canonical factor analysis of geometric morphometrics showed different results, whereby the first canonical factor presented a QST/FST ratio greater than 1 (1.02), while canonical factors 2 and 3 were lower, at 0.63 and 0.45, respectively.
Considering the overall available sequences for An. neivai, 343 bp fragments of the CO-I region yielded 69 polymorphic sites and 29 haplotypes. Diversity parameters for thirteen populations are shown in Table 4. Bajo Calima, Pericos, Buenaventura, and Guatemala exhibited a higher number of polymorphic sites. In contrast, all sequences from Acandí and from Guyana were identical, with no polymorphic sites observed within each locality. The remaining groups showed between one and seven polymorphisms. The nucleotide diversity was π = 0.042 and the haplotype diversity was h = 0.88. Tajima’s neutrality test result was 0.21 (p = 0.83).
The results of neutrality tests by population are also presented in Table 4. Most populations showed negative Tajima’s D and Fu’s Fs values, with significant Fu’s Fs results suggesting potential deviations from neutrality. Positive values of Tajima’s D were observed in Pericos, Buenaventura, Portobelo, and Litoral. Neutrality tests could not be calculated for Acandí and Guyana due to the absence of polymorphic sites.
In the second haplotype network (Figure 9) five predominant groups were visualized, as follows: (1) Guyana, widely separated from the network with 33 mutational steps and a single haplotype for all its sequences. (2) Guatemala, with five haplotypes and 11 mutational lines. (3) Bajo Calima, Pericos Natural Reserve, and La Elsa are separate from the network with 19 mutational lines. Bajo Calima is the closest population and La Elsa the most distant, while Pericos Natural Reserve is in an intermediate position. Bajo Calima shares a haplotype with Buenaventura; in particular, its sequences correspond to San Cipriano and Km 24–27 locations (close to 50 m a.s.l.). (4) Portobelo with three haplotypes is slightly separate from the fifth group. (5) Acandí, Bahia Solano, Litoral, Nuquí, Buenaventura, La Barra, Bajo Calima, and Tumaco shared two predominant haplotypes, consisting of 24 and 13 sequences, respectively.
According to the analysis of molecular variance (AMOVA), 71.74% of the genetic variation was attributed to differences among predefined groups, 7.24% to differences among populations within groups, and 21.01% to variation within populations. The overall fixation index was FST = 0.78 (p < 0.0001). Pairwise FST values and their significance are presented in Supplementary Material Table S2.

4. Discussion

Our findings suggest that altitude contributes to the differentiation among An. neivai populations. Morphological and molecular analyses revealed a marked divergence between coastal populations at 5 m a.s.l. and the three highland populations, despite an altitudinal difference of only 45 m. This variation exceeded that observed among populations from forested environments separated by 500 m in altitude. Notably, this difference is not only altitudinal but also spatial, as La Barra (5 m a.s.l.) and Bajo Calima (51 m a.s.l.) are about 45 km apart. Therefore, other variables such as changes in vegetation, availability of breeding sites (e.g., bromeliads), feeding sources, temperature, humidity, luminosity, and wind exposure may also play a role, as has been highlighted in previous studies [1,6,12].
In total, four spot patterns were observed in the costal vein of the An. neivai population from Bajo Calima (50 m a.s.l.), suggesting that a diversification phenomenon may be occurring at this geographic location. Patterns II and III have not been previously reported for An. neivai [15,56]. Moreover, this is the first time that Pattern II has been recorded for the Kerteszia subgenus, while Pattern III has been observed in An. auyantepuiensis, which is one of the species that is most commonly misidentified as An. neivai [57].
Pattern IV is shared with a broader range of species from the Kerteszia subgenus, including An. cruzii, An. homunculus, An. bellator, An. rollai, and An. gonzalezrinconesi, and is likely one of the most ancestral patterns [56,58,59]. In An. pholidotus, An. boliviensis, An. lepidotus, and An. auyantepuiensis, its presence is variable [56,57], while in An. bambusicolus, it has been reported as absent. A similar form of Pattern IV in An. neivai was previously characterized [60].
Using two morphological methods, the analysis yielded similar results; however, each approach provided complementary information for understanding the effect of altitude on phenotypic variation in mosquito populations. Traditional morphology contributed to identifying a possible wing modularity, considering that the La Barra population differed mainly in its basal and proximal spots. These differences could be associated with the functional demands of the littoral Pacific coast habitat and the humid forest environment [61] in contrast to the environmental conditions at higher altitudes, where lower temperatures, reduced precipitation, and changes in vegetation are observed.
According to the results, integrating a modularity hypothesis could be a valuable next step to better understand evolutionary aspects related to structure, function, and development [62]. On the other hand, geometric morphometrics enabled us to quantify the degree of differentiation through point cloud representations in both principal component and discriminant analyses. Reclassification percentages were higher than 80% for La Barra (5 m a.s.l.), between 60% and 70% for La Elsa and Bajo Calima (1100 m and 51 m a.s.l., respectively), and around 50% for Pericos Natural Reserve (550 m a.s.l.) [63]. In this regard, the samples from La Barra showed a well-defined shape, while the remaining three An. neivai populations could be morphologically classified within other groups.
Size variation patterns similar to those reported for other mosquito vector species were observed, following the trend of “the higher the altitude, the larger the wing size,” as described for An. cruzii, An. calderoni, and Aedes albopictus [4,15,64], as well as in other Diptera species [65]. However, an inverse trend was observed in the populations from La Barra and Bajo Calima. This raises the following questions: (1) Could the results be a consequence of precipitation patterns? (2) Could they be related to the abundance of breeding sites around the mosquito collection areas? These hypotheses are relevant given that An. neivai larval density may vary with altitude [66]. Although not assessed here, future research should examine larval habitat features and crowding, as both could help explain the observed size differences among mosquito populations.
Although differences in specimen collection times may have introduced some bias among populations, evaluating the effect of size on shape variation provided more meaningful insights. With only 1% of allometry detected, size—a variable sensitive to environmental conditions—did not significantly influence the morphological changes associated with shape among populations.
Molecular analysis indirectly indicated (via the FST index) that An. neivai gene flow occurs across an altitudinal range [67]. However, population differentiation did not follow a gradual pattern. The genetic structure revealed marked differences among populations, with substantial within-group variation accounting for 38.13% of the total. Differentiation was not proportional across sites, and comparisons involving La Barra showed higher FST values. Nucleotide and haplotype diversity metrics indicated that Bajo Calima and the Pericos Natural Reserve (PNR) were more genetically diverse and heterogeneous than La Barra and La Elsa.
The observed patterns may be consistent with a scenario of population expansion at intermediate altitudes, potentially contributing to the accumulation of low-frequency nucleotide and haplotype variants. Nevertheless, further studies using broader nuclear and ribosomal markers, with increased sequence numbers and expanded analyses, are needed to confirm these patterns.
All mosquito populations from the Pacific Coast were grouped into central haplotypes, despite the large latitudinal distances among sites. La Elsa, Pericos Natural Reserve, and Bajo Calima diverged through multiple mutational steps when compared to other regions in the Americas, such as Guyana and Guatemala. Using the K2P method and applying the Hebert criterion [68], we estimated genetic distances for species delimitation. This analysis suggests the presence of at least two lineages within An. neivaiAn. neivai s.s. and a possible An. neivai lineage 8. Indeed, recent studies on the Kerteszia genus based on the COI gene have shown high genetic diversity, identifying up to eight species within what was previously considered An. neivai [14]. Based on the population structure, genetic data, and haplotype network, we infer that the La Barra population corresponds to An. neivai s.s.
Nonetheless, genetic distances between the La Barra population and the three groups from higher altitudes exceeded the expected range for this lineage, reaching values close to 6% [14,23]. This suggests that the second lineage found at higher altitudes may correspond to An. neivai 8, based on shared haplotypes between Bajo Calima and Pericos Natural Reserve (PNR), as well as previously described specimens of this lineage [14,16].
Several aspects warrant consideration when interpreting these findings. First, the observed genetic distances based on COI sequences ranged from 0.0% to 4.78%, reflecting substantial variability among populations. Notably, a specimen from Bajo Calima shared genetic characteristics with An. neivai s.s., suggesting a potential case of parasympatric divergence [69]. Moreover, some pairwise genetic distances between specimens from Bajo Calima, Pericos Natural Reserve, and La Elsa fall within the COI threshold range for species delimitation in insects (3–10%) [70] and could be consistent with the presence of additional evolutionary lineages [68]. However, neither morphological traits nor molecular evidence, such as exclusive haplotypes, currently support the recognition of more than two lineages in the region.
The QST y FST index comparison indicated that neutral processes had a major influence over the population’s diversification rather than selective pressures. The morphological differentiation was similar to the molecular expectation [24]. This affirmation is based on the first canonical factor from the morphometric geometric analysis that comprehends the highest morphological variation. In contrast, the variation observed in quantitative traits such as wing spot proportions was more limited, possibly reflecting the uniform selection acting on these features [71].
The results suggest that coastal populations may represent the ancestral gene pool of An. neivai, with a possible colonization process occurring as altitude increases. The genetic patterns observed at 50 m a.s.l. (Bajo Calima), such as high haplotype and nucleotide diversity, may reflect an initial bottleneck followed by local diversification. This contrasts with higher-elevation populations, such as La Elsa (1100 m a.s.l.), which may have originated from more recent colonization events involving reduced genetic variability. However, further studies are needed to confirm this hypothesis, including approaches that combine genetic analyses with ecological niche modelling [72].

5. Conclusions

The morphological and molecular analysis of Anopheles neivai s.l. across different elevations in the Colombian Pacific highlights that altitude, together with changes in biotic and abiotic variables, may influence the population structure and variation in this species. Clear differences were detected among vector populations using both traditional and geometric wing morphometrics, particularly between the lowland site of La Barra (5 m a.s.l.) and populations at higher elevations.
Wing morphometric analysis proved to be a powerful tool to understand vector–environment interactions. Variations in wing shape and size reflected local adaptations to environmental conditions, such as altitude, with implications for flight, dispersal, survival, and pathogen transmission. These findings underscore the value of incorporating morphometric approaches into entomological surveillance and vector control programmes, particularly under accelerated environmental change.
Likewise, we report costal wing spot patterns not previously described for An. neivai. Our COI gene molecular analysis suggests the presence of at least two genetic lineages of An. neivaiAn. neivai s.s. and possibly An. neivai 8. An. neivai s.s. was encountered in lower altitudes at the Pacific coastal region in La Barra. Simultaneously, An. neivai 8 can have a predominant presence at Bajo Calima, Pericos Natural Reserve, and La Elsa.
Bajo Calima and Pericos Natural Reserve exhibited greater genetic diversity and heterogeneity compared to the other mosquito populations studied. This pattern may be associated with a past expansion event at intermediate altitudes, although further studies are needed to confirm this. The QST-FST index comparison indicates that the observed morphological variation aligned with our molecular expectations. Therefore, it reinforces the idea that divergence is not primarily driven by selective adaptation.
To conclude, the research demonstrates that altitude does influence An. neivai, both morphologically and genetically. Correspondingly, it highlights the importance of studying vector mosquito populations across altitudinal gradients to gain a broader and deeper understanding of malaria’s evolutionary dynamics. Additional studies with more extensive molecular markers and diversification patterns are required.

Supplementary Materials

The following supporting information can be downloaded at https://www.mdpi.com/article/10.3390/taxonomy5030048/s1. Table S1: Georeferencing of the specimen localities used for the COI gene sequence analysis available for Anopheles neivai. Figure S1: Linear regression plot to assess allometry effect in four populations of Anopheles neivai. Table S2: Comparison between populations using the FST index. Distance method: Pairwise difference.

Author Contributions

Conceptualization: N.V.-G., S.C.-B., H.C. and R.G.-O.; formal analysis: N.V.-G., R.G.-O., H.C. and N.R.-F.; investigation: N.V.-G., S.C.-B. and R.G.-O.; data curation: N.V.-G. and N.R.-F.; supervision: R.G.-O.; writing—original draft preparation: N.V.-G.; Writing—review and editing: N.V.-G., S.C.-B., R.G.-O., H.C. and N.R.-F.; funding acquisition: R.G.-O. All authors have read and agreed to the published version of the manuscript.

Funding

This research received no external funding.

Data Availability Statement

Photographs of Anopheles neivai wings from La Elsa, Pericos Natural Reserve, Bajo Calima, and La Barra populations are available on the Open Science Framework: osf.io/p46qb. The sequences of the COI gene of Anopheles neivai obtained in this study are available on NCBI-GenBank: https://www.ncbi.nlm.nih.gov/nuccore/PP277451.1 (accessed on 11 February 2024).

Acknowledgments

We extended our appreciation to the property owners that enabled us to capture our mosquito samples. We thank Javier Montaño for statistical analysis counselling; the Laboratory of Molecular Biology at Universidad del Valle; Jimmy Cabra for thesis evaluation and advice; and Jeniffer Rojas for linguistic consultancy.

Conflicts of Interest

The authors declare no conflicts of interest.

References

  1. Demirci, B.; Lee, Y.; Lanzaro, G.C.; Alten, B. Altitudinal genetic and morphometric variation among populations of Culex theileri Theobald (Diptera: Culicidae) from northeastern Turkey. J. Vector Ecol. 2012, 37, 197–209. [Google Scholar] [CrossRef]
  2. Laporta, G.Z.; Ramos, D.G.; Ribeiro, M.C.; Sallum, M.A.M. Habitat suitability of Anopheles vector species and association with human malaria in the Atlantic Forest in south-eastern Brazil. Mem. Do Inst. Oswaldo Cruz 2011, 106, 239–245. [Google Scholar] [CrossRef]
  3. Parker, A.; Gardner, A.; Perez, M.; Allan, B.; Muturi, E. Container Size Alters the Outcome of Interspecific Competition Between Aedes aegypti (Diptera: Culicidae) and Aedes albopictus. J. Med. Entomol. 2019, 56, 708–715. [Google Scholar] [CrossRef]
  4. Prudhomme, J.; Velo, E.; Bino, S.; Kadriaj, P.; Mersini, K.; Gunay, F.; Alten, B. Altitudinal variations in wing morphology of Aedes albopictus (Diptera, Culicidae) in Albania, the region where it was first recorded in Europe. Parasite 2019, 26, 55. [Google Scholar] [CrossRef]
  5. Reiskind, M.; Zarrabi, A. Is bigger really bigger? Differential responses to temperature in measures of body size of the mosquito, Aedes albopictus. J. Insect Physiol. 2012, 58, 911–917. [Google Scholar] [CrossRef]
  6. Gómez, G.F.; Márquez, E.J.; Gutiérrez, L.A.; Conn, J.E.; Correa, M.M. Geometric morphometric analysis of Colombian Anopheles albimanus (Diptera: Culicidae) reveals significant effect of environmental factors on wing traits and presence of a metapopulation. Acta Trop. 2014, 135, 75–85. [Google Scholar] [CrossRef]
  7. Mayekar, H.; Solanki, P.; Arya, H.; Aradhya, R.; Suravajhala, P.; Loeschcke, P.; Rajpurohit, S. Tropical High-Altitude Insects Show Limited Capacity to Handle High Temperatures. bioRxiv 2023. [Google Scholar] [CrossRef]
  8. González, R.; Cárdenas, H.; Marín-Londoño, O.A. Temperature effect on the phenotypic expression of characters of costal spots Nyssorhynchus triannulatus (Diptera: Culicidae: Anophelinae). Rev. Colomb. De Entomol. 2021, 47, e8456. [Google Scholar] [CrossRef]
  9. Chatpiyaphat, S.; Sumruayphol, S.; Dujardin, J.P.; Samung, Y.; Phayakkaphon, A.; Cui, L.; Ruangsittichai, J.; Sungvornyothin, S.; Sattabongkot, J.; Sriwichai, P. Geometric morphometrics to distinguish the cryptic species Anopheles minimus and An. harrisoni in malaria hot spot villages, western Thailand. Med. Veter-Entomol. 2020, 35, 293–301. [Google Scholar] [CrossRef] [PubMed]
  10. Cella, W.; Junior, R.; Pimenta, P.; Monteiro, W. Morphometry of the wings of Anopheles aquasalis in simulated scenarios of climate change. Rev. Da Soc. Bras. Med. Trop. 2024, 57, e00704-2024. [Google Scholar] [CrossRef]
  11. Leyton Ramos, L.M.; Aguirre Obando, O.A.; Duque, J.E.; García-Merchán, V.H. Effect of altitude on wing metric variation of Aedes aegypti (Diptera: Culicidae) in a region of the Colombian Central Andes. PLoS ONE 2020, 15, e0228975. [Google Scholar] [CrossRef]
  12. Lorenz, C.; Marques, T.C.; Sallum, M.; Suesdek, L. Altitudinal population structure and microevolution of the malaria vector Anopheles cruzii (Diptera: Culicidae). Parasites Vectors 2014, 7, 581. [Google Scholar] [CrossRef]
  13. Escovar, J.; González, R.; Quiñones, M. Anthropophilic biting behaviour of Anopheles (Kerteszia) neivai Howard, Dyar & Knab associated with Fishermen’s activities in a malaria-endemic area in the Colombian Pacific. Mem Inst Oswaldo Cruz. 2013, 108, 1057–1064. [Google Scholar] [PubMed] [PubMed Central]
  14. Bourke, B.; Wilkerson, R.; Ruiz-Lopez, F.; Justi, S.; Pecor, D.; Quiñones, M.; Navarro, J.; Alarcón-Ormaza, J.; Alarcón-Ormaza, J., Jr.; González, R.; et al. High levels of diversity in Anopheles Subgenus Kerteszia revealed by species delimitation analyses. Genes 2023, 14, 344. [Google Scholar] [CrossRef]
  15. González, R.; Carrejo, N. Introducción al Estudio Taxonómico de Anopheles de Colombia: Claves y Notas de Distribución, 2nd ed.; Programa Editorial Universidad del Valle: Cali, Colombia, 2009. [Google Scholar]
  16. Ahumada, M.; Orjuela, L.; Pareja, P.; Conde, M.; Cabarcas, D.; Cubillos, E.; López, J.; Beier, J.; Herrera, S.; Quiñones, M. Spatial distributions of Anopheles species in relation to malaria incidence at 70 localities in the highly endemic Northwest and South Pacific coast regions of Colombia. Malar. J. 2016, 15, 407. [Google Scholar] [CrossRef] [PubMed]
  17. Montoya-Lerma, J.; Solarte, Y.; Giraldo-Calderón, G.; Quiñones, M.; Ruiz-López, F.; Wilkerson, R.; González, R. Malaria vector species in Colombia: A review. Mem. Inst. Oswaldo Cruz 2011, 106, 223–238. [Google Scholar] [CrossRef]
  18. Murillo, C.; Jaramillo, C.; Quintero, J.; Suarez, M. Biología de Anopheles (Kerteszia) neivai H., D. & K., 1913 (DIPTERA: CULICIDAE) en la costa Pacífica de Colombia. Estructura etaria y transmisión de malaria. Rev. Saude Publica 1989, 23, 363–367. Available online: https://www.scielosp.org/pdf/rsp/1989.v23n5/363-367/es (accessed on 18 September 2024).
  19. Murillo, C.; Astaiza, R.; Fajardo, P. Biología de Anopheles (Kerteszia) neivai H., D. & K., 1913 (Diptera:Culicidae) en la costa Pacífica de Colombia. III. Medidas de luminosidad y el comportamiento de picadura. Rev. Saude Publica 1988, 22, 109–112. [Google Scholar]
  20. Word Health Organization (WHO). WHO Guidelines for Malaria 2023. Available online: https://www.who.int/publications/i/item/guidelines-for-malaria (accessed on 18 September 2024).
  21. López-Rubio, A.; Suaza-Vasco, J.; Solari, S.; Gutiérrez-Builes, L.; Porter, C.; Uribe, S. Intraspecific phylogeny of Anopheles (Kerteszia) neivai Howard, Dyar & Knab, 1913, based on mitochondrial and nuclear ribosomal genes. Infect. Genet. Evol. 2019, 67, 183–190. [Google Scholar] [CrossRef] [PubMed]
  22. López-Rubio, A.; Suaza, J.; Porter, C.; Uribe, S.; Bedoya, G.; Vélez, I. Phylogenetic signal at the Cytb-SertRNA-IG1-ND1 mitochondrial region in Anopheles (Kerteszia) neivai Howard, Dyar & Knab, 1913. Biomédica 2017, 37, 143–154. [Google Scholar] [PubMed]
  23. López-Rubio, A.; Suaza-Vasco, J.; Marcet, P.; Ruíz-Molina, N.; Cáceres, L.; Porter, C.; Uribe, S. Use of DNA barcoding to distinguish the malaria vector Anopheles neivai in Colombia. Zootaxa 2016, 4175, 377–389. [Google Scholar] [CrossRef] [PubMed]
  24. Leinonen, T.; McCairns, R.; O’Hara, R.; Merilä, J. QST–FST comparisons: Evolutionary and ecological insights from genomic heterogeneity. Nat. Rev. Genet. 2013, 14, 179–190. [Google Scholar] [CrossRef] [PubMed]
  25. Gentry, A.; Dodson, C. Contributions of non-trees to species richness of a tropical rainforest. Biotropica 1987, 19, 149–156. [Google Scholar] [CrossRef]
  26. Faber-Langendoen, D.; Gentry, A. The structure and diversity of rain forests at Bajo Calima, Chocó Region, Western Colombia. Biotropica 1991, 23, 2–11. [Google Scholar] [CrossRef]
  27. Mejía, M. Litoral Pacífico colombiano y cuenca del Atrato: Clima y uso de la tierra. Cuad. Geogr. 1991, 3, 63–68. [Google Scholar]
  28. CONIF (Corporación Nacional de Investigación y Fomento Forestal). Participación Comunitaria Para Manejo de Bosques Secundarios del Bajo Calima; CVC: Bogotá, Colombia, 1997. [Google Scholar]
  29. CVC (Corporación Autónoma Regional del Valle del Cauca). Memoria del Proyecto de Protección del Ecosistema de la Quebrada Pericos. 2007. Available online: https://es.scribd.com/document/22251256/Memoria-Area-en-Conservacion-Microcuenca-Quebrada-Pericos-Pacifico-Colombiano-Buenaventura (accessed on 24 August 2020).
  30. Rodríguez, N. Ecosistemas de los Andes Colombianos; Instituto de Investigación de Recursos Biológicos Alexander Von Humboldt: Bogotá, Colombia, 2006. [Google Scholar]
  31. Vargas, F.; Bolaños, M. Presencia de reptiles en la región de Anchicayá, Pacífico Colombiano, a través de un gradiente de deforestación. Caldasia 1999, 21, 235–238. [Google Scholar]
  32. Harrison, B.; Ruiz-López, F.; Calderón, G.; Savage, H.; Pecor, J.; Wilkerson, R. Anopheles (Kerteszia) lepidotus (Diptera: Culicidae), not the malaria vector we thought it was: Revised male and female morphology; larva, pupa, and male genitalia characters; and molecular verification. Zootaxa 2012, 3218, 1–17. [Google Scholar] [CrossRef]
  33. Wilkerson, R.; Peyton, E. Standardized nomenclature for the costal wing spots of the genus Anopheles and other spotted-wing mosquitoes (Diptera: Culicidae). Med. Èntomol. 1990, 27, 207–224. [Google Scholar] [CrossRef]
  34. Gareth, J.; Witten, D.; Hastie, T.; Tibshirani, R. An Introduction to Statistical Learning: With Applications in R; Springer: Berlin/Heidelberg, Germany, 2013; Available online: https://www.statlearning.com/ (accessed on 18 February 2020).
  35. R Core Team. R: A Language and Environment for Statistical Computing; R Foundation for Statistical Computing: Vienna, Austria, 2020; Available online: https://www.R-project.org/ (accessed on 21 March 2020).
  36. Bates, D.; Maechler, M.; Bolker, B.; Walker, S. Fitting Linear Mixed-Effects Models Using lme4. J. Stat. Softw. 2015, 67, 1–48. [Google Scholar] [CrossRef]
  37. Pinheiro, J.; Bates, D.; DebRoy, S.; Sarkar, D. nlme: Linear and Nonlinear Mixed Effects Models. R package Version 3.1-143. 2019. Available online: https://CRAN.R-project.org/package=nlme (accessed on 21 March 2020).
  38. Fox, J.; Weisberg, S. An {R} Companion to Applied Regression, 3rd ed.; Sage: Thousand Oaks, CA, USA, 2019; Available online: https://www.john-fox.ca/Companion/ (accessed on 21 March 2020).
  39. Wickham, H. ggplot2: Elegant Graphics for Data Analysis; Springer: New York, NY, USA, 2009. [Google Scholar] [CrossRef]
  40. Dujardin, J. Morphometrics applied to medical entomology. Infect. Genet. Evol. 2008, 8, 875–890. [Google Scholar] [CrossRef]
  41. Landis, J.; Koch, G. The measurement of observer agreement for categorical data. Biometrics 1977, 33, 159–174. [Google Scholar] [CrossRef]
  42. Bender, W.; Spierer, P.; Hogness, D. Chromosomal walking and jumping to isolate DNA from the Ace and rosy loci and the Bithorax complex in Drosophila melanogaster. J. Mol. Biol. 1983, 168, 17–33. [Google Scholar] [CrossRef] [PubMed]
  43. Birungi, J.; Munstermann, L. Genetic Structure of Aedes albopictus (Diptera: Culicidae) Populations Based on Mitochondrial ND5 Sequences: Evidence for an independent invasion into Brazil and United States. Ann. Entomol. Soc. Am. 2002, 95, 125–132. [Google Scholar] [CrossRef]
  44. Folmer, O.; Black, M.; Hoeh, W.; Lutz, R.; Vrijenhoek, R. DNA primers for amplification of mitochondrial cytochrome C oxidase subunit I from diverse metazoan invertebrates. Mol. Mar. Biol. Biotechnol. 1994, 3, 294–299. Available online: https://pubmed.ncbi.nlm.nih.gov/7881515/ (accessed on 19 November 2019).
  45. Tálaga, S.; Leroy, C.; Guidez, A.; Girod, R.; Dejean, A.; Murienne, J. DNA reference libraries of French Guianese mosquitoes for barcoding and metabarcoding. PLoS ONE 2017, 12, e0176993. [Google Scholar] [CrossRef]
  46. Geneious Prime 2020.1. 2020. Available online: https://www.geneious.com (accessed on 14 April 2020).
  47. Edgar, R. MUSCLE: Multiple sequence alignment with high accuracy and high throughput. Nucleic Acids Res. 2004, 32, 1792–1797. [Google Scholar] [CrossRef]
  48. NCBI (National Center for Biotechnology Information). Basic Local Alignment Search Tool. 2020. Available online: http://blast.ncbi.nlm.nih.gov/Blast.cgi (accessed on 25 June 2020).
  49. Paradis, E.; Schliep, K. ape 5.0: An environment for modern phylogenetics and evolutionary analyses in R. Bioinformatics 2019, 35, 526–528. [Google Scholar] [CrossRef]
  50. Bandelt, H.; Forster, P.; Röhl, A. Median-joining networks for inferring intraspecific phylogenies. Mol. Biol. Evol. 1999, 16, 37–48. [Google Scholar] [CrossRef] [PubMed]
  51. Leigh, J.; Bryant, D. PopART: Full-Feature Software for Haplotype Network Construction. Methods Ecol. Evol. 2015, 6, 1110–1116. Available online: https://popart.maths.otago.ac.nz/ (accessed on 27 June 2020). [CrossRef]
  52. Excoffier, L.; Lischer, H. Arlequin suite ver 3.5: A new series of programs to perform population genetics analyses under Linux and Windows. Mol. Ecol. Resour. 2010, 10, 564–567. [Google Scholar] [CrossRef]
  53. Kumar, S.; Stecher, G.; Li, M.; Knyaz, C.; Tamura, K. MEGA X: Molecular Evolutionary Genetics Analysis across computing platforms. Mol. Biol. Evol. 2018, 35, 1547–1549. [Google Scholar] [CrossRef]
  54. Oliveira, T.; Foster, P.; Bergo, E.; Nagaki, S.; Sanabani, S.; Marinotti, O.; Marinotti, P.; Sallum, M. Mitochondrial Genomes of Anopheles (Kerteszia) (Diptera: Culicidae) from the Atlantic Forest, Brazil. J. Med. Entomol. 2016, 53, 790–797. [Google Scholar] [CrossRef] [PubMed]
  55. Le Corre, V.; Kremer, A. Genetic variability at neutral markers, quantitative trait loci and traits in a subdivided population under selection. Genetics 2003, 164, 1205–1219. [Google Scholar] [CrossRef]
  56. Zavortink, T. A review of the subgenus Kerteszia of Anopheles. Contrib. Am. Entomol. Inst. 1973, 9, 1–37. [Google Scholar]
  57. Harbach, R.; Navarro, J. A new species of Anopheles subgenus Kerteszia (Diptera: Culicidae) from Venezuela. Insect Syst. Evol. 1996, 27, 205–207. [Google Scholar] [CrossRef]
  58. Cova-García, P.; Pulido, J.; Escalante, C. Anopheles (Kerteszia) hilli (Diptera, Culicidae), una nueva especie de Venezuela. Boletín Dir. Malariol. Saneam. Ambient. 1976, 16, 344–353. [Google Scholar]
  59. Cova-García, P.; Pulido, J.; Escalante, C. Anopheles (Kerteszia) gonzalezrinconesi n. sp. (Diptera, Culicidae) de Venezuela. Boletín Dir. Malariol. Saneam. Ambient. 1977, 17, 140–149. [Google Scholar]
  60. Montoya-Lerma, J.; Murillo, C.; Solarte, Y. Variación fenotípica de Anopheles (K) neivai (Diptera: Culicidae) en la costa Pacífica de Colombia. Colomb. Médica 1987, 8, 25–27. [Google Scholar] [CrossRef]
  61. Blanke, A. Analysis of modularity and integration suggests evolution of dragonfly wing venation mainly in response to functional demands. J. R. Soc. Interface 2018, 15, 20180277. [Google Scholar] [CrossRef]
  62. Benítez, H.A.; Püschel, T.A.; Suazo, M.J. Drosophila Wing Integration and Modularity: A Multi-Level Approach to Understand the History of Morphological Structures. Biology 2022, 11, 567. [Google Scholar] [CrossRef]
  63. Gómez, G.; Correa, M. Discrimination of Neotropical Anopheles species based on molecular and wing geometric morphometric traits. Infect. Genet. Evol. 2017, 54, 379–386. [Google Scholar] [CrossRef]
  64. Rodríguez-Zabala, J.; González, R.; Correa, M.; Gómez, G. Análisis morfométrico de dos poblaciones de Anopheles (Anopheles) calderoni (Diptera: Culicidae) del suroccidente colombiano. Rev. Mex. Biodivers. 2016, 87, 966–971. [Google Scholar] [CrossRef]
  65. Shelomi, M. Where are we now? Bergmann’s rule Sensu Lato in insects. Am. Nat. 2012, 180, 511–519. [Google Scholar] [CrossRef] [PubMed]
  66. Murillo, C.; Astaiza, R.; Fajardo, O. Biología de Anopheles (Kerteszia) neivai H., D. & K., 1913 (Diptera: Culicidae) en la costa pacífica de Colombia I. Fluctuación de la población larval y características de sus criaderos. Rev. Saude Publica 1988, 22, 94–100. [Google Scholar] [PubMed]
  67. Whitlock, M.; McCauley, D. Indirect measures of gene flow and migration: FST≠1/(4Nm+1). Heredity 1999, 82, 117–125. [Google Scholar] [CrossRef] [PubMed]
  68. Hebert, P.; Cywinska, A.; Ball, S.L.; Dewaard, J.R. Biological identifications through DNA barcodes. Proc. R. Soc. Lond. Ser. B Biol. Sci. 2003, 270, 313–321. [Google Scholar] [CrossRef]
  69. Vázquez-Domínguez, E.; Castañeda-Rico, S.; Garrido-Garduño, T.; Gutiérrez-García, T. Avances metodológicos para el estudio conjunto de la información genética, genealógica y geográfica en análisis evolutivos y de distribución. Rev. Chil. Hist. Nat. 2009, 82, 277–297. [Google Scholar] [CrossRef]
  70. Zhang, H.; Bu, W. Exploring Large-Scale Patterns of Genetic Variation in the COI Gene among Insecta: Implications for DNA Barcoding and Threshold-Based Species Delimitation Studies. Insects 2022, 13, 425. [Google Scholar] [CrossRef]
  71. Miller, J.; Wood, B.; Hamilton, M. FST and QST under neutrality. Genetics 2008, 180, 1023–1037. [Google Scholar] [CrossRef]
  72. Carstens, B.C.; Richards, C.L. Integrating coalescent and ecological niche modeling in comparative phylogeography. Evolution 2007, 61, 1439–1454. [Google Scholar] [CrossRef]
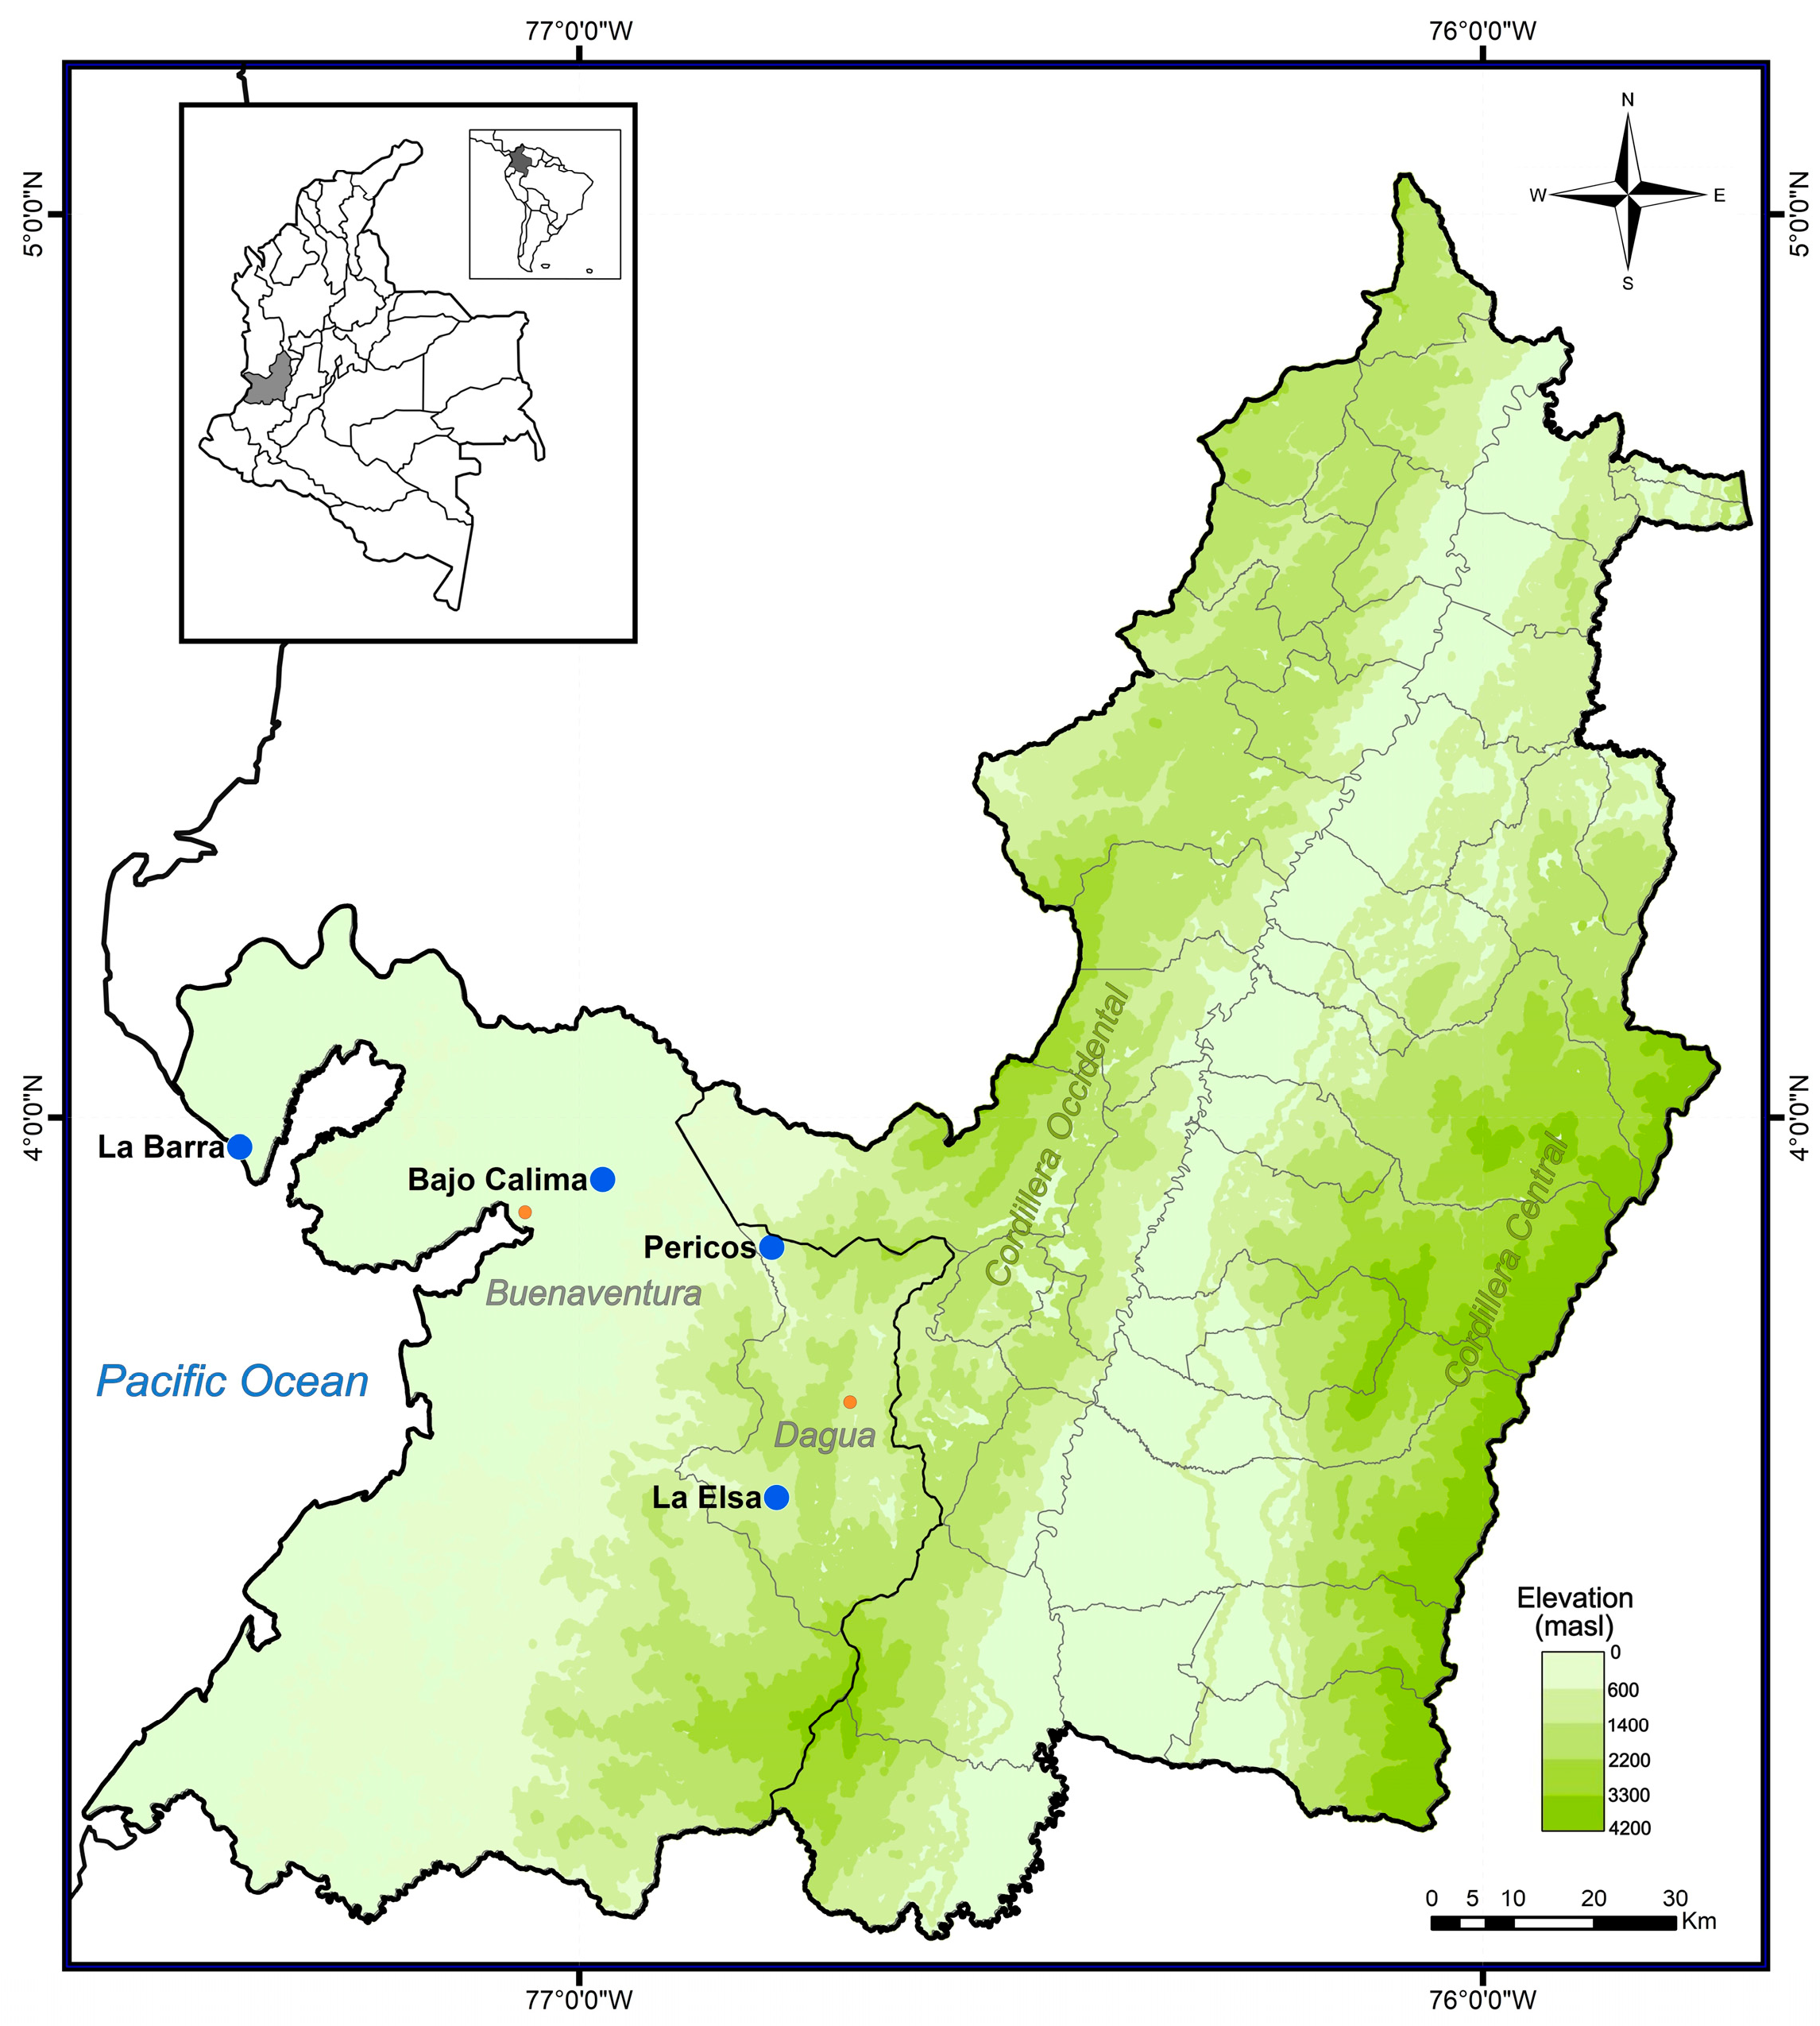
Figure 1. Study area on the Pacific versant of the western range of the Andes Mountains. Blue dots represent each sampling locality within the municipalities of Buenaventura and Dagua, Valle del Cauca department, Colombia. Note: Map generated with QGIS (version 3.44.2) using a digital elevation model from the Instituto Geográfico Agustín Codazzi (IGAC, Colombia), available at https://www.colombiaenmapas.gov.co/.
Taxonomy 05 00048 g001
Figure 2. Costal wing spots nomenclature [33] for Anopheles neivai in traditional morphometry analysis. Basal dark (BD) + Prehumeral dark (PHD); Humeral pale (HP); Humeral dark (HD) + Pre-sector pale (PSP) + Pre-sector dark (PSD); Sector pale (SP); Proximal sector dark (PRSD); Accessory sector pale (ASP); Distal sector dark (DSD); Subcostal pale (ScP); Preapical dark (PD); Preapical pale (PP) and Apical dark (AD). TWL: total wing length, from the alula to the distal margin. In yellow, we highlight the numbered landmarks that were evaluated in the geometric morphometric analysis.
Taxonomy 05 00048 g002
Figure 3. Existing wing patterns of An. neivai in the Bajo Calima population. Pattern I: costal spots described for Anopheles neivai s.s. and dark scales for R4+5 veins with light scales in its base. Pattern II: absence of the costal spot ASP and R4+5 vein with light scales in its base. Pattern III: absence of SCP costal spot and R4+5 dark with light scales in its base. Pattern IV: presence of costal spots and R4+5 vein with light scales in both the base and middle area.
Taxonomy 05 00048 g003
Figure 4. Mahalanobis distances between An. neivai populations of La Barra, Bajo Calima, Pericos Natural Reserve (PNR), and La Elsa, represented in a UPGMA tree.
Taxonomy 05 00048 g004
Figure 5. Wing shape graphic with geometric morphometrics in four Anopheles neivai populations. LB: La Barra, BC: Bajo Calima, P: Pericos Natural Reserve, LE: La Elsa. (a) (PCA) Principal component analysis. PC1 and PC2 represented 62% and 24% of the explained variance per each component for the wing shape. (b) Canonical correlation analysis 1 and 2. The centroids are indicated geometrically by squares and polygons delimiting the external shape of the population.
Taxonomy 05 00048 g005
Figure 6. Centroid size variation among four Anopheles neivai populations. LB: La Barra, BC: Bajo Calima, P: Pericos Natural Reserve (PNR), LE: La Elsa. Black lines represent the minimum and maximum centroid sizes. Red boxes illustrate the interquartile range: Q1 (25th percentile), Q2 (median), and Q3 (75th percentile), from left to right.
Taxonomy 05 00048 g006
Figure 7. Haplotypes network of the CO-I gene from Anopheles neivai for La Barra, Bajo Calima, Pericos Natural Reserve (PNR), and La Elsa populations. The circle’s size indicates the haplotype frequency, while the short transversal lines indicate a mutational event.
Taxonomy 05 00048 g007
Figure 8. Consensus dendrogram of Anopheles neivai populations constructed using the Neighbour-Joining method and Kimura two-parameter (K2P) model. The percentages indicate the frequency with which associated taxa clustered together in the bootstrap replicates (500 iterations), shown next to the branches.
Taxonomy 05 00048 g008
Figure 9. Haplotype network with CO-I gene for all available sequences of Anopheles neivai. The size of the circles indicates the haplotype frequency. Each step marks a mutational event.
Taxonomy 05 00048 g009
Table 1. Multiple linear regression models adapted to each costal spot’s proportions and variabilities. R2: Coefficient of determination with all variables. R2 Model: Coefficient of determination for the model with selected variables.
VariableR2ModelR2 Model
BD + PHD0.4560BD + PHD~HP + Population *0.428
HP0.2779HP~BDPHD + HDPSD + Population *0.237
HD + PSP + PSD0.5980HD + PSP + PSD ~ SP + PRSD *0.533
SP0.6158SP~HD + PSP + PSD + PRSD *0.609
PRSD0.6484PRSD~HD + PSP + PSD + SP + ASP *0.534
ASP0.5699ASP~PRSD + DSD *0.438
DSD0.5715DSD~ASP + SCP + PD *0.523
SCP0.5461SCP~PD + DSD *0.433
PD0.4679PD~SCP + PP + AD *0.375
PP0.327PP~PD + AD + SCP + DSD *0.222
AD0.1318AD~All variables *0.132
* Indicates significant p-value (p < 0.05)—level of marginal significance within a statistical hypothesis test.
Table 2. ANOVA test of costal spot proportions and total wing length (TWL). F represents the MSGroups/MSE proportion; d.f. represents degrees of freedom. The QST proportion between Vgroups/Vtotal and QST varies with respect to the molecular differentiation coefficient FST (=0.6188).
VariableFd.f.p-ValueQSTQST/FST
BD + PHD11.26337<0.0001 *0.10860.1755
HP4.113400.0069 *0.03550.0574
HD + PSP + PSD34.07340<0.0001 *0.28100.4541
SP35.36340<0.0001 *0.28870.4666
PRSD35.50340<0.0001 *0.28950.4680
ASP27.34340<0.0001 *0.23740.3836
DSD40.613400.56810.31880.5152
ScP22.32340<0.0001 *0.20120.3252
PD69.83337<0.0001 *0.45080.7285
PP18.5933<0.0001 *0.17960.2903
AD20.952950.83970.21440.3465
TWL181.81341<0.00010.68111.1008
* It indicates significant p-value (p < 0.05). TWL: total wing longitude.
Table 3. Statistical significance for each of the post hoc comparisons with Tukey’s method among population pairs for coastal spots observed in An. neivai.
VariableLB-BCLB-PNRLB-LEBC-PNRBC-LEPNR-LE
BD + PHD0.0003 *<0.0001 *0.0130 *0.0130 *<0.0001 *0.1090
HP0.25300.19700.20000.99400.0002 *0.0002 *
HD + PSP + PSD0.00008 *0.0001 *<0.0001 *0.99900.66300.7720
SP0.0010 *0.00004 *<0.0001 *0.66100.36000.9820
PRSD0.00001 *<0.0001 *0.00001 *0.20700.99900.1750
ASP>0.99990.0020 *0.24100.0028 *0.26600.1970
SCP0.07900.06000.0480 *0.99500.99700.9990
PD0.25300.19700.20000.99400.0002 *0.0002 *
PP0.0250 *0.22100.99000.82200.0033 *0.0740
TWL<0.0001 *<0.0001 *<0.0001 *<0.0001 *<0.0001 *<0.0001 *
LB: La Barra, BC: Bajo Calima, PNR: Pericos Natural Reserve, LE: La Elsa. * Significant p-value (p < 0.05). TWL: total wing longitude.
Table 4. Diversity parameters and molecular neutrality test for the CO-I regions of 343 bp on 13 Anopheles neivai populations.
PopulationH/nPolymorphic SiteshπDFs
B. Calima5/6250.930.025−1.27−1.16
Pericos6/10250.840.0250.02−3.83 *
B/tura4/8240.750.0300.74−2.05
Guatemala6/8220.920.021−0.62−2.83 *
B. Solano6/970.880.005−1.18−9.16 *
Nuquí4/860.780.005−0.99−7.66 *
Portobelo3/630.730.0040.86−5.14 *
La Elsa2/420.500.002−0.70−3.13 *
La Barra2/510.400.001−0.81−7.58 *
Litoral2/510.600.0011.22−6.27 *
Tumaco2/810.250.0007−1.05−18.8 *
Acandí1/200.000.000.000.00
Guyana1/400.000.0000.000.00
H = number of haplotypes; n = sample size; h = haplotype diversity; π = nucleotide diversity; D = Tajima’s D test; Fs = Fu’s Fs test. * Significant p-value (p < 0.05).
Disclaimer/Publisher’s Note: The statements, opinions and data contained in all publications are solely those of the individual author(s) and contributor(s) and not of MDPI and/or the editor(s). MDPI and/or the editor(s) disclaim responsibility for any injury to people or property resulting from any ideas, methods, instructions or products referred to in the content.