Article

Uncovering the Possibilities of Ceramic Ba(1−x)CoxTiO3 Nanocrystals: Heightened Electrical and Dielectric Attributes

by
Sana Jebali
1,†,
Chadha Mejri
1,†,
Wael Albouchi
1,
Mahdi Meftah
1,
Abderrazek Oueslati
2 and
Walid Oueslati
1,*
1
LR19ES20: Ressources, Materials and Ecosystem (RME), Faculty of Sciences of Bizerte, University of Carthage, Bizerte 7021, Tunisia
2
Laboratory for Spectroscopic and Optical Characterization of Materials (LaSCOM), Faculty of Sciences, University of Sfax, BP 1171, Sfax 3000, Tunisia
*
Author to whom correspondence should be addressed.
These authors contributed equally to this work.
Solids 2024, 5(3), 460-484; https://doi.org/10.3390/solids5030031
Submission received: 20 June 2024 / Revised: 29 August 2024 / Accepted: 13 September 2024 / Published: 18 September 2024

Abstract

:
The hydrothermal synthesis of Ba1−xCoxTiO3 (BCT) ceramic nanocrystals across varied substitution fractions (x = 0, …, 1) is the subject of this study. Hydrothermal synthesis is well known for producing high-purity and well-crystallized nanocrystals. A thorough examination is conducted to examine the effects on the structural and electrical properties of the resultant BCT nanocrystals by altering the cobalt substitution fraction. X-ray diffraction (XRD) is used to analyze the structure, while complex impedance spectroscopy (CIS) is used to analyze the electrical properties. As the cobalt content rises, XRD examination reveals a smooth transition from the ferroelectric BaTiO3 phase to the ferromagnetic CoTiO3 phase, offering extensive insights into the phase composition and crystallographic alterations. This phase shift is important because it creates new opportunities to adjust the properties of the material for particular uses. The electrical activity of BCT nanocrystals is clarified further by CIS measurements. A distribution of relaxation times, frequently linked to complex microstructures or heterogeneous materials, is suggested by the detected non-Debye relaxation. A thermally activated conduction process, in which higher temperatures promote the passage of charge carriers, is suggested by the temperature-dependent increase in conductivity. This behavior is strongly dependent on the cobalt content, suggesting that cobalt enhances electrical conductivity and crystallinity through a catalytic effect. A frequency-dependent dielectric constant that rises with temperature and cobalt content is shown by investigating the dielectric characteristics of BCT nanocrystals. Improved polarization mechanisms inside the material are suggested by this increase in dielectric constant, which may be the result of cobalt ion presence. With a thorough grasp of the dielectric behavior, the examination of the loss angle further validates the non-Debye relaxation process.

1. Introduction

In the relentless pursuit of cleaner and more efficient energy solutions, advanced materials have gained paramount significance in shaping the future of power generation, transportation and electronics [1,2,3]. High-performance energy storage devices are essential for a sustainable energy landscape, with transition metal oxides being a focal point due to their remarkable electronic properties and diverse chemical compositions [4,5,6]. These materials enhance the efficiency and capacity of energy storage systems, fueling hopes for a cleaner energy future [7,8,9]. Notably, Ba1−xCoxTiO3 (BCT) nanocrystals, with their intriguing electrical and dielectric properties, hold significant potential in revolutionizing energy storage [10,11]. This study focuses on the synthesis, structural analysis and electrical characterization of BCT nanocrystals, aiming to explore their potential in energy storage applications [12,13,14].
Previous studies on BaTiO3 ceramics have extensively investigated their electric and dielectric properties, exploring aspects such as polarization behavior, ferroelectric phase transitions and dielectric constant under varying conditions. For example, studies have examined the correlation between the piezoelectric constant and depolarization temperature in nonstoichiometric and doped ceramics, showing variations in depolarization temperatures relative to peak temperatures in dielectric-constant–temperature curves [15]. Other research has explored the dielectric and piezoelectric properties in BT-based ceramics, highlighting the impact of grain size and intrinsic experimental parameters on these behaviors [16]. Investigations into Ba1−xLaxTi1−x/4O3 ceramics post-heat-treatment have revealed differences in permittivity and semiconducting properties depending on the heating environment, with oxygen loss playing a key role [17].
Research on Sr-doped BaTiO3 ceramics has shown that Sr concentration affects structural and electrical properties, with changes observed in lattice parameters, dielectric constant and loss factor [18]. The study of SiO2 nanowires in BaTiO3 has demonstrated altered characteristics beneficial for microwave devices [19]. Similarly, the incorporation of yttrium in BaTiO3 ceramics has shown variations in permittivity and conductivity linked to grain size [20,21]. Covalently bonded inorganic–polymer nanocomposites using BaTiO3 nanowires have exhibited high dielectric properties and improved breakdown strength, making them promising for high-performance dielectric materials [22].
Studies on BaTiO3 solid solutions co-doped with Gd3+ and Eu3+ have shown increases in lattice parameters and relative permittivity, with variations in Curie temperature [23]. Additionally, new hybrid materials like (C5H12N)2[CoBr2.73Cl1.27] have been studied for their structural, thermal, optical and electrical properties [24]. Research on BCZT ceramics and thin films has focused on optimizing synthesis techniques for improved energy storage and electrocaloric cooling properties [25]. Investigations into lead-free piezoelectric ceramics (BCTZ) have explored the effects of varying calcium and zirconium ratios and copper doping on piezoelectric properties and Curie temperature [26]. Studies on ferroelectric materials in microelectronics memory have aimed to replace gate oxide with hafnium oxide, using atomic layer deposition to optimize conditions for memory transistor integration [27].
Thin films of Ba(1−x)SrxTiO3 have been studied for their dielectric properties, with manganese doping showing promising results [28]. Research on Fe-doped BaTiO3 ceramics has used artificial intelligence techniques to simulate dielectric properties, showing potential for capacitors and energy storage applications [29]. Studies on La0.6Sr0.4FeO3 ceramics have investigated their electrical properties, revealing distinct conduction mechanisms influenced by grain boundaries [30,31].
To our knowledge, there has been no comprehensive study on the complete substitution of Ba with Co and its correlation with electrical and dielectric properties. Our primary objective is to explore the interplay between composition, structure and electrical properties within the BCT nanocrystal system. Using advanced hydrothermal techniques, BCT nanocrystals are synthesized, and X-ray diffraction analysis confirms successful synthesis while revealing notable phase transitions [10]. The study delves into the electrical and dielectric behavior of BCT nanocrystals, providing essential insights into their potential for high-capacity energy storage applications [12,32]. The implications of this research extend beyond energy storage, considering the broader applications of transition metal oxides across various technological sectors [4,5,6].

2. Experimental

2.1. Materials and Methods

The Ba1−xCoxTiO3 (where x ranges from 0 to 1) nanocrystals are synthesized using a carefully controlled hydrothermal method. This process, illustrated in Figure 1, involves precise roles for each precursor to ensure high purity and desired outcomes. The process begins with creating a mixed solution of high-purity barium hydroxide octahydrate (Ba(OH)2·8H2O) and sodium hydroxide (NaOH). Barium hydroxide provides the barium ions required for the final compound, while sodium hydroxide adjusts the pH and aids in forming complex precursors (Table S1).
Simultaneously, another solution is prepared by mixing ultra-pure tetrabutyl titanate (Ti(OC4H9)4) with high-quality 1-butanol. Tetrabutyl titanate serves as the titanium source, crucial for forming the titanium component of Ba1−xCoxTiO3. High-purity oleic acid (C18H34O2) is also added to this solution, acting as a surfactant and stabilizing agent to control nanoparticle size and morphology. Maintaining the purity of each precursor is critical, as impurities can adversely affect the final nanopowder’s quality and properties.
The mixed solutions are carefully combined, and cobalt nitrate hexahydrate (Co(NO3)2·6H2O), also of high purity, is introduced. Cobalt nitrate provides the cobalt ions, allowing for precise composition control. The hydrothermal reaction is then conducted under strictly controlled temperature and pressure conditions within a sealed vessel. This step synthesizes the Ba1−xCoxTiO3 nanopowder, with the purity of precursors ensuring the quality and composition of the product [33,34].
After the reaction, the material is purified by washing with a 1 mol/L acetic acid solution to remove impurities and unreacted reagents, while preserving the product’s purity. Finally, the purified material is dried using an appropriate method to obtain the solid Ba1−xCoxTiO3 nanopowder. The composition and properties of this nanopowder can be precisely tailored based on the value of ‘x’ and the exceptional purity of the precursors, making it suitable for various applications in materials science and electronics (Figure S1).

2.2. Characterizations

2.2.1. Structural Analysis

A thorough method was used to characterize the synthesized materials, focusing on both structural and electrical characteristics. The crystalline nature and structural changes were examined using X-ray diffraction (XRD). Using a Using a D8 Bruker Advance diffractometer, provided by Bruker AXS GmbH, located in Karlsruhe, Germany, which commonly uses Cu-Kα radiation, high-purity BaTiO3 and Ba1−xCoxTiO3 nanocrystals were examined. To comprehend the atomic arrangements of the materials and how they affect their properties and behavior, it was necessary to precisely determine the crystallographic structure, identify phase transitions and gather crucial data on lattice parameters and crystallite sizes. Rietveld refinement was used to quantitatively analyze the structural characteristics from the XRD patterns using the PROFEX BGMN refinement program.

2.2.2. Complex Impedance Spectroscopy (CIS)

In the realm of electrical characterization, CIS plays a pivotal role. The primary goal of this part of this study was to investigate a range of Ba1−xCoxTiO3 nanocrystals, where the variable ‘x’ could take on values from 0 to 1. These compounds were shaped into disk-shaped pellets, each with a diameter of 13 mm and a thickness of 1 mm. To ensure accurate and reliable measurements, silver paste was carefully applied to both faces of these pellets, creating good electrical contacts.
CIS was employed to model the frequency responses of these samples using electrical circuits. This modeling approach allowed us to extract key electrical and dielectric properties. Specifically, the dielectric constant, relaxation frequency and electrical conductivity of the materials, which are crucial factors in understanding their electrical behavior, are determined. To facilitate this investigation, a Using a Hewlett-Packard impedance analyzer (HP 4192A Impedance Analyzer), supplied by Hewlett-Packard, located in Palo Alto, CA, USA (Sfax-Tunisia) that covered a wide frequency range, spanning from 20 Hz to 10 MHz, was exploited. Moreover, this analyzer was equipped with a programmable furnace, which was employed to carry out kinetic studies at various temperatures ranging from 40 °C to 380 °C. This capability allowed us to gain deeper insights into the conduction processes and temperature-dependent behavior of the materials.
Following the acquisition of experimental impedance spectra, a meticulous data analysis and refinement using EC-Lab Fitting software (Version 10.38—August 2014), particularly the Zview2 module [35], was carried out. This software is a recognized and trusted tool within the scientific community for the analysis and modeling of complex impedance data. It provides a comprehensive suite of utilities for visualizing, fitting and interpreting experimental results, ensuring the utmost precision and reliability in our electrical characterizations.

3. Results

3.1. X-ray Diffraction Analysis

3.1.1. Qualitative XRD Analysis

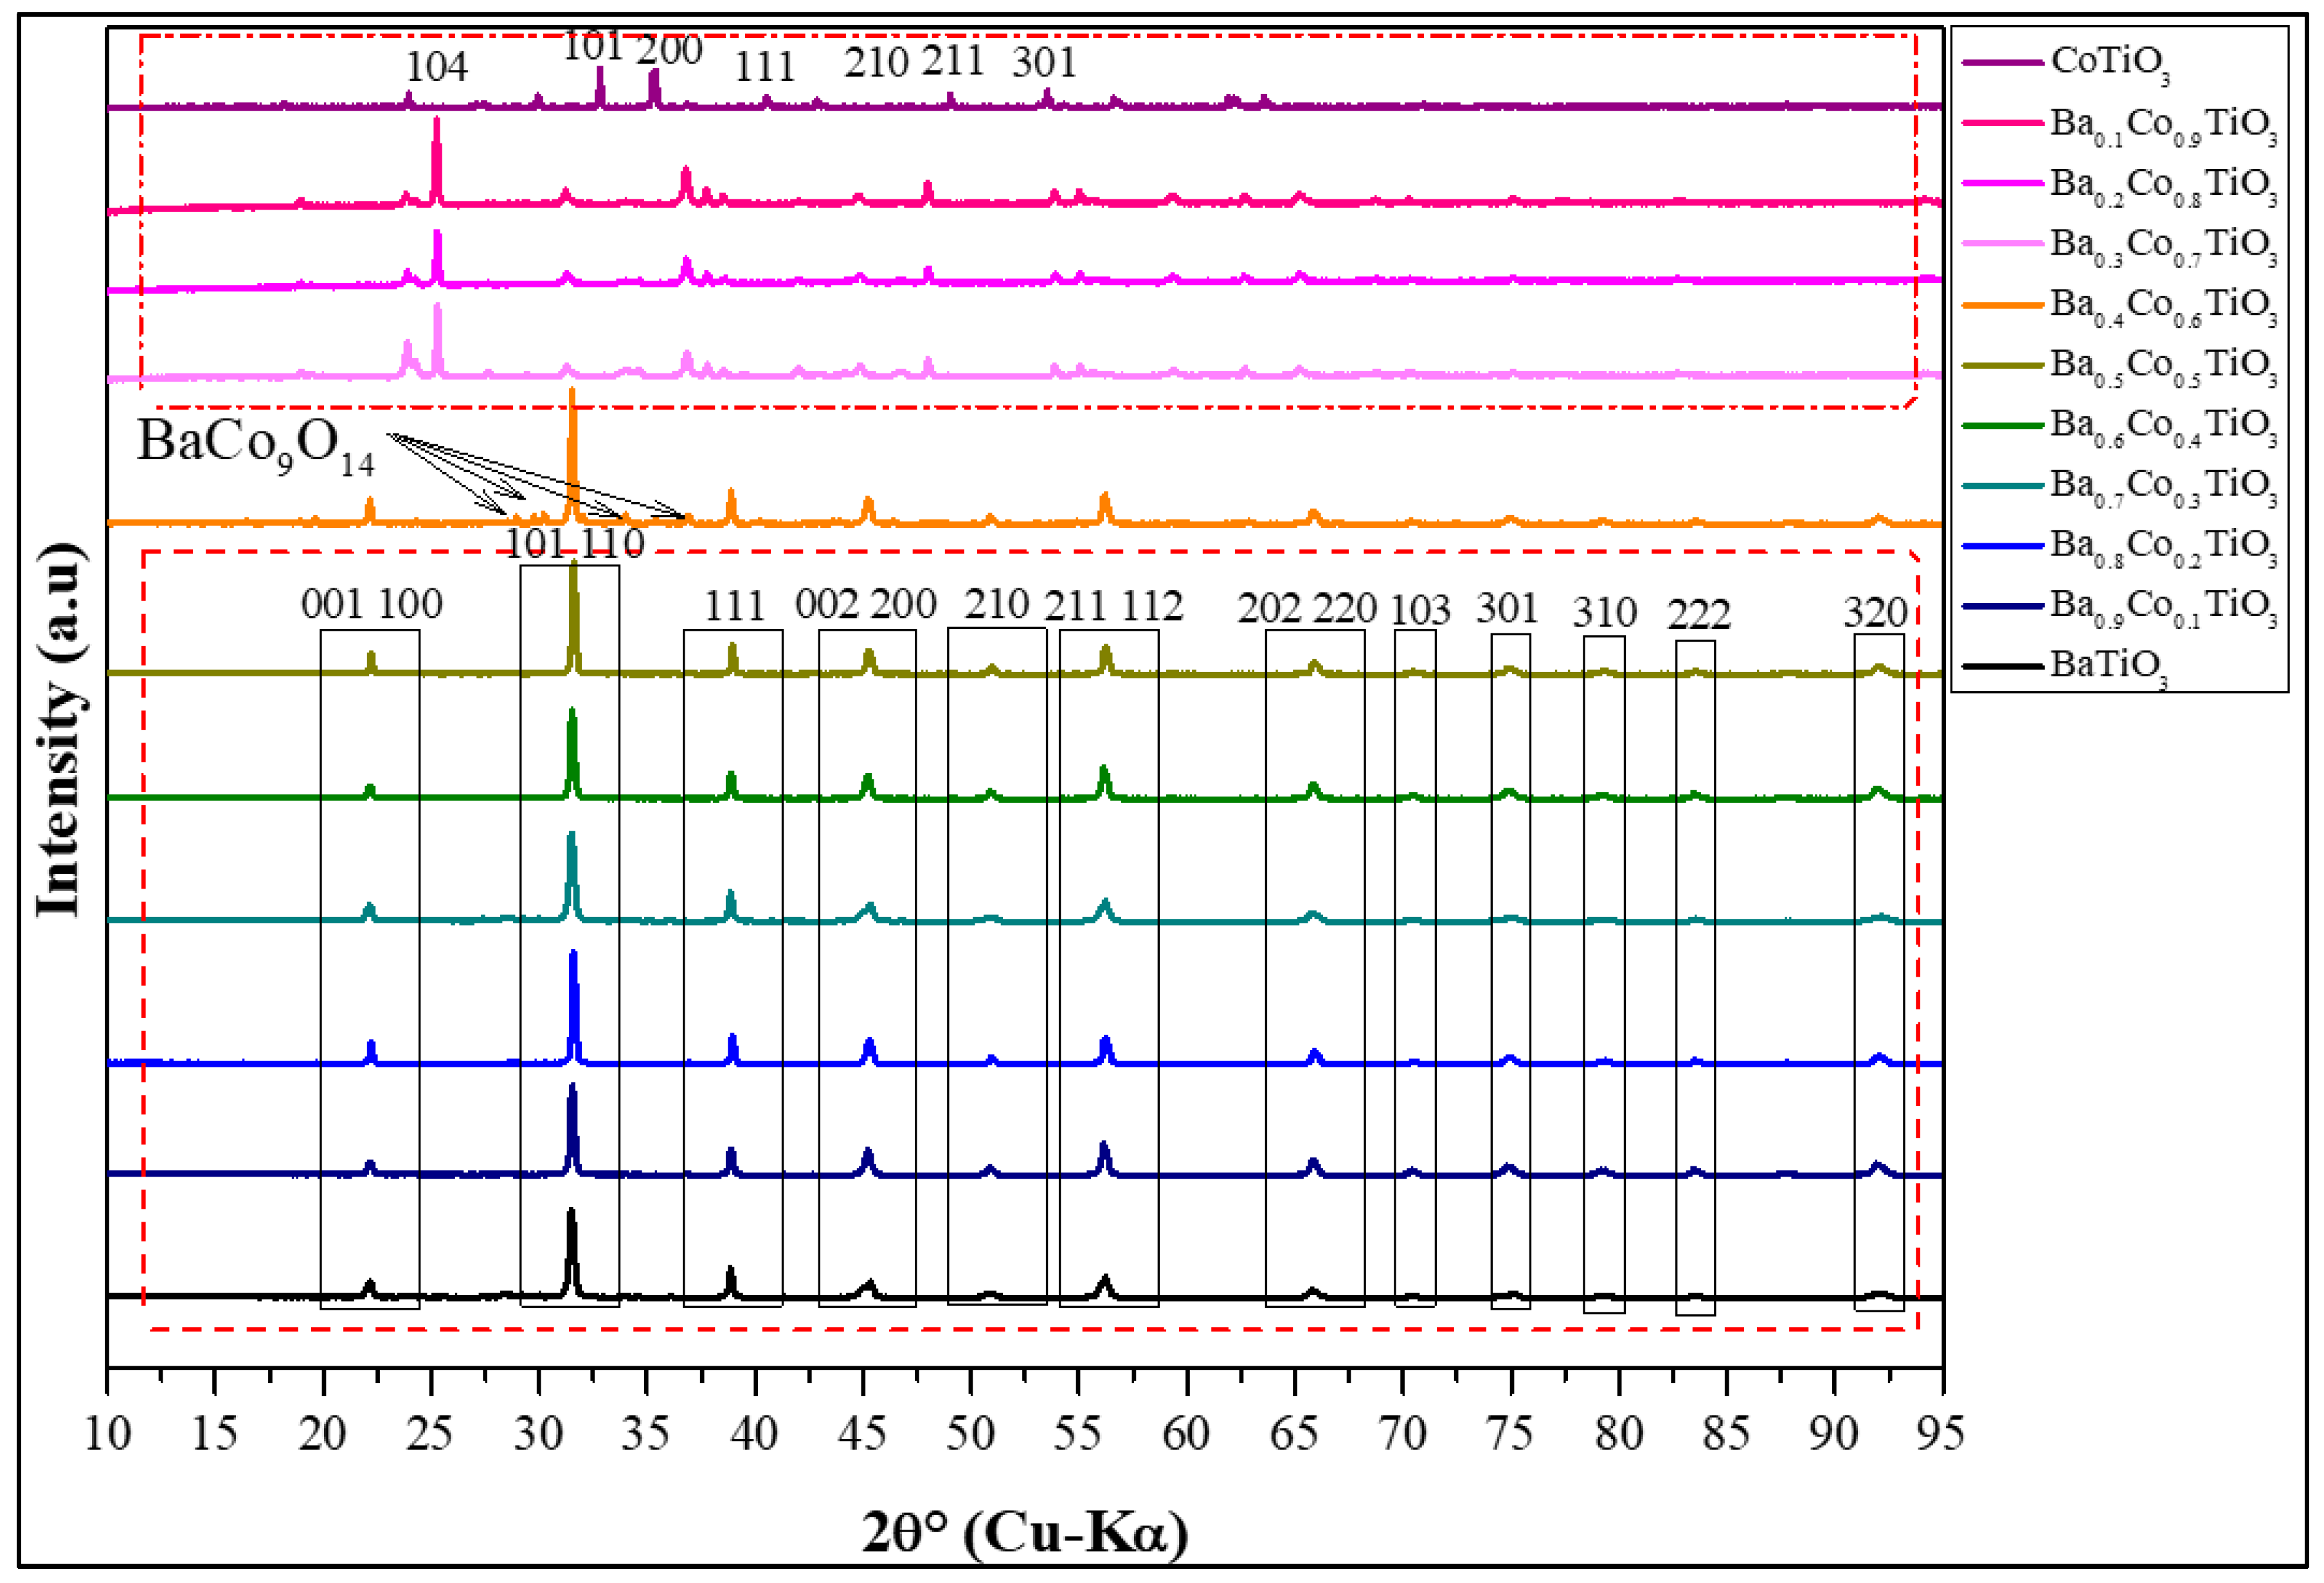
The X-ray diffraction (XRD) patterns of the as-prepared powders with varying cobalt concentrations {x = 0, …, 1} in the Ba1−xCoxTiO3 (BCT) nanocrystals have been subjected to a thorough and comprehensive analysis in this study. The results are accurately presented in Figure 2.
Analyzing the obtained XRD patterns for Ba1−xCoxTiO3 {x = 0, …, 1} nanocrystals involves a comprehensive qualitative assessment of multiple structural parameters summarized in Table 1.
For instance, BaTiO3, exhibiting stable tetragonal symmetry for {x = 0, …, 0,6} and then, a transition to the rhombohedral phase, yields distinct peak positions and intensities. Crystallite size, representing the average domain dimensions within nanocrystals, is estimated by analyzing peak broadening using the Scherrer equation [36], and the values are represented in Table 2.
D h k l = k λ β h k l θ
where Dhkl is the average size of the crystallites, k is a dimensionless shape factor, typically around 0.9, λ is the wavelength of the X-ray radiation used, βhkl is the full width at half maximum (FWHM) of the diffraction peak in radians, corrected for instrumental broadening, and θ is the Bragg angle.
To evaluate the composition, peak shifts relative to reference samples reveal chemical variations. By integrating these qualitative analyses, XRD enables comprehensive characterization of these nanocrystals, providing critical information about their structural and compositional attributes. This is instrumental for tailoring their properties and optimizing their performance in diverse applications. The XRD analysis shows that BCT nanocrystals consistently crystallize in the perovskite phase across the entire range of studied cobalt concentrations, maintaining this phase up to a cobalt concentration of x = 0.6. Beyond this threshold, a notable transition to the ilmenite phase occurs, marking a significant shift in the crystallography of BCT nanocrystals. A key finding is the absence of secondary phases in the XRD patterns. The diffraction peaks have been indexed based on the respective crystallographic planes using JCPDS cards no. 75-2121, ensuring precise identification of the crystal structure. These observations underscore the high purity and crystalline integrity of the synthesized nanocrystals, distinguishing them from previous research, such as Pham et al. [37,38], which reported secondary phases in BCT samples prepared using the traditional solid-state reaction method. The well-resolved diffraction peaks in the XRD patterns highlight the exceptional crystallinity of the nanocrystals. This quality is fundamental as it significantly influences the electronic and structural properties of the material. Specifically, in the pure BaTiO3 sample (x = 0%), the perovskite structure with a tetragonal phase is clearly confirmed. This structural configuration remains consistent across all cobalt concentration levels, further corroborated by the distinct presence of (002)-(200) doublet peaks at 2θ values of 44–46° in the XRD patterns.

3.1.2. Quantitative XRD Analysis

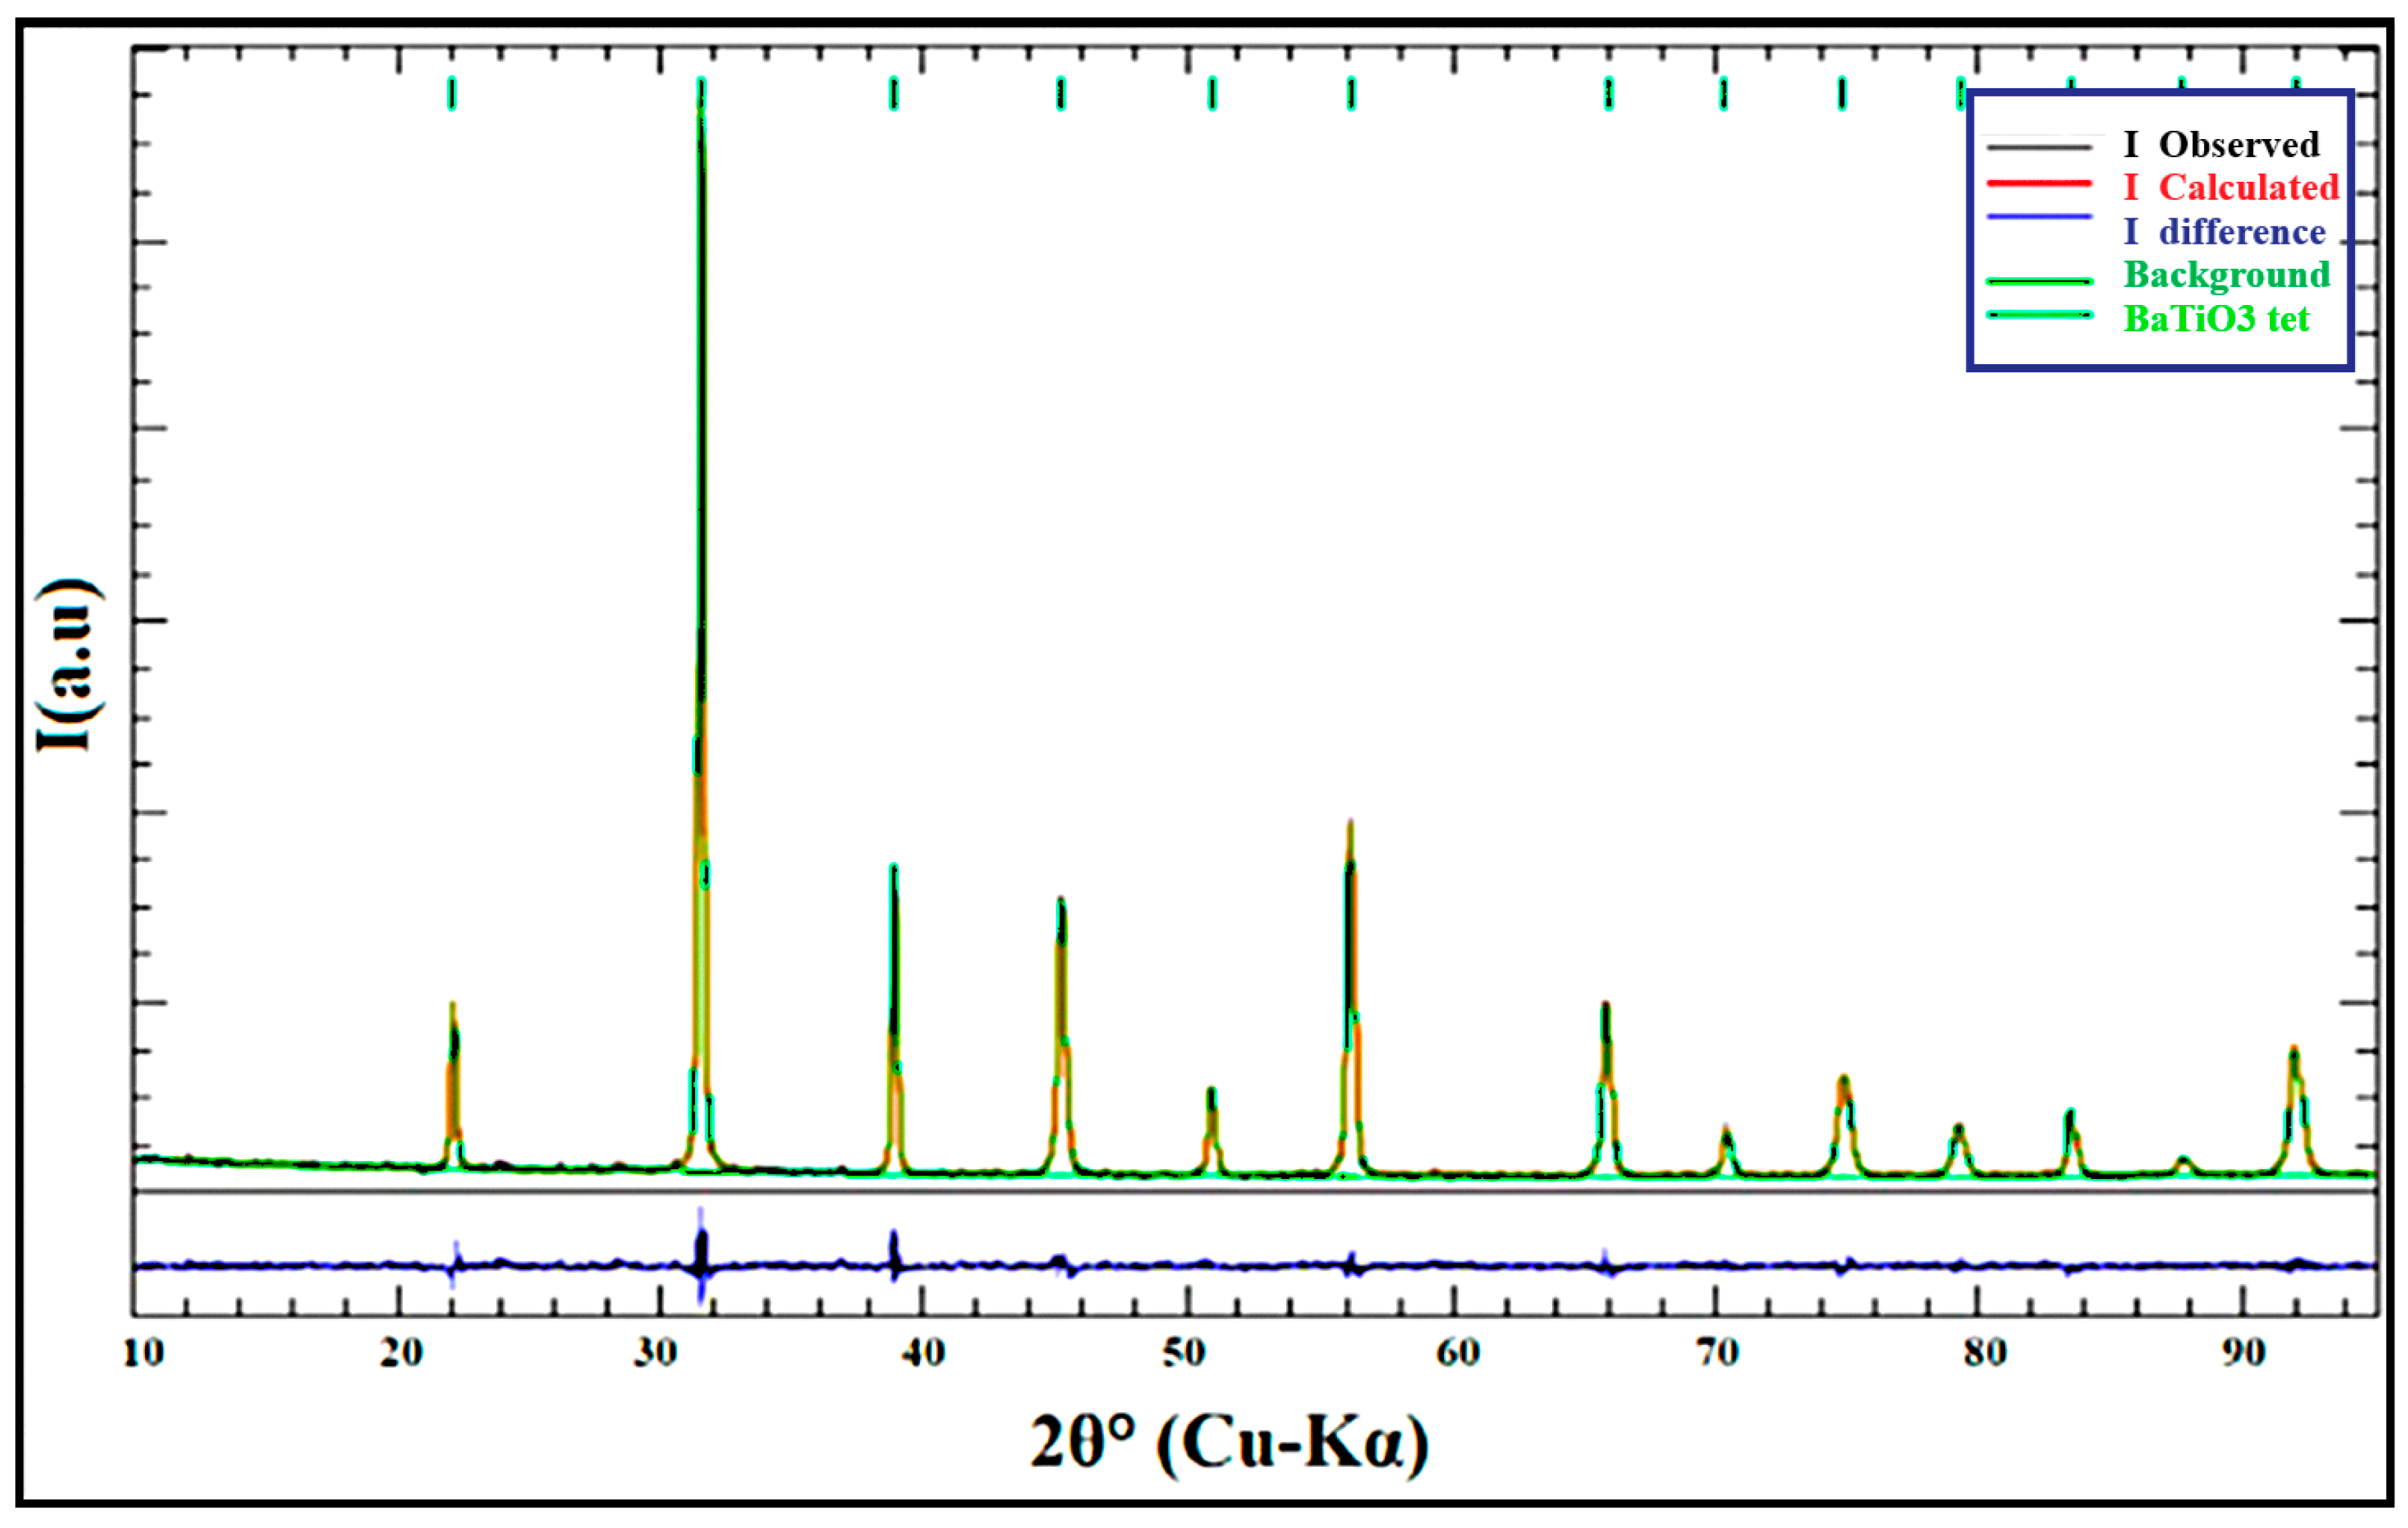
XRD analysis, coupled with Rietveld refinement using PROFEX BGMN software (Profex 5.3.1), provided crucial insights into the structural evolution of Ba1−xCoxTiO3 (BCT) samples with increasing cobalt substitution [10] (Figure 3 and Figure S2a–j). The refinement process, which yielded goodness of fit (GOF) values of approximately 1.25 for pure BaTiO3 and reasonably good fits for the BCT series, confirmed the transition from a tetragonal single phase to a rhombohedral phase as the cobalt content increases. For unsubstituted and low-substituted samples (x ≤ 0.3), the crystal structure was identified as tetragonal with a P4mm (99) space group. This finding aligns with observations reported by [10]. However, as the cobalt substitution rate increased, a structural phase transition occurred. The highest substitution sample (x = 1) crystallized in a rhombohedral phase with an R-3 space group.
The lattice parameters (a and c) are determined with high accuracy, particularly for the tetragonal phase. As the cobalt concentration increases, the ‘a’ lattice constant expands, while the ‘c’ lattice constant contracts. This behavior is attributed to the substitution of larger Co2+ ions (ionic radius between 0.58 and 0.90 Å) for Ba2+ ions (ionic radius of 1.35 Å). The significant difference in ionic radii induces lattice strain, as noted by Jebali et al. [10], and results in substantial modifications to the crystal structure (Table 3).
The tetragonality (c/a ratio) of the samples was found to decrease with increasing Co2+ content. This change, along with the variations in lattice parameters, is a direct consequence of Co2+/Ba2+ incorporation into the lattice. The unit cell volume, a crucial structural characteristic, exhibited a consistent decreasing trend with increasing cobalt concentration, further indicating the significant impact of cobalt substitution on the crystal structure [10].
These structural changes, as revealed by XRD analysis and Rietveld refinement, provide valuable insights into the fundamental mechanisms underlying the modification of BCT’s properties with cobalt substitution. The transition from tetragonal to rhombohedral structure, the changes in lattice parameters and the decrease in unit cell volume all contribute to our understanding of how cobalt incorporation affects the material’s structural and, consequently, its electrical and optical characteristics.
To gain a deeper understanding of the material’s microstructure, the Williamson–Hall (W-H) method [39], which considers the influence of strain on XRD peak broadening, was employed. According to the W-H method, all samples exhibited tensile strain, evident from the positive slopes in the W-H plots. The calculated crystallite size, obtained from these plots, ranged from 78.2 to 39.1 nm across the BCT samples, as summarized in Table 2. In summary, the XRD analysis not only confirms the phase in BCT nanocrystals but also provides critical insights into their microstructural characteristics, including strain and crystallite size. These findings significantly enhance the understanding of the structural aspects of BCT nanocrystals, supporting their relevance in the comprehensive investigation of their electrical and dielectric properties. Additionally, the intriguing transition to the ilmenite phase observed after x = 0.6 adds an exciting dimension to the crystallographic behavior of these materials, warranting further exploration and in-depth study.

3.2. Impedance Spectrosopy

3.2.1. Electrical Conductivity

Figure 4 specifically presents the Nyquist diagram for Ba0.5Co0.5TiO3, while Nyquist diagrams for other values of x are shown in Figure S3a–f. All diagrams depict the temperature-dependent impedance response of Ba1−xCoxTiO3 (BCT) nanocrystals, plotting the imaginary impedance (Z″) against the real impedance (Z′) for temperatures ranging from 60 to 380 °C.
Examining these plots reveals a remarkable pattern in which the experimental points are arranged in a simple way along circle arcs that shift out from the origin. The centers of these arcs are commonly found below the axis displaying real values. This notable attribute makes it clear that conduction in BCT nanocrystals follows the Col-Col model rather than the Debye model [40]. Through an extensive evaluation of the spectra using the Zview2 software (Version 4.0i), the optimal equivalent circuit for improving the accuracy of the experimental data was identified (Figure 4).
This approach yields the simulation curves, which are shown as solid lines. Since the silver surface acting as the contact electrode has a resistive effect, the equivalent circuit for the BCT nanocrystals has been found to include a resistance R1. This resistance spans the entire resistance of the material’s grains and is connected in series with a parallel combination of resistance R2. In addition, the circuit incorporates a fractal capacitance CPE (Q) to account for the non-ideal capacitive performance of the circle arcs in the Nyquist diagram [40,41], which are not exactly centered on the real values axis.
Through an examination of the intersection points of these circles with the real values axis, it becomes possible to ascertain the values of resistances R1 and R1 + R2, representing the resistive impact of the silver surface and the overall material resistance (Rest), respectively. This thorough approach guarantees a nuanced comprehension of the conduction mechanisms within the BCT nanocrystals across varying temperatures. Moreover, it enables the pinpointing of pivotal elements within the equivalent circuit, providing a detailed description of the intricate electrical behavior exhibited by these materials (Figure 5).
The values of capacitance C are calculated for all samples at all temperatures using the following equation [42]:
C e s t = Q R e s t 1 α 1 α ,
where α represents the degree of deviation (0 < α < 1; α = 1 for pure capacitance and α = 0 for pure resistance) with the following:
Z C P E * = 1 Q j w α ,
Improved conductivity within the material is indicated by this decrease in resistance. It can be interpreted as the capacity of a substance to permit higher-frequency electrical charge flow. Put more simply, higher frequencies lead to a decrease in the electrical current’s resistance. Enhanced charge carrier mobility, decreased charge carrier scattering, or a change from mostly capacitive to more conductive behavior are some possible explanations for this phenomenon. It is also noted that when frequency rises, capacitance increases concurrently. The increase in capacitance indicates that the material is more efficiently accumulating charge at interfaces or grain boundaries. It might also indicate that the material has a higher dielectric permittivity. In straightforward terms, when the frequency of the applied electrical signal increases, the material shows an enhanced capacity to store electrical charge. This behavior is frequently associated with the faster polarization and reorientation of dipoles or charge carriers within the material, especially at higher frequencies [43,44,45].
The Imaginary part of impedance (Z″) is crucial for understanding the electrical behavior of materials, particularly in the context of the Ba(1−x)CoxTiO3 series. It offers insights into how the material responds to electrical signals at various frequencies. The temperature-dependent impedance response of Ba0.5Co0.5TiO3 nanocrystals is illustrated in Figure 6 by plotting the imaginary impedance (Z″) against the logarithmic angular frequency (Log(ω)). The corresponding data for other BCT compositions (x = 0, …, 1) can be found in Figure S4a–j.
As the temperature rises, a progressive transformation becomes evident: the strength peaks of all specimens gradually diminish, corresponding to the decline in impedance values attributed to heightened temperatures. Concurrently, the impedance peaks (Z″) undergo a transformation, shifting towards higher frequencies as the temperature rises. This distinctive pattern signifies the occurrence of a phenomenon known as dielectric relaxation. Dielectric relaxation refers to a material’s ability to adjust to changes in an applied electric field, especially over a range of frequencies. The heightened Z″ values are indicative of the material’s pronounced capacitive response and polarization effect when exposed to electrical signals at higher frequencies. Additionally, the observed frequency shift signifies a heightened velocity of localized charge carriers [46]. This accelerated hopping velocity is likely a consequence of the increased mobility of charge carriers at elevated temperatures. In essence, the rise in temperature triggers a cascade of nuanced shifts, deepening our grasp of charge carrier dynamics and their interactions within the material. Another notable observation is the asymmetrical broadening of the peaks, indicating a relaxation behavior that deviates from the Debye model [47].
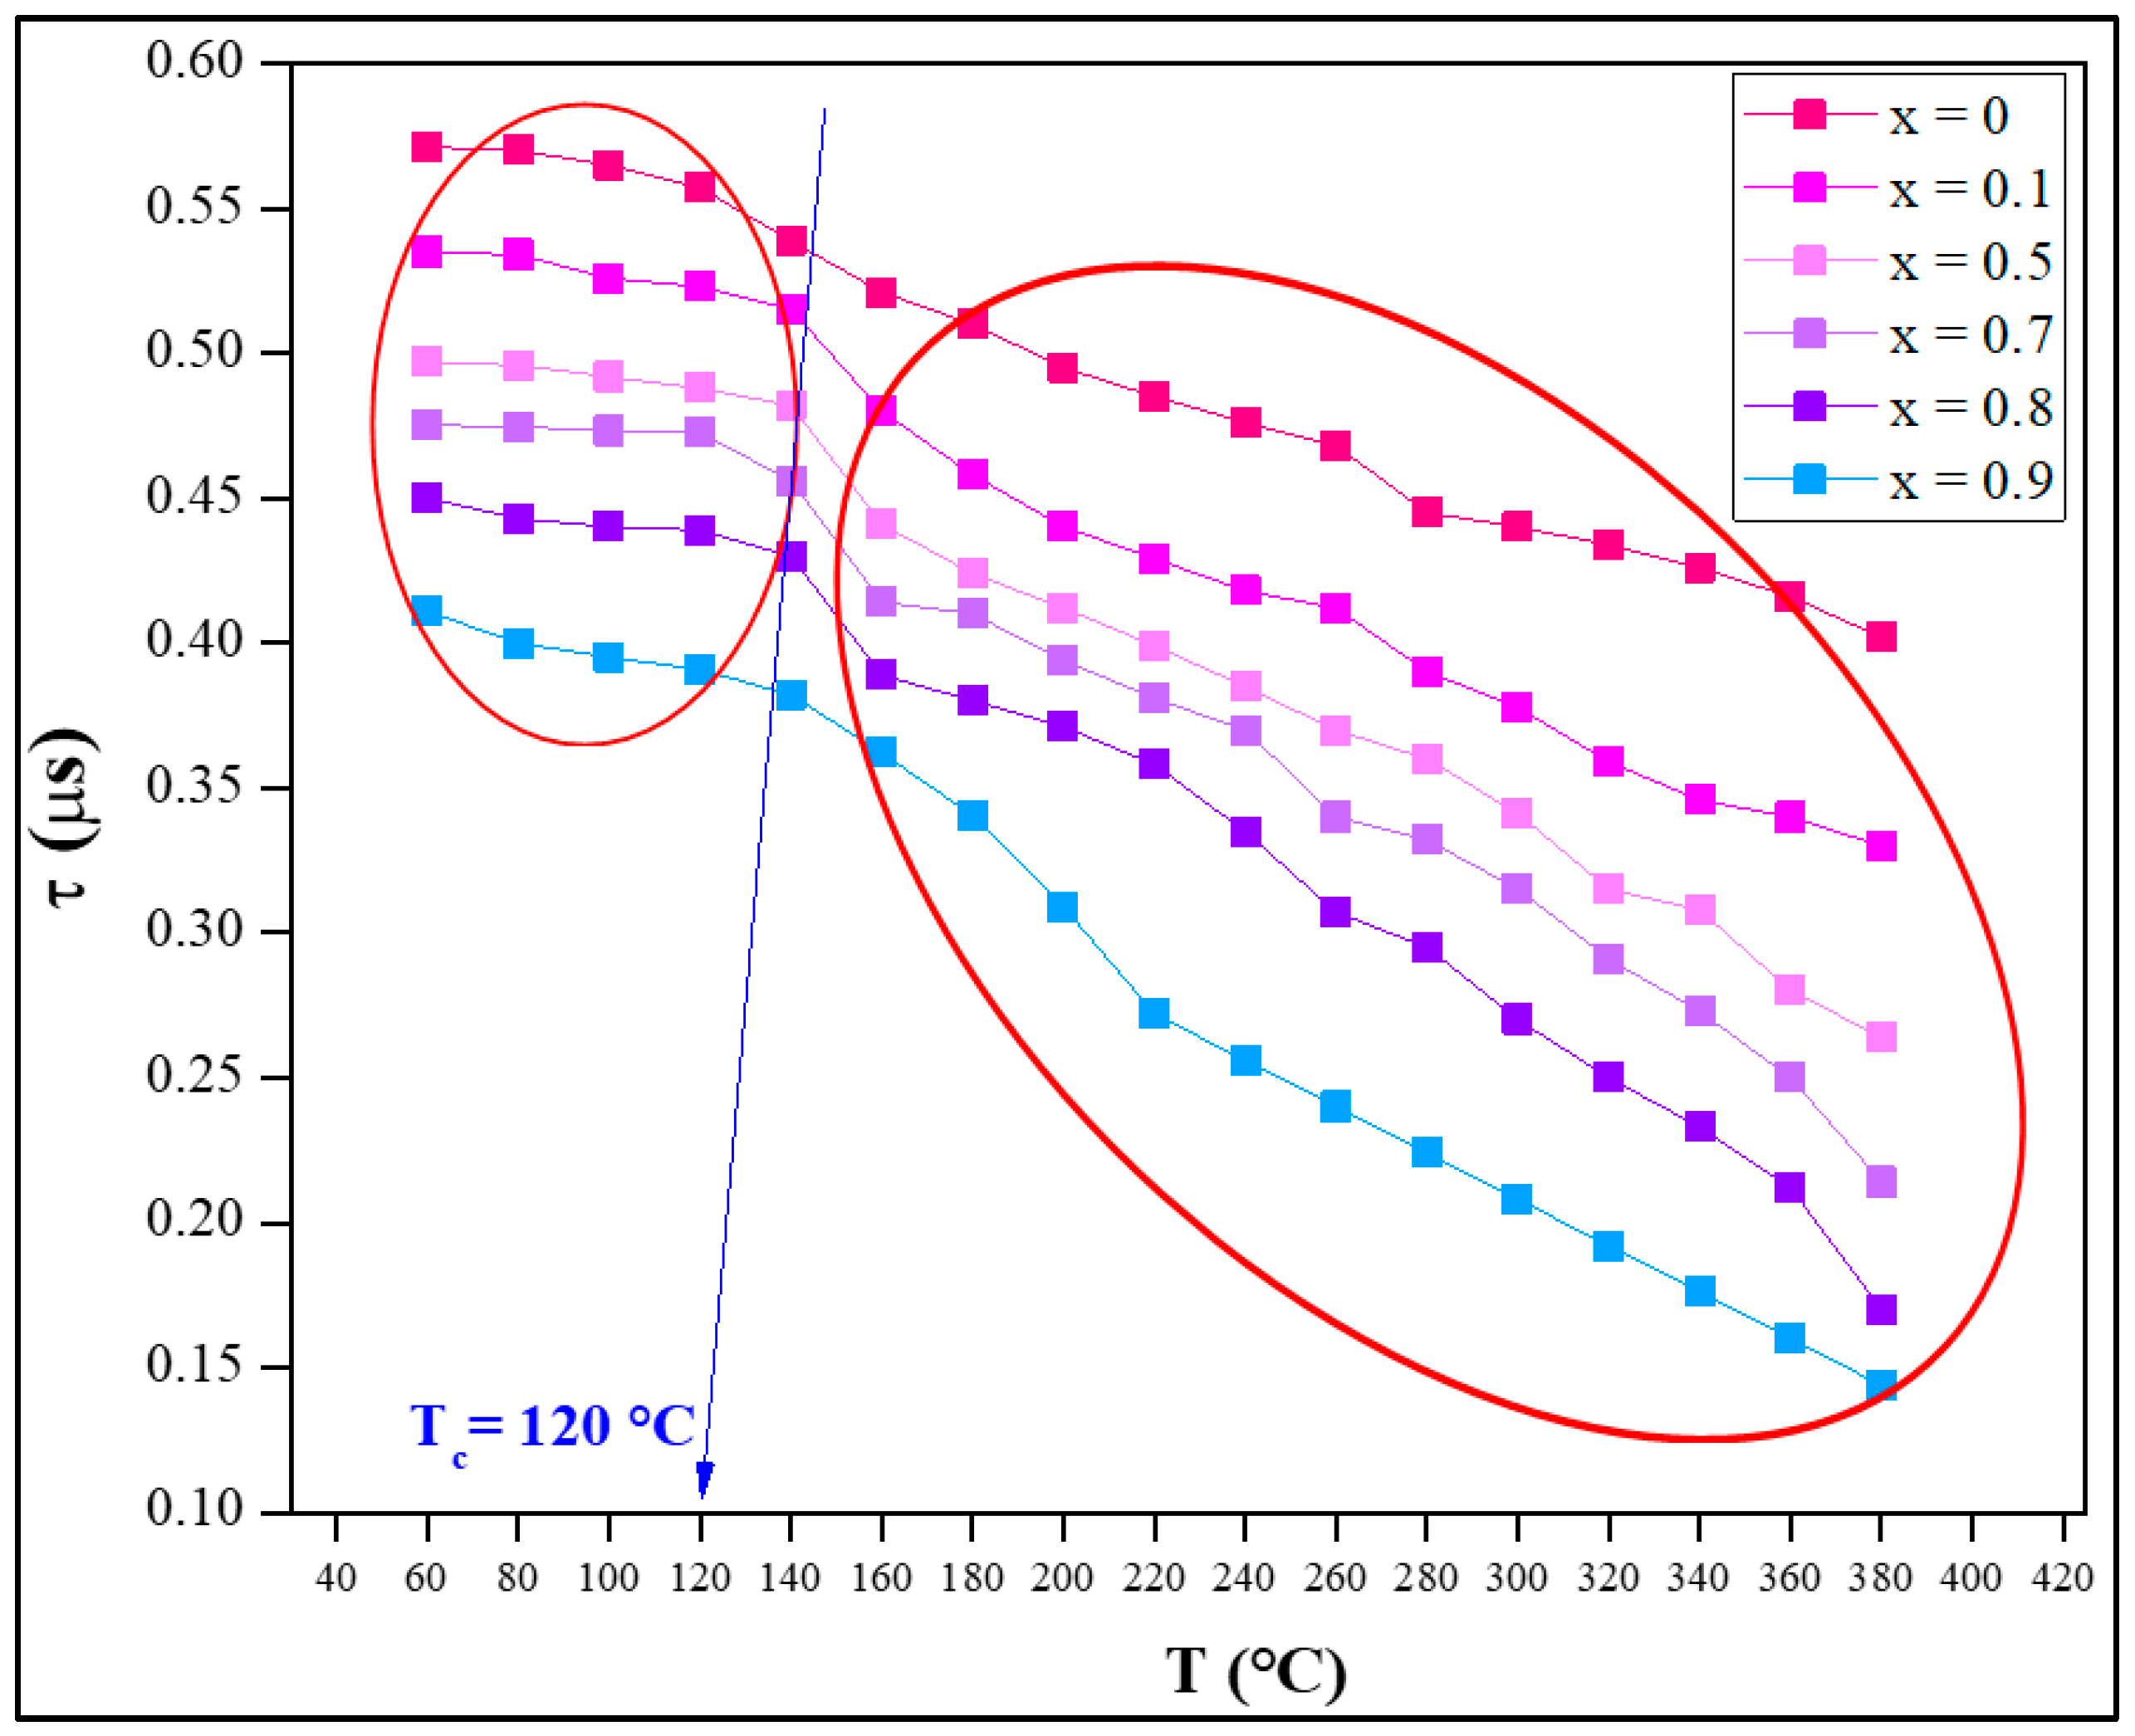
The characteristic relaxation time (τ) is determined from the angular frequency value ω0 corresponding to the peak maximum of Z″ as a function of Log(ω) using the relationship τ = 1/ω0. The variation in τ for the BCT {x = 0, …, 1} nanocrystals with temperature is illustrated in Figure 7. A decreasing relaxation time indicates that the material is responding more rapidly to changes in the applied electric field. This can be attributed to several factors, such as increased ionic mobility, reduced activation energy barriers, or a shift towards faster relaxation processes within the material. Essentially, the material becomes more agile in its ability to reorient dipoles or respond to the varying electric field conditions. Furthermore, the analysis unveils a consistent trend across all examined nanocrystals: the relaxation time τ diminishes in tandem with rising temperatures (Tc = 120 °C), aligning with the intrinsic semiconductor characteristics of these compounds [10]. Moreover, there is a noticeable correlation between the contraction of this relaxation time and the escalation of the cobalt substitution rate; in fact, in the context of phase transitions, a decrease in relaxation time may signify the material’s transition to a state with higher mobility or a shift from a less conductive to a more conductive phase. Such observations are critical in understanding the studied samples behavior and its suitability for specific applications. For instance, in the BCT series, a decrease in relaxation time could be associated with a transition from a high-resistance state to a more conductive state, which might be beneficial in electronic applications. This tendency might be attributed to a softening effect occurring in both grains and intergranular junctions within the structure [48]. Consequently, this structural relaxation appears to lead to a decrease in the resistivity values of the material (Rest) and an increase in its capacity (Cest) (Figure 5). In summary, it is evident that the BCT {x = 0, …, 1} nanocrystals exhibit semiconductor behavior, marked by a reduction in relaxation times τ with both rising temperature and cobalt substitution rate. These findings offer valuable insights into the conductivity mechanisms of these materials, potentially paving the way for applications in electronics and energy storage. Additionally, this study highlights the notable influence of cobalt substitution on the relaxation and conductivity characteristics of BCT {x = 0, …, 1} nanocrystals.
Electrical conductivity ( σ ) can be described by Jonscher’s power law, which is expressed by the following relationship [49]:
σ = σ D C + σ A C = σ D C + A ω m
where “A” represents the proportionality constant, and m is the frequency exponent used to elucidate the conduction mechanism in materials.
The electrical conductivity (σ) of BCTO nanocrystals can be calculated using the following relationship:
σ = e s Z Z 2 + Z 2 ,
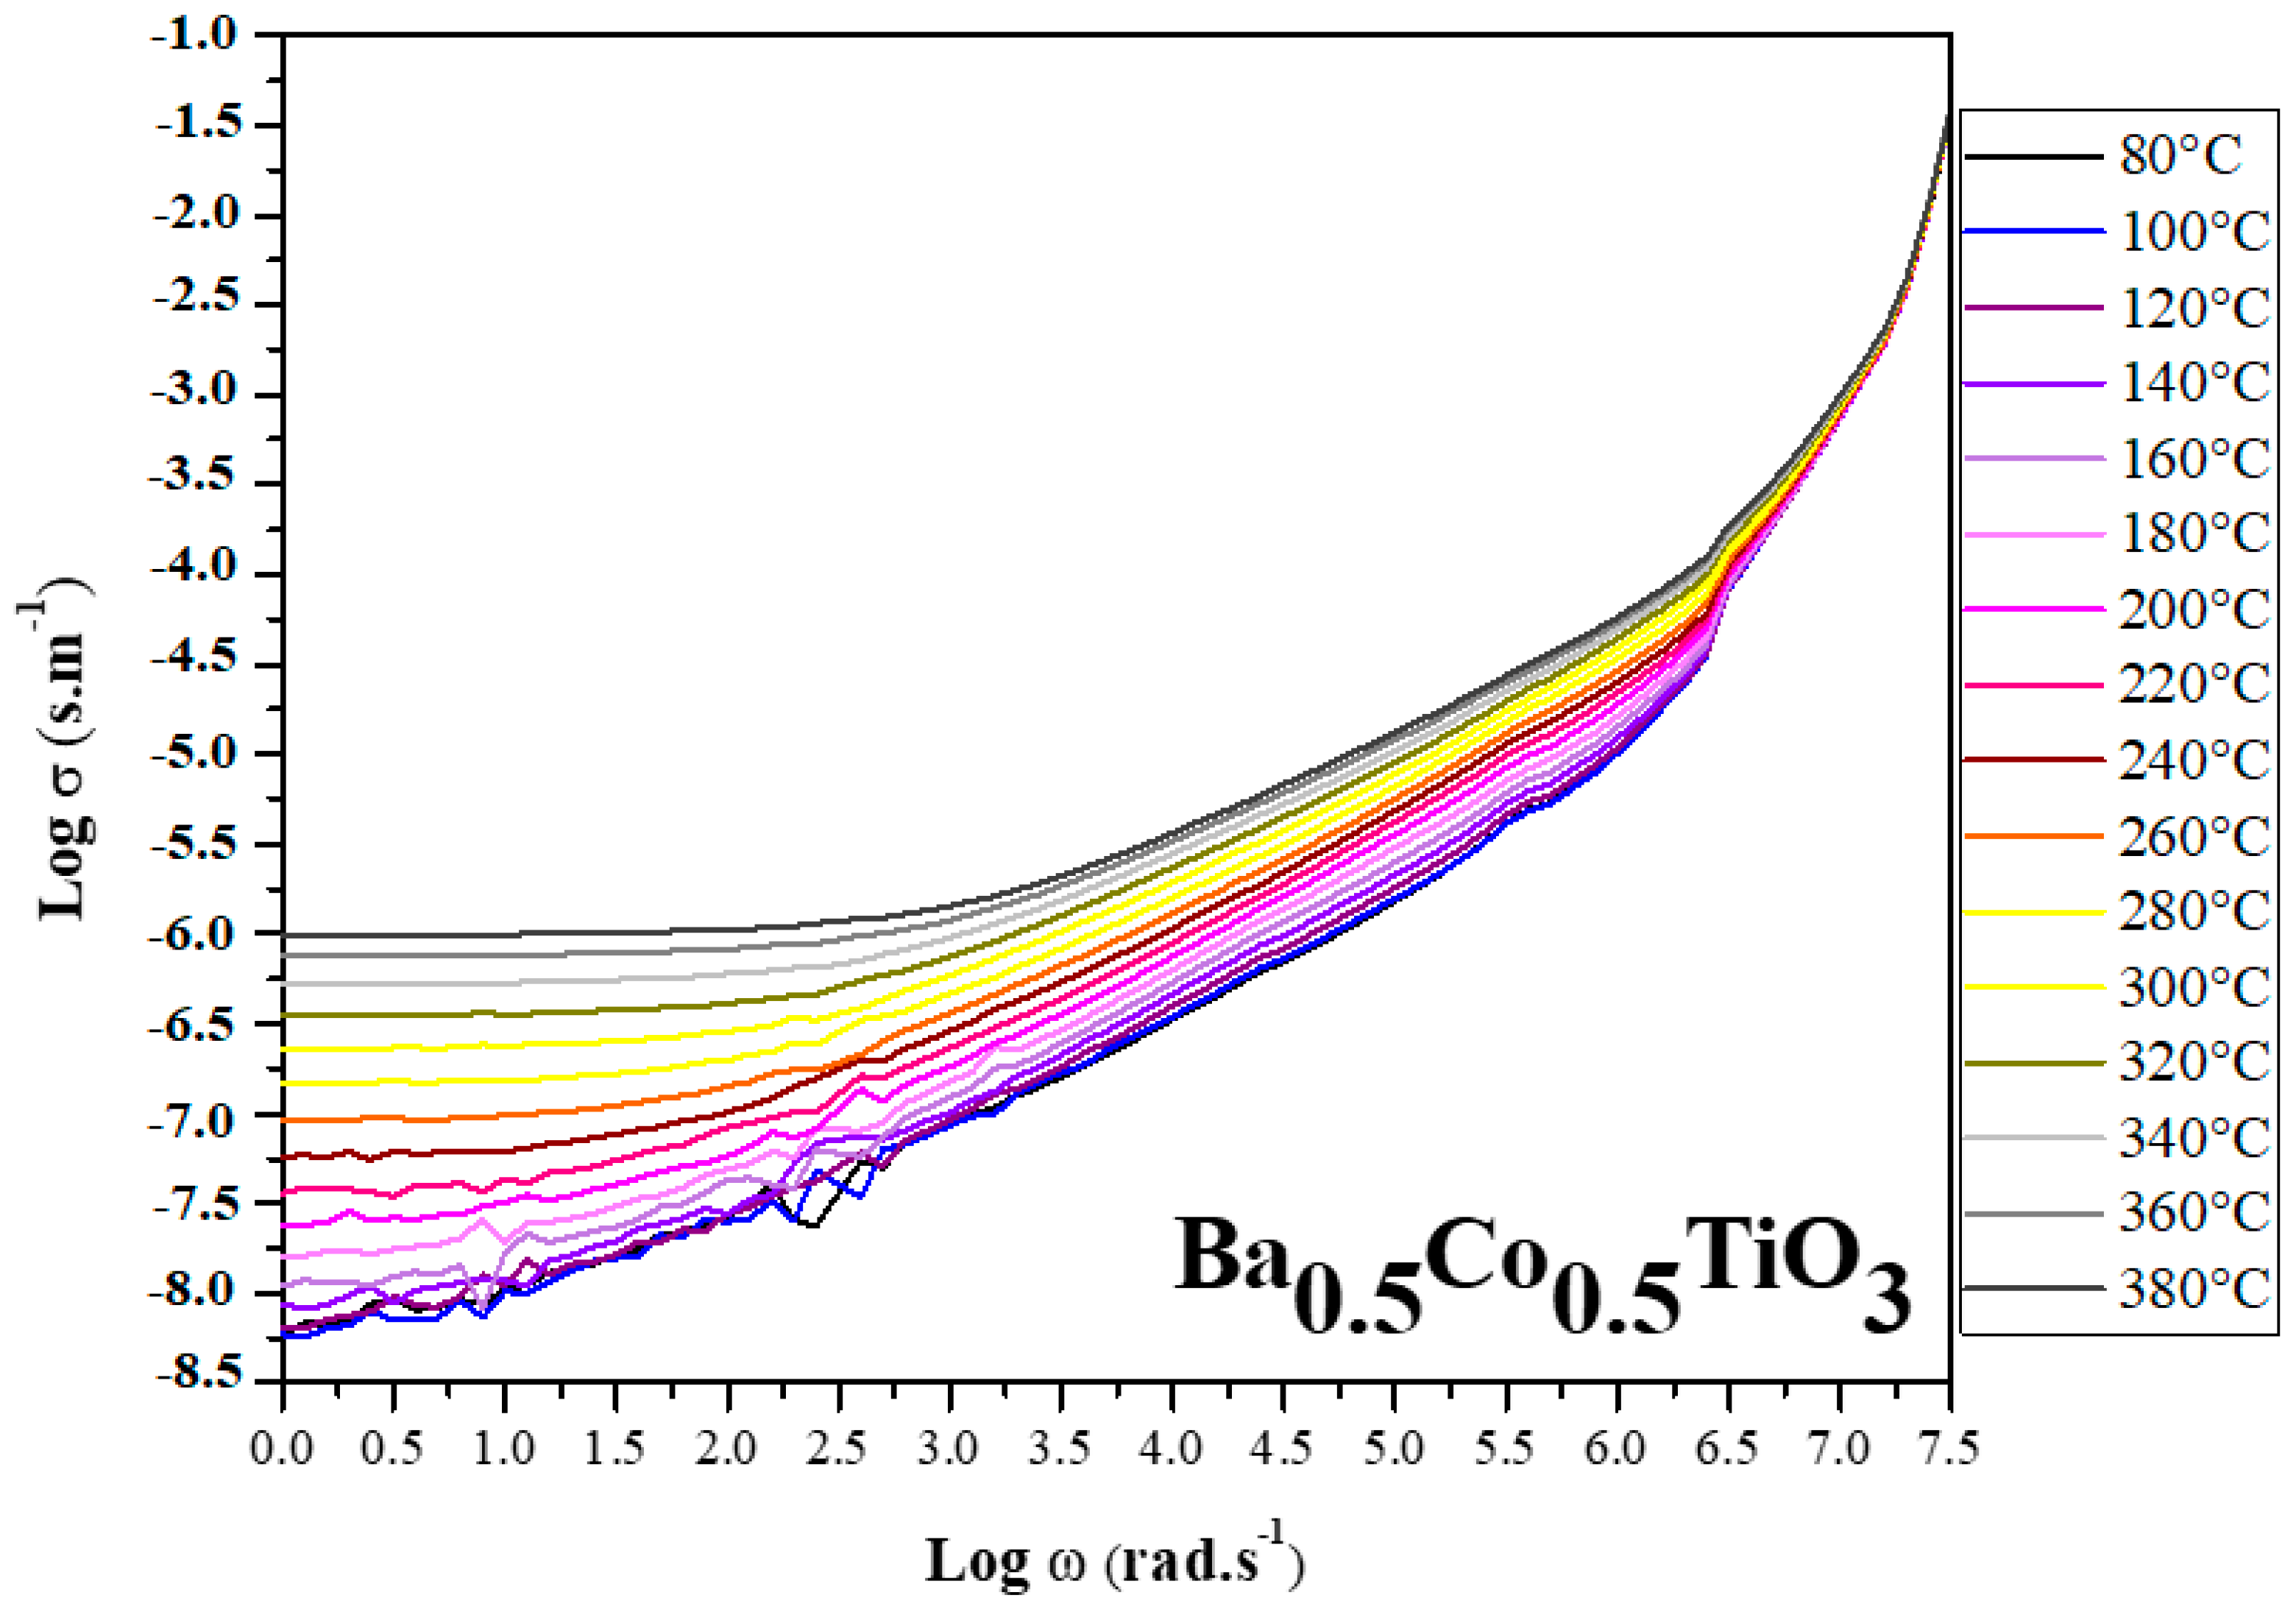
where e represents the sample thickness, and s is the cross-sectional area of the sample. Figure 8 and Figure S5a–f show the variation in logarithmic electrical conductivity (Log(σ)) with logarithmic angular frequency (Log(ω)) for BCT nanocrystals. Specifically, Figure 8 presents data for Ba0.5Co0.5TiO3, while Figure S5a–f displays results for all x values. A detailed observation reveals that electrical conductivity (σ) can be divided into two distinct regions across the frequency range. In the first region, conductivity remains independent of frequency, aligning with direct current conductivity (σDC). Subsequently, a second region emerges, frequency-dependent and increasing as frequency rises, representing alternating current conductivity (σAC). In the first frequency-independent region, direct current conductivity (σDC) is associated with the successive and successful hopping of charge carriers to vacant sites within their immediate environment [50]. The extended access period enables long-distance mobility of charged particles, endowing the material with sustained conduction capacity and potential applications in electronics and solid-state technology.
The σDC values for the samples can be estimated from Figure 8 and Figure S5a–f by extrapolating the frequency-independent region, yielding the σDC value. Alternatively, it can be calculated using the following relationship [51]:
σ D C = e s R e s t ,
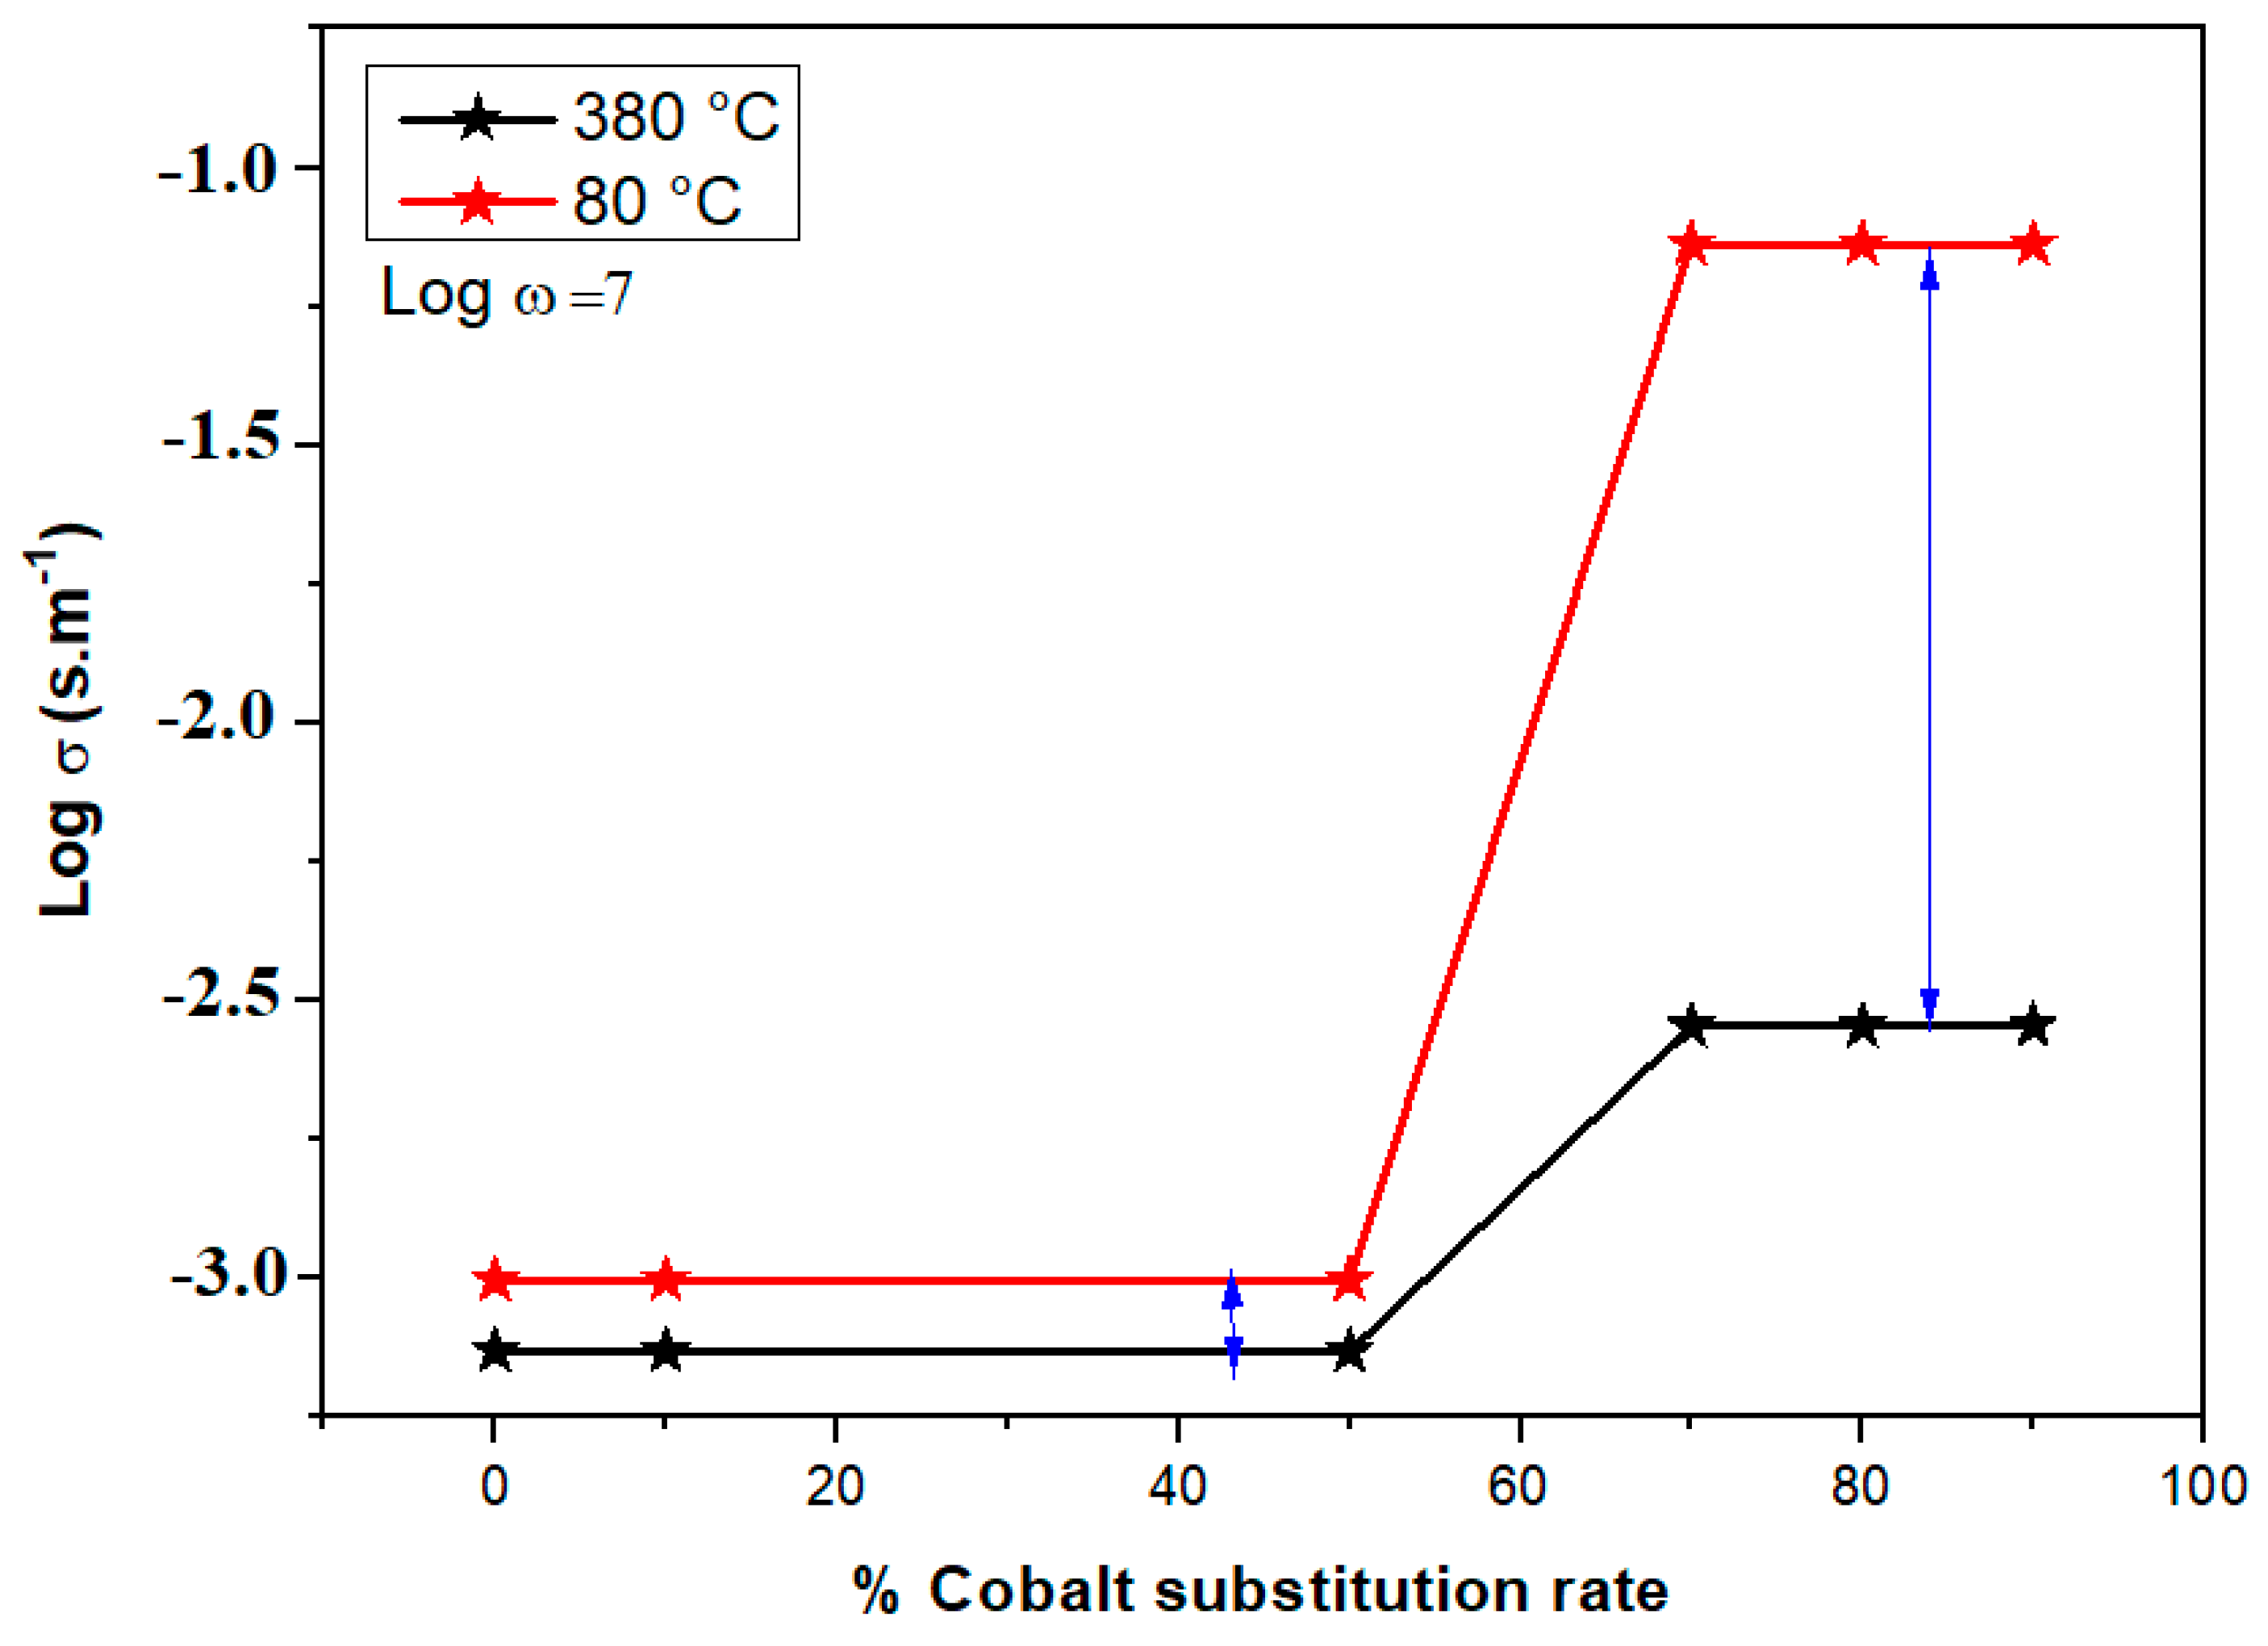
Rest represents the resistivity of the samples. It is noteworthy that the direct current electrical conductivity (σDC) increases with temperature, indicating that the electrical conduction mechanism may be thermally activated. This also suggests the intrinsic semiconductor nature of the compounds under investigation. Furthermore, it becomes evident that the direct current conductivity (σDC) strengthens as the cobalt concentration increases for a constant Log(ω) and at the highest and lowest temperatures, Figure 9 illustrates the conductivity as a function of cobalt substitution in the BCT nanocrystals. This observation highlights that the introduction of cobalt plays a beneficial role in enhancing the crystalline structure of BCT, potentially optimizing the mobility of charge carriers and consequently leading to an increase in electrical conductivity. The results of this investigation reveal the presence of two distinct conductivity domains in BCT nanocrystals, depending on frequency. Direct current conductivity (σDC) is associated with successful charge carrier hops, in synergy with long-range mobility of charged particles. Moreover, this direct current conductivity (σDC) increases in parallel with rising temperature and increasing cobalt concentration. These combined observations demonstrate a refined semiconductor behavior, enhancing our understanding of the underlying dynamics and unveiling opportunities for innovative electronic and energy applications. The findings reveal a compelling relationship between (x) and the electrical behavior of these materials. As (x) increases, the electrical conductivity experiences a significant rise, primarily attributed to the introduction of additional charge carriers, such as mobile electrons or ions, facilitated by cobalt substitution.

3.2.2. Dielectric Study

The electrical permittivity consists of two components, the real part εr′ and the imaginary part εr″, which are related to energy storage and energy loss, respectively. These values can be calculated using the following relationships [52]:
ε r = Z ω C 0 Z 2 + Z 2 ,
where C0 = ε0.s represents the vacuum capacitance, with ε0 being the vacuum permittivity. The loss angle (tan δ) is given by the following relationship: tan δ = ε r ε r .
Figure 10 and Figure S6a–f show the dielectric constant εr′ variation as a function of logarithmic angular frequency (Log(ω)) for BCT nanocrystals at various temperatures. Specifically, Figure 9 presents data for Ba0.5Co0.5TiO3, while Figure S6a–f display results for all x values.
For all samples, εr′ decreases gradually with increasing frequency and reaches almost constancy at high frequencies. At low frequencies (ω << ω0 = 1/τ), εr′ is mainly affected by space charge and orientation dipole polarization, while ionic and electronic polarizations occur in the high-frequency region. The applied electric field causes the orientation dipoles to respond, and space charge polarization is mainly responsible for the increase in dielectric constant values. The distribution of positive and negative charges can be altered by the various interface faults that nanocrystals typically exhibit. As a result of these imperfections trapping the migrating space charges under the influence of an electric field, dipole moments are created. A major contributor to material polarization is the dipole-electric field interaction, which is also correlated with energy levels at particle contacts [53]. The dielectric permittivity of the material is greatly increased by the existence of these space charge-induced dipole moments, which improves the material’s response to external electric fields. For the design of electrical devices, sensors and other applications where dielectric characteristics are critical, these polarization and dipole moment generation mechanisms in nanocrystals offer crucial insights [54,55,56].
Dipole orientation polarization gradually decreases with increasing frequency (ω < ω0), and dipoles become less able to rotate quickly, causing a phase lag in relation to the electric field. The result of this action is a drop in εr′. The relaxation mechanism keeps εr′ from increasing once the frequency hits the characteristic frequency (ω = ω0). When dipoles reach very high frequencies (ω >> ω0), they can no longer follow the electric field, which prevents polarization. As a result, εr′ decreases until it reaches a constant value. Furthermore, with increasing temperature, all samples show a consistent rise in the dielectric constant εr′. This effect of high temperature on dipole orientation is fundamental to this phenomena. A greater dielectric constant εr′ results from more favorable dipole alignment at higher temperatures, which also intensifies orientation polarization.
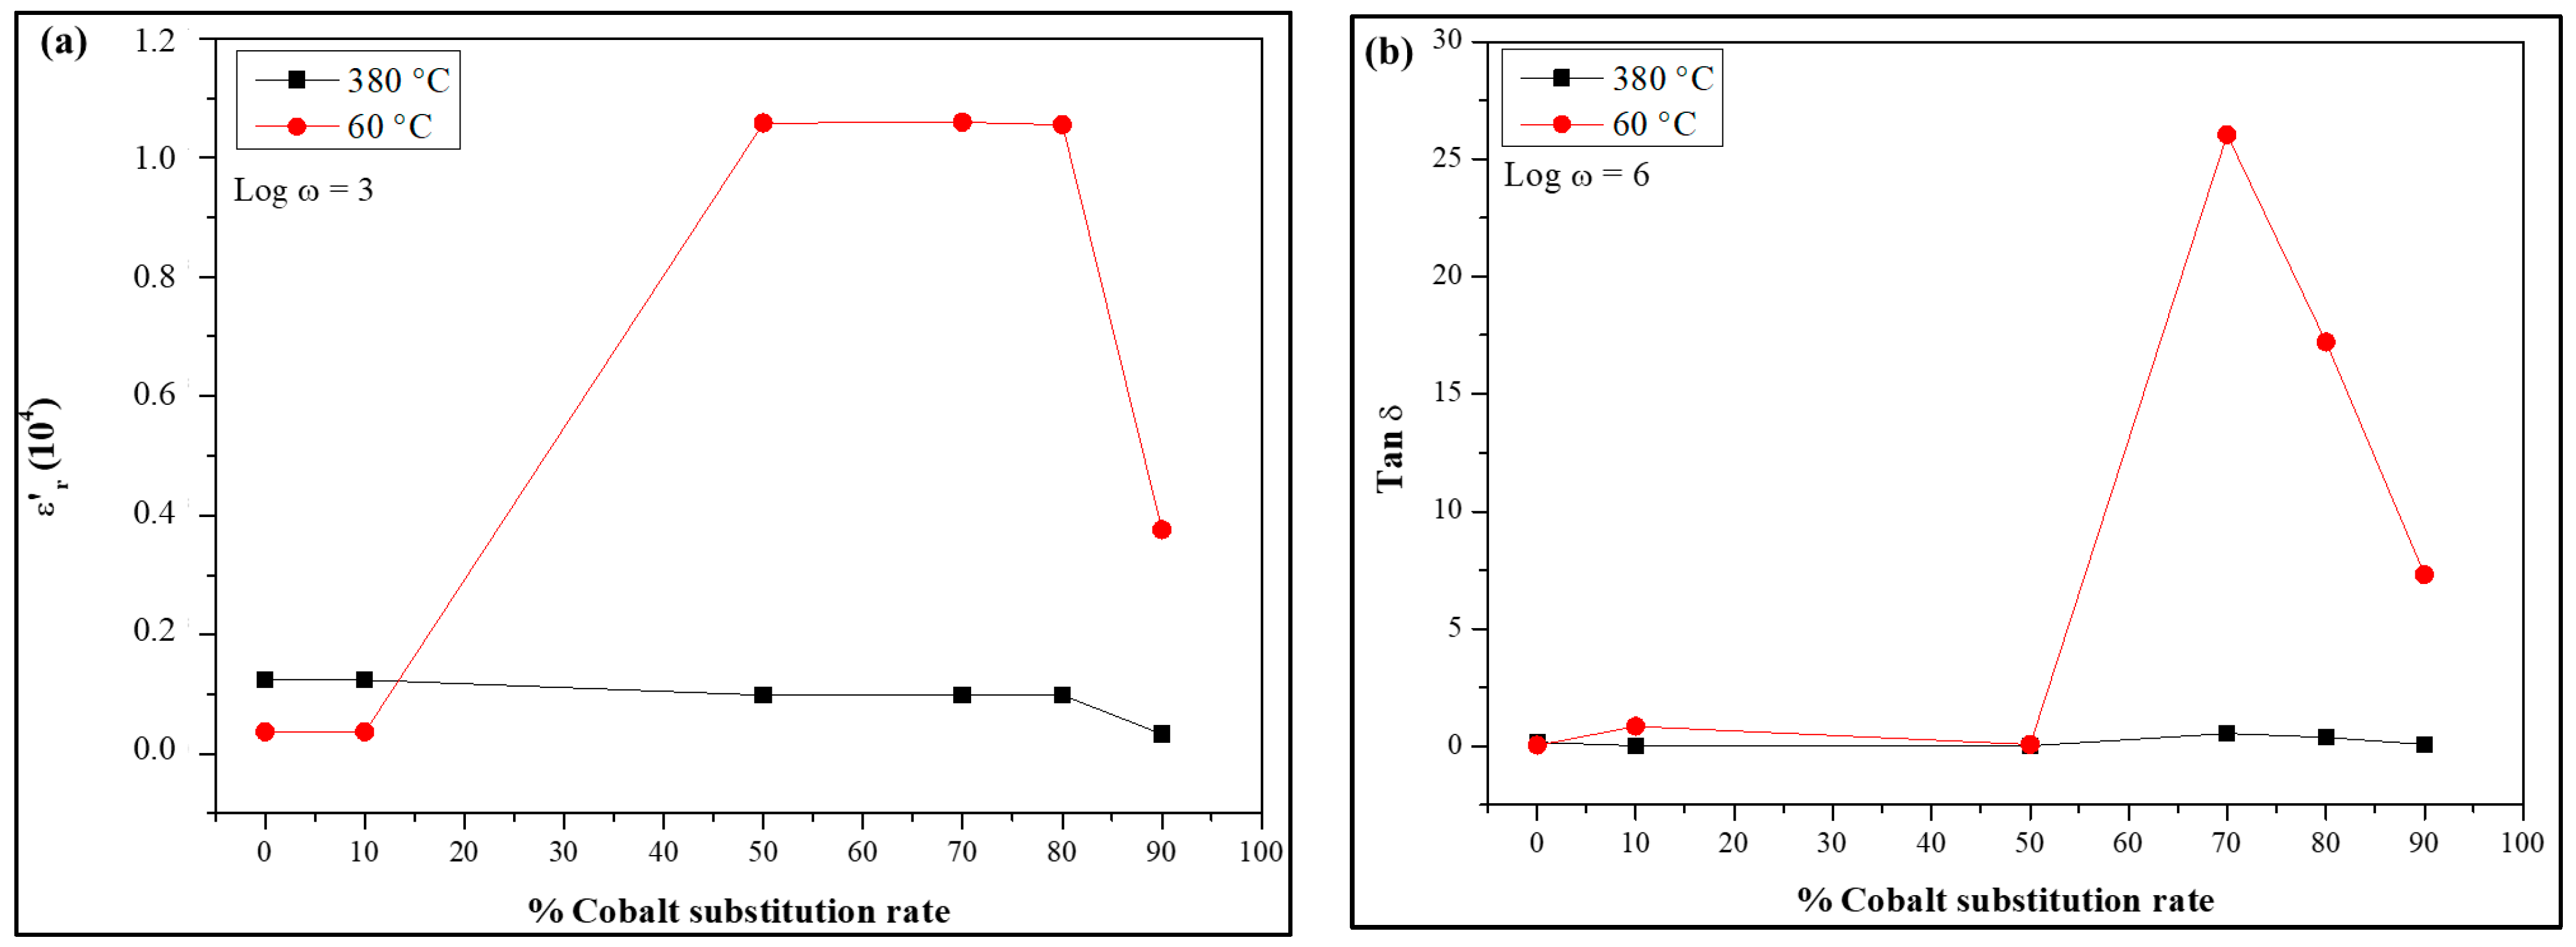
The correlation between temperature and dielectric constant provides crucial insights for tailoring and enhancing the electrical properties of these materials across diverse applications [56,57,58]. Additionally, εr′ escalates alongside an increase in the cobalt substitution rate (Figure 11). A positive correlation between εr′ and the cobalt substitution rate is observed in BCT nanocrystals up to 40%. However, for higher substitution rates, significant fluctuations in εr′ are evident, particularly between 40% and 80% cobalt. These fluctuations might be attributed to phase segregation or the formation of secondary phases, which disrupt the long-range order and introduce local variations in the dielectric properties. This suggests that the introduction of cobalt intensifies dipole polarization and orientation, resulting in a higher dielectric constant. These findings underscore that the electrical permittivity of BCT nanocrystals exhibits frequency and temperature-dependent behavior.
The interplay of space charge, orientation dipole and other polarization mechanisms contributes to the intricate modulation of the dielectric constant in relation to frequency.
Additionally, it is worth highlighting the combined influence of temperature and cobalt substitution rate on electrical permittivity. A positive correlation exists between temperature, the cobalt substitution rate and the dielectric constant of BCT nanocrystals. As both temperature and cobalt substitution increase, the dielectric constant exhibits a corresponding rise, indicating the synergistic influence of these factors on the material’s dielectric response. Elevated temperatures enhance charge mobility, leading to heightened polarization. Meanwhile, the introduction of cobalt, through its impact on the crystalline structure, fosters dipole alignment, further augmenting permittivity. This dynamic arises from the nuanced interaction between the electrical properties of materials and their internal dynamics under the influence of these variables. These insights underscore the significance of a meticulous assessment of the combined effects of temperature and substitution on the electrical properties of materials. This behavior suggests an enhanced dielectric contribution to the material’s electrical properties. At lower frequencies, the material exhibits a greater ability to store electrical charge, a phenomenon closely linked to the reorientation of dipoles or charge carriers within the material.
Figure S7a–f depicts the variation in the loss angle (tan(δ)) as a function of logarithmic angular frequency (Log(ω)) for all BCT nanocrystals at different temperatures. The graphical plots clearly illustrate the close relationship between the loss angle and the frequency of the applied electric field, revealing a gradual decrease until this quantity reaches an almost constant value. The evolution of the loss angle (tan(δ)) in dielectric materials can be attributed to two distinct components: resistive loss, characterizing the dissipation of energy by mobile charges present in the material, and relaxation loss, reflecting the conversion of energy into heat during dipole relaxation.
When explaining the variation in tan(δ) with frequency, a particularly relevant model is the one developed by Wagner and Maxwell, based on the concept of space charge polarization [59,60]. At low frequencies, space charges within the material can follow the evolution of the applied electric field. This ability allows electrons to travel through the grains, exhibiting high conductivity, as well as through grain boundaries, where conductivity is lower. However, at higher frequencies, this model shows that space charges struggle to keep up with the pace of the electric field, leading to a weakening of conduction efficiency. This explanation contributes to a better understanding of the underlying mechanisms of the loss angle, paving the way for potential optimizations in the development of advanced dielectric materials and high-performance electronic components.
The disparity in conductivity leads to an accumulation of electrons along grain boundary interfaces, inducing substantial space charge polarization and consequently resulting in a considerable loss angle. However, as the frequency increases, electrons change their direction at a higher rate, limiting the accumulation of charges at grain boundary interfaces and consequently attenuating the loss angle. Figure S7a–f demonstrates that the loss angle (tan(δ)) shows a significant temperature dependence, decreasing as the temperature increases. This trend can be attributed to the enhanced mobility of charges at elevated temperatures, which reduces resistive losses and, consequently, the loss angle [61]. Additionally, it is noteworthy that the loss angle decreases, particularly beyond a 60% cobalt substitution rate, as the concentration of the substituent (cobalt) increases (Figure 11b). This reduction is likely due to the improved crystalline structure resulting from higher cobalt concentrations, which minimizes interface imperfections and thereby reduces relaxation losses.
In summary, the loss angle of BCT nanocrystals is influenced by a combination of factors including frequency, temperature and substituent concentration. The observed variations in this angle find a clear explanation in the context of the space charge polarization model, as well as in fluctuations in charge mobility and crystalline structure. Both the high dielectric constant (εr′) and loss angle (tan(δ)) serve as crucial indicators of dielectric behavior, particularly in applications related to energy storage. These parameters are closely interlinked and have a direct impact on the energy storage process. A high dielectric constant (εr′) signifies enhanced capacity to accumulate electric charge in response to applied voltage. This characteristic implies the ability to store a greater amount of charge for each unit of applied voltage. Consequently, a high dielectric constant greatly augments the energy storage capacity of a device. Certainly, this fosters the accumulation of a larger quantity of electrical energy within the material. Conversely, the low value of the loss angle tan(δ), indicating the proportion of energy dissipated as heat when an alternating voltage is applied, signifies minimal energy losses in the energy storage and release process. Essentially, the material excels at efficiently storing and releasing electrical energy, thereby reducing substantial energy wastage. This attribute proves highly advantageous, leading to the optimization of energy storage device performance, rendering them more cost-effective and durable.

3.2.3. Modulus Mechanism

The real part, M′, and the imaginary part, M′′, of the electrical modulus can be expressed by the following relationships [51,62]:
M = ω C 0 Z = ε r ε r 2 + ε r 2 ,
M = ω C 0 Z = ε r ε r 2 + ε r 2
Figure 12 depicts the variation in the real part (M′) of the electrical modulus as a function of the logarithmic angular frequency (Log(ω)) for the Ba1−xCoxTiO3 {x = 0, …, 1} nanocrystals (NCs) at different temperatures.
At lower frequencies, the M′ values remain exceptionally low for all temperatures, indicating negligible influence from electrode polarization. This implies that the material’s response in this frequency range is primarily driven by alternative conduction mechanisms. With increasing frequency, specifically for ω < ω0, M′ experiences a notable rise across all temperatures, signifying that charge carriers predominantly exhibit extended mobility. This suggests that charges can traverse greater distances in response to the applied electric field at these frequencies. Conversely, at higher frequencies (ω > ω0), M′ stabilizes at a relatively constant level, indicating that conduction is now primarily governed by the limited mobility of charge carriers over shorter distances. This frequency-dependent behavior delineates a discernible transition between distinct charge transport mechanisms as the frequency of the applied electric field varies.
Figure 13 presents the variation in the imaginary part (M″) of the electrical modulus as a function of the logarithmic angular frequency (Log(ω)) for the Ba1−xCoxTiO3 {x = 0, …, 1} nanocrystals (NCs) at different temperatures.
A careful examination of Figure 13 and Figure S9a–f reveals several significant points. Firstly, a shift in ω0 without altering the maximum value of M″ (M″max) suggests an adjustment in Rest, without affecting the capacitance Cest of the samples. Additionally, a change in the value of M″max without variation in ω0 indicates transformations in both Rest and Cest. These simultaneous fluctuations in the indicators reflect concurrent adjustments of Rest and Cest in response to changes in frequency. For low frequencies, the M″ values tend toward zero. This observation implies that the effect of electrode polarization becomes negligible and can be relegated to the background. Essentially, this finding indicates that the material’s response at these lower frequencies is primarily governed by other conduction mechanisms, the impact of which predominates in this frequency range. These considerations underscore the relevance of frequency-domain analyses in understanding the electrical and dielectric properties of materials. They shed light on how various factors, such as resistance, capacitance and polarization mechanisms, interact and evolve with frequency, providing a richer framework for interpreting and optimizing the properties of these materials. As the frequency increases, (ω < ω0), M″ increases, indicating that we are in a frequency range where charge carriers can successfully jump over long distances from one site to another. In contrast, at high frequencies (ω > ω0), M″ decreases, indicating that we are now in a frequency range where charge carriers are spatially confined to their potential wells and can only undergo localized short-range motion within localized sites. Furthermore, as the temperature increases, M″ decreases, and the peaks of M″ shift to higher frequencies, suggesting that charge carrier conductivity is due to a thermally activated process. The electrical modulus spectra for all samples at different temperatures exhibit asymmetric relaxation peaks, indicating a non-Debye-type behavior. This suggests the existence of a conductivity relaxation process in the material, corresponding to the transition from long-range charge carrier mobility to short-range mobility. Figure 13 reveals interesting features regarding the electrical behavior of Ba1−xCoxTiO3 {x = 0, …, 1} nanocrystals (NCs) as a function of frequency and temperature. The observed variations in M″ and ω0 indicate changes in the material’s resistance Rest and capacitance Cest, while the presence of asymmetric relaxation peaks suggests a non-Debye-type behavior and a conductivity relaxation process. These results are essential for understanding charge transport mechanisms in Ba1−xCoxTiO3 {x = 0, …, 1} NCs and for harnessing their electrical properties in various applications.

4. Discussion

4.1. Boundary between Doping and Cobalt Substitution within the BaTiO3 Matrix

In materials science, distinguishing between doping and substitution is pivotal. Doping introduces foreign atoms that can disrupt the lattice and energy levels, while substitution involves replacing atoms with those of similar size and charge, preserving structural integrity. In the context of cobalt (Co) substitution in barium titanate (BaTiO3), substitution maintains the crystal structure while allowing the fine-tuning of material properties. This method provides enhanced control over properties without significant structural compromise, as demonstrated by our study and previous research. Our findings align with and expand upon previous studies in several ways:
Study [63] observed that Co doping led to a shift from a quadratic to a pseudo-cubic phase in Ba1−xCoxTiO3, with a notable decrease in the band gap from 3.14 eV to 2.11 eV. These changes in optical properties due to Co concentration complement our observation of structural transitions from perovskite to ilmenite CoTiO3 with increasing Co content. Our results not only confirm these structural transitions but also highlight the impact of Co substitution on the electrical properties of the material.
Previous research [64] focused on BaTiO3 doped with strontium (Sr) and yttrium (Y), noting changes in crystalline structure and optical properties. Unlike their findings, our study emphasizes the more flexible cobalt substitution, which allows for a broader range of material properties. This flexibility results in a unique transition from BaTiO3 to CoTiO3, demonstrating a significant structural and functional evolution not observed with Sr or Y doping.
Study [65] explored the photovoltaic potential of Ba0.92Bi0.08Ti(1−x)CoxO3, highlighting structural changes and band gap adjustments. Our study builds on this by examining a wider range of Co substitution and its effects on both structural and electrical properties. This work provides a comprehensive view of the advantages of Co substitution, including the ability to precisely control material properties across a wide range of concentrations. This contrasts with the more restrictive doping methods explored in prior research and underscores the potential for tailoring properties for specific applications.

4.2. Enhancing Electrical Properties as a Function of Cobalt Substitution Rate

Enhancing electrical properties through cobalt substitution underscores the potential application of such materials in fields like electronics and energy storage. Cobalt is often used due to its unique electronic and magnetic properties, which can significantly impact electrical conductivity, magnetic susceptibility and other electrical properties. The effects of cobalt substitution vary depending on the substance and the rate of substitution.
Cobalt substitution affects the complex impedance of BaTiO3, altering both the real and imaginary components. The introduction of Co can induce non-Debye dielectric behavior due to increased disorder and lattice defects. Our impedance measurements reflect these changes, with Nyquist plots showing the activation of grain boundary effects and a shift in dielectric behavior compared to previous findings.
The real part of impedance, Z′, related to resistance, decreases with increased Co substitution and temperature. This decrease is attributed to enhanced charge carrier mobility and reduced resistance due to thermal agitation and lattice defects. This trend is consistent with observations in other studies [66,67,68,69,70,71,72,73,74], where resistance decreased with Co and Mn substitution and rising temperature (Figure 14). Notably, the lowest Z′ values are primarily observed for cobalt substitution rates exceeding 60%. This observation is particularly significant as it aligns remarkably well with the results obtained from X-ray diffraction (XRD) analysis, which indicate a structural change occurring around 60% cobalt substitution. This correlation between low Z′ values and the structural change detected by XRD suggests a profound modification of the material’s electrical properties beyond the 60% substitution threshold. The change in crystal structure could be responsible for a lattice reorganization that further enhances charge carrier mobility, thus explaining the more pronounced decrease in resistance. This phenomenon underscores the critical importance of composition and crystal structure in determining the electrical properties of materials. The concordance between impedance and XRD results strengthens our understanding of the underlying mechanisms governing the electrical behavior of these cobalt-substituted systems, opening new perspectives for optimizing material properties based on their composition. The observation that significant changes in Z′ occur primarily above 60% cobalt substitution provides valuable insight into the structure–property relationships in these materials. It suggests a possible critical point or phase transition at this composition, where the electrical characteristics of the material undergo a substantial transformation. This finding could have important implications for tailoring the electrical properties of such materials for specific applications, particularly in fields where low resistance or high conductivity is desirable.
Furthermore, the agreement between the electrical measurements (impedance spectroscopy) and structural characterization (XRD) reinforces the validity of both techniques in probing the fundamental properties of these complex systems. It demonstrates the interconnectedness of structural and electrical properties in materials science, highlighting the need for a multifaceted approach in materials research and development.
The imaginary part of impedance, Z″, related to capacitance, generally increases with higher Co substitution rates (Figure 14b). This enhancement is attributed to improved ferroelectric domain reorganization and higher charge storage capacity. Similar findings have been reported in studies of yttrium-doped BaTiO3, which observed increased capacitance with doping.
Importantly, the increase in Z″ as a function of the proportion of substituted cobalt is observed across almost all substitution levels. This trend indicates a consistent impact of cobalt substitution on the capacitive properties of the material throughout the composition range. However, a notable exception occurs in the range between 50% and 60% cobalt substitution, where a specific behavior is observed.
This distinctive behavior in the 50–60% range is likely explained by the structural change occurring in this domain, as previously indicated by XRD results. The anomaly in Z″ trends within this narrow composition window suggests a critical transition point where the material’s capacitive properties are significantly affected by the evolving crystal structure. The presence of this specific behavior further corroborates the XRD findings and emphasizes the profound influence of structural changes on the material’s electrical properties. It suggests that as the material undergoes a phase transition or significant structural reorganization between 50% and 60% cobalt substitution, its capacitive characteristics are temporarily altered before resuming the general increasing trend at higher substitution levels.
This observation provides valuable insight into the complex interplay between composition, structure and electrical properties in these cobalt-substituted systems. It highlights the importance of carefully considering composition ranges when tailoring materials for specific capacitive applications, as certain ranges may offer unique properties or behaviors. Our results demonstrate how Co substitution influences capacitance across a wide range of compositions, offering potential for optimizing materials for high-capacitance applications. The identification of this specific behavior in the 50–60% range also opens up possibilities for further investigation into the mechanisms underlying this phenomenon and its potential exploitation in specialized applications requiring precisely tuned capacitive properties.
The dielectric constant (εr′) of BaTiO3 increases with Co substitution, indicating improved charge storage capacity and enhanced polarization (Figure 11a). This trend is observed consistently across the range of cobalt substitution levels, demonstrating the persistent influence of cobalt on the material’s dielectric properties. Our findings, which show a frequency-dependent behavior in εr′, are consistent with observations from other studies, highlighting how Co substitution can enhance dielectric properties. It is worth noting that while the general trend shows an increase in εr′ with cobalt substitution, particular attention should be paid to the behavior in the 50–60% substitution range. Given the structural changes previously observed in this range through XRD analysis and impedance measurements, there might be a specific pattern or anomaly in the dielectric constant behavior within this narrow composition window. This could potentially correlate with the structural transition occurring in this range, further emphasizing the intricate relationship between composition, structure and dielectric properties.
The loss angle, or tan δ, which indicates energy dissipation, also shows a consistent trend with increased Co substitution. Higher levels of Co substitution lead to higher tan δ values, reflecting greater energy loss (Figure 11b). This behavior aligns with findings from other studies, where dielectric loss decreased with increasing frequency. Our results show a similar trend with Co substitution across most of the composition range. As with the dielectric constant, it is important to examine the tan δ behavior in the 50–60% substitution range closely. Any deviation from the general trend in this range could provide additional insight into how the structural changes affect energy dissipation in the material.
The consistent increase in both εr′ and tan δ with cobalt substitution, observed across almost all substitution levels, underscores the significant impact of cobalt on the material’s dielectric properties. This trend suggests that cobalt substitution consistently enhances the material’s ability to store electrical energy, albeit at the cost of increased energy dissipation. However, the potential for unique behavior in the 50–60% substitution range, correlating with the structural changes observed through other techniques, adds an intriguing dimension to these findings.
The real (M′) and imaginary (M″) parts of the complex impedance modulus provide valuable insights into charge carrier mobility and dielectric relaxation processes. Our study shows variations in M′ with frequency that corroborate results from previous research, reflecting the impact of Co substitution on these processes. As with Z′ and Z″, the evolution of M′ and M″ as a function of cobalt substitution rate is generally progressive across the entire composition range. However, particular attention should be paid to the 50–60% substitution range, where specific behaviors might be observed due to the structural change previously identified by XRD and impedance measurements.
The modulation of electrical properties through cobalt substitution introduces interesting perspectives for the application of these materials in fields such as electronics and energy storage. Cobalt is often used due to its unique electronic and magnetic properties. Electrical conductivity, magnetic susceptibility and other electrical properties can all be influenced by cobalt substitution in a material. It is important to note that the effects of cobalt substitution vary depending on the host material and the substitution rate [75,76,77]. In our study on BaTiO3, we observe a general trend of improved dielectric properties with increasing cobalt substitution rate. However, the specific behavior observed in the 50–60% range underscores the complexity of these systems and the importance of considering the entire composition range when optimizing materials for specific applications.
This comprehensive analysis, taking into account the results of Z′, Z″, εr′, tan δ, M′, and M″, highlights the consistency of changes observed across different electrical characterization techniques. It also emphasizes the crucial importance of the structural transition occurring between 50% and 60% cobalt substitution, which seems to significantly influence all the electrical properties of the material.
The overall trend of increasing dielectric constant and loss tangent with cobalt substitution, observed across most substitution levels, demonstrates the significant impact of cobalt on the material’s dielectric properties. This trend suggests that cobalt substitution consistently enhances the material’s ability to store electrical energy, albeit at the cost of increased energy dissipation.

5. Conclusions

Unveiling the potential of Ba(1−x)CoxTiO3 nanocrystals for advanced energy storage applications, our comprehensive examination has revealed several key observations in their structural and enhanced electrical and dielectric properties:
  • XRD analysis identified and confirmed the crystal phases in BCT nanocrystals, providing details on structural parameters.
  • Electrical conductivity investigations revealed semiconducting behavior, emphasizing potential applications in electronics and solid-state technology, with conductivity increasing at higher temperatures and with greater cobalt concentrations.
  • The dielectric constant (εr′) exhibited intriguing frequency-dependent behavior, decreasing with increasing frequency but stabilizing at higher frequencies. Elevated temperatures and cobalt substitution further enhanced εr′, making the material suitable for various technological applications.
  • The loss angle demonstrated frequency-dependent behavior, gradually decreasing and stabilizing with frequency. Elevated temperatures and increased cobalt concentration reduced tan(δ), indicating minimal energy dissipation during energy storage and release processes.
  • The electrical modulus real part (M′) and imaginary part (M″) showed insights into charge carrier mobility. At low frequencies, M′ remained low, highlighting other dominant conduction mechanisms. As frequency increased, M′ increased, signifying long-range charge carrier mobility. At higher frequencies, M′ stabilized, reflecting short-range mobility.
  • Overall, cobalt substitution in BCT nanocrystals significantly improved their electrical and dielectric properties, showcasing their potential for cutting-edge energy storage applications.

Supplementary Materials

The following supporting information can be downloaded at: https://www.mdpi.com/article/10.3390/solids5030031/s1, Table S1. Identification of the used specified compounds. Figure S1. Detailed experimental protocol. Figure S2. Rietveld refinement of (a) Ba0.9Co0.1TiO3, (b) Ba0.8Co0.2TiO3, (c) Ba0.7Co0.3TiO3, (d) Ba0.6Co0.4TiO3, (e) Ba0.5Co0.5TiO3, (f) Ba0.4Co0.6TiO3, (g) Ba0.3Co0.7TiO3, (h) Ba0.2Co0.8TiO3, (i) Ba0.1Co0.9TiO3, and (j) CoTiO3 structure using Profex BGMN software. Appendix S1. Williamson-Hall Analysis. Figure S3. Nyquist diagrams of Ba(1−x)CoxTiO3 nanocrystals for (a) x = 0, (b) x = 0.1, (c) x = 0.5, (d) x = 0.7, (e) x = 0.8, and (f) x = 0.9. Figure S4. Variation in the imaginary part of impedance (−Z″) with angular frequency at different Temperatures for BCT, (a) x = 0, (b) x = 0.1, (c) x = 0.5, (d) x = 0.7, (e) x = 0.8, and (f) x = 0.9. Figure S5. Variation in electrical conductivity (σ) with angular frequency at different temperatures for BCT, (a) x = 0, (b) x = 0.1, (c) x = 0.5, (d) x = 0.7, (e) x = 0.8, and (f) x = 0.9. Figure S6. Variation in the dielectric constant (εr′) with angular frequency at different temperatures for BCT, (a) x = 0, (b) x = 0.1, (c) x = 0.5, (d) x = 0.7, (e) x = 0.8, and (f) x = 0.9. Figure S7. Variation n the real part of the electrical modulus (M′) with angular frequency at different temperatures for BCT, (a) x = 0, (b) x = 0.1, (c) x = 0.5, (d) x = 0.7, (e) x = 0.8, and (f) x = 0.9. Figure S8. Variation in the imaginary part of the electrical modulus (M″) with angular frequency at different temperatures for BCT, (a) x = 0, (b) x = 0.1, (c) x = 0.5, (d) x = 0.7, (e) x = 0.8, and (f) x = 0.9. Figure S9. Variation in the Loss angle (Tan(δ)) with angular frequency at different temperatures for BCT, (a) x = 0, (b) x = 0.1, (c) x = 0.5, (d) x = 0.7, (e) x = 0.8, and (f) x = 0.9.

Author Contributions

S.J.: Formal analysis, Methodology, Funding acquisition; C.M.: Visualization, Funding acquisition, Writing—original draft; W.A.: Formal analysis, Methodology, Funding acquisition; M.M.: Formal analysis, Methodology, Funding acquisition; A.O.: Investigation, Validation; W.O.: Data curation, Conceptualization, Formal analysis, Funding acquisition, Supervision, Writing—Original draft, Writing—Review and editing, Project administration. All authors have read and agreed to the published version of the manuscript.

Funding

This research received no external funding.

Data Availability Statement

Data will be made available on request.

Acknowledgments

The results presented are part of the PhD thesis carried out at the Faculty of Sciences of Bizerte, University of Carthage, 7021 Zarzouna, Tunisia, and supervised by Walid Oueslati. C.M. and S.J. express gratitude to W.O. for the innovative idea behind this work, fruitful discussions regarding all the results, overseeing the work, paper writing, and the corrections made.

Conflicts of Interest

The authors declare no conflict of interest.

References

  1. Gupta, S.; Kumar, M. Computational Fluid Dynamics: Innovations in Numerical Techniques, Multi-Phase Flow Modeling, and Prospects for Sustainable Energy Applications. J. Sustain. Urban Futures 2023, 13, 1–20. [Google Scholar]
  2. Müller, C.; Ouyang, L.; Lund, A.; Moth-Poulsen, K.; Hamedi, M.M. From Single Molecules to Thin Film Electronics, Nanofibers, e-Textiles and Power Cables: Bridging Length Scales with Organic Semiconductors. Adv. Mater. 2019, 31, 1807286. [Google Scholar] [CrossRef] [PubMed]
  3. Janicke, M.; Jacob, K. A third industrial revolution. In Long-Term Governance for Social-Ecological Change; Routledge: Abingdon, UK, 2013; pp. 47–71. [Google Scholar]
  4. Misra, A.; Kozma, K.; Streb, C.; Nyman, M. Beyond charge balance: Counter-cations in polyoxometalate chemistry. Angew. Chem. Int. Ed. 2020, 59, 596–612. [Google Scholar] [CrossRef] [PubMed]
  5. Cox, P.A. Transition Metal Oxides: An Introduction to Their Electronic Structure and Properties; Oxford University Press: Oxford, UK, 2010; Volume 27. [Google Scholar]
  6. Nkele, A.C.; Ezugwu, S.; Suguyima, M.; Ezema, F.I. Structural and electronic properties of metal oxides and their applications in solar cells. In Chemically Deposited Nanocrystalline Metal Oxide Thin Films: Synthesis, Characterizations, and Applications; Springer International Publishing: Cham, Switzerland, 2021; pp. 147–163. [Google Scholar]
  7. Yuan, C.; Wu, H.B.; Xie, Y.; Lou, X.W. Mixed transition-metal oxides: Design, synthesis, and energy-related applications. Angew. Chem. Int. Ed. 2014, 53, 1488–1504. [Google Scholar] [CrossRef]
  8. Larcher, D.; Tarascon, J.M. Towards greener and more sustainable batteries for electrical energy storage. Nat. Chem. 2015, 7, 19–29. [Google Scholar] [CrossRef]
  9. Kanwade, A.; Shirage, P.M. A review on synergy of transition metal oxide nanostructured materials: Effective and coherent choice for supercapacitor electrodes. J. Energy Storage 2022, 55, 105692. [Google Scholar]
  10. Jebali, S.; Meftah, M.; Mejri, C.; Ben Haj Amara, A.; Oueslati, W. Enhancement of Photocatalytic Activity and Microstructural Growth of Cobalt-Substituted Ba1−xCoxTiO3 {x = 0,…, 1} Heterostructure. ChemEngineering 2023, 7, 43. [Google Scholar] [CrossRef]
  11. Butt, M.K.; Saleem, S.; Al-Harbi, F.F.; Atta, S.; Ishfaq, M.; Al Juman, F.S.; Yaseen, M. Optical and magnetic characteristics of BaTi1−xCoxO3: A first-principles study. Chalcogenide Lett. 2023, 20, 459–467. [Google Scholar] [CrossRef]
  12. Mohanty, H.S.; Puhan, T.S.; Padhi, S.; Panda, S.; Samantaray, S.S.; Rana, G.; Bhoi, K.; Sahu, U.K.; Mohapatra, S.; Raut, S.; et al. Insight of the Influence of Cobalt Substitution on the Structural, Microstructural, Optical and Electrical Properties of Tetragonal Barium Titanate Ceramics. ECS J. Solid State Sci. Technol. 2023, 12, 093001. [Google Scholar] [CrossRef]
  13. Padilla-Campos, L.; Diaz-Droguett, D.E.; Lavín, R.; Fuentes, S. Synthesis and structural analysis of Co-doped BaTiO3. J. Mol. Struct. 2015, 1099, 502–509. [Google Scholar] [CrossRef]
  14. Gupta, P.; Mahapatra, P.K.; Choudhary RN, P. Investigation on structural and electrical properties of Co and W modified BaTiO3. Ceram. Int. 2019, 45, 22862–22871. [Google Scholar] [CrossRef]
  15. Chu, B.J.; Chen, D.R.; Li, G.R.; Yin, Q.R. Electrical properties of Na1/2Bi1/2TiO3–BaTiO3 ceramics. J. Eur. Ceram. Soc. 2002, 22, 2115–2121. [Google Scholar] [CrossRef]
  16. Ghayour, H.; Abdellahi, M. A brief review of the effect of grain size variation on the electrical properties of BaTiO3-based ceramics. Powder Technol. 2016, 292, 84–93. [Google Scholar] [CrossRef]
  17. Morrison, F.D.; Sinclair, D.C.; West, A.R. Doping mechanisms and electrical properties of La-doped BaTiO3 ceramics. Int. J. Inorg. Mater. 2001, 3, 1205–1210. [Google Scholar] [CrossRef]
  18. Arshad, M.; Du, H.; Javed, M.S.; Maqsood, A.; Ashraf, I.; Hussain, S.; Ma, W.; Ran, H. Fabrication, structure, and frequency-dependent electrical and dielectric properties of Sr-doped BaTiO3 ceramics. Ceram. Int. 2020, 46, 2238–2246. [Google Scholar] [CrossRef]
  19. Slimani, Y.; Selmi, A.; Hannachi, E.; Almessiere, M.; AlFalah, G.; AlOusi, L.F.; Yasin, G.; Iqbal, M. Study on the addition of SiO2 nanowires to BaTiO3: Structure, morphology, electrical and dielectric properties. J. Phys. Chem. Solids 2021, 156, 110183. [Google Scholar] [CrossRef]
  20. Slimani, Y.; Shirsath, S.E.; Hannachi, E.; Almessiere, M.A.; Aouna, M.M.; Aldossary, N.E.; Yasin, G.; Baykal, A.; Ozçelik, B.; Ercan, I. (BaTiO3)1−x + (Co0.5Ni0.5Nb0.06Fe1.94O4)x nanocomposites: Structure, morphology, magnetic and dielectric properties. J. Am. Ceram. Soc. 2021, 104, 5648–5658. [Google Scholar] [CrossRef]
  21. Gargar, Z.; Tachafine, A.; Fasquelle, D.; Zegzouti, A.; Elaatmani, M.; Daoud, M. Grain size effects on dielectric properties of yttrium doped BaTiO3 ceramics. Phase Transit. 2023, 97, 338–349. [Google Scholar] [CrossRef]
  22. Hu, X.; Zhang, H.; Wu, D.; Yin, D.; Zhu, N.; Guo, K.; Lu, C. PVDF-based matrix with covalent bonded BaTiO3 nanowires enabled ultrahigh energy density and dielectric properties. Chem. Eng. J. 2023, 451, 138391. [Google Scholar] [CrossRef]
  23. Martínez-López, R.; Pérez-Labra, M.; Romero-Serrano, J.; Barrientos-Hernández, F.; Reyes-Pérez, M.; Valenzuela-Carrillo, M.; Urbano-Reyes, G.; Reyes-Cruz, V.; Dávila-Pulido, G. BaTiO3 solid solutions co-doped with Gd3+ and Eu3+: Synthesis, structural evolution and dielectric properties. J. Rare Earths 2023. [Google Scholar] [CrossRef]
  24. Sidaoui, S.; Ghoudi, A.; Oueslati, A.; Raduca, M.; Badea, M.; Andruh, M.; Nasr, S.; Naïli, H.; Rekik, W. Crystal structure, thermal behavior and electric properties of a new semiconductor cobalt-based hybrid material. J. Mol. Struct. 2023, 1294, 136394. [Google Scholar] [CrossRef]
  25. Fontaine, B. Optimisation des Propriétés de Céramiques Piézoélectriques sans Plomb du Type BCTZ par Modification de la Composition et par Dopage. Ph.D. Thesis, Université Polytechnique Hauts-de-France, Institut National des Sciences Appliquées Hauts-de-France, Valenciennes, France, 2022. [Google Scholar]
  26. Bottala-Gambetta, I. Elaboration et Caractérisation de Couches Ferroélectriques pour la Fabrication de Transistors FeFET. Ph.D. Thesis, Université Grenoble Alpes, Grenoble, France, 2023. [Google Scholar]
  27. Borderon, C.; Ginestar, S.; Renoud, R.; Gundel, H.; Muzzupapa, V.; Huitema, L.; Crunteanu, A. Couches Minces Ferroelectriques de Ba1−xSrxTiO3 Accordables pour une Antenne Patch Millimétrique Reconfigurable en Fréquence. 2023. Available online: https://hal.science/hal-04030162 (accessed on 19 June 2024).
  28. Chatta, W. Etude des Propriétés Diélectriques des Céramiques a Base de Titanate de Baryum BaTiO3. Ph.D. Thesis, Université de Laghouat-Amar Telidji, Laghouat, Algeria, 2013. [Google Scholar]
  29. Laasri, H.A. Étude et Elaboration de Matériaux Ferroélectriques sans Plomb pour le Stockage de l’Energie Electrique. Ph.D. Thesis, Université du Littoral Côte d’Opale, Dunkirk, France, Université Cadi Ayyad, Faculté des Sciences Semlalia, Marrakech, Morocco, 2018. [Google Scholar]
  30. Lahcen, P.B.; Said, P.B.; Mohamed, P.E.O.; Mustapha, P.H.; Amar, P.B.; Abdeslam, P.E.B.; Bouchaib, P.M. Verres et Vitrocéramiques Diélectriques Titano-Phosphatés pour le Stockage Electrostatique de l’Energie. Ph.D. Thesis, Univerisité Moulay Ismail, Meknes, Morocco, 2020. [Google Scholar]
  31. Lataoui, R.; Triki, A.; Hcini, S.; Oueslati, A.; Zemni, S.; Kanoun, O. Conduction mechanisms and complex impedance analysis in La0.6Sr0.4FeO3 ceramic. J. Electroceram. 2023, 50, 121–138. [Google Scholar] [CrossRef]
  32. Syaizwadi, S.M.; Ghazali, M.S.M.; Ikhmal, W.M.K.W.M.; Hazim, M.A.M.S.; Rafizah, W.A.W.; Kassim, S.; Lee, O.J.; Aini, I.N.Q.; Kamilah, S.N.; Zaid, M.H.M.; et al. Nonlinearity characteristics of low-voltage barium titanate based zinc oxide varistor ceramics modified by cobalt dopants. J. Integr. Circuits Syst. 2021, 16, 1–7. [Google Scholar] [CrossRef]
  33. Liu, P.; Ng, V.M.H.; Yao, Z.; Zhou, J.; Lei, Y.; Yang, Z.; Lv, H.; Kong, L.B. Facile synthesis and hierarchical assembly of flowerlike NiO structures with enhanced dielectric and microwave absorption properties. ACS Appl. Mater. Interfaces 2017, 9, 16404–16416. [Google Scholar] [CrossRef] [PubMed]
  34. Pinto, A.H.; Nogueira, A.E.; Dalmaschio, C.J.; Frigini, I.N.; de Almeida, J.C.; Ferrer, M.M.; Berengue, O.M.; Gonçalves, R.A.; de Mendonça, V.R. Doped Tin Dioxide (d-SnO2) and Its Nanostructures: Review of the Theoretical Aspects, Photocatalytic and Biomedical Applications. Solids 2022, 3, 327–360. [Google Scholar] [CrossRef]
  35. Joshi, M.J. Importance of impedance spectroscopy technique in materials characterization: A brief review. Mech. Mater. Sci. Eng. MMSE J. 2017, 9, hal-01504661. [Google Scholar]
  36. Patterson, A.L. The Scherrer formula for X-ray particle size determination. Phys. Rev. 1939, 56, 978. [Google Scholar] [CrossRef]
  37. Le, O.K.T.; Pham, A.T.T.; Pham, N.K.; Pham, T.H.C.; Nguyen, T.H.; Van Hoang, D.; Ta, H.K.T.; Truong, D.C.; Lai, H.T.; Ung, T.D.T.; et al. Compensation of Zn substitution and secondary phase controls effective mass and weighted mobility in In and Ga co-doped ZnO material. J. Mater. 2021, 7, 742–755. [Google Scholar]
  38. Phan, T.L.; Thanh, T.D.; Ho, T.A.; Manh, T.V.; Tran, Q.T.; Lampen, P.; Phan, M.H.; Yu, S.C. An Effective Route to Control the Magnetic-Phase Transition and Magnetocaloric Effect of La0.7Ca0.3MnO3 Nanoparticles. IEEE Trans. Magn. 2014, 50, 2302604. [Google Scholar] [CrossRef]
  39. Williamson, G.K.; Hall, W.H. X-ray line broadening from filed aluminium and wolfram. Acta Metall. 1953, 1, 22–31. [Google Scholar] [CrossRef]
  40. de Pauli, M.; Gomes, A.M.; Cavalcante, R.L.; Serpa, R.B.; Reis, C.P.; Reis, F.T.; Sartorelli, M.L. Capacitance spectra extracted from EIS by a model-free generalized phase element analysis. Electrochim. Acta 2019, 320, 134366. [Google Scholar] [CrossRef]
  41. Mane, S.M.; Pawar, S.A.; Patil, D.S.; Kulkarni, S.B.; Tayade, N.T.; Shin, J.C. Magnetoelectric, magnetodielectric effect and dielectric, magnetic properties of microwave-sintered lead-free x(Co0.9Ni0.1Fe2O4)-(1−x)[0.5(Ba0.7Ca0.3TiO3)-0.5(BaZr0.2Ti0.8O3)] particulate multiferroic composite. Ceram. Int. 2020, 46, 3311–3323. [Google Scholar]
  42. Bora, D.J.; Chowdary, V.A.; Chandana, P.; Chaithanya, P. Modeling and Simulation of Electrical Circuits to Determine Human Body Impedance. In Proceedings of the 2023 Fifth International Conference on Electrical, Computer and Communication Technologies (ICECCT), Erode, India, 22–24 February 2023; IEEE: Piscataway, NJ, USA, 2023; pp. 1–4. [Google Scholar]
  43. Sassi, M.; Bettaibi, A.; Oueslati, A.; Khirouni, K.; Gargouri, M.J.J.O.A. Electrical conduction mechanism and transport properties of LiCrP2O7 compound. J. Alloys Compd. 2015, 649, 642–648. [Google Scholar] [CrossRef]
  44. Cui, X.; Hu, T.; Wu, H.; Zhang, J.; Yang, L.; Zhong, X.; Wu, X.; Wang, J.; Li, X.; Yang, J.; et al. Charge Carrier Transport Behavior and Dielectric Properties of BaF2:Tb3+ Nanocrystals. Nanomaterials 2020, 10, 155. [Google Scholar] [CrossRef]
  45. Puente-Córdova, J.G.; Luna-Martínez, J.F.; Mohamed-Noriega, N.; Miranda-Valdez, I.Y. Electrical Conduction Mechanisms in Ethyl Cellulose Films under DC and AC Electric Fields. Polymers 2024, 16, 628. [Google Scholar] [CrossRef]
  46. Zhang, X.; Pu, Y.; Ning, Y.; Zhang, L.; Wang, B.; Chen, Z. Ultrahigh energy storage with superfast charge-discharge capability achieved in linear dielectric ceramic. J. Mater. Sci. Technol. 2024, 177, 59–67. [Google Scholar] [CrossRef]
  47. Shekhar, M.; Pradhan, L.K.; Kumar, L.; Kumar, P. Dielectric Relaxation Behavior and Conduction Mechanism of Ca and Ti Co-Doped Multiferroic Bismuth Ferrite. J. Electron. Mater. 2023, 52, 6182–6202. [Google Scholar] [CrossRef]
  48. Smith, C.S. Multiscale Characterization of Ferroelastic Deformation in Ceramic Materials. Ph.D. Thesis, University of Illinois at Urbana-Champaign, Champaign, IL, USA, 2020. [Google Scholar]
  49. Jebli, M.; Rayssi, C.; Dhahri, J.; Henda, M.B.; Belmabrouk, H.; Bajahzar, A. Structural and morphological studies, and temperature/frequency dependence of electrical conductivity of Ba0.97La0.02Ti1−xNb4x/5O3 perovskite ceramics. RSC Adv. 2021, 11, 23664–23678. [Google Scholar] [CrossRef] [PubMed]
  50. Husenkhan, D.B. Studies of Physical Properties of Low Melt Oxide Glasses. Ph.D. Thesis, Gulbarga University, Gulbarga, India, 2022. [Google Scholar]
  51. Barsoukov, E.; Macdonald, J.R. (Eds.) Impedance Spectroscopy: Theory, Experiment, and Applications; John Wiley & Sons: Hoboken, NJ, USA, 2018. [Google Scholar]
  52. Saha, S.; Chanda, S.; Dutta, A.; Sinha, T.P. Dielectric relaxation of PrFeO3 nanoparticles. Solid State Sci. 2016, 58, 55–63. [Google Scholar] [CrossRef]
  53. Singha, S.; Thomas, M.J.; Kulkarni, A. Complex permittivity characteristics of epoxy nanocomposites at low frequencies. IEEE Trans. Dielectr. Electr. Insul. 2010, 17, 1249–1258. [Google Scholar] [CrossRef]
  54. Fan, J.; Chen, Y.; Long, Z.; Tong, L.; He, G.; Hu, Z. Giant dielectric response and relaxation behavior in (Tm+ Ta) co-doped TiO2 ceramics. Phys. Chem. Chem. Phys. 2022, 24, 4759–4768. [Google Scholar] [CrossRef] [PubMed]
  55. Das, A.; Pamu, D. A comprehensive review on electrical properties of hydroxyapatite based ceramic composites. Mater. Sci. Eng. C 2019, 101, 539–563. [Google Scholar] [CrossRef] [PubMed]
  56. Bandaru, P.R. Electrical properties and applications of carbon nanotube structures. J. Nanosci. Nanotechnol. 2007, 7, 1239–1267. [Google Scholar] [CrossRef] [PubMed]
  57. Remya, K.P.; Prabhu, D.; Joseyphus, R.J.; Bose, A.C.; Viswanathan, C.; Ponpandian, N. Tailoring the morphology and size of perovskite BiFeO3 nanostructures for enhanced magnetic and electrical properties. Mater. Des. 2020, 192, 108694. [Google Scholar] [CrossRef]
  58. Kumar, S.; Supriya, S.; Kar, M. Enhancement of dielectric constant in polymer-ceramic nanocomposite for flexible electronics and energy storage applications. Compos. Sci. Technol. 2018, 157, 48–56. [Google Scholar] [CrossRef]
  59. Rogti, F.; Ferhat, M. Maxwell–Wagner polarization and interfacial charge at the multi-layers of thermoplastic polymers. J. Electrost. 2014, 72, 91–97. [Google Scholar] [CrossRef]
  60. Vu TT, N.; Teyssedre, G.; Le Roy, S.; Laurent, C. Maxwell–Wagner effect in multi-layered dielectrics: Interfacial charge measurement and modelling. Technologies 2017, 5, 27. [Google Scholar] [CrossRef]
  61. BinAhmed, S.; Hozalski, R.M.; Romero-Vargas Castrillón, S. Feed temperature effects on organic fouling of reverse osmosis membranes: Competition of interfacial and transport properties. ACS ES&T Eng. 2021, 1, 591–602. [Google Scholar]
  62. Hodge, I.M.; Ngai, K.L.; Moynihan, C.T. Comments on the electric modulus function. J. Non-Cryst. Solids 2005, 351, 104–115. [Google Scholar] [CrossRef]
  63. Lemziouka, H.; Nekkach, F.; Boutahar, A.; Moubah, R.; Omari, L.H.; Filali, M.; Rjeb, A.; Lassri, H.; Abid, M.; Hlil, E.K.; et al. Effect of Cobalt Doping on the Structural, Linear, and Nonlinear Optical Properties in Ba1−xCoxTiO3 Perovskites. J. Electron. Mater. 2023, 52, 3420–3430. [Google Scholar] [CrossRef]
  64. Tihtih, M.; Ibrahim JE, F.; Basyooni, M.A.; Kurovics, E.; Belaid, W.; Hussainova, I.; Kocserha, I. Role of A-site (Sr), B-site (Y), and A, B sites (Sr, Y) substitution in lead-free BaTiO3 ceramic compounds: Structural, optical, microstructure, mechanical, and thermal conductivity properties. Ceram. Int. 2023, 49, 1947–1959. [Google Scholar] [CrossRef]
  65. Ramay, S.M.; Kassim, H.; Mahmood, A.; Siddig, A.A.; Al Zayed, N.S. Tunable bandgap of bismuth-modified barium titanate by cobalt substitution for photovoltaic application. J. Mater. Sci. Mater. Electron. 2022, 33, 14343–14355. [Google Scholar] [CrossRef]
  66. Bujakiewicz-Koronska, R.; Gondek, Ł.; Vasylechko, L.; Balanda, M.; Juszynska-Galazka, E.; Galazka, M.; Majda, D.; Piekarczyk, W.; Zywczak, A.; Cizman, A.; et al. Magnetoelectric, spectroscopic, optical and elastic properties of Co-doped BaTiO3 ceramics. J. Alloys Compd. 2023, 946, 169344. [Google Scholar] [CrossRef]
  67. Niu, M.M.; Liu, J.; Sun, T.L.; Zu Jiang, R.; Hou, D.H.; Xu, D. Effect of transition metal element substitution on magnetoelectric properties of BiFeO3-BaTiO3 ceramics. J. Alloys Compd. 2021, 859, 158224. [Google Scholar] [CrossRef]
  68. Zhang, L.; Pu, Y.; Chen, M. Complex impedance spectroscopy for capacitive energy-storage ceramics: A review and prospects. Mater. Today Chem. 2023, 28, 101353. [Google Scholar] [CrossRef]
  69. Ku Muhsen KN, D.; Osman RA, M.; Idris, M.S.; Muhammad Nadzri, N.I.; Ruiz León, D.A. Structural Analysis and Dielectric Properties of Oxygen Non-Stoichiometry 5% Fe-Doped BaTiO3 Ceramic. Adv. Sci. Technol. 2022, 118, 47–52. [Google Scholar]
  70. Gent, W.E.; Busse, G.M.; House, K.Z. The predicted persistence of cobalt in lithium-ion batteries. Nat. Energy 2022, 7, 1132–1143. [Google Scholar] [CrossRef]
  71. Saadi, H.; Benzarti, Z.; Sanguino, P.; Pina, J.; Abdelmoula, N.; de Melo, J.S.S. Enhancing the electrical conductivity and the dielectric features of ZnO nanoparticles through Co doping effect for energy storage applications. J. Mater. Sci. Mater. Electron. 2023, 34, 116. [Google Scholar] [CrossRef]
  72. Cao, M.; Yan, X.J.; Li, L.; Wu, S.Y.; Chen, X.M. Obtaining Greatly Improved Dielectric Constant in BaTiO3–Epoxy Composites with Low Ceramic Volume Fraction by Enhancing the Connectivity of Ceramic Phase. ACS Appl. Mater. Interfaces 2022, 14, 7039–7051. [Google Scholar] [CrossRef]
  73. Akter, S.; Ahad, A.; Das, M.K.; Taher, M.A.; Barik, A.; Alam, F.; Khan, M.N.I. Study of structural, dielectric, and impedance properties of lead-free Zr and Y Co-doped BaTiO3. Mater. Chem. Phys. 2022, 275, 125241. [Google Scholar] [CrossRef]
  74. Kumari, A.; Singh, O.; Arya, E.; Chauhan, M.; Vermani, V.; Sanghi, S.; Agarwal, A. Crystal structure, dielectric and magnetic properties of (1−x)BaTiO3-(x) BaFe12O19 (x = 0.50, 0.60, 0.70) multiferroic composites. Appl. Phys. A 2023, 129, 334. [Google Scholar] [CrossRef]
  75. Sandeep, Y.; Rambabu, T.; Vinod, G.; Narayana, M.V.; Aravind, G.; Nathanial, V. Investigation of structural and dielectric properties of Gd3+ substituted nickel-zinc ferrite prepared via low-temperature citrate gel self-ignited process. Mater. Today Proc. 2022, 59, 1211–1220. [Google Scholar] [CrossRef]
  76. Samuvel, K.; Ramachandran, K.; Vinodkumar, R.; Kumaran, M.; Laksmishri, S. Equal-molar ratio of barium titanate doped with cobalt oxides, electrical parameter study of under high calcination of low milling hours. Int. J. Curr. Sci. 2023, 13, IJCSP23A1218. [Google Scholar]
  77. Dhahri, A.; Belkahla, A.; Laifi, J.; Gouadria, S.; Elhadi, M.; Dhahri, J.; Dhahri, E. Crystal structure and dielectric properties of the Ca/Y co-substituted BaTiO3. Inorg. Chem. Commun. 2022, 141, 109570. [Google Scholar] [CrossRef]
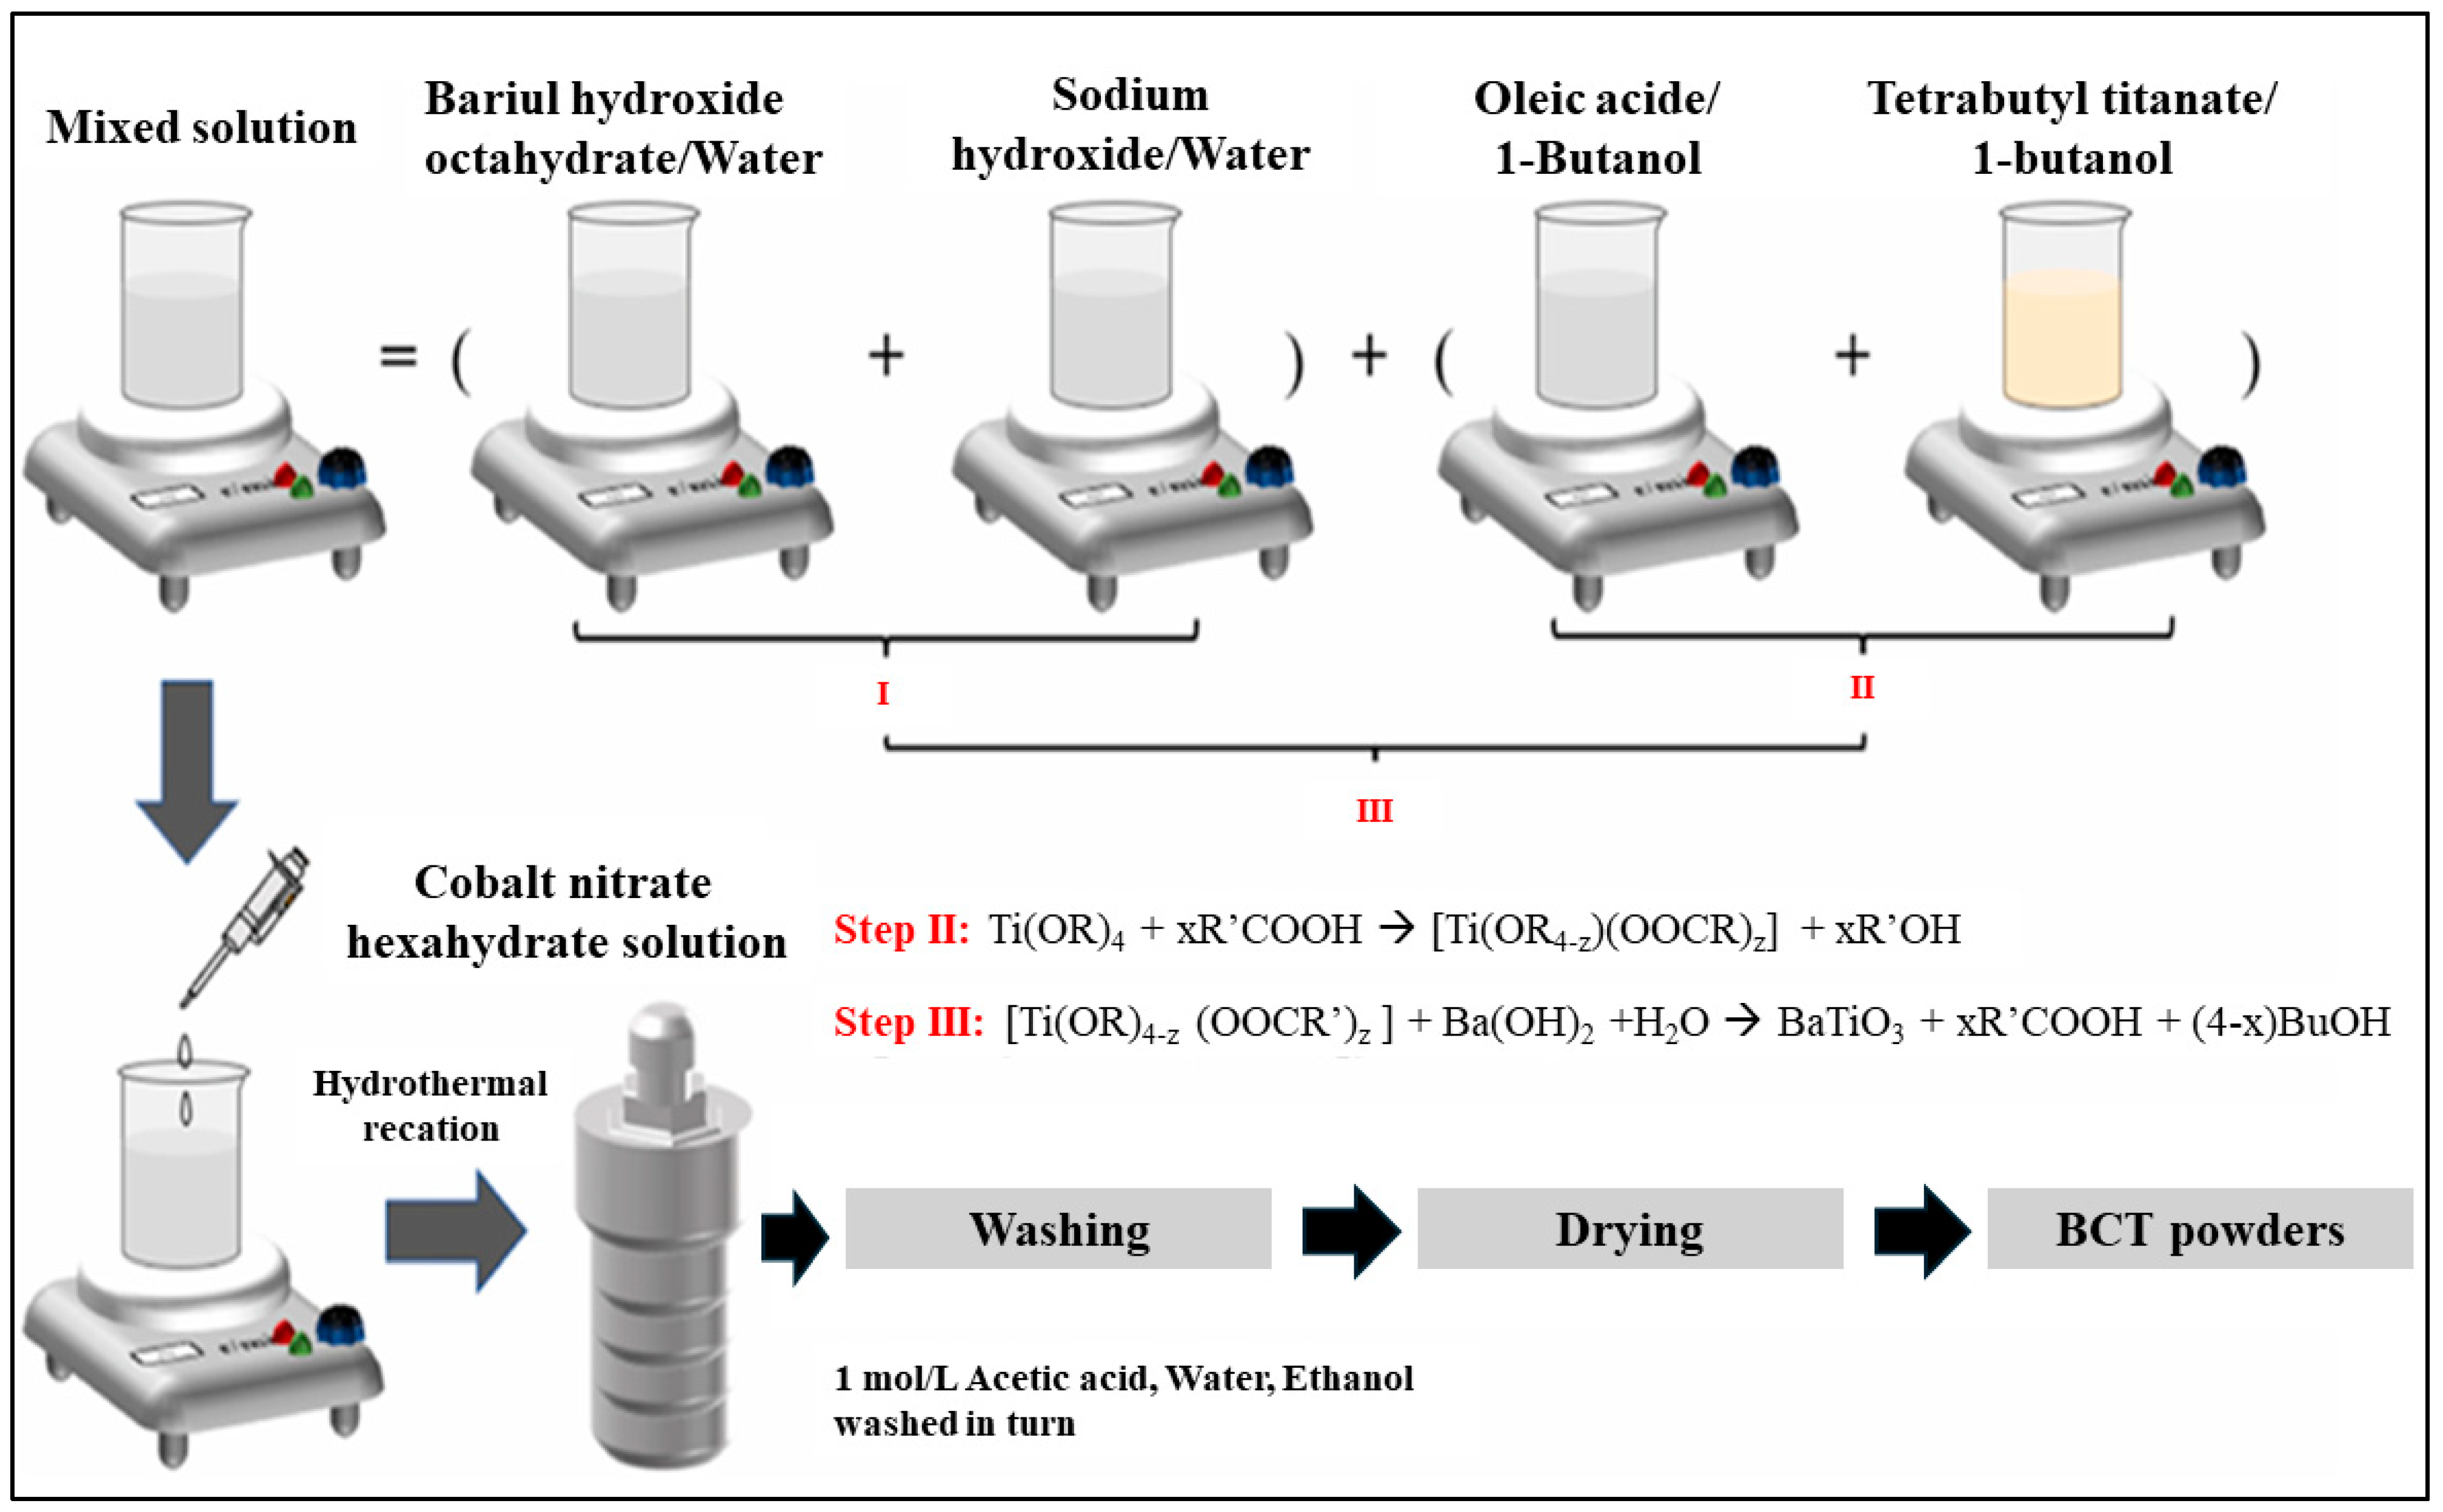
Figure 1. Flow chart of the hydrothermal processing of BCT (x = {0, …, 1}) powder nanocrystal synthesis.
Solids 05 00031 g001
Figure 2. Characteristic parts of PXRD patterns of Ba(1−x)CoxTiO3 (x = {0, …, 1}) Ba/Co-substituted barium titanate.
Solids 05 00031 g002
Figure 3. Results of Rietveld refinement of BaTiO3 structures. Short vertical bars indicate the positions of diffraction maxima in the major tetragonal phase.
Solids 05 00031 g003
Figure 4. Nyquist diagrams of Ba0.5Co0.5TiO3 nanocrystals and equivalent circuit.
Solids 05 00031 g004
Figure 5. Variation in (a) resistance {Rest}, and (b) capacitance {Cest} with temperature for BCT nanocrystals.
Solids 05 00031 g005
Figure 6. Variation in the imaginary part of impedance (−Z″) with angular frequency at different Temperatures for BCT (x = 0.5).
Solids 05 00031 g006
Figure 7. Variation in relaxation time (τ) as a function of temperature for BCTO nanocrystals {x = 0; 0.1; 0.5; 0.7; 0.8; and 0.9}.
Solids 05 00031 g007
Figure 8. Variation in electrical conductivity (σ) with angular frequency at different temperatures for Ba0.5Co0.5TiO3 sample.
Solids 05 00031 g008
Figure 9. Conductivity against cobalt substitution rate at fixed Log(ω) and extreme temperature.
Solids 05 00031 g009
Figure 10. Variation in the dielectric constant (εr′) with angular frequency at different temperatures for Ba0.5Co0.5TiO3 sample.
Solids 05 00031 g010
Figure 11. (a) εr′ variation versus the cobalt substitution rate at fixed log(ω) = 3 and extreme temperature, and (b) variation in the loss angle (tan(δ)) versus the cobalt substitution rate at fixed log(ω) = 6 and extreme temperature.
Solids 05 00031 g011
Figure 12. Variation in the real part of the electrical modulus (M′) with angular frequency at different temperatures for Ba0.5Co0.5TiO3.
Solids 05 00031 g012
Figure 13. Variation in the imaginary part of the electrical modulus (M″) with angular frequency at different temperatures for Ba0.5Co0.5TiO3.
Solids 05 00031 g013
Figure 14. The real part of impedance (a) Z′ and (b) −Z″ versus cobalt substitution rate and temperature.
Solids 05 00031 g014
Table 1. Structure and symmetry of BCT nanocrystals.
NanocrystalsSymmetriesCrystallographic Structures
BTTetragonalPerovskite
BCT (x = 0.1)TetragonalPerovskite
BCT (x = 0.2)TetragonalPerovskite
BCT (x = 0.3)TetragonalPerovskite
BCT (x = 0.4)TetragonalPerovskite
BCT (x = 0.5)TetragonalPerovskite
BCT (x = 0.6)TetragonalPerovskite
BCT (x = 0.7)RhombohedralIlmenite
BCT (x = 0.8)RhombohedralIlmenite
BCT (x = 0.9)RhombohedralIlmenite
CT (x = 1)RhombohedralIlmenite
Table 2. Evolution of crystallite size in Ba1−xCoxTiO3 nanocrystals as a function of cobalt substitution rate.
NanocrystalsCrystallite Sizes (nm)
BT78.2
BCT (x = 0.1)73.2
BCT (x = 0.2)66.9
BCT (x = 0.3)58.3
BCT (x = 0.4)56.6
BCT (x = 0.5)51.1
BCT (x = 0.6)50.1
BCT (x = 0.7)48.8
BCT (x = 0.8)44.3
BCT (x = 0.9)42.7
CT (x = 1)39.1
Table 3. Rietveld refinement structural parameters and unit cell data for BT and BCT NPs.
% CoUnit CellReliability FactorsSpace Group
a (Å)b (Å)c (Å)α (°)β (°)ɣ (°)RPRWPGoF
03.98863.98864.000609090905.5706.991.25P4mm
103.99803.99804.018005.6211.111.97P4mm
203.99803.99804.022005.2914.722.78P4mm
303.990003.990012.21141206.1714.111.73P63/mmc
403.69833.698312.60235.2807.041.66P63/mmc
502.72402.724011.96405.7010.871.32P63/mmc
602.93012.930111.99802.8309.983.52R-3
705.48605.48607.032001.7804.742.66R-3
805.48605.48607.032001.7805.292.97R-3
905.07605.07605.4860054.8354.8354.831.5304.873.18R-3
1005.07605.07605.4860054.8354.8354.831.7804.742.66R-3
Disclaimer/Publisher’s Note: The statements, opinions and data contained in all publications are solely those of the individual author(s) and contributor(s) and not of MDPI and/or the editor(s). MDPI and/or the editor(s) disclaim responsibility for any injury to people or property resulting from any ideas, methods, instructions or products referred to in the content.