Abstract
Study develops and field-validates a SCADA-based real-time monitoring system to reduce unplanned dilution and hanging-wall over-break in underground long-hole stoping at a Zimbabwean gold mine. The objectives were to detect and constrain drilling deviation in real time, quantify the impact on stope stability and dilution, and evaluate operational and economic effects. The system integrates IMU inclinometers (hole angle), rotary encoders (depth), and LiDAR (collar spacing) with a Siemens S7 PLC (RS Americas, Fort Worth, TX, USA) and AVEVA™ InTouch HMI 2023 R2. Field trials across three production stopes (12L, 14L, 15L) compared baseline manual monitoring to SCADA control. Mean angular deviation fell from 0.8–1.6° to 0.2–0.3°, length deviation from 0.8–1.1 m to 0.05–0.08 m, and positional error from 0.25–0.32 m to 0.04–0.06 m; major collapses were eliminated, and ELOS dropped (e.g., 0.20 m to 0.05 m). Dilution decreased from 25% (typical 21–26%) to 16–18%, with mill feed grade rising from 1.90 to 2.25 g/t; production rates were maintained, with brief auto-stops in 5% of holes and rapid operator correction. Real-time drilling control materially reduces unplanned dilution and improves wall stability without productivity penalties, yielding compelling economics.
1. Introduction
Dilution in underground mining refers to the unwanted mixing of ore with low-grade or waste material, which can significantly reduce the ore grade and overall profitability of a mining operation [1,2,3,4,5]. It remains a critical challenge in the mining industry worldwide, as excessive dilution not only decreases the economic value of mined ore but also increases processing costs and wastes capacity on non-valuable material. At the studied gold mine in the Bubi District of Zimbabwe, dilution issues have been particularly acute, with average dilution rates around 25%. This high dilution has been linked to frequent hanging wall collapses in long-hole stopes, and it carries severe financial implications. In April and May 2024, as an example, the mine produced 38 kg and 36 kg of gold, respectively, falling short of a 46 kg monthly target due to dilution of high-grade ore with waste. This shortfall corresponded to a combined revenue loss of about US$1.26 million over just two months. Such losses highlight the urgent need to control dilution and its root causes in order to improve ore recovery and sustain profitability.
The mine is situated within the Bulawayo–Bubi Greenstone Belt in Matabeleland North, Zimbabwe. The local geology consists of Archean greenstone rock sequences with multiple mineralised shear zones hosting gold-bearing quartz-carbonate veins. The mine’s stratigraphy includes upper and lower greenstones along with various schistose units and intrusive dykes, creating a structurally complex setting for mining. Gold mineralisation occurs primarily in steeply dipping Riedel shear structures and splay veins within the greenstone host rocks. The ore zones are narrow and discontinuous, which inherently increases the risk of dilution if wall rock is accidentally broken or if mining spans beyond ore boundaries. Figure 1 shows the regional geological setting of the mine. Local complexities such as irregular ore outlines and weak wall rocks present geotechnical challenges that can exacerbate unplanned dilution.
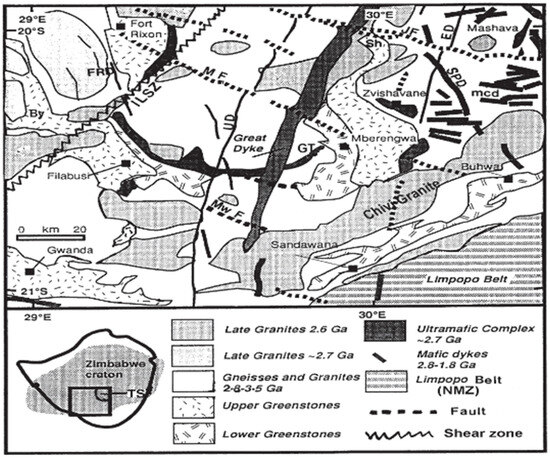
Figure 1.
Regional geological setting of the mine [6].
Mining operations at the mine comprise both open-pit mining (for near-surface resources) and underground mining by the sublevel open stoping method. In sublevel stoping, the orebody is accessed via a series of sublevel drifts, and long vertical blastholes (typically 20–30 m in length) are drilled in rings from one sublevel to a lower sublevel. After drilling, selected rings of blastholes are charged with explosives and blasted, causing the ore to cave and fall into drawpoints for extraction. Ore from the stopes is mucked (removed) using scrapers, wheelbarrows or small locomotives, and then hoisted to surface for processing. Figure 2 illustrates the sublevel stoping mining configuration. A key challenge in this method is maintaining drilling accuracy and stable stope walls; any significant deviation in drill hole alignment or over-break of the hanging wall can lead to dilution as waste rock mixes with the broken ore. Long-hole stopes have been experiencing severe hanging wall failures during blasting at the mine, attributed largely to drilling inaccuracies. These failures introduce a large volume of waste rock into the ore stream and pose safety hazards. This study is therefore centred on the need to improve drilling precision and monitoring in order to reduce the frequency of hanging wall collapses and the resultant ore dilution.
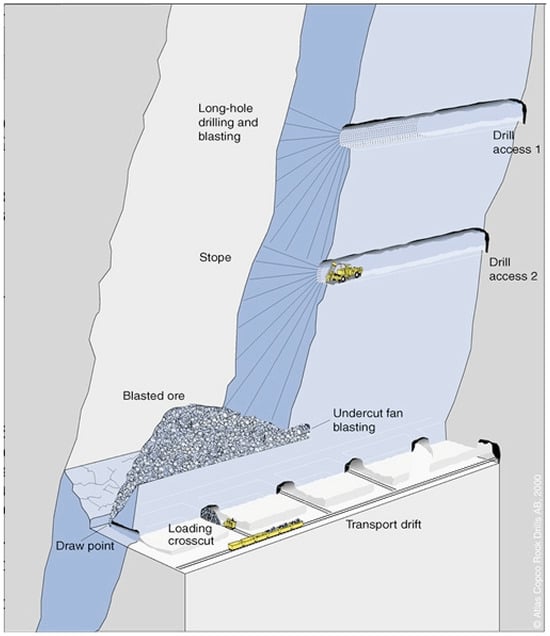
Figure 2.
Schematic of the sublevel open stoping method [7].
Drilling multiple long holes in a fan or ring pattern from sublevels creates an array of blastholes. Upon blasting, broken ore falls to the drawpoint on the footwall for extraction. The hanging wall must remain stable during blasting; over-break of the hanging wall or improper drilling alignment can cause additional waste rock to slough into the stope, contributing to dilution. Uncontrolled dilution directly impacts the mine’s economic performance. Assessment at the mine shows occurrence of about 25% dilution. The ore delivered to the mill has a significantly lower grade than expected, causing gold output to fall short of targets. Each percentage point of dilution effectively adds waste tonnage that must be hauled and processed without yielding revenue, thereby raising unit costs and reducing profit [8,9,10,11,12]. A simplified relationship between dilution and profit can be conceptualised: as dilution (%) increases, the profit (as a percentage of ideal profit with zero dilution) declines roughly linearly. Figure 3 illustrates this concept. In the absence of dilution (ideal situation), the operation achieves 100% of its targeted profit, but at 50% dilution, the profit can drop to near zero, or even negative when additional costs are considered. High dilution can even threaten the viability of a mine in practice. Anderson and Grebenc [13], for instance, noted that a 14% dilution rate at the Golden Giant Mine resulted in an annual loss of US$5.4 million. Clearly, reducing dilution is critical for the mine to avoid such losses.
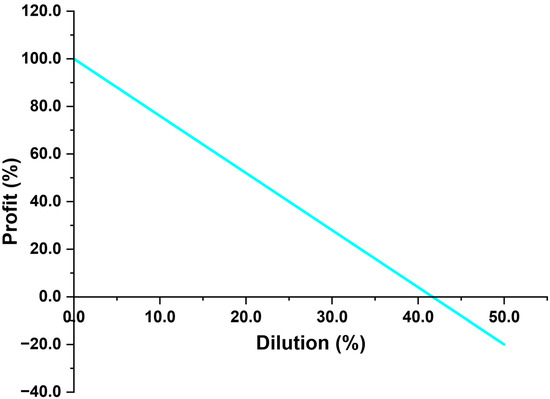
Figure 3.
Conceptual relationship between ore dilution and mining profit. As dilution increases, the effective grade of ore declines, and profit drops approximately linearly. At very high dilution levels, the operation can incur losses. ([13], redrawn).
The root causes of dilution can be broadly grouped into planned and unplanned dilution [14,15,16]. Planned dilution is dilution that is anticipated as part of the mine design—for example, including low-grade wall rock in the stope to recover adjacent narrow ore lenses, or dilution due to designed mining of stope shoulders or backs beyond the ore boundary. Unplanned dilution, on the other hand, occurs unintentionally due to various operational and geotechnical factors; it is the focus of most dilution control efforts since it represents avoidable ore loss [17,18,19,20,21]. In underground stoping, unplanned dilution commonly arises from over-break of stope walls (causing waste rock to cave into the stope), drilling or blasting errors that expand the mining void beyond the planned shape, or mixing of backfill or muck pile waste with ore during handling. Figure 4 illustrates the difference between planned and unplanned dilution in a stope. The mineralised zone (ore) is shown in dark shading; planned dilution is the minor waste taken along with the ore by design, whereas unplanned dilution is the excess waste that enters due to wall failure or poor control.
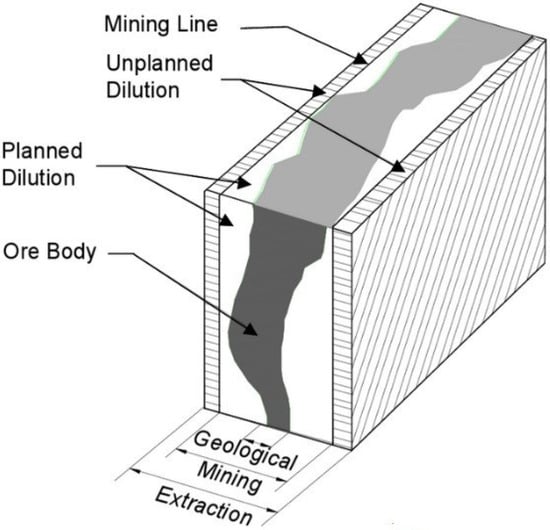
Figure 4.
Schematic illustration of planned vs. unplanned dilution in a long-hole stope [8].
On the diagram in Figure 4, the mineral zone (orebody) is indicated by the solid block, while the area labelled ‘Planned Dilution’ represents low-grade material included intentionally (e.g., sliver of wall rock taken to ensure full ore recovery). The area labelled ‘Unplanned Dilution’ represents waste rock from over-break and sloughing that enters the stope beyond what was planned. Unplanned dilution increases the total tonnage mined without adding valuable ore. A variety of factors contribute to unplanned dilution. Some are related to mining methods and practices—drilling deviation or misalignment can cause holes to break into the walls or neighbouring stopes; use of an inappropriate mining method for the orebody geometry can force inclusion of excess waste; or poor blasting practice (e.g., high powder factor or incorrect timing) can lead to excessive wall damage [22,23,24,25,26]. Other factors stem from ground conditions, such as weak or jointed hanging wall rock that is prone to caving even under careful blasting, or irregular orebody shapes that make it difficult to avoid cutting into waste [27]. Operational performance issues, like survey or mark-up errors, slow loading that leaves broken ore in place longer (increasing exposure to wall sloughing), or dumping waste into ore passes by mistake during mucking, can also add to dilution [28,29,30,31]. Backfill reliability plays a role in mines using fill; if backfilling is inadequate or fill matures poorly (low binder strength), fill can be mined unintentionally or collapse into adjacent stopes, adding to dilution [14]. The cause-and-effect relationships of these factors are often represented by a fishbone diagram. Figure 5 shows a schematic cause-and-effect diagram of potential dilution causes [32], grouping them into four main categories: mining methods, performance (human and equipment factors), ground conditions, and backfill reliability. This diagram highlights that dilution is usually multi-factorial—a combination of technical design issues and execution issues. Notably for the studied mine, the ‘Methods’ and ‘Performance’ branches highlight drilling-related problems (poor drill patterns, drill deviation, misalignment) as critical factors, which aligns with observations that drilling accuracy at the mine has been suboptimal. Effective dilution control requires addressing elements from each category in Figure 5, especially drilling and blasting precision under Methods/Performance.
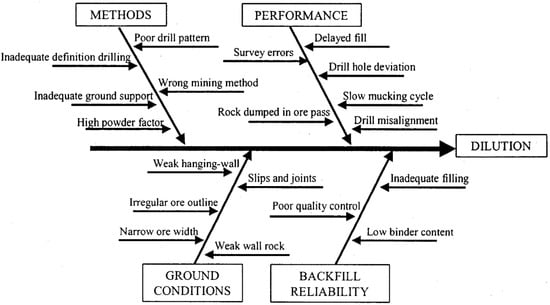
Figure 5.
Cause-and-effect diagram of factors leading to dilution in underground stoping operations [32].
Unplanned dilution has several detrimental effects on mine economics and safety. It reduces the mill feed grade, leading to lower metal recovery for a given tonnage, and increases the volume of material that must be hoisted, hauled, and processed (raising energy and reagent costs). It can also force a mine to process more tonnage to obtain the same amount of metal, effectively shortening the life of reserves and delaying the processing of truly high-grade ore [1]. Dilution and associated over-breaking can also destabilise adjacent structures: if a stope experiences heavy wall failure, it can compromise pillar integrity or put additional stress on support systems [15]. From a financial perspective, unexpected high dilution can quickly erode profit margins; if dilution exceeds mine design forecasts, it can even render an otherwise viable reserve uneconomical [8,31,33]. On the other hand, investing in dilution reduction (through improved monitoring or ground control) often has a high payback. In many cases, every percent decrease in dilution can translate to hundreds of thousands of dollars in saved or additional revenue annually [17].
Given the mentioned challenges at the mine, the mining practitioners recognised that the traditional manual monitoring methods for drilling were insufficient. Historically, drilling crews at the mine marked up long-hole drill patterns manually and checked hole accuracy with basic tools like tape measures and mechanical inclinometers after drilling. This process often detected problems only after an entire ring (or multiple rings) had been drilled, by which time any misalignment might be too late or unsafe to correct. The lack of real-time feedback meant drilling errors accumulated, leading to significant over-break of the hanging wall during blasting and thus dilution. The motivation of this research project, therefore, was to develop and implement a real-time monitoring system for long-hole drilling using SCADA (Supervisory Control and Data Acquisition) technology, to promptly detect and correct drilling deviations before they result in wall instability and dilution.
SCADA systems have been increasingly adopted in modern mining operations as part of the industry’s move towards automation and smart mining [34,35,36,37]. A SCADA system integrates sensors, programmable logic controllers (PLCs), and a central software platform to continuously monitor and control equipment. In the context of drilling, a SCADA-based monitoring system can measure parameters such as drillhole angle, depth, and position in real time, and trigger alerts or even automated controls if those parameters stray outside acceptable limits. Real-time monitoring offers several benefits: enhanced safety (operators are immediately aware of any hazardous deviation), improved productivity (problems are detected early, reducing rework and delays), and better decision-making based on live data [38,39,40,41]. The implementation of SCADA in underground mines faces some challenges. High upfront costs and the need for reliable communication infrastructure in an underground environment can be barriers [41,42,43]. At the mine and several other mines in Zimbabwe, operational processes have traditionally been monitored by manual data collection and periodic inspections rather than by automated systems. The potential upside of SCADA, in reducing dilution and improving operational control, is thus substantial.
This study presents the development and testing of a SCADA-based long-hole drilling monitoring system at the studied gold mine. The study aimed to reduce ore dilution and hanging wall collapses by providing real-time feedback and control during drilling. The succeeding sections of the paper detail the relevant background literature (on dilution mechanisms and monitoring systems), the methodology of system design and data collection, the results obtained (including reductions in drilling deviations, improved wall stability, and economic analysis of the SCADA system’s impact), and a discussion of the findings. The paper concludes with recommendations for further improvement and broader implementation. This research project demonstrates a pathway to smarter mining practices that can significantly mitigate dilution and enhance overall mine performance by integrating modern SCADA technology into the traditional mining framework at the mine.
2. Relevant Background Literature
2.1. Forms and Impacts of Dilution in Underground Mining
Dilution in underground mining has been studied extensively in mine design and ore control literature. As noted earlier, dilution is categorised into planned vs. unplanned forms. Planned dilution is often factored into mine plans (for example, mining through low-grade zones to access higher-grade ore beyond, or including minimum stoping widths that inevitably include some waste). Unplanned dilution, which is more problematic, can result from a variety of causes: stope wall over-break, drilling/blasting inaccuracies, and operational errors [17]. Scoble and Moss [8] described planned and unplanned dilution in terms of the mine’s mining line (the intended excavation boundary)—any excavation beyond this line is unplanned dilution. They emphasise careful delineation of the orebody and tight drilling controls as key to minimising unplanned waste. Unplanned dilution is essentially extra tonnes of waste mined that were not accounted for in the design, thus directly lowering the head grade.
The effects of dilution on revenue generation have been quantified in multiple case studies, even a small percentage of dilution can noticeably reduce metal output because of the proportional reduction in feed grade [2,8,9,31,44,45]. Hartman and Mutmansky [46] and, Napier-Munn and Wills [47] further elaborated that beyond just lost revenue from lower grades, dilution incurs additional processing costs (milling more tonnage, consuming more power and reagents for the same metal output) and can reduce the Net Smelter Return (NSR) per tonne of ore. Dilution, in essence, dilutes profit. When dilution is excessive, the net profit per tonne can drop to near zero or negative, as represented conceptually in Figure 3.
Several researchers have provided empirical examples to illustrate dilution’s financial impact. Tatman [1] noted that dilution not only increases operating costs but also can reduce a mine’s reserves and net present value, since more waste shortens the life of the mine without adding value. A concrete example from Anderson and Grebenc [13] was mentioned: a 14% dilution at a Canadian mine led to an annual loss of $5.4 million, clearly underscoring that controlling dilution can yield multi-million-dollar benefits. In some cases, dilution can reduce the profitability of a stope by up to $9 per tonne of ore mined [13]. Modern mines therefore strive to keep dilution within planned allowances (often <10% in well-controlled operations), using various techniques such as careful perimeter blasting, stope wall support, and grade control practices.
2.2. Dilution Causes: Geotechnical and Operational Factors
Geotechnical instability of stope walls is a primary cause of unplanned dilution in open stoping. Weak hanging wall conditions, presence of joints or faults, and high in situ stresses can lead to sloughing of rock into the stope. Hoek and Brown [48] describe how the rock mass rating (RMR) and joint spacing/orientation influence the likelihood of wall failure—rocks with low RMR or unfavorably oriented joints may need artificial support to prevent falls. Stability analysis on hanging walls shows that when drilling or blasting induces excessive vibrations or fractures in a weak rock mass, progressive failure can occur, causing major unplanned dilution [14,28,49,50]. They highlight that misaligned holes can significantly exacerbate stress concentrations in the hanging wall, effectively prying it off and causing collapse. This aligns with observations at the mine, where drilling deviations were observed to trigger hanging wall collapses by creating an irregular blast that propagates into the wall rock.
Several case studies have been documented of hanging wall collapses linked to drilling or blasting issues [29,31,51,52,53,54]. Ngoma and Mutambo [55] reported a case at Konkola Mine (Zambia) where poor drilling and blasting led to 20% unplanned dilution; misaligned holes resulted in uneven stress distribution, causing a 90 mm displacement in the hanging wall and eventual collapse. Significant unplanned dilution can be caused by rock sloughing due to perimeter holes deviating outward. These studies underline that drilling accuracy is a crucial factor in controlling dilution—when holes stay within the designed envelope, the blasts can be better confined, minimising damage to the walls.
Operational practices also play a significant role. Equipment selection (such as the precision of drills and the use of proper feed rails) and maintenance are important—worn drill bits or erratic drill feeds can cause hole deviation [8,56,57]. Human factors are equally notable: suboptimal mark-ups by surveyors or errors by drillers in following the design can lead to holes in the wrong location or at wrong angles [22,51,58,59]. Inadequate supervision or lack of real-time verification means errors can go unnoticed until after blasting, when the damage is irreversible. Material handling errors are another source of dilution: for example, if waste development rock or backfill is unintentionally mucked with ore (e.g., due to similar appearance or mixing at a drawpoint), it will report as dilution in the mill [28,60]. Good grade control procedures, like separate waste passes and careful monitoring of muck streams, can mitigate this, but they rely on strict discipline and sometimes technology (e.g., radio tags or scanners to track material).
2.3. Monitoring and Control of Dilution
Dilution control has traditionally been part of the broader field of grade control and stope design optimisation. Techniques like dilution plotting (marking actual mined shapes vs. planned shapes and measuring the excess) and using lasers or cavity monitoring systems (CMS) to scan stope voids after blasting have been used to quantify dilution and identify problem areas [19,49,51,61,62,63,64,65,66,67,68]. These methods are, however, reactive—they measure dilution after it has occurred. The ideal approach is proactive monitoring that can alert mine operators to a likely dilution incident before it happens. This is where real-time monitoring systems come in. An overview of CMS-supported reconciliation of stopes is illustrated in Figure 6.
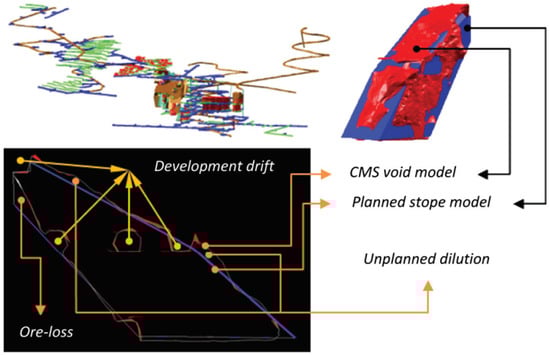
Figure 6.
A review of stope reconciliation performance using a CMS survey [69].
Real-time monitoring systems in mining employ networks of sensors and data acquisition units to continuously track operational parameters [8,19,70,71,72,73,74]. They have been applied in underground mining in various contexts: for ground control (e.g., extensometers and TDR cables that warn of rock movement), for environmental monitoring (air quality sensors), and for equipment telemetry (e.g., conveyor belt monitoring, vehicle tracking). A SCADA-based system monitoring underground mining operations can use sensors to provide live data on equipment and roof conditions, enabling immediate interventions. SCADA greatly enhances situational awareness and can improve both safety and productivity.
In the context of drilling, a SCADA monitoring system can integrate several types of sensors on the drill rig or in the stope: inclinometers or gyroscopic sensors to measure the drilling angle, depth encoders to measure penetration depth, and laser positioning or LiDAR to measure the drill feed or collar location relative to plan. These sensors feed data into a PLC. The PLC, in turn, is programmed with threshold values—allowable tolerances for angle, depth, and position deviations. If the drilling exceeds these tolerances, the system can trigger alerts or even automated actions like stopping the drill. It is important to note that SCADA includes a human–machine interface (HMI) where operators can see the drilling parameters in real time on a screen.
Chilunjika [75] notes that Zimbabwe’s mining firms are rolling out a broad suite of Fourth Industrial Revolution (4IR) tools, spanning automated drilling and loading, digital twins, Internet of Things (IoT) and remote sensing, AI- and machine-learning–based analytics, wider automation platforms, and cloud computing—with uptake and maturity varying across operations. Reported benefits include higher productivity and efficiency, better safety outcomes, stronger decision support, and lower costs. Sector-wide adoption remains constrained by limited capital, gaps in digital infrastructure, rigid resource allocation, and shortages of specialist skills and talent, among other barriers [75]. The capital required for sensors, networking (like installing fibre or wireless communication in drifts), and SCADA software (Siemens TIA portal version 16) can be substantial, and skilled personnel are needed to maintain these systems. Despite these costs, the benefits (like improved safety from hazard warnings and improved productivity from reduced downtime) often outweigh the costs, especially for medium to large scale mines. While some Zimbabwean operations have begun implementing real-time monitoring, wide-scale SCADA integration is still emerging.
Critics of heavy reliance on sensor-based systems have pointed out issues such as reliability and false alarms. Sensors can fail or give spurious data, and over-reliance on automation might lead operators to become complacent [76,77,78]. Considering the reliability of new digital monitoring versus experienced human judgement, it should be noted that an optimal approach can integrate both—using technology to assist rather than replace human oversight [59,79,80,81,82]. Nonetheless, the general trend in mining is moving toward increased automation and data-driven decision-making [41,83,84,85,86,87]. In the context of dilution control, real-time drilling monitoring via SCADA is a natural evolution of traditional grade control.
The literature suggests that controlling dilution requires a multi-pronged strategy: good stope design (to minimise planned dilution), robust ground support and controlled blasting (to minimise unplanned geotechnical dilution), and precise drilling and material handling (to prevent operational dilution). Real-time monitoring systems, such as the SCADA-based approach investigated in this study, directly tackle the latter—ensuring drilling precision and allowing immediate correction of errors. By doing so, they indirectly help maintain stope stability (since properly aligned holes reduce wall damage) and thus reduce geotechnical dilution as well. This study builds upon these insights by applying a SCADA system specifically tailored for long-hole drilling at the study mine, aiming to demonstrate how modern monitoring can significantly reduce dilution in a practical, production environment.
3. Methodology
The methodology for this study involved both the development of a SCADA-based monitoring system for long-hole drilling and the evaluation of its performance compared to the existing manual monitoring approach. The study followed a mixed-methods approach comprising design and engineering of the monitoring system (hardware and software (Siemens TIA portal version 16)), field trials in actual stopes, and data collection/analysis before and after system implementation. The work was carried out at the mine’s underground workings, focusing on three long-hole stopes (at mine levels 12L, 14L, and 15L) which historically had experienced dilution issues. These stopes were used as case study sites for baseline data (manual monitoring) and subsequent implementation of the SCADA system. Figure 7 illustrates a schematic of the research framework.
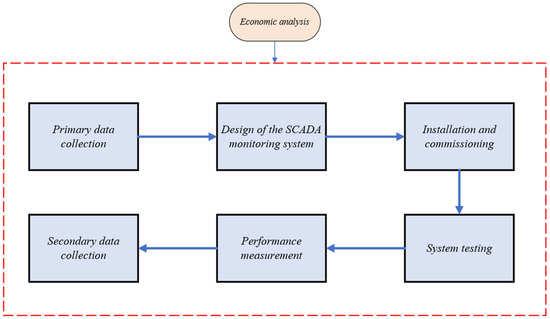
Figure 7.
Research design.
The methodology is structured as follows:
- Primary data collection (manual monitoring assessment)—The drilling accuracy and dilution results under the current manual monitoring regime were first observed and quantified. This involved direct observation of drilling in the study stopes, measurements of drill hole deviations using manual tools, and communication with mine personnel to identify typical issues and delay points in the process.
- Design of the SCADA monitoring system—Based on the identified needs (parameters to monitor, required accuracy, environmental conditions underground), appropriate sensors and hardware were selected. The sensors were then integrated with a PLC, and the SCADA software interface (HMI) was developed with alarm logic for real-time deviation detection. The system was initially tested on surface (in a controlled setting or mock-up) to ensure it functioned as intended.
- Installation and commissioning—The SCADA system components were installed in the chosen stopes (on the drilling rig used for those stopes). Communication networks were established (wired or wireless) to transmit data from the underground PLC to a central SCADA computer on surface or at a central control room on site. A 30-day trial license of AVEVA™ InTouch (a SCADA software platform) was used for the development of the monitoring dashboards and data logging.
- System testing (field trial)—The SCADA monitoring was run in parallel with normal drilling operations in the study stopes over multiple rings of drilling. During this phase, any interventions triggered by the system (e.g., automatic drill stoppages or operator alerts) were documented, and the drilling parameters were also continuously recorded. The field trial was conducted in collaboration with geologists, mining engineers and other expects in order to ensure thorough understanding and monitoring of the geological conditions of the stopes.
- Performance measurement—The outcomes in terms of drilling deviations (actual vs. planned angles, lengths, and positions) were measured with the SCADA system active, and we compared these to the baseline deviations recorded previously under manual monitoring. Any hanging wall collapse incidents and dilution percentages in the stopes during the trial were also tracked, comparing them to historical data.
- Secondary data collection—Historical records from the mine’s production and survey databases for the past year were gathered to contextualise the baseline dilution and to verify if the trial period outcomes represented a significant improvement beyond normal variance. Any economic data (cost of dilution, previous support costs, etc.) was also reviewed to feed into the economic analysis.
- Economic analysis—A cost–benefit analysis comparing the estimated annual loss due to dilution (if no improvements are made) against the cost of implementing and running the SCADA system was finally performed. This was to evaluate the financial viability of the solution.
Ensuring the system’s compatibility with the mine environment was crucial throughout the study. The underground setting at the mine is humid and involves blasting cycles, so sensor ruggedness and protective enclosures were considered. Since the SCADA system can stop a drill automatically, safety reviews to ensure this intervention would not inadvertently cause hazards (for example, verifying that stopping the drill would not cause it to seize in a way that could damage equipment or create pinch points for operators) were implemented.
Table 1 summarizes the typical manual drilling accuracy as recorded in one of the study stopes (15L) prior to the incorporation of the SCADA System. It lists, for each hole in a ring, the planned vs. actual drill angle, the planned vs. actual drilled length, and the resulting deviations in angle, length, and position. Similar measurements were taken for stopes 12L and 14L (their data are presented later in the Results). These baseline measurements provided benchmarks: on average, the study noted angle deviations of 1–2° from plan, length deviations of 0.5–1.5 m, and positional (collar spacing) errors of 0.2–0.5 m in manual drilling (see Table 1). Operators acknowledged that these errors were typical and often attributed to difficulty in maintaining the rig alignment and human error in reading angles or distances.

Table 1.
Baseline manual drilling accuracy measurements for Stope 15L before the incorporation of SCADA System (selected ring data).
From Table 1 (Ring 1 at 15L), we see, for example, that Hole 3 had a planned angle of 65° but was drilled at about 66°, not a large angular error, yet its length was 2.0 m short (22 m vs. 24 m planned). Hole 4 overshot the angle by 1° and was 1.5 m short. These deviations accumulated such that the average depth deviation in Ring 1 was around 0.95 m, and average angle deviation was about 1.1°. Similar or larger discrepancies were found in other rings and stopes.
3.1. Design of the SCADA-Based Monitoring System
Given the deficiencies in manual monitoring, the study designed a SCADA system to provide real-time, automated tracking of three key drilling parameters: hole angle, drilling depth, and drill position. The system was composed of the following main components:
- Sensors—industrial-grade sensors to measure each parameter (Table 2) were selected. For drill hole angle, an inertial measurement unit (IMU) sensor (with an integrated accelerometer/gyroscope) was mounted on the drill feed assembly. This provided continuous inclination data with ±0.1° accuracy. For penetration depth, a rotary encoder was attached to the drill feed mechanism—as the drill carriage advances, the encoder tracks rotation corresponding to linear advancement, measuring depth to within a few centimetres. To monitor the drill position (ensuring correct collar location and spacing), the study deployed a LiDAR distance sensor or laser rangefinder that measured the horizontal distance between the drill feed and a fixed reference point or adjacent hole marks. The LiDAR was particularly useful for confirming that the drill had been set up at roughly the correct spacing from the previous hole (target of about 1 m). Simple limit switches were also placed to detect contact (e.g., whether the drill guide was firmly pressed against the collar point).
Table 2. Selected input parameters and the corresponding sensors used in the SCADA monitoring system.
A programmable logic controller (PLC, Siemens S7 series) was used underground near the drill. This PLC gathered the sensor inputs continuously (via analogue and digital input modules). A key design criterion was response time—the system was required to detect and act on a deviation quickly, ideally pausing the drill within seconds if an angle or position threshold was exceeded. The PLC scan time and network latency were configured to be within 100 ms, effectively real-time for this application.
The communication network linking the PLC to the SCADA server was established using the mine’s existing wired network in main drifts, extended with a wireless node near the stope. A small fiber-optic cable was run to a junction box at 15L, converting to Wi-Fi to reach the rig inside the stope (distance of about 30 m). This hybrid network ensured high bandwidth and reliability while avoiding excessive cabling in the stope that could be damaged by equipment or blasts. Data from the PLC were transmitted to a central SCADA computer located in the mine’s control room on the surface.
For the SCADA software, the study used AVEVA InTouch (formerly Wonderware) to create a graphical human–machine interface (HMI). The architecture of the SCADA system spreads across four conceptual levels: field devices (Level 0), PLC/RTU control (Level 1), local servers (Level 2), and central supervisory systems (Levels 3–4) [88]. In the implementation, the sensors and actuators (field devices) feed into the PLC (acting as an RTU—Remote Terminal Unit). The PLC communicates with a local supervisory computer, which in turn sends data to the central server. The HMI enabled the visualisation of drill parameters in real time and the setting of threshold alarms. Figure 8 presents SCADA system components.
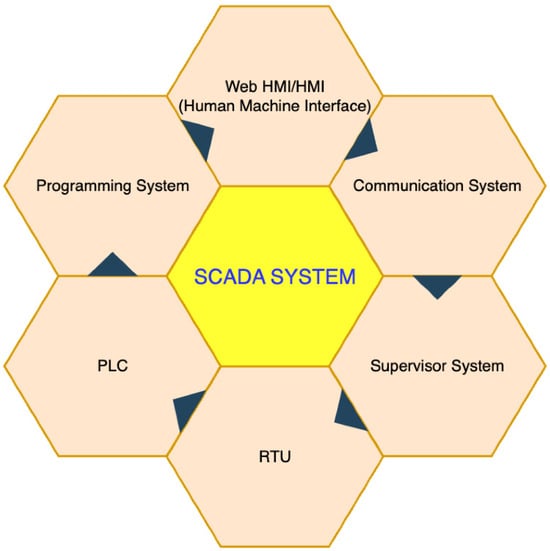
Figure 8.
SCADA system components [89].
Level 0 devices (blue) are field sensors attached to the drill (inclinometers, encoders, etc.). These feed data to the Level 1 control units: a PLC and remote terminal units (RTUs) underground that handle real-time control logic. The PLC then communicates to a Level 2 supervisory computer (green, local server) stationed on surface or in a nearby control station. Data is also mirrored to a Level 3 coordinating computer or cloud server (purple) for data logging and advanced analytics. Level 4 central server (red) finally consolidates the information and provides the interface to the human operators (central SCADA HMI). In the study gold mine, Level 2 and Level 3 were combined on a single ruggedised local server, and the central SCADA PC acted as Level 4.
The control logic programmed into the PLC was straightforward but critical. Threshold values were defined based on what was considered acceptable deviation before intervention:
- Angle threshold—±0.8° from planned angle. If the IMU reading deviated more than 0.8° from the target angle (e.g., if target is 65°, reading goes below 64.2° or above 65.8°), it triggered an alert. If deviation exceeded ±1.0°, it would initiate an automatic pause in drilling. The rationale was that 1° deviation can be significant over long holes, as discussed.
- Depth threshold—0.1 m short of planned depth. The PLC continuously compared the encoder count to the target depth (e.g., 20.0 m). If the drill hit target depth, it would automatically stop the feed motor (to avoid over-drilling). If the drill was withdrawn prematurely (e.g., hitting void or broken through), or if the depth was short by more than 0.1 m while supposed to be at full length, it flagged an incomplete hole.
- Positional (spacing) threshold—±0.1 m from planned spacing (1.0 m). The LiDAR sensor was used at setup—before drilling each hole, the crew would position the rig and then press a ‘confirm position’ button on the HMI. The PLC would record the LiDAR distance to a reflector placed at the previous hole collar. If this measured spacing was outside 0.9–1.1 m, a warning would display indicating misposition. This was a soft alert; the study did not automate any machine action for position, as repositioning requires manual adjustment.
In addition to these, the study included safety interlocks: e.g., if a sensor malfunctions (no signal), the system defaults to not stopping the drill (to avoid unnecessary downtime), but it flashes a warning to the operator that monitoring is compromised (so they can be extra cautious manually). A manual override was also available—the driller could bypass the automatic stop if needed (as an example, if a sensor was known to be giving a false reading, this override was logged).
To actuate drill stopping, the study interfaced the PLC with the drill’s electrical control—essentially, the PLC can cut off power to the electric motor of the drill (or pneumatic supply in case of an air drill) via a relay. For angle deviation, rather than an immediate hard stop, which could jar the rig, the system first gave a visual/audio alert on the HMI and a light signal to the driller. If the driller did not correct the alignment within a short window (a few seconds) and the deviation worsened past the cutoff (1°), then the PLC would halt the drill feed. This approach was chosen to allow the operator a chance to correct gently.
The HMI on the monitor was designed with simplicity: three indicator lights (green for ‘within threshold’, red for ‘deviation exceeded’) for the three parameters (angle, depth, position), as well as a live display of numeric values (angle in degrees, depth in meters). Figure 9 shows a snapshot of the SCADA drill monitoring interface. In this example, the drill angle sensor indicator is red (meaning the angle threshold is exceeded, triggering a stop), whereas other parameters can be green if okay. The interface also had start/stop controls for the drill that the operator could use, and a ‘reset’ button to acknowledge alarms and resume after correction.
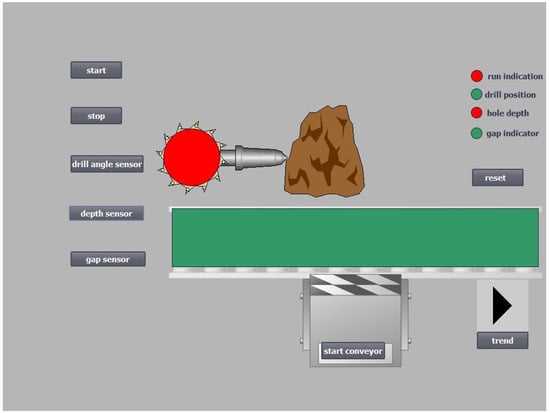
Figure 9.
SCADA HMI screen showing automated monitoring of drilling parameters.
In the illustrative scenario shown in Figure 9, the drill angle sensor has triggered a red alarm (indicating the drill’s angle deviated beyond the allowable range, causing an automatic stop of the drilling machine). The depth sensor and gap (positional) sensor indicators are green, meaning those parameters are within acceptable limits. The left side has controls (start/stop buttons for the drill) that interlock with the SCADA system. The operator must realign the drill (to turn the angle indicator green) and then hit ‘reset’ to allow drilling to continue. This immediate feedback loop ensures drilling does not proceed under out-of-spec conditions.
The SCADA HMI status after correcting the drill alignment is shown in Figure 10. In Figure 10, the drill angle indicator is green (proper alignment achieved), and all monitored parameters are within thresholds (run indication is green). The drilling operation can continue normally. This interface allowed operators to quickly see any deviation (via red/green signals) and respond by pausing and resuming the machine autonomously once conditions were back within limits.
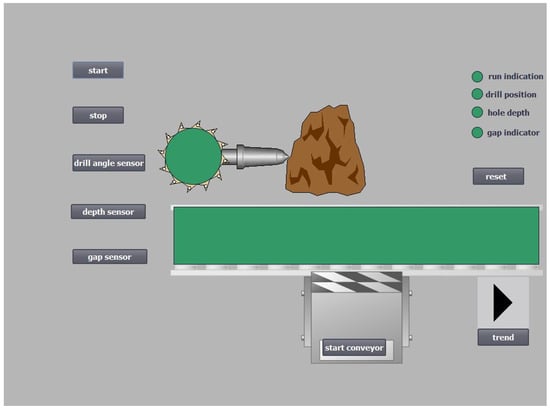
Figure 10.
SCADA HMI status after correcting drill alignment.
Beyond the real-time control, the SCADA system also logged data for analysis. The study configured it to record each hole’s final metrics: actual angle, depth, drilling time, etc. It also kept a timestamped log of any alarm events (e.g., ‘Hole 3, Ring 2: angle deviation alarm at 10:35:20, auto-stop engaged for 15 s’). This historical data was critical for post-run analysis to quantify improvements.
The methodology adopted for the study combined engineering design with field experimentation and comparative analysis. The ultimate measure of success was whether the SCADA system led to measurably improved drilling accuracy and reduced dilution without unacceptable impacts on productivity. Section 4 presents the results of this implementation, including quantitative data and observations from the trial.
3.2. Geological Consistency Across Trial Stopes
While perfect homogeneity in underground conditions cannot be assumed, the three selected stopes, 12L, 14L, and 15L, were located within the same production block of the mine, sharing similar lithostratigraphic settings (i.e., Archean greenstone sequences and quartz-carbonate vein-hosted mineralisation). They were drilled within comparable geological structures, with no major lithological or structural discontinuities noted across them during geological mapping. Cavity Monitoring System scans and production records showed comparable pre-trial ELOS and dilution patterns, supporting initial equivalence. As such, any significant improvements in drilling precision, stope wall stability, and dilution reduction observed post-SCADA implementation can be robustly attributed to the control system, rather than underlying geological variation. This approach aligns with established field validation practices in applied mining research.
4. Results
4.1. Baseline Manual Monitoring Results
Before examining the SCADA system’s performance, the baseline results obtained under manual monitoring for the study stopes (12L, 14L, 15L) are presented. These results confirm the extent of the drilling inaccuracies and dilution issues that motivated the need for a new system.
Manual drilling deviations—under manual procedures, each of the three stopes showed notable deviations as measured and recorded in the baseline data collection. Table 1 (in Methodology) shows the data for one ring in stope 15L. Table 3 and Table 4 summarise the average deviations per stope (aggregating multiple rings and holes) before SCADA implementation, for stopes 12L and 14L, respectively. These values are the means of all measured holes in each stope.
Table 3.
Manual drilling accuracy and deviations in Stope 12L (baseline, pre-SCADA). A total of 5 rings (30 holes) measured.
Table 4.
Manual drilling accuracy and deviations in Stope 14L (baseline, pre-SCADA). 6 rings (36 holes) measured.
Observation—in 12L, holes tended to be drilled slightly steeper than planned on average, and about 1.1 m shorter than planned (possibly due to caution in not drilling into waste or hitting backfill). Positional error of 0.3 m indicates marking/aiming issues.
In 14L, the average angle deviation was larger (about 1.6°). This stope had some of the worst initial drilling accuracy, with certain rings showing holes 2–3° off (e.g., one ring had a hole planned at 72° but drilled at about 75°). The length deviations were around 0.8 m short on average, and positional deviations of about 0.25 m.
From these baseline tables and similar data for 15L (which were around 1.0° angle deviation, 1.0 m length deviation, and 0.4 m position deviation), it is clear that the manual approach often exceeded recommended thresholds. Note that there exist no stated industrial thresholds for the length, angular and positional deviations. The limits were approximated based on the underground mining conditions, type of rock and the type of equipment being used. The industry threshold mentioned earlier (3% of length ≈ 0.6 m for 20 m holes, and approximately 1° angle) was not consistently met. In particular, Stope 14L’s 1.6° mean error is quite significant—for a 20 m hole, a 1.6° angular error translates to about 0.56 m lateral deviation at the toe of the hole. This can cause holes to break out into waste or leave ore unbroken in places that then require secondary blasting (or remain as ore loss).
Visual evidence of issues—During the baseline period, photos and measurements of hanging wall conditions were captured. In stope 12L, after a blast of rings drilled with manual monitoring, a substantial hanging wall collapse was observed. Figure 11 shows a photograph of a hanging wall collapse that occurred in 12L (prior to SCADA). The collapse involved a slab of rock peeling off the hanging wall, dumping several tonnes of waste rock into the stope. This was attributed to holes that had deviated upward towards the hanging wall, causing over-break. Such collapses introduce a large amount of waste dilution and pose safety hazards. They were noted in the mine’s long-hole stopes prior to implementing the SCADA system.

Figure 11.
Example of hanging wall collapse in a manually monitored stope (The mine 12L).
The frequency of such events was noted: in the quarter before SCADA trials, 12L had two major collapses, 14L had one, and 15L had one. Each collapse corresponded to a spike in dilution recorded (e.g., one week 15L showed 27% dilution vs. a typical of about 22% when no collapse).
Dilution levels (pre-SCADA)—Using production data, it was determined that the average dilution in these stopes was approximately 25% as earlier stated. In the month prior to SCADA, 12L had 23% dilution, 14L had 26%, 15L had 25% (these varied week to week). These numbers align with management’s concern of approximately 25% average dilution.
The baseline results confirmed: (1) manual drilling was resulting in measurable inaccuracies; (2) those inaccuracies contributed to wall instability and high dilution; and (3) there was ample scope for improvement by more stringent monitoring and control.
4.2. SCADA System Performance and Drilling Accuracy Results
After deploying the SCADA-based monitoring system, a dramatic improvement in drilling accuracy was observed. The system’s real-time feedback and automated controls effectively kept the drilling parameters within the desired tolerances for the vast majority of holes. Table 5 presents the data comparing pre- and post-implementation results.
Table 5.
Drilling deviations per stope with SCADA real-time monitoring (post-implementation).
Reduction in drilling deviations—Table 5 shows the average deviations per stope after SCADA monitoring was implemented, analogous to Table 3 and Table 4 for baseline. Data from multiple rings across the stopes (at least 3 rings in each stope with SCADA during the trial, were monitored) were combined.
Comparing these with baseline values, stope 14L improved from 1.6° average angle error to just 0.2°. Stope 15L improved from approximately 1.0° to 0.3°, and 12L from 0.8° to 0.3°. These are significant improvements. All three are now well below 1°, meeting recommended best practice. Length deviations shrank to just a few centimetres. It is practically notable that the SCADA system ensured that holes were drilled to full design depth (as the depth sensor would cut off at target, preventing under-drilling). The slight remaining 0.05–0.08 m shortfall on average can be due to some design rounding or machine inertia (the drill can stop a fraction shy when commanded). Less than 10 cm is negligible in practice (0.5% of a 20 m hole).
Positional deviations reduced to approximately 5 cm. This indicates the rig positioning with the help of the LiDAR feedback was extremely accurate. Marking error was virtually eliminated—the operator would adjust until the LiDAR said within 5 cm, which typically corresponded to aligning exactly on the paint mark (if any slight mismark was corrected by the sensor).
To illustrate the improved consistency, Figure 12 and Figure 13 present the deviation data distribution for stopes (15L, 14L and 12L) before and after.
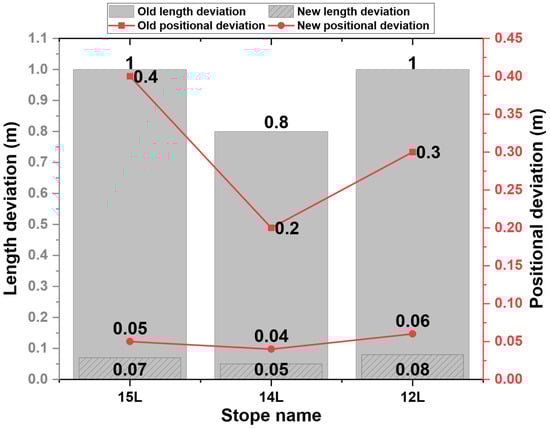
Figure 12.
Comparison of average drilling deviations before and after SCADA implementation in stopes 15L, 14L and 12L.
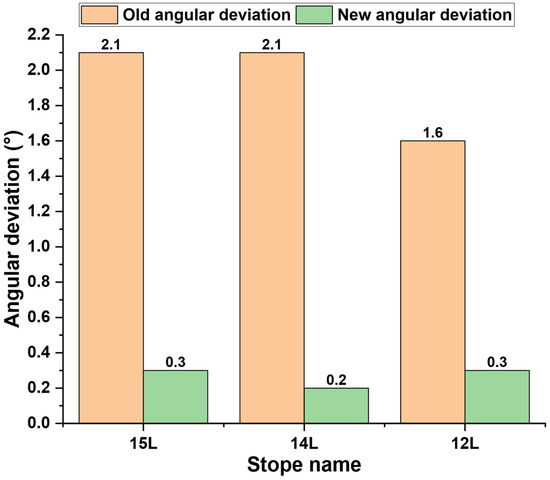
Figure 13.
Comparison of angular deviations across monitored stopes, before vs. after SCADA system.
The reduction is clearly evident—angle and position deviations are cut by about 70–85%, and length deviation by over 90%. The variability is also much lower, indicating more consistent drilling outcomes.
Figure 13 highlights how the SCADA monitoring achieved substantially tighter control of drilling angle.
System alerts and interventions—During the trial, the SCADA system’s automatic controls were invoked multiple times. Across all monitored holes (nearly 100 holes in total among the stopes), the angle deviation alert triggered in about 15 holes (15% of holes). In most cases, the driller corrected the alignment as soon as they saw the indicator go red, within a few seconds. The automatic power cut actually activated in 5 holes where the deviation exceeded 1° for too long—each time it stopped the drill, the operator realigned and resumed. This confirms that without SCADA, at least those 15 holes would likely have been off-target (and indeed a similar fraction in baseline being off was observed). The SCADA prevented them from continuing off-course. For depth, the auto-stop at target depth engaged on virtually all holes (as intended)—over-drilling was entirely avoided, and similarly ensured no hole was under-drilled since the operator saw when it reached depth (if a hole ended early due to a void, an alert was gotten—but that did not happen in the trial). For position, about 10% of initial setups had to be adjusted after LiDAR measurement (e.g., an operator might set up 15 cm off if eyeballing, but then correct it once the sensor showed a discrepancy).
Impact on stope stability—The most tangible outcome of improved drilling accuracy was observed in the condition of the hanging walls after blasting. In the rings that were drilled under SCADA monitoring, no major hanging wall collapses occurred. Minor scaling (small rocks) still occurred, which is normal, but we did not see the large slab failures that had been common. In stope 12L, for example, three rings were blasted after being drilled with SCADA. None of those blasts caused a significant over-break. Figure 14 shows a photo of stope 12L’s hanging wall after SCADA-implemented drilling and blasting. It remained largely intact, with only slight indentations where expected.
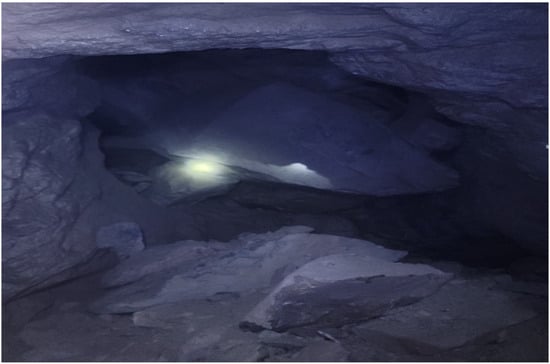
Figure 14.
Hanging wall condition after implementing SCADA monitoring (The mine 12L post-SCADA).
Figure 14 shows the hanging wall of the stope remaining in place with minimal damage after blasting a ring of holes drilled under the SCADA system’s guidance. Compared to Figure 11 (pre-SCADA collapse), the wall here shows only superficial scaling. The brighter areas are freshly exposed rock, but the overall wall profile is as per design, indicating that over-break and dilution were minimised. In stope 15L and 14L, similar observations were made. There is thus qualitative evidence that by maintaining proper drilling alignment, the triggers for wall instability were reduced.
ELOS (Equivalent Linear Over-break) for before/after SCADA were also quantitatively estimated. While precise surveying was limited, the mine’s end-of-stope notes indicated that over-break volumes dropped by around 50% after SCADA introduction. 15L, as an example, had an estimated 8 m3 of over-break in a particular blast pre-SCADA, versus approximately 2 m3 in a comparable blast post-SCADA (numbers from cavity monitoring scans). So ELOS values decreased accordingly (e.g., from 0.2 m to 0.05 m in that case—which aligns with the visual retention of the wall).
Overall comment on the correlation between ‘reduced drilling deviations’ and ‘improved hanging-wall stability’—While the study does not present a fixed mathematical correlation between angular deviation and ELOS due to the complex, non-linear nature of rock mass behaviour, field data from the study stopes does reveal a strong empirical relationship. In Stope 15L, for example, average angular deviation was reduced from 1.0° to 0.3° post-SCADA, accompanied by a drop in ELOS from 0.20 m to 0.05 m (Table 5). This suggests that a 0.1° reduction in angular deviation within the critical 0.3–1.0° range corresponds to approximately a 0.02–0.025 m reduction in ELOS, on average. However, local geological variability (e.g., joint orientation, RMR) makes a linear function unsuitable. Instead, ELOS exhibits a threshold response: when angular deviations exceed 0.8°, overbreak and collapses become significantly more likely. Thus, maintaining deviations within ±0.3° materially enhances stope wall integrity. This field-derived observation has practical relevance and justifies the ±1.0° auto-stop logic implemented in the SCADA system.
4.3. Reduction in Ore Dilution and Improved Production Metrics
The ultimate goal of reducing drilling error and wall collapse is to lower the ore dilution percentage. The weekly ore and waste tonnages in the stopes during the trial were tracked and compared to prior performance. Table 6 shows a representative excerpt of four weeks in stope 15L (the period covering SCADA implementation).
Table 6.
Weekly ore production vs. waste and resulting dilution percentage in Stope 15L, before vs. after SCADA implementation.
Note that the ‘Pre-SCADA’ data are illustrative of normal variability—around 20–22% on average, with one week at 19%. The ‘Post-SCADA’ is showing a consistent 16–17%. The trend is clear—dilution dropped from roughly one-fifth of the tonnage to about one-sixth. In percentage terms, an average of 21% dilution went down to 16%. That is a 5-percentage-point reduction in dilution. This improvement was consistent week over week during the trial, suggesting that it was not a one-off fluke. Stope 12L and 14L showed similar drops. Aggregating across all monitored stopes, the average dilution after SCADA was about 18% (some stopes still had slight issues), versus 25% before. In monetary terms, this difference is enormous for the mine’s bottom line (as will be discussed in the economic analysis of this paper). To double-check the improvement, the gold grades of ore sent to the mill were also observed. The average mill feed grade indeed rose after the changes—e.g., the mine’s mill feed grade increased from 1.90 g/t to 2.25 g/t in the month after SCADA implementation, which is consistent with less waste in the ore. It is worth noting that some of the improvement may also come from increased operator diligence/awareness due to the project—a sort of Hawthorne effect—but given the automated nature of corrections, most of the improvement is attributed to the SCADA controls.
Production throughput—Interestingly, despite the drill stopping occasionally for corrections, there was no negative impact on production speed. In fact, because fewer holes had to be re-drilled or dealt with misfires and fewer support interventions for collapses, the net productivity slightly increased. With SCADA, the average drilling time per hole was found to have remained roughly the same (30 min per 20 m hole, including setup). The time lost to alignment adjustments was negligible (seconds per hole), and offset by time saved not having to do as many post-drilling corrections or dealing with collapse clean-ups. The technology, therefore, improved quality without sacrificing efficiency.
4.4. Additional Observations
Operator feedback—The drilling crew, initially sceptical about a system ‘watching over’ them, grew appreciative of the tool. In discussions post-trial, operators mentioned that the visual feedback was like a ‘guiding hand’—some mentioned that it gave them more confidence that they were drilling correctly, and they did not have to second-guess as much. One driller commented that after using it, they realised how often they would have been off slightly if not corrected. There was also a safety aspect—by reducing collapses, operators felt safer working in those stopes after blasts.
Maintenance and reliability—The SCADA system largely ran without issue throughout the trial. A few minor technical issues were that one IMU had to be recalibrated after being bumped, and one LiDAR occasionally had difficulty if there was heavy dust (this was mitigated by cleaning the lens and eventually housing it in an air-purged enclosure). No sensor failures occurred. The PLC and network had 100% uptime during active shifts. This indicates that such technology is robust enough for the mining environment, with proper protective measures. The study also discovered an extra benefit—the vibration sensor (accelerometer) which was installed, provided data on the bit condition. Though not part of the primary objectives, it recorded vibration patterns—it was noticed that when the drill bit was dull, the vibration spectrum changed (more high-frequency content). This suggests potential for predictive maintenance—an area of future exploration for the mine (IoT/SCADA could foreseeably also optimise drilling by telling when to change bits, etc.).
Data logging and analysis—The historical data collected opens new possibilities. The mine’s engineering team can now analyse where deviations tend to start (e.g., certain angles may be harder to hold, or certain drilling crews may need more training—though the study did not specifically identify differences between crews in the trial, one could do so over a longer period). It also sets the stage for scaling the system to the entire mine. The mine management could consider extending the SCADA monitoring to all long-hole rigs and even look at other processes (like backfill monitoring).
The results from the study have shown that introducing a SCADA-based real-time monitoring and control system for long-hole drilling at the mine led to substantial improvements: drilling was executed almost exactly as planned, leading to significantly reduced unplanned dilution (from 25% to 15–18% range). Hanging wall stability improved, and large collapses were eliminated in monitored stopes, improving both safety and ore quality. The mining operation was able to hoist more gold-bearing ore and less waste, directly increasing metallurgical recovery and revenue. These technical benefits are quantified in the Section 5, where the economic implications and overall impact of the system are examined.
5. Discussion
The implementation of the SCADA-driven drilling monitoring system at the mine has yielded clear technical benefits, as evidenced by the results of the study. This discussion interprets these findings in a broader context, examining why the system was effective, what the implications are for mining operations, limitations, and how these results align with or diverge from what is reported in the literature. The discussion also presents the economic ramifications and provides recommendations for further improvement and adoption.
5.1. Interpretation of Results and Mechanisms of Improvement
The dramatic reduction in drilling deviations (angular, depth, and positional) can be directly attributed to the continuous feedback and automatic control that the SCADA system provided. In the manual scenario, an error in alignment could persist throughout the drilling of a 20 m hole, only to be discovered after the fact (if at all). With SCADA, that error is detected and corrected typically within seconds. The system acted as an ever-vigilant supervisor with precision beyond human ability—with automated monitoring, machines excel at maintaining consistency and identifying subtle errors humans might miss. An interesting point is that the variability of performance also decreased (as seen in the narrower standard deviations post-SCADA). This consistency is crucial in mining; it makes outcomes more predictable, which improves planning and reduces the need for contingencies. As an example, if normally a certain percentage of rings would suffer major over-break, the mine can leave bigger pillars or install extra support, which affects economics. With improved consistency, designs can be optimised (smaller pillars can be left, knowing walls will hold as expected, while reliable drilling reduces support requirements).
The elimination of large hanging wall collapses in the monitored stopes underscores the link between drilling accuracy and geotechnical stability. Misaligned or unevenly spaced holes caused stress concentrations and irregular burden on the hanging wall. Drilling accuracy is a key aspect of ground control. The blasts were more uniformly distributed and effectively confined to the ore by achieving near-perfect alignment (within 0.2–0.3°), reducing shock to the walls. This corresponds well with the expected outcome that reducing drilling error can significantly reduce unplanned dilution and wall damage. From a dilution control perspective, the results from the study validate that real-time monitoring can tackle one of the root causes of unplanned dilution. Several authors (Elbrond, 1994 [17]; Scoble and Moss, 1994 [8]) have noted that ‘poor drilling leads to over-break, which leads to dilution’. Our quantitative case study shows that by fixing the drilling part, a drop in dilution (from 25% to 16%) is witnessed. This aligns with the concept of drill-to-mill optimisation, where better upstream control (drilling and blasting) yields downstream benefits (milling higher grade ore). Significant dilution came from poor drilling; the improvement of roughly one-third to one-quarter reduction in dilution in our study suggests that at least that fraction of dilution was due to drilling issues that are now mitigated. There can remain some dilution from other causes (e.g., inherent ore geometry requiring some waste, or minor fill issues), which is why our study did not drop dilution to zero (nor would that be realistic). The positive behavioural impact on the crew should also be noted—the presence of SCADA likely promoted more careful setup, knowing that any mistake would be immediately visible. This change in work culture is often mentioned in the literature on automation, and it can reinforce best practices. The discussion with the operators indicated that initial resistance gave way to trust in the system; it effectively became part of their routine.
5.1.1. Economic Implications
The reduction in dilution from 25% to 16% is economically significant. In gold mining, every tonne of waste erroneously processed incurs cost without revenue and displaces a tonne of ore that could have been processed. At the mine, prior to improvements, roughly 1 in 4 tonnes hoisted was waste. After improvements, it is about 1 in 6. This means more capacity for actual ore, directly boosting gold output. For a rough estimate, suppose the mine hoists 100,000 tonnes of ore per month at 25% dilution, that is 75,000 t ore and 25,000 t waste. If dilution is cut to 16%, and if total material moved remains similar, it becomes 84,000 t ore and 16,000 t waste. An extra 9000 t of ore is processed. If the ore grade is 2 g/t and recovery 90%, that is an extra 518 ounces of gold recovered in a month (9000 t * 2 g/t = 18,000 g, at 90% recovery, this translates to 16,200 g, which is 521 ozt). At a gold price of say $1800/oz (very conservative estimate), that is $0.94 million additional revenue in one month. Even if these numbers are somewhat off, they illustrate that the value of saved ore is enormous. Against that, what did the system cost? Table 7 compiles the costs incurred or estimated for rolling out SCADA to six stopes (the entire top section of the mine). This includes sensors (IMUs, LiDARs, encoders, PLCs) for multiple rigs, network infrastructure (fibre, wireless APs), servers, backup power, and initial software licensing and training.
Table 7.
SCADA System implementation cost breakdown for six stopes (approximate, in USD).
These costs (just under $1M in our breakdown) might seem high, but when weighed against savings—e.g., possibly on the order of $4M per year in recovered revenue as per earlier estimation—the payback is very quick. That implies the SCADA system could pay for itself in a matter of a few months. The exact ROI at the mine, considering gold price and actual tonnage, was quite favourable. The adoption of new technologies in the mining industry is encouraged to improve efficiency. One noted barrier to the adoption is the capital cost (Chilunjika, 2024 [75]). However, our case demonstrates that for a mid-size operation, the capital is justified by operational savings. Benefits outweigh costs for real-time systems when safety/productivity improvements are accounted for. The study indirectly increases the life of the mine by reducing dilution. Less waste means the finite processing capacity can treat more ore over time. The mine can extend its reserves’ viability since previously ‘lost’ gold in dilution is now recovered. This can improve the net present value (NPV) of the operation. High dilution can threaten project feasibility, whereas controlling it enhances NPV. There are also cost savings from avoided ground falls—each collapse that was prevented saved on cleanup time, secondary support, and potential production delays. Not to mention avoiding the potential for injuries or equipment damage, which can have severe financial and legal ramifications.
5.1.2. Broader Implications for Industry and Future Work
The success at the mine shows that similar SCADA or digital monitoring systems can be beneficial in other underground mining operations, especially those employing long-hole stoping or similar methods where drilling accuracy is paramount. Mines that suffer from chronic dilution or wall stability issues should consider real-time monitoring as a viable solution. It essentially acts as a quality assurance system in the drilling process, much like automation in manufacturing ensures product tolerances. Some considerations and limitations should, however, be acknowledged:
- Initial setup and calibration—The study was successful in a relatively controlled case. Other mines can have more challenging conditions (e.g., extreme temperatures, presence of water, more electromagnetic interference) that could affect sensors. Robustness of equipment must be ensured for each context. In our case study, minimal protective adjustments (like housing LiDAR against dust) were made. In more difficult environments, additional engineering may be needed (e.g., explosion-proof casings in coal mines, etc.).
- Reliance on technology—Over-reliance on sensors could be an issue if not managed. If the system fails, operators need to know how to revert to manual without losing performance. The mine plans to implement standard operating procedures for fallback (in the trial, no major failures occurred, but one should always be prepared). Also, sensor malfunctions could potentially give false security (e.g., if a sensor drifts out of calibration without notice). Regular maintenance and calibration are thus crucial, which is budgeted for.
- Training and change management—The human factor cannot be ignored. It was fortunate that after demonstration, operator buy-in was achieved in this study. In some cases, the workforce may resist new tech or misuse it. Ongoing training (as included in our study) and engaging operators in the improvement process help. In this study, operators eventually felt empowered by the tool rather than threatened, which is the ideal outcome.
- Data utilisation—The wealth of data from SCADA opens possibilities for continuous improvement. Analysis of drilling performance, for example, can lead to better blast designs or identify if certain patterns correlate with slight remaining dilution—enabling a feedback loop into mine planning. This data can be used to refine drilling patterns (customising burden where minor differences in geology require it).
- Integration with other systems—The system could integrate with a mine’s broader IoT or digital platform. Giving as an example, linking drilling data with geological models—if a sensor notices a void or change in drilling resistance (via vibration or penetration rate), it could tag geologists that maybe they hit a weaker zone, etc. Also, integration with explosive charging units (future idea: ensure the charging is adjusted if a hole deviates—but since now deviations are tiny, that is less of an issue).
- Scalability—The study was only implemented on a few stopes; scaling to all stopes means more equipment and centralised monitoring of multiple sections. The mine can consider a central control room where one technician can watch all stope monitors. This centralisation is part of what modern SCADA enables—fewer eyes underground, more oversight at a control centre, improving safety. Networks must, however, be robust (latency must remain low as scale grows).
- Other mining methods—While the study was applied to sublevel stoping, the concept can be adapted to other methods—e.g., in longwall coal mining, shearer positions. The case study adds to the evidence that underground mines can indeed adopt high-precision monitoring despite more challenging conditions.
Our detailed documentation can serve as a reference for other mines—encouraging more local mines in Zimbabwe to invest in digital solutions. This aligns with the push for ‘Mining 4.0’ or the modernisation of mining operations to be data-driven and automated.
5.1.3. Further Research
From a research perspective, one might want to examine how closely dilution correlates with measured deviations. This study linked them, but a more rigorous analysis (regression between angle error and observed over-break volume, for instance) could yield interesting insights into tolerance thresholds. The threshold of 1° was somewhat empirically chosen; future research could refine the optimal threshold (1° may be conservative, and 1.5° could still be okay in certain conditions—though given the success of the study, it is advised to stick to tight control). This research project paves the way for exploring automation in actual drilling operations—not just monitoring. With reliable sensors and PLC control, one could envision semi-autonomous drilling rigs that adjust themselves in real-time without operator input. In the case study, the operator still manually corrected alignment upon alert. Fully automated rigs could use servo motors to adjust alignment as they drill (a more complex endeavour, but feasible in the future). That would further reduce reliance on human skill and allow one operator to oversee multiple rigs remotely.
5.1.4. Safety and Other Benefits
While the primary goals of the study were dilution and economics, it is worth highlighting the safety improvement: by preventing collapses, miners are protected. Ground falls cause injuries in underground mines. Reducing hanging wall failures directly reduces risk of rockfall injuries. Having operators less often in the stope (because less rework or support installation are needed post-blast) means less exposure. There is also an environmental aspect—better ore quality means less rock needs to be milled and processed for the same gold output, which can reduce energy consumption and tailings generation per ounce of gold. That improves the sustainability footprint of the operation. The success of this project demonstrates that even at a mine that might not be considered ‘high-tech’ initially (the mine is a long-running operation in Zimbabwe), implementing advanced control systems is practical and beneficial. This can encourage other operations in the region to embrace modern mining technology—aligning with global trends.
6. Conclusions
The study successfully demonstrated that a real-time SCADA-based monitoring and control system for long-hole drilling can substantially reduce ore dilution and improve operational outcomes in underground mining. At the case study mine, the implementation of this system led to improved drilling accuracy (angle deviations reduced from 1–2° to 0.2–0.3°) and a significant decrease in unplanned dilution (from approximately 25% down to 15–18%). Hanging wall stability in stopes was markedly improved, with the elimination of major wall collapses during the trial period. The mine’s gold production efficiency rose as a result of higher ore grades being delivered to the mill, validating the economic viability of the technology—the investment in the SCADA system is expected to pay for itself within a few months through increased gold recovery and reduced waste handling costs. These outcomes confirm the central hypothesis that drilling inaccuracy is a key driver of dilution and that addressing it through real-time feedback yields tangible benefits. The study also shows that modern digital tools can be integrated into traditional mining environments effectively. The SCADA system provided a safer, more controlled, and data-rich means of operating, and it represents a step towards smarter mining practices at the mine (and potentially similar mines). This case study contributes to the growing body of evidence that embracing automation and precision monitoring (the principles of Mining 4.0) can solve longstanding mining challenges such as dilution, which directly impact profitability and sustainability. The introduction of the SCADA long-hole drilling monitoring system achieved its aims: it reduced dilution, improved ore recovery, enhanced wall stability, and laid groundwork for further technological advancements at the mine. The close agreement of the practical results with predictions and literature suggests that other mines with dilution issues can reap similar rewards by adopting such systems. Building on the success of this project, the following recommendations are given for the mine and the broader mining community:
Mine-wide deployment—It is recommended that the mine extend the SCADA monitoring system to all long-hole drilling operations in the mine. The trial was limited to a few stopes; rolling it out mine-wide can exponentially increase the benefits. This includes equipping all production drill rigs with the necessary sensors and linking them to a central monitoring hub. The cost–benefit analysis indicates a strong economic incentive to do so. Other sections (e.g., development drilling or even open pit drills at the mine’s surface operations) can also benefit from similar monitoring adaptations.
Maintain and calibrate the system regularly—To ensure continued performance, a routine maintenance and calibration schedule should be instituted. Sensors (IMUs, encoders, LiDAR) should be recalibrated on a defined schedule (e.g., monthly or quarterly) and checked after any incidents. Spare sensors and parts should be kept in inventory to avoid downtime in case of failures. The reliability of the system is key to sustaining operator trust and operational gains.
Integrate data into decision making—The mine should make full use of the data collected by the SCADA system. This entails training technical staff (engineers, geologists) to analyse trends and incorporate findings into mine planning. If certain areas still show slightly higher deviation or require frequent adjustments, investigate if there is an underlying cause (equipment or ground condition) that can be addressed. The mine should also monitor dilution and stability metrics over time; if dilution starts creeping up, analyse whether it is due to complacency, calibration drift, or other issues and act accordingly. It is important to adopt a continuous improvement approach using SCADA data.
Enhance blasting and support strategies in tandem—With drilling accuracy now under control, it is recommended to revisit blasting designs and support strategies to ensure they are optimised for the new level of precision. Smoother wall blasts can be possible (reducing powder factor on perimeter holes because now they are correctly positioned) to further minimise wall damage. Support (like cable bolting patterns) can be reduced or at least targeted more effectively now that wall behaviour is more predictable. Any such changes should be trialled carefully, but the improved consistency provides an opportunity to refine these auxiliary processes.
Expand automation (consider auto-alignment and remote operation)—As a forward-looking recommendation, the mine and similar operations should explore further automation based on this system. One possibility is to implement auto-alignment mechanisms on drill rigs whereby the SCADA feedback not only alerts the operator but actively drives hydraulic jacks or positioning servos to maintain alignment. This could reduce dependence on operator reaction time and skill. The mine can also experiment with remote drilling—since data and controls are networked, an operator can control a drill from a safe, central control room, which improves safety and can increase productivity (one operator overseeing multiple drills in different stopes sequentially). Achieving this would require additional investment and careful change management, but the results from the practical case study have built the foundation where such advanced use cases become feasible.
Share knowledge and train workforce—It is recommended to continue training programs for the workforce on the new technology. As new miners or engineers join, they should be educated on SCADA system operation and its importance. The mine’s management can consider sharing its success story within industry forums (e.g., at the Southern African Institute of Mining and Metallurgy (SAIMM) conferences or publications), as it adds to industry knowledge on dilution control. This can help other mines justify similar improvements and collectively raise the standard of mining practices.
Monitor for any unintended consequences—While the study observed mostly positive outcomes, the mine should keep an eye on any potential unintended effects. As an example, does the focus on drilling perfection cause any slow-down in overall cycle time? (our data says no significant slow-down, but vigilance is good.) Are there any instances of false alarms causing unnecessary stops? If so, fine-tune the system parameters or sensor filters to balance sensitivity and specificity. It is vitally important to keep optimising the system settings based on operational feedback.
Consider other real-time monitoring applications—The success of this real-time monitoring project should encourage the mine to identify other areas where SCADA or IoT monitoring can be beneficial. Real-time drawpoint monitoring (using smart markers or load cells to measure draw and avoid dilution from mucking waste), or equipment health monitoring for preventive maintenance (vibration sensors on hoists or pumps), etc. Installing stress or deformation sensors in strategic pillars that feed into SCADA to warn of potential failures in ground control is also useful. The mine can leverage the momentum and infrastructure (network and servers) from this research project to deploy a broader ‘digital mine’ strategy.
This project has not only solved a pressing operational problem (excess dilution) but also demonstrated a replicable model of how embracing digital monitoring can modernise conventional mining processes. The mine can maintain and amplify the gains achieved by following the recommendations given in this study. Other mines facing similar dilution and control issues are strongly encouraged to consider implementing real-time monitoring systems tailored to their operations. The evidence is clear that the combination of SCADA technology with sound mining engineering can lead to safer, more productive, and more profitable mining—a win-win for mining companies, workers, and stakeholders alike.
Overall conclusion—The use of a real-time SCADA-based monitoring and control system for long-hole drilling has greatly decreased ore dilution while improving operational outcomes in underground mining. Drilling accuracy improved, with angle deviations reducing from 1–2° to 0.2–0.3°, and unplanned dilution dropped from 25% to 15–18%. Higher ore grades resulted in increased gold production efficiency. The SCADA system proved to be economically viable, with a payback projected within months. The study also reveals the efficiency of modern digital technologies in mining operations, proving that automation and precise monitoring can address long-standing mining problems.
Author Contributions
E.G.: Writing—review & editing, Writing—original draft, Visualisation, Methodology, Investigation, Formal analysis, and Conceptualisation. T.Z.: Writing—review & editing, Writing—original draft, Visualisation, Supervision, Methodology, Investigation, Formal analysis, and Conceptualisation. L.N.: Writing—review & editing, Supervision, Methodology, Investigation, and Formal analysis. R.M. (Rejoice Moyo): Writing—review & editing, Supervision, Methodology, Investigation, and Formal analysis. R.M. (Richard Masethe): Writing—review & editing, Methodology, Investigation, and Formal analysis. M.M.: Writing—review & editing, Methodology, Investigation, and Formal analysis. M.O.: Writing—review & editing, Methodology, Investigation, and Formal analysis. All authors have read and agreed to the published version of the manuscript.
Funding
This research received no external funding.
Data Availability Statement
Data available from the corresponding author on request.
Acknowledgments
The outcomes described were made possible by the collaboration between the mine’s engineering team and the project implementation team, as well as the open-mindedness of the drill operators who adapted to the new system. Their contributions to the success of this study are gratefully acknowledged.
Conflicts of Interest
The authors declare no competing interests.
References
- Tatman, C.R. Mining dilution in moderate- to narrow-width deposits. In Underground Mining Methods: Engineering Fundamentals and International Case Studies; Society of Mining, Metallurgy and Exploration: Littleton, CO, USA, 2001; pp. 615–626. [Google Scholar]
- Sotoudeh, F.; Nehring, M.; Kizil, M.; Knights, P. Integrated underground mining and pre-concentration systems; a critical review of technical concepts and developments. Int. J. Min. Reclam. Environ. 2021, 35, 153–182. [Google Scholar]
- Sotoudeh, F.; Nehring, M.; Kizil, M.; Knights, P.; Mousavi, A. A new mathematical programming formulation for production scheduling optimisation of sublevel stoping operations in the presence of pre-concentration systems. Min. Metall. Explor. 2023, 40, 2255–2267. [Google Scholar] [CrossRef]
- Dunwen, L. Sublevel Stoping Mining Method. In The ECPH Encyclopedia of Mining and Metallurgy; Springer Nature: Singapore, 2024; pp. 2079–2081. [Google Scholar]
- Upadhyay, R.K. Mining, Mineral Beneficiation, and Environment. In Geology and Mineral Resources; Springer Nature: Singapore, 2025; pp. 799–858. [Google Scholar]
- Ranganai, R.T. Euler deconvolution and spectral analysis of regional aeromagnetic data from the south-central Zimbabwe Craton: Tectonic implications. Afr. J. Sci. Technol. 2012, 12, 34–50. [Google Scholar]
- Atlas Copco. Mining Methods in Underground Mining; Atlas Copco: Nacka, Sweden, 2007. [Google Scholar]
- Scoble, M.J.; Moss, A. Dilution in underground bulk mining: Implications for production management. Geol. Soc. Lond. Spec. Publ. 1994, 79, 95–108. [Google Scholar]
- Suglo, R.S.; Opoku, S. An assessment of dilution in sublevel caving at Kazansi Mine. Int. J. Min. Miner. Eng. 2012, 4, 1–16. [Google Scholar] [CrossRef]
- Delentas, A.; Benardos, A.; Nomikos, P. Analyzing stability conditions and ore dilution in open stope mining. Minerals 2021, 11, 1404. [Google Scholar] [CrossRef]
- Appianing, E.J.A.; Ben-Awuah, E.; Pourrahimian, Y. Life-of-mine optimization for integrated open stope development and production scheduling using a mixed-integer linear programming framework. Min. Technol. 2023, 132, 106–120. [Google Scholar]
- Chimunhu, P.; Faradonbeh, R.S.; Topal, E.; Asad, M.W.A.; Ajak, A.D. Development of novel hybrid intelligent predictive models for dilution prediction in underground sub-level mining. Min. Metall. Explor. 2024, 41, 2079–2098. [Google Scholar] [CrossRef]
- Anderson, B.; Grebenc, B. Controlling dilution at the Golden Giant mine. In Proceedings of the 12th CIM Mine Operators Conference, Timmins, ON, Canada, 12–16 February 1995. [Google Scholar]
- Henning, J.G. Evaluation of Long-Hole Mine Design Influences on Unplanned Ore Dilution. Doctoral Thesis, McGill University, Montreal, QC, Canada, 2007. [Google Scholar]
- Hughes, R.; Mitri, H.S.; Lecomte, E. Examining the influence of stope strike length on unplanned ore dilution in narrow vein longitudinal mining. In Proceedings of the ARMA US Rock Mechanics/Geomechanics Symposium, Salt Lake City, UT, USA, 27–30 June 2010; ARMA: Eaton, CO, USA, 2010; p. ARMA-10-392. [Google Scholar]
- Chen, T.; Mitri, H.S. October. Unplanned ore dilution control in longhole mining using sill pillars–A case study. In Proceedings of the ISRM Congress, Salzburg, Austria, 9–14 October 2023; ISRM: Lisbon, Portugal, 2023; pp. 409–414. [Google Scholar]
- Elbrond, J. Economic effects of ore losses and rock dilution. CIM Bull. 1994, 87, 131–134. [Google Scholar]
- Diederichs, M.S.; Kaiser, P.K. Rock instability and risk analyses in open stope mine design. Can. Geotech. J. 1996, 33, 431–439. [Google Scholar] [CrossRef]
- Amedjoe, C.G.; Agyeman, J. Assessment of effective factors in performance of an open stope using cavity monitoring system data: A case study. J. Geol. Min. Res. 2015, 7, 19–30. [Google Scholar] [CrossRef]
- Le Roux, P.J.; Stacey, T.R. Value creation in a mine operating with open stoping mining methods. J. S. Afr. Inst. Min. Metall. 2017, 117, 133–142. [Google Scholar][Green Version]
- Jang, H.; Topal, E. Underground stope dilution optimization applying machine learning. In Applications of Artificial Intelligence in Mining and Geotechnical Engineering; Elsevier: Amsterdam, The Netherlands, 2024; pp. 315–323. [Google Scholar][Green Version]
- Mussin, A.; Imashev, A.; Matayev, A.; Abeuov, Y.; Shaike, N.; Kuttybayev, A. Reduction of ore dilution when mining low-thickness ore bodies by means of artificial maintenance of the mined-out area. Min. Miner. Depos. 2023, 17, 35–42. [Google Scholar][Green Version]
- Serdaliyev, Y.; Iskakov, Y.; Amanzholov, D. Selection of the optimal composition and analysis of the detonating characteristics of low-density mixed explosives applied to break thin ore bodies. Min. Miner. Depos. 2023, 17, 53–60. [Google Scholar] [CrossRef]
- Imashev, A.; Mussin, A.; Adoko, A.C. Investigating an Enhanced Contour Blasting Technique Considering Rock Mass Structural Properties. Appl. Sci. 2024, 14, 11461. [Google Scholar] [CrossRef]
- Casale, M.; Dino, G.A.; Oggeri, C. Blasting of Unstable Rock Elements on Steep Slopes. Appl. Sci. 2025, 15, 712. [Google Scholar] [CrossRef]
- Vera-Encarnación, J.K.; Cotrina-Teatino, M.A.; Arango-Retamozo, S.M. An Intelligent Approach to Predicting Dilution, Over-break and Costs in Underground Mining Using Kolmogorov-Arnold Networks. Math. Model. Eng. Probl. 2025, 12, 815–828. [Google Scholar]
- Brady, B.H.; Brown, E.T. Rock Mechanics: For Underground Mining; Springer Science & Business Media: Berlin/Heidelberg, Germany, 2006. [Google Scholar]
- Diakité, O. Ore Dilution in Sublevel Stoping. Master’s Thesis, McGill University, Montreal, QC, Canada, 1998. [Google Scholar]
- Hamrin, H.; Hustrulid, W.; Bullock, R. Underground mining methods and applications. In Underground Mining Methods: Engineering Fundamentals and International Case Studies; Society for Mining, Metallurgy, and Exploration, Inc.: Englewood, CO, USA, 2001; pp. 3–14. [Google Scholar]
- Bamber, A.S. An Integrated Underground Mining and Processing System for Massive Sulphide Ores. Master’s Thesis, University of British Columbia, Vancouver, BC, Canada, 2004. [Google Scholar]
- Bagde, M.N. Ore and backfill dilution in underground hard rock mining. J. Min. Sci. 2021, 57, 995–1005. [Google Scholar] [CrossRef]
- De la Vergne, J. Hard Rock Miner’s Handbook, 1st ed.; McIntosh Redpath Engineering: North Bay, ON, Canada, 2000; 430p, ISBN 0-9687006-0-8. [Google Scholar]
- Whillans, P.T. Mining Dilution and Mineral Losses, An Underground Operator’s Perspective. In Proceedings of the Mining Tech, Santiago, Chile, 29 July 2018. [Google Scholar]
- Konyukh, V. Strategy of automation for underground mining. In Proceedings of the 2007 International Forum on Strategic Technology, Ulaanbaatar, Mongolia, 3–6 October 2007; IEEE: New York, NY, USA, 2007; pp. 615–618. [Google Scholar]
- Wodecki, J.; Stefaniak, P.; Polak, M.; Zimroz, R. Unsupervised anomaly detection for conveyor temperature SCADA data. In Proceedings of the International Conference on Condition Monitoring of Machinery in Non-Stationary Operation, Gliwice, Poland, 12–16 September 2016; Springer International Publishing: Cham, Switzerland, 2016; pp. 361–369. [Google Scholar]
- Wojaczek, A.; Wojaczek, A. Monitoring the environment and machines in underground mine. Zesz. Nauk. Inst. Gospod. Surowcami Miner. Pol. Akad. Nauk. 2017, 99, 57–70. [Google Scholar]
- İlten, E.; Ünsal, M.E. PLC based SCADA system design for instant monitoring and early warning mechanism of toxic gases in underground mines. Mühendislik Bilim. Tasarım Derg. 2024, 12, 64–74. [Google Scholar] [CrossRef]
- Li, J.G.; Zhan, K. Intelligent mining technology for an underground metal mine based on unmanned equipment. Engineering 2018, 4, 381–391. [Google Scholar] [CrossRef]
- Zeng, Q.; Zhu, S.; Li, Z.; Wu, A.; Wang, M.; Su, Y.; Wang, S.; Qu, X.; Feng, M. Research on real-time monitoring and warning technology for multi-parameter underground debris flow. Sustainability 2023, 15, 15006. [Google Scholar] [CrossRef]
- Jiang, Y.; Chen, W.; Zhang, X.; Zhang, X.; Yang, G. Real-time monitoring of underground miners’ status based on mine IoT system. Sensors 2024, 24, 739. [Google Scholar] [CrossRef]
- Anvari, K.; Benndorf, J. Real Time Mining—A Review of Developments Within the Last Decade. Mining 2025, 5, 38. [Google Scholar] [CrossRef]
- Pramanik, J.; Jayanthu, S.; Samal, D.A.K. Applications of IoT framework for underground mine safety: Limitations and solutions. J. Min. Environ. 2024, 15, 923–942. [Google Scholar]
- Onifade, M.; Zvarivadza, T.; Adebisi, J.A. Towards application of positioning systems in the mining industry. Int. J. Min. Miner. Eng. 2024, 15, 15–48. [Google Scholar] [CrossRef]
- Bamber, A.S. Integrated Mining, Pre-Concentration and Waste Disposal Systems for the Increased Sustainability of Hard Rock Metal Mining. Doctoral Thesis, University of British Columbia, Vancouver, BC, Canada, 2008. [Google Scholar]
- Xingwana, L. Monitoring ore loss and dilution for mine-to-mill integration in deep gold mines: A survey-based investigation. J. S. Afr. Inst. Min. Metall. 2016, 116, 149–160. [Google Scholar] [CrossRef][Green Version]
- Hartman, H.L.; Mutmansky, J.M. Introductory Mining Engineering; John Wiley & Sons: Hoboken, NJ, USA, 2002. [Google Scholar][Green Version]
- Napier-Munn, T.; Wills, B.A. Wills’ Mineral Processing Technology; Butterworth-Heinemann Elsevier Ltd.: Oxford, UK, 2005; pp. 246–266. [Google Scholar][Green Version]
- Hoek, E.; Brown, E.T. The Hoek–Brown failure criterion and GSI–2018 edition. J. Rock Mech. Geotech. Eng. 2019, 11, 445–463. [Google Scholar] [CrossRef]
- Wang, J. Influence of Stress, Undercutting, Blasting and Time on Open Stope Stability and Dilution. Doctoral Thesis, University of Saskatchewan, Saskatoon, SK, Canada, 2004. [Google Scholar]
- Shekhawat, A. Digitization and Environmental Stewardship in Blasting Operations; Continuous Improvement and Asset Optimization; Centre of Excellence in Mining: Quetta, Pakistan, 2025; p. 91. [Google Scholar]
- Clark, L.M. Minimizing Dilution in Open Stope Mining with a Focus on Stope Design and Narrow Vein Longhole Blasting. Doctoral Thesis, University of British Columbia, Vancouver, BC, Canada, 1998. [Google Scholar]
- Zhang, Z.X. Rock mechanics related to mining engineering. In Proceedings of the ISRM Nordic Rock Mechanics Symposium-NRMS, Helsinki, Finland, 11–12 October 2017; ISRM: Lisbon, Portugal, 2017; pp. 39–64. [Google Scholar]
- Louwerse, D. Waste Rock Dilution in Stoping of Steeply Dipping Narrow-Vein Deposits. Master’s Thesis, Aalto University, Espoo, Finland, 2018. [Google Scholar]
- Bazaluk, O.; Petlovanyi, M.; Zubko, S.; Lozynskyi, V.; Sai, K. Instability assessment of hanging wall rocks during underground mining of iron ores. Minerals 2021, 11, 858. [Google Scholar] [CrossRef]
- Ngoma, K.; Mutambo, V. Factors Influencing Ore Recovery and Unplanned Dilution in Sublevel Open Stopes. Case Study of Shaft No.4 at Konkola Mine, Zambia. Curr. World Environ. 2020, 15, 31–46. [Google Scholar]
- Pickering, R.G.B. The optimization of mining method and equipment. In Proceedings of the Third Southern African Conference on Base Metals, Platinum Adding Value Conference, Sun City, South Africa, 3–7 October 2004; pp. 4–6. [Google Scholar]
- Wenquan, D. Underground Mining Design, Principles of. In The ECPH Encyclopedia of Mining and Metallurgy; Springer Nature: Singapore, 2024; pp. 2237–2238. [Google Scholar]
- Lv, Z.; Hu, N.; Li, G. Analysis of factors affecting the human behavior safety in metal underground mines. In Proceedings of the 2011 International Conference on Management and Service Science, Wuhan, China, 12–14 August 2011; IEEE: New York, NY, USA, 2011; pp. 1–3. [Google Scholar]
- Rogers, W.P.; Kahraman, M.M.; Drews, F.A.; Powell, K.; Haight, J.M.; Wang, Y.; Baxla, K.; Sobalkar, M. Automation in the mining industry: Review of technology, systems, human factors, and political risk. Min. Metall. Explor. 2019, 36, 607–631. [Google Scholar] [CrossRef]
- Skrzypkowski, K.; Gómez, R.; Zagórski, K.; Zagórska, A.; Gómez-Espina, R. Review of underground mining methods in world-class base metal deposits: Experiences from Poland and Chile. Energies 2022, 16, 148. [Google Scholar] [CrossRef]
- Mah, S.G.L. Quantification and Prediction of Wall Slough in Open Stope Mining. Master’s Thesis, University of British Columbia, Vancouver, BC, Canada, 1997. [Google Scholar]
- Liu, X.L.; Li, X.B.; Li, F.B.; Zhao, G.Y.; Qin, Y.H. 3D cavity detection technique and its application based on cavity auto scanning laser system. J. Cent. South Univ. Technol. 2008, 15, 285–288. [Google Scholar]
- Henning, J.G.; Mitri, H.S. Assessment and control of ore dilution in long hole mining: Case studies. Geotech. Geol. Eng. 2008, 26, 349–366. [Google Scholar] [CrossRef]
- Jarosz, A.P.; Shepherd, L. Open stope cavity monitoring for the control of dilution and ore loss. In Mine Planning and Equipment Selection 2000; Routledge: London, UK, 2018; pp. 63–66. [Google Scholar]
- Mitchell, J.; Marshall, J.A. Towards a novel auto-rotating lidar platform for cavity surveying. Tunn. Undergr. Space Technol. 2020, 97, 103260. [Google Scholar] [CrossRef]
- Wu, J. Research on sublevel open stoping recovery processes of inclined medium-thick orebody on the basis of physical simulation experiments. PLoS ONE 2020, 15, e0232640. [Google Scholar] [CrossRef]
- Nowak, S.; Sherizadeh, T.; Esmaeelpour, M.; Brooks, P.; Guner, D.; Karadeniz, K. Numerical back analysis of an underground bulk mining operation using distributed optical fiber sensors for model calibration. Bull. Eng. Geol. Environ. 2024, 83, 71. [Google Scholar] [CrossRef]
- Rinne, M.; Janiszewski, M.; Pontow, S.; Uotinen, L.; Kiuru, R.; Kangas, L.; Laine, I.; Leveinen, J. Improvements in Rock Mass Description for Stope Design by Geophysical and Geochemical Methods. Appl. Sci. 2024, 14, 957. [Google Scholar] [CrossRef]
- Jang, H.; Topal, E.; Kawamura, Y. Unplanned dilution and ore loss prediction in longhole stoping mines via multiple regression and artificial neural network analyses. J. S. Afr. Inst. Min. Metall. 2015, 115, 449–456. [Google Scholar] [CrossRef]
- Hudyma, M.R.; Frenette, P.; Leslie, I. Monitoring open stope caving at Goldex Mine. Min. Technol. 2010, 119, 142–150. [Google Scholar] [CrossRef]
- Bamford, T.; Medinac, F.; Esmaeili, K. Continuous monitoring and improvement of the blasting process in open pit mines using unmanned aerial vehicle techniques. Remote Sens. 2020, 12, 2801. [Google Scholar] [CrossRef]
- Debashish, C.; Srikant, A. November. Development of systems for monitoring stability of large excavations. In Recent Advances in Rock Engineering (RARE 2016); Atlantis Press: Dordrecht, The Netherlands, 2016; pp. 429–439. [Google Scholar]
- Rysbekov, K.; Bitimbayev, M.; Akhmetkanov, D.; Yelemessov, K.; Barmenshinova, M.; Toktarov, A.; Baskanbayeva, D. Substantiation of mining systems for steeply dipping low-thickness ore bodies with controlled continuous stope extraction. Min. Miner. Depos. 2022, 16, 64–72. [Google Scholar] [CrossRef]
- Guohua, X.; Jianhua, H. Open Stope Mining Method. In The ECPH Encyclopedia of Mining and Metallurgy; Springer Nature: Singapore, 2024; p. 1483. [Google Scholar]
- Chilunjika, A. Application of fourth industrial technologies: A case of Zimbabwe’s mines. Insights Into Reg. Dev. 2024, 6, 124–140. [Google Scholar] [CrossRef]
- Mazimba, C. Development of Underground Mine Monitoring and Communication System Based on Wireless Sensor Networks. Master’s Thesis, The University of Zambia, Lusaka, Zambia, 2023. [Google Scholar]
- Nowak, S.V. Novel Uses of Distributed Optical Fiber Sensing for Geomechanical Monitoring. Doctoral Thesis, Missouri University of Science and Technology, Rolla, MO, USA, 2023. [Google Scholar]
- Cacciuttolo, C.; Atencio, E.; Komarizadehasl, S.; Lozano-Galant, J.A. Internet of Things long-range-wide-area-network-based wireless sensors network for underground mine monitoring: Planning an efficient, safe, and sustainable labor environment. Sensors 2024, 24, 6971. [Google Scholar] [CrossRef] [PubMed]
- Zvarivadza, T.; Onifade, M.; Dayo-Olupona, O.; Said, K.O.; Githiria, J.M.; Genc, B.; Celik, T. On the impact of Industrial Internet of Things (IIoT)-mining sector perspectives. Int. J. Min. Reclam. Environ. 2024, 38, 771–809. [Google Scholar] [CrossRef]
- Long, M.; Schafrik, S.; Kolapo, P.; Agioutantis, Z.; Sottile, J. Equipment and operations automation in mining: A review. Machines 2024, 12, 713. [Google Scholar] [CrossRef]
- Kolapo, P.; Ogunsola, N.O.; Komolafe, K.; Omole, D.D. Envisioning human–machine relationship towards mining of the future: An overview. Mining 2025, 5, 5. [Google Scholar] [CrossRef]
- Osei, R.; Frimpong, S.; Venkat, A. Human-machine collaboration in mining: A critical review of emerging frontiers of intelligence systems in the mining industry. Extr. Ind. Soc. 2025, 24, 101746. [Google Scholar] [CrossRef]
- Azeem, E.F. Automation in Mining: Improving Efficiency and Safety in Deep Mines. Am. J. Min. Eng. 2020, 1, 8–15. [Google Scholar]
- Bisschoff, R.A.D.P.; Grobbelaar, S. Evaluation of data-driven decision-making implementation in the mining industry. S. Afr. J. Ind. Eng. 2022, 33, 218–232. [Google Scholar] [CrossRef]
- Chowdu, A.; Nesbitt, P.; Brickey, A.; Newman, A.M. Operations research in underground mine planning: A review. Inf. J. Appl. Anal. 2022, 52, 109–132. [Google Scholar]
- Obosu, M.; Frimpong, S. Advances in automation and robotics: The state of the emerging future mining industry. J. Saf. Sustain. 2025, 2, 181–194. [Google Scholar] [CrossRef]
- Waghmare, G.H.; Thelkar, A.R.; Babu, S.B.T.; Katre, R.; Kumar, A.; Mahender, K. Robotics in Underground Mining for Improved Worker Safety and Efficiency. Int. J. Environ. Sci. 2025, 11, 279–286. [Google Scholar]
- Nandan Technicals. SCADA Types, Functions, SCADA System Architecture, Benefits and Applications. 2022. Available online: https://www.nandantechnicals.com/2022/07/scada-types-functions-scada-system.html (accessed on 10 June 2025).
- Nguyen, H.N.; Koo, J. Enhancing SCADA Security Using Generative Adversarial Network. J. Cybersecur. Priv. 2025, 5, 73. [Google Scholar] [CrossRef]
Disclaimer/Publisher’s Note: The statements, opinions and data contained in all publications are solely those of the individual author(s) and contributor(s) and not of MDPI and/or the editor(s). MDPI and/or the editor(s) disclaim responsibility for any injury to people or property resulting from any ideas, methods, instructions or products referred to in the content. |
© 2025 by the authors. Licensee MDPI, Basel, Switzerland. This article is an open access article distributed under the terms and conditions of the Creative Commons Attribution (CC BY) license (https://creativecommons.org/licenses/by/4.0/).