1. Introduction
With the continued growth of industrialization and population, energy demand is surpassing the supply capacity of traditional fossil fuels. Driven by both the limited availability of fossil fuel resources and the escalating threats of climate change, the global energy sector is transitioning toward renewable energy sources [
1,
2,
3,
4]. However, most prevalent renewable energy sources, such as solar and wind power, are weather-dependent and therefore unsuitable on their own for providing baseload power, especially when demand does not match supply [
5,
6,
7]. Smart grids and digitalization are becoming essential for managing diverse renewable energy sources, enabling real-time balancing of decentralized supply and demand. To integrate high shares of these energies considering their intermittency, power grids require either major infrastructure upgrades, expanded transmission capacity, enhanced demand-side flexibility, or large-scale energy storage systems [
8]. Among which, large-scale energy storage is the focal point of current energy development. According to Global Renewables Alliance, to hit net-zero by 2050, 6-fold growth in storage capacity is needed by 2030, which equates to roughly 1.5 TW of storage [
9].
Pumped storage hydroelectricity (PSH) remains the dominant form of grid storage globally for its large capacity and low costs, which comprises about 96% of global storage power capacity and 99% of global storage energy volume [
10]. PSH is a gravity-based energy storage technology that stores energy by pumping water from a lower reservoir to an upper reservoir during periods of low electricity demand. During peak demand, the stored water is released back to the lower reservoir through hydroelectric turbines, generating electricity and feeding it back into the grid, reaching the efficiency of around 80% [
11]. Though mature and efficient, such a method is strongly restrained by its geographic specificity, as it needs significant head and water reservoirs. In addition, environmental concerns—such as ecosystem disruption, land inundation, and impacts on watersheds—introduce further regulatory and societal challenges [
12].
In this context, Underground Pumped Hydro Storage (UPHS) has emerged as a promising alternative, particularly in regions with limited topographic variation or surface space. UPHS can be built in flat terrain using existing or purpose-built underground caverns, thereby minimizing surface impacts and expanding the range of feasible site locations. Previous studies have highlighted the technical potential and site opportunities of UPHS in various geological settings, including both hard-rock environments (e.g., crystalline basements and abandoned mines) and sedimentary formations (e.g., aquifers and sandstones) across Europe and North America [
13,
14,
15,
16,
17,
18,
19,
20]. These studies collectively demonstrate that UPHS can be adapted to a broad range of subsurface conditions, from stable hard rock to evaporites, highlighting its versatility as an energy storage option. Furthermore, underground caverns offer high energy storage density and can be scaled through modular cavern arrays, while PSH lakes require vast surface area [
11]. Moreover, the operating pressure required for UPHS is lower than that of mainstream underground energy storage technologies such as hydrogen storage, resulting in reduced mechanical disturbance to the surrounding rock mass and thus offering a safer operational profile.
Although UPHS presents a promising approach to increasing the share of renewable energy and balancing supply and demand, the technology remains in its early stages, and relatively few studies have focused on its development and implementation. Notably, many abandoned or underutilized salt caverns from former mining operations and untapped salt formation offer a unique opportunity for UPHS deployment, manifesting great development potential. For instance, Southern Ontario, Canada, bears extensive salt formations with thicknesses ranging from tens to hundreds of meters and has supported a well-established salt mining industry dating back to the 1860s [
21]. The Silurian-aged Salina Formation, located within the Michigan Basin, contains two major salt layers, from which a total of 166 caverns were mined between 1982 and 2018, with the maximum depth of around 720 m [
22]. Only a few of these caverns have been repurposed for energy storage applications, such as hydrogen and compressed air storage, while many remain inactive, let alone those that may be mined in the future. These geological conditions provide a favorable foundation for evaluating the geomechanical feasibility of UPHS deployment. However, salt formations have occasionally been mentioned as potential host rocks in review studies [
23,
24], but detailed geomechanical assessments of UPHS in bedded salt remain largely unexplored.
This study presents the first geomechanical assessment of a paired-cavern UPHS layout in the Canadian Salina Group, a region characterized by thick bedded salt formations, addressing a significant gap in current research. As geomechanical feasibility is the first and foundational step in any underground energy storage project, establishing mechanical stability is essential before economic, operational, or hydrodynamic performance can be meaningfully assessed. Here, a three-dimensional numerical simulation is performed to evaluate the impact of varying minimum working pressures on long-term deformation behavior. By capturing both elasto-plastic responses and long-term salt creep over ten years of daily cycling, this study provides a comprehensive assessment of cavern stability and establishes a safe operating-pressure range. In particular, it offers three unique contributions: (i) the first UPHS-specific modeling in the Salina Group with a paired-cavern layout tied to Units B and A2 stratigraphy, including shale and limestone interlayers; (ii) coupled elasto-plastic and creep simulations under realistic 24 h cycling for a decade; and (iii) an operating guideline that identifies 0.3 σv as the optimal minimum residual pressure for UPHS caverns. These contributions extend recent salt-cavern research, which largely focuses on hydrogen or CAES, and provide site-relevant design guidance for UPHS deployment in bedded salt.
2. Geological Setting
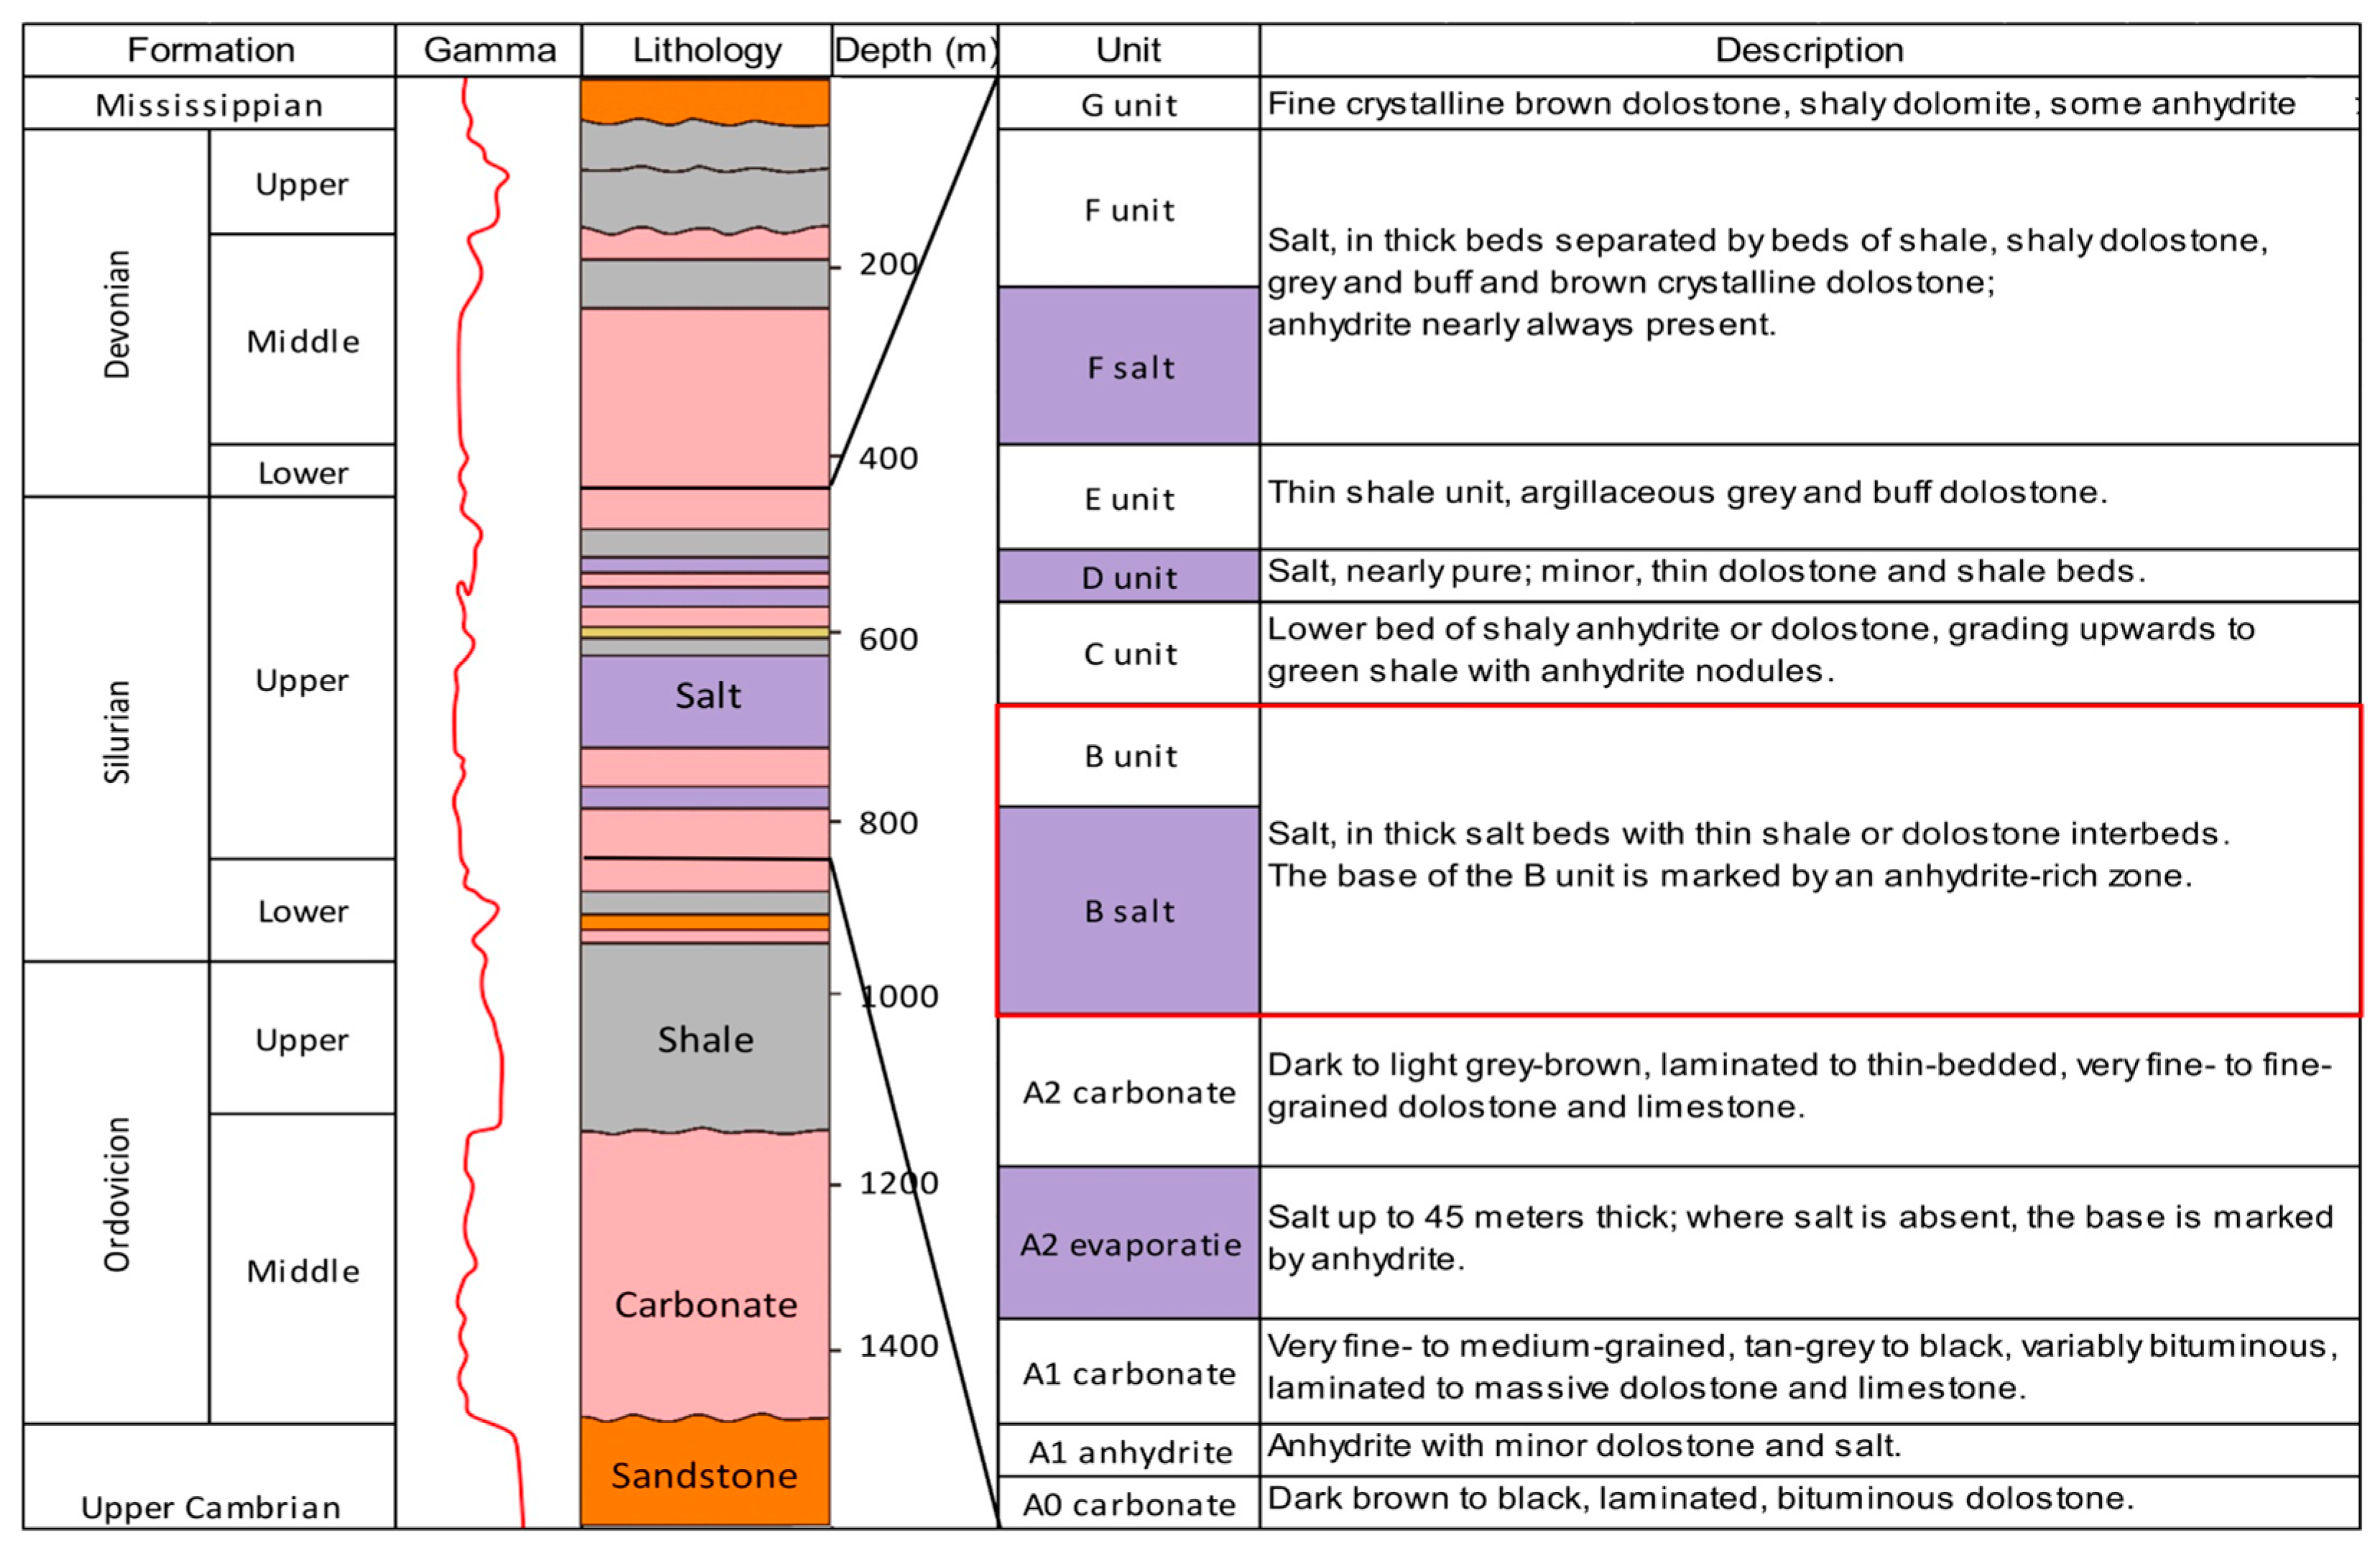
The Michigan Basin, located in the southwestern area of southwestern Ontario, underlies Salina formation of Silurian age. Based on lithological characteristics, this formation can be divided into seven lithological units, labeled A through G. Salt formation can be found in Units F, D, and B, as well as the lower part of Unit A2 [
25]. Salt mining is primarily conducted in Unit B, as it is notably the thickest and most widespread salt unit, underlying an area of ~16,000 km
2 in Ontario and salt thicknesses average around 90 m in Lambton County. The lower Unit A2, up to 45 m thick, also presents potential for energy storage. In contrast, the remaining salt layers are either too thin to support cavern development or contain significant impurities, including shale, dolomitic interlayers, and anhydrite, are consequently not considered for potential energy storage sites which pose obstacles to cavern construction and threaten overall stability [
26]. The detailed lithology distribution of Salina formation is listed in
Figure 1.
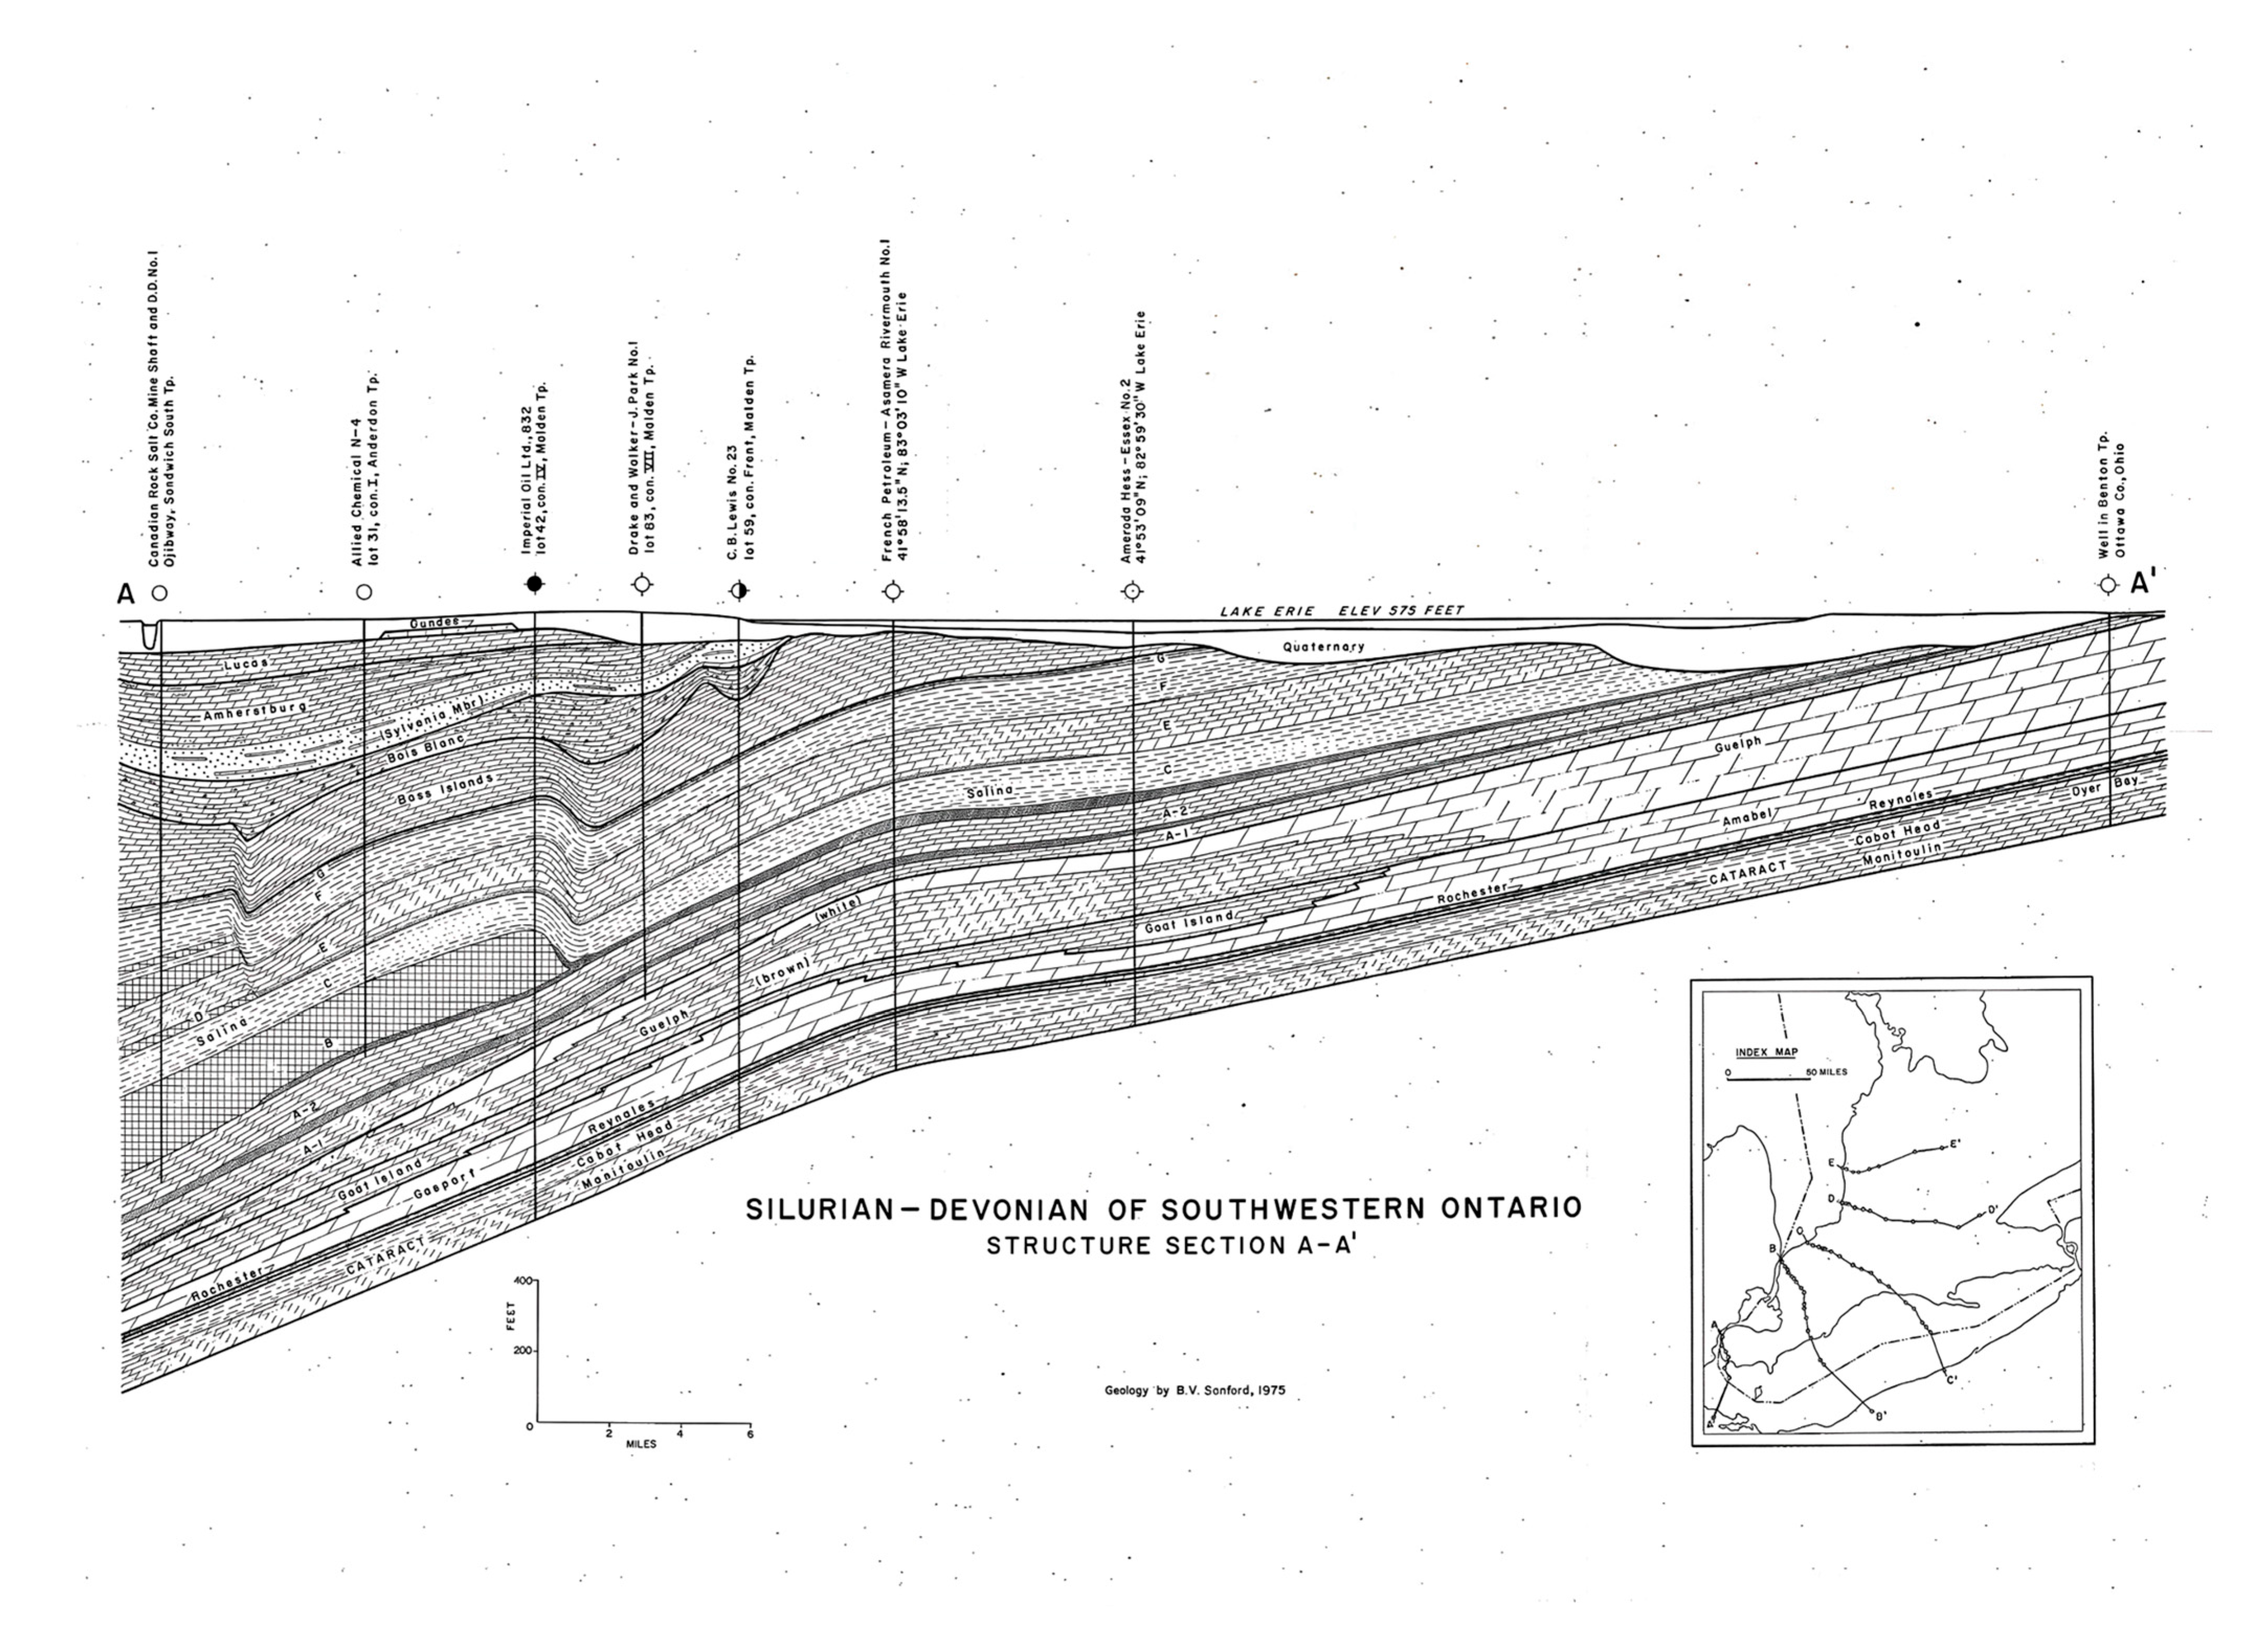
Figure 2 demonstrates the structural cross-section of the Silurian–Devonian strata in Southwestern Ontario. Based on
Figure 2, both Unit B and Unit A2 within the Salina Group exhibit minimal dip, with an average inclination of less than 1°, trending gently southwestward, indicating laterally extensive and relatively uniform thicknesses across the region [
27]. Such continuity and geometry are advantageous for underground energy storage applications, as they support the development of stable, uniformly shaped salt caverns.
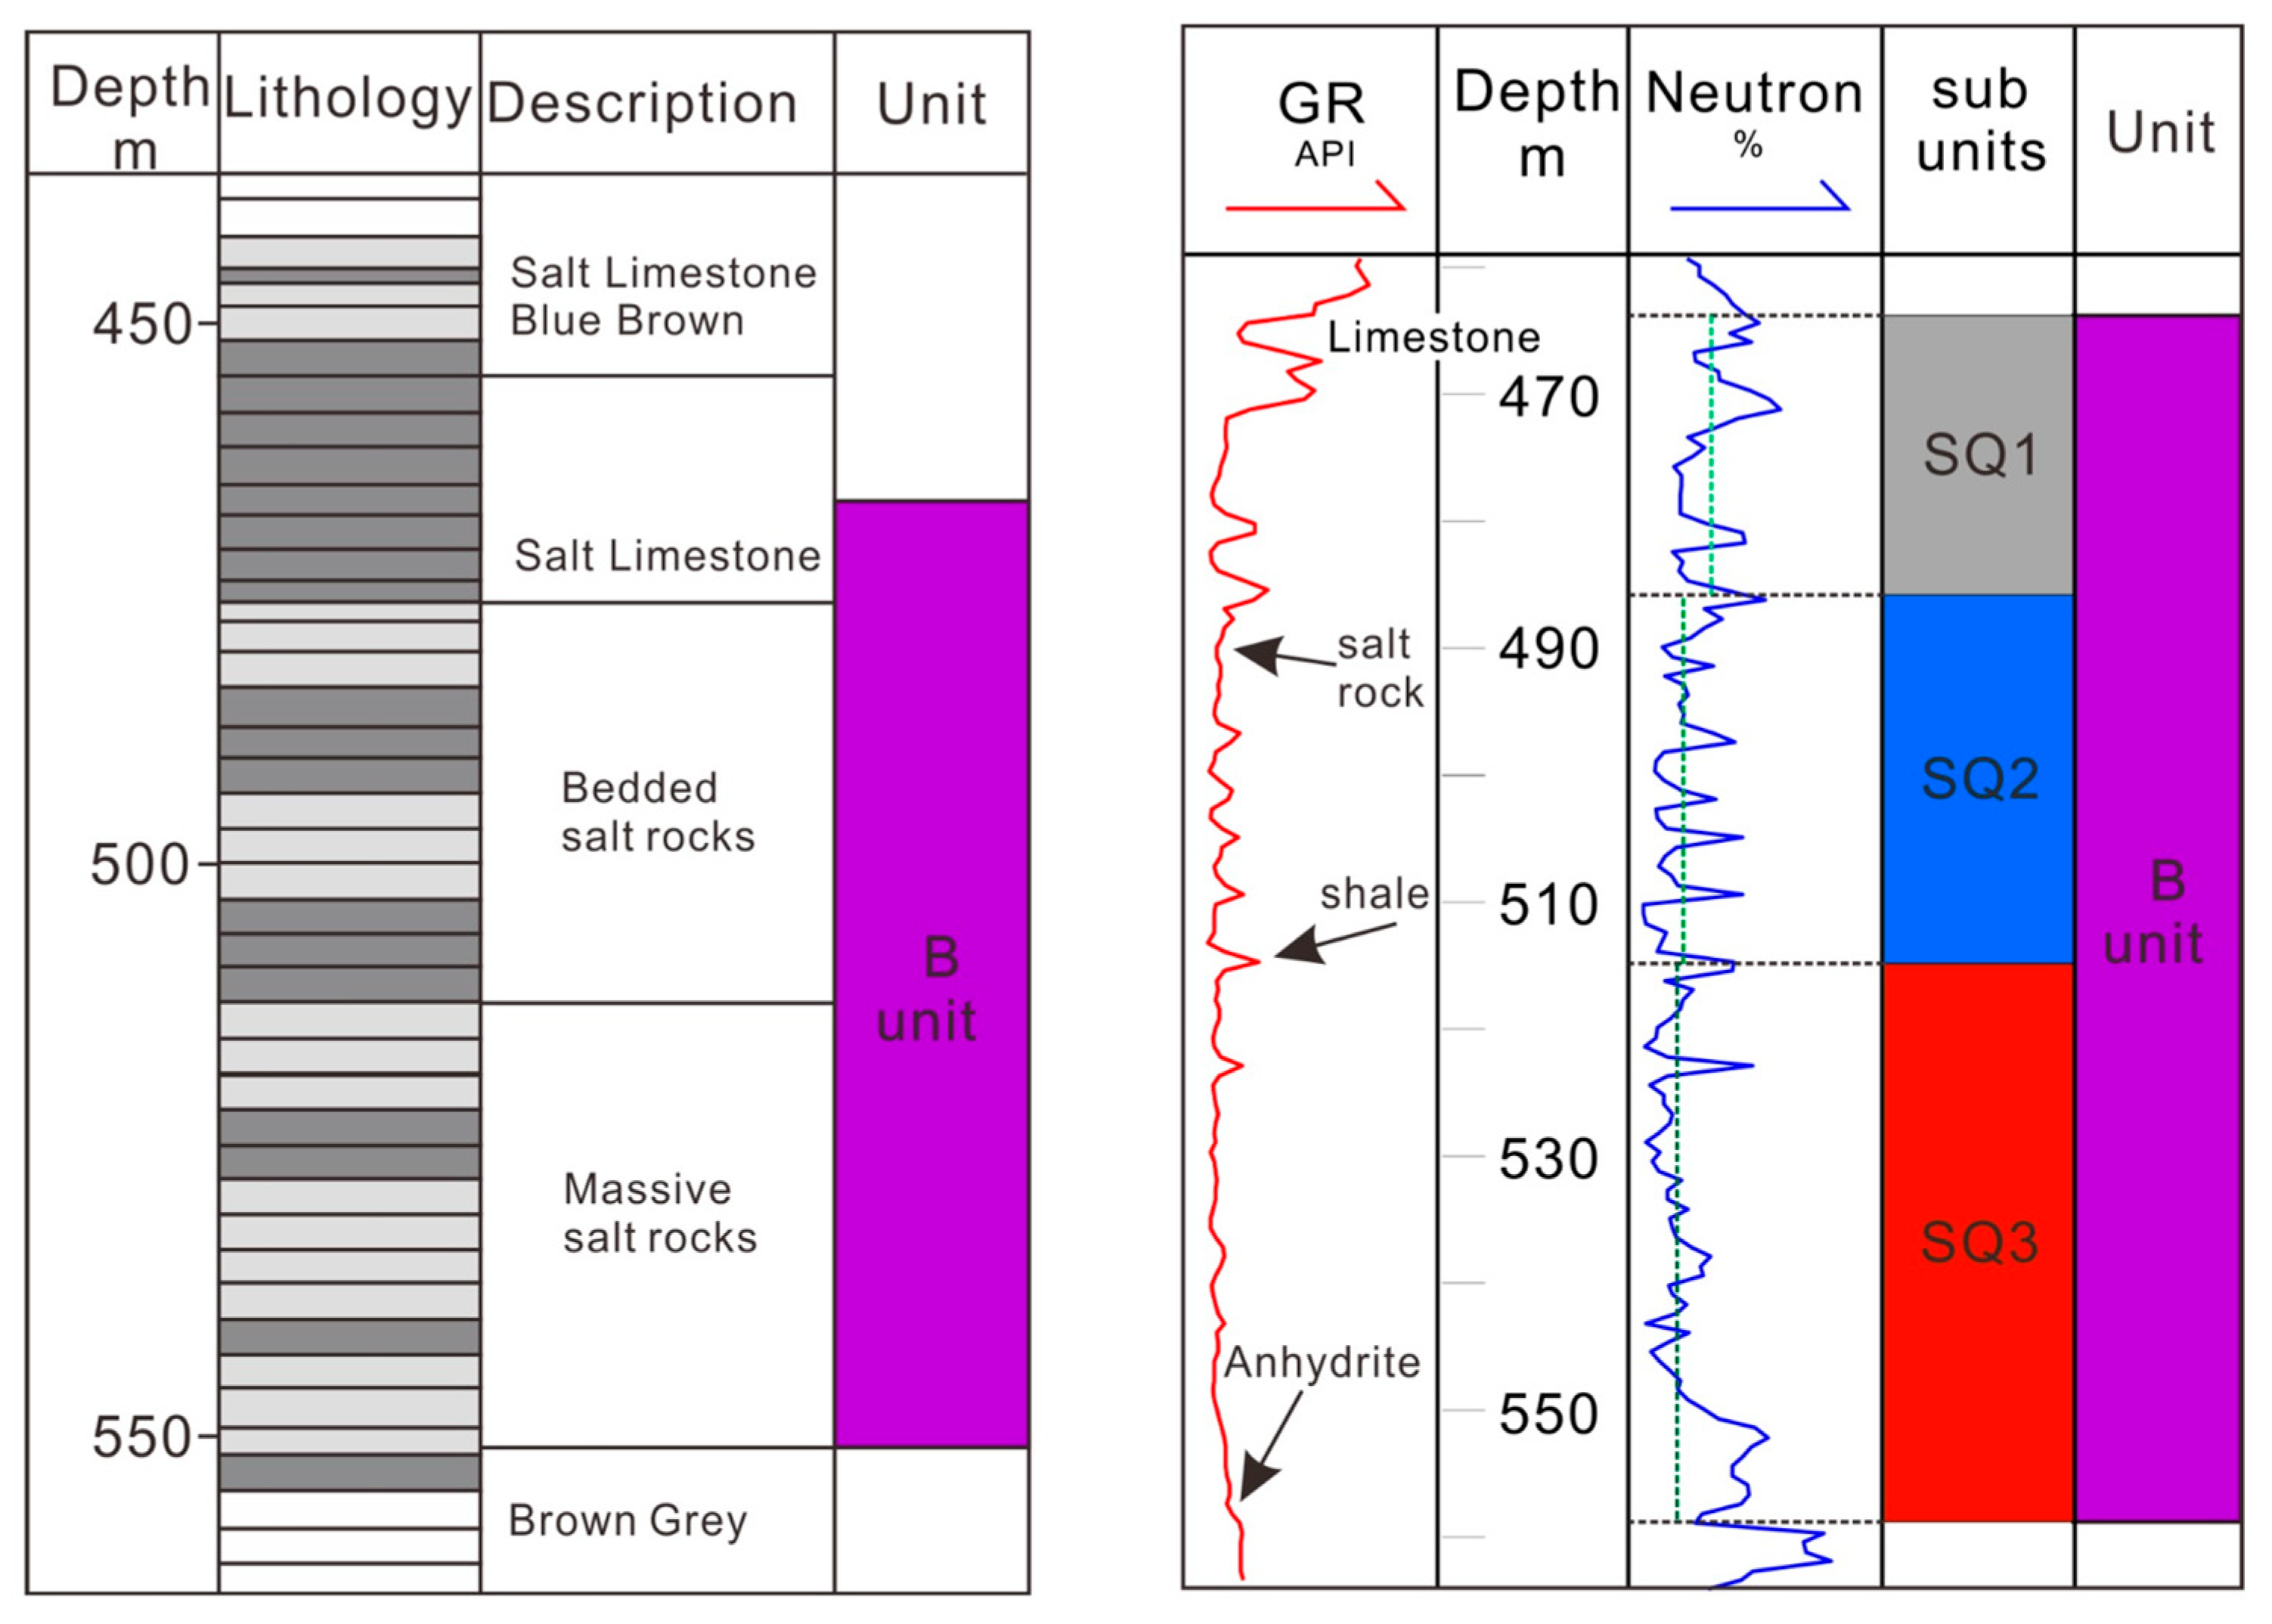
Three subunits can also be identified based on the rock components. According to the natural gamma (GR) and compensated neutron log (CNL) curves, two distinct sequence boundaries were determined. Beyond the upper boundaries, both curves represent relatively high values, corresponding to prevalent interbedded halite and limestone; within the boundaries, the pronounced fluctuations in the logging curves indicate halite deposit with several shale interlayers. The lowest part exhibits relatively stable and lower curve values, indicative of massive halite deposits. These three sublayers are labeled SQ1, SQ2, and SQ3 from top to bottom, as shown in
Figure 3 The thicknesses of subunits SQ1, SQ2, and SQ3 in unit B generally range from 20 to 30 m, 25 to 35 m, and 30 to 40 m, respectively.
Figure 3 uses data from wells F006864 and T003039 as examples [
28], and each subunit is distinguished by a different color.
Compared to Unit B, Unit A2 of the Salina Formation is characterized by a significantly higher purity of halite like subunit SQ3. Core descriptions from the DGR-1 borehole in the Bruce region reveal that Unit A2 comprises a thick evaporite sequence dominated by massive halite, with only minor intercalations of anhydrite or dolomitic partings at the boundaries [
29]. The Ontario Geological Survey (IMR006) explicitly identifies Unit A2 as the “lower salt” and describes it as being composed of “nearly pure salt,” with minimal contamination from non-evaporitic lithology.
4. Numerical Model
When identifying potential sites for UPHS, securing sufficient vertical space is a primary consideration, as the height difference between the two reservoirs directly determines the amount of energy that can be stored. Although Unit B alone reaches a thickness of up to 90 m, it may be insufficient to accommodate the required vertical separation between the upper and lower caverns—particularly due to the presence of the highly impure SQ1 sublayer. To achieve a greater height difference and ensure suitable cavern positioning, the A2 evaporite unit is also incorporated into the design. Therefore, the upper cavern is set in unit B, and the lower cavern is set in the lower unit A2.
In this study, a numerical model incorporating both Unit B and Unit A2 was developed using COMSOL Multiphysics 6.3, which applies the Lagrangian formulation of the finite element method for structural analysis. The thicknesses of the sublayers within Unit B were set as 25 m for SQ1, 30 m for SQ2, and 35 m for SQ3. The underlying A2 evaporite unit was assumed to be 45 m thick to provide additional vertical space for cavern placement. The overall model domain was defined as a cube measuring 200 m × 200 m × 200 m, with the top boundary located at a burial depth of 455 m, so that both Unit B and lower Unit A2 were fully represented. Although the overlying Upper A2 carbonate and Upper B units are geologically anisotropic, they were simplified as pure limestone and anhydrite, respectively, to reduce model complexity, as the focus of this study is on the mechanical behavior of the salt body surrounding the caverns. Nevertheless, to account for the potential destabilizing effect of interbedded shale, one shale interlayer intersecting the cavern wall was retained in the model. To minimize boundary effects, spring foundations were applied to the model boundaries, simulating an infinite surrounding rock mass. The model utilized tetrahedral mesh elements, refined near the cavern wall and shale interlayer to capture stress gradients. The governing equations were solved using a fully coupled, implicit time integration scheme, with second-order Lagrange shape functions for displacement. The computational mesh was intentionally refined in the vicinity of the caverns while remaining comparatively coarse in the far field. A grid sensitivity analysis confirmed that this strategy is adequate: further mesh refinement altered key output values by less than 1%, demonstrating that the chosen discretization provides sufficient numerical accuracy. Due to the absence of in situ UPHS cavern data or confirmed project sites in Southern Ontario, this work is intended as a preliminary feasibility assessment rather than a site-specific design. Therefore, the model domain was defined using the representative stratigraphy of the Salina Group. Average mechanical and creep parameters reported for Canadian salt formations were adopted, rather than localized site measurements. This approach allows one to establish a baseline understanding of cavern stability under UPHS cycling, while future work incorporating site-specific geological and operational data will provide more refined validation and design.
Based on stratigraphic data, the average density of the overlying strata was set to 2300 kg/m
3 for the purpose of overburden stress calculation. The horizontal in situ stresses were set to 0.7 and 0.75 times the vertical in situ stress, respectively. The detailed mechanical properties of the rock mass are listed in
Table 1. These material properties were selected within the representative range of typical rock formations found in Canada. It is noteworthy that to accentuate plastic deformation in the numerical model, a deliberately low friction angle was adopted, thereby representing an extreme loading scenario.
To maximize the energy storage capacity of the system under a fixed height difference, the cavern volumes are ideally designed to be as large as possible. However, in the case of large-scale salt caverns, maintaining structural stability requires sufficient buffer zones between the cavern and surrounding strata. Based on engineering guidelines for underground salt caverns, a minimum thickness of 20 m is recommended for the hanging wall, and 10 m for the footwall, to ensure mechanical integrity and prevent failure during operation [
33,
34]. Given that the A2 salt deposit is only 45 m thick, the construction of large-scale caverns is not feasible. Therefore, the minimum thickness constraints for the hanging and foot walls may be relaxed accordingly. In this study, the caverns are modeled as vertical cylinders with a diameter-to-height ratio of 1.5, following design recommendations from previous studies on compressed air energy storage (CAES) systems in the same region [
35]. Considering the constrain caused by the thin A2 layer, the height of the caverns is 30 m, leaving 10 m for hanging wall and 5 m for roof. Sharp edges are difficult to control during the leaching process, and irregular curves are more likely to form naturally. For simplicity, fillets with a radius of 5 m were applied to the cavern edges in the model to represent the curved geometry typically observed in leached caverns. To make rooms for the injection and withdrawal tubes, the caverns are misaligned in the vertical direction. Instead, a 15 m vertical separation is applied. Injection tubes are positioned at the top of the cavern to introduce gas during the charging phase, while the production tube extends to approximately 80% of the cavern height, allowing for efficient brine withdrawal during discharging. Both tubes are connected to ground.
To initiate energy storage, brine is first injected into the caverns such that one cavern is fully filled, while the other retains approximately 20% of its volume, ensuring that the brine level remains above the outlet of the extraction tube. A schematic of the paired cavern system is presented in
Figure 4. During the charging phase, compressed air is injected through the injection tube into the lower cavern. The pressurized gas displaces the brine, pushing it to the surface and allowing it to flow into the upper cavern under gravitational force. Conversely, during the discharging phase, brine is pumped from the upper cavern, and the pressure differential causes it to flow back into the lower cavern. Through this process, gravitational potential energy stored in the brine column is converted back into usable energy. The gas pressure needed is calculated below:
where
is the density of brine, assuming 1200
. H is the depth of the caverns at the depth corresponding to one-fifth of the cavern height, which is 524 m for upper cavern and 584 m for lower cavern. Therefore, the gas pressure needed can be calculated as 6.2 MPa for lower cavern and 7 MPa for upper cavern. However, during the circulation, when brine flows into one of the caverns under gravity, a residual working gas pressure must be maintained to ensure cavern stability. This pressure is expected to remain relatively low to avoid impeding the gravitational inflow of brine into the caverns and to minimize energy consumption during operation. However, it must not be too low, as insufficient internal support may compromise cavern stability. Moreover, a large pressure differential between charging and discharging phases could induce significant stress fluctuations, potentially harming the long-term structural integrity of the caverns [
36]. Most studies recommend a 0.3 to 0.4 times of the vertical stress [
32,
37]. In this study, the operating pressure applied when the cavern received brine inflow is set to approximately 20%, 30%, and 40% of the vertical geostatic stress, thus the best minimum working pressure can be gained. Accordingly, the residual gas pressures are defined as 2.4 MPa, 3.7 MPa, and 4.9 MPa for the upper cavern and 2.8 MPa, 4.2 MPa, and 5.5 MPa for the lower cavern. These values are gained based on their respective burial depths.
According to a UPHS study in Belgium, the optimal discharge rates were reported in a narrow range—1.6–1.8 m
3/s at the depth of 300 m to 500 m, chosen for both efficiency and stable turbine operation [
17]. In this study, 1.8 m
3/s of the flow rate was chosen. The time needed for charging/discharging can be calculated as follows:
where V is the volume of the cavern. For simplicity, both the charging and discharging phases are set to last 6 h. During the charging phase, the working gas pressure in the lower cavern is maintained at 7 MPa to ensure sufficient brine displacement to the surface. In the subsequent discharging phase, this pressure is reduced to the minimum pressure needed. Conversely, in the upper cavern, the gas pressure is held at 6.2 MPa during discharging to facilitate brine flow back into the lower cavern and reduced to minimum during charging. Between the charging and discharging state, an intermediate 6 h period is introduced, during which the gas pressures in both caverns are gradually adjusted to avoid abrupt changes in loading. Therefore, a 24 h cycle is formed. The brine level drop (in m) in one cycle is determined as follows:
Similarly, the working gas pressure change can be determined using following dimensionless function:
Thus, the pressure applied on the upper cavern wall in one cycle can be written as
For the lower cavern,
where z is the distance between calculated point and cavern bottom,
represents the working pressure required to pump brine from the cavern to the surface, and
denotes the minimum pressure necessary to maintain cavern stability when receiving brine.
With the charging–discharging cycle selected, the energy stored and utilized per day can be estimated as shown below:
where
is the density of brine, and h is the height difference between two caverns (65 m in this study). V is the volume of working brine, which is 0.8 times the cavern volume.
is system efficiency, assumed to be 0.8. The energy stored in a single charge cycle, approximately 6288 kWh, is sufficient to power between 200 and 300 residential households for one day, assuming typical daily usage between 20 and 30 kWh per household [
38].
This study offers only a preliminary assessment of implementing UPHS system in South Ontario. Due to limited availability of in situ stratigraphic data and detailed injection–production records, several constraints must be acknowledged. First, the rock mass is treated as laterally homogeneous, thereby ignoring the uneven stress distribution that could arise from property anisotropy or randomly occurring features such as micro-fractures. This assumption may overestimate the long-term stability of salt caverns; consequently, a more rigorous evaluation was adopted when analyzing the results. Second, thermal effects associated with gas pressure fluctuations were also neglected. Creep deformation in salt accelerates at elevated temperatures; omitting this coupling may again yield optimistic predictions. Furthermore, brine leakage was not considered, as bedded salt is generally self-sealing, but pore pressure distribution could still modify the surrounding effective stress field. Future work will incorporate these factors to provide a more comprehensive evaluation of cavern integrity and operational performance.
5. Modeling Results
5.1. Cavern Excavation
The initial stability of the excavated cavern is fundamental to the long-term mechanical performance of an UPHS system. A structurally stable cavern minimizes the risk of excessive deformation, fracturing, or failure during cyclic operations.
Figure 5 presents the stress and strain distributions immediately after excavation, which serve as a critical baseline for evaluating the long-term geomechanical behavior of the storage system.
After excavation, moderate displacement and a largely uniform stress distribution were found around the cavern boundaries. A shrinkage trend is observed, particularly in the lower cavern, due to the higher in situ stress levels. Inward extrusion is most pronounced on the side of the cavern wall farthest from the neighboring cavern, as each cavern disturbs the surrounding stress field and the stress-relief arches around the voids partially overlap. Consequently, the cavern faces closest to the adjacent cavern experience reduced confinement and lower effective stress. In addition, stress field around the caverns remains generally uniform, aside from localized stress concentrations at shale interlayer due to rock properties difference. This concentration, however, is confined to limited zones and does not propagate into the surrounding rock mass. The limestone layer between the two caverns also exhibits a localized stress concentration zone, which is attributed to shear effects induced by the asymmetric deformation of the caverns. The observed stability demonstrates the strong load-bearing capacity of the surrounding geological formation, thus providing a reliable foundation for the implementation of UPHS.
5.2. Preliminary Analysis of Minimum Working Pressure
To evaluate the stabilizing effects of different minimum working pressures on the cavern system, a series of stationary simulations were conducted under the two extreme pressure conditions: the fully charged and fully discharged states, during which the maximum working pressure is applied to the cavern fully filled with brine, while the minimum working pressure is applied to the cavern with the lowest brine level. Three sets of minimum working pressures were tested:
Set 1: 2.4 MPa for the upper cavern and 2.8 MPa for the lower (corresponding to 0.2 σv),
Set 2: 3.7 MPa for the upper cavern and 4.2 MPa for the lower cavern (0.3 σv),
Set 3: 4.9 MPa for the upper cavern and 5.5 MPa for the lower cavern (0.4 σv).
These simulations aim to examine the system’s mechanical response and identify the minimum pressure threshold that ensures cavern stability without compromising operational efficiency.
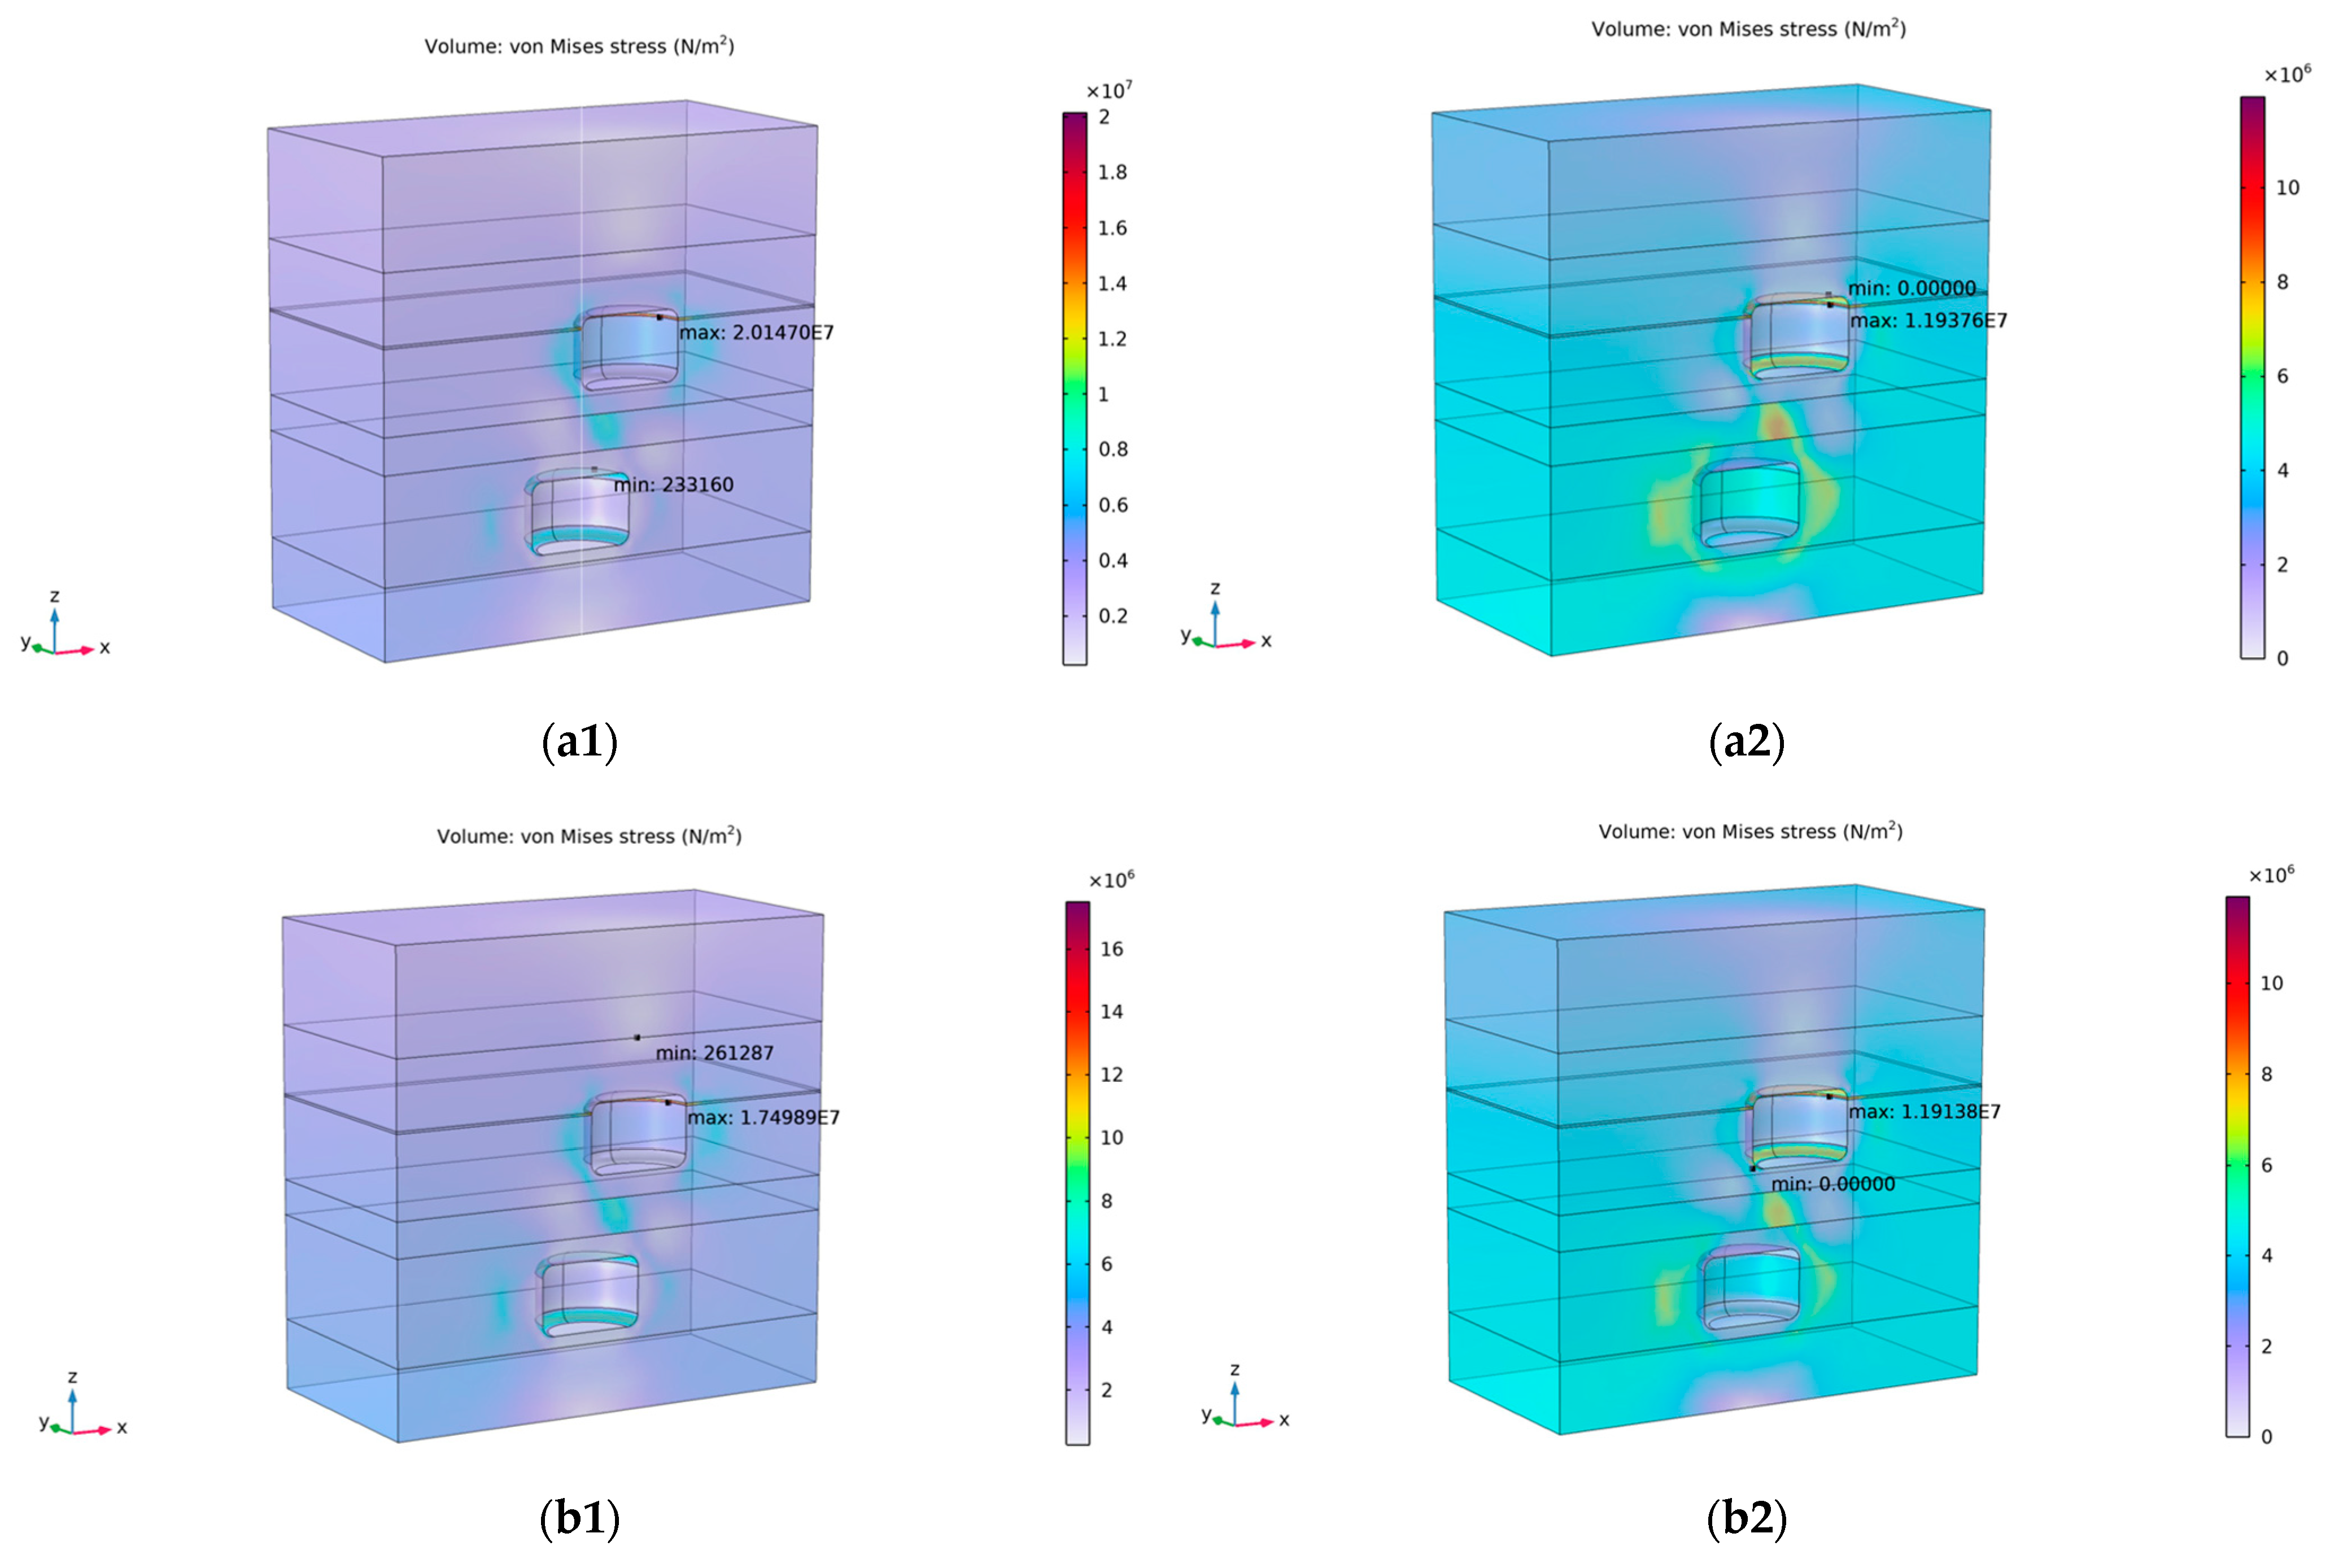
Figure 6 presents the von Mises stress fields after simulation.
Simulation results show that the application of internal working pressure significantly reduces the maximum von Mises stress, highlighting the stabilizing effect of gas support. With the increase in the minimum working pressure, stress around salt caverns decreases pronouncedly as the supporting effect becomes more effective. While stress concentrations remain in similar regions as observed prior to pressurization, their intensity is notably alleviated and further diminishes with higher minimum pressures. In contrast to other cases, when the upper cavern is filled with brine, a low minimum working pressure leads to more pronounced and widespread stress concentrations. This results in greater disruption of the stress field and poses a challenge to maintaining long-term cyclic stability.
When the maximum working pressure is applied to the brine-filled cavern, the stress concentration levels in both caverns are significantly reduced. This indicates that the combined effect of the working gas pressure and brine pressure effectively counteracts the high compressive stresses surrounding the deeply excavated caverns. However, this also highlights the existence of a pressure threshold, as excessive internal pressure may exceed the in situ stress field, causing outward expansion of the cavern and increasing the risk of structural damage.
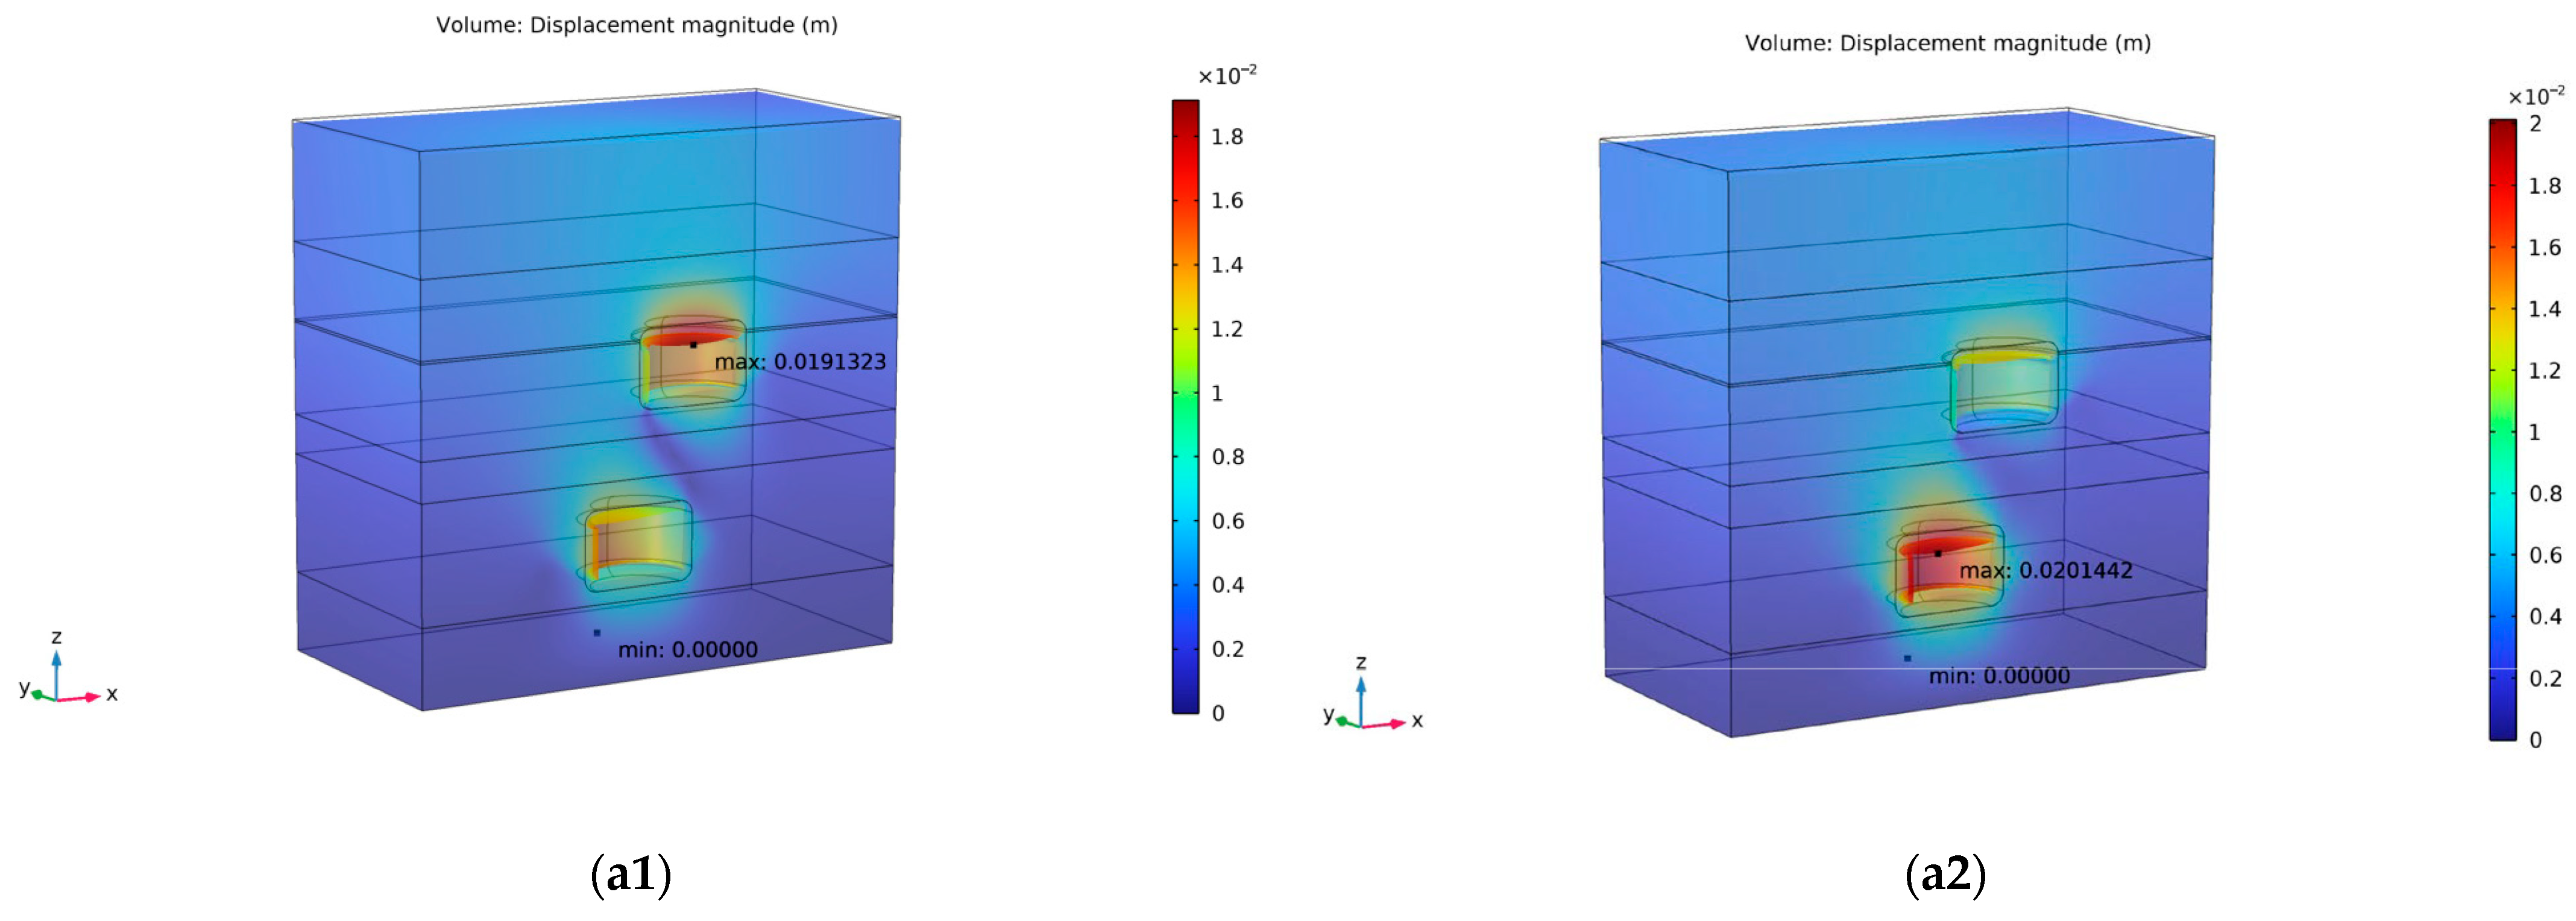
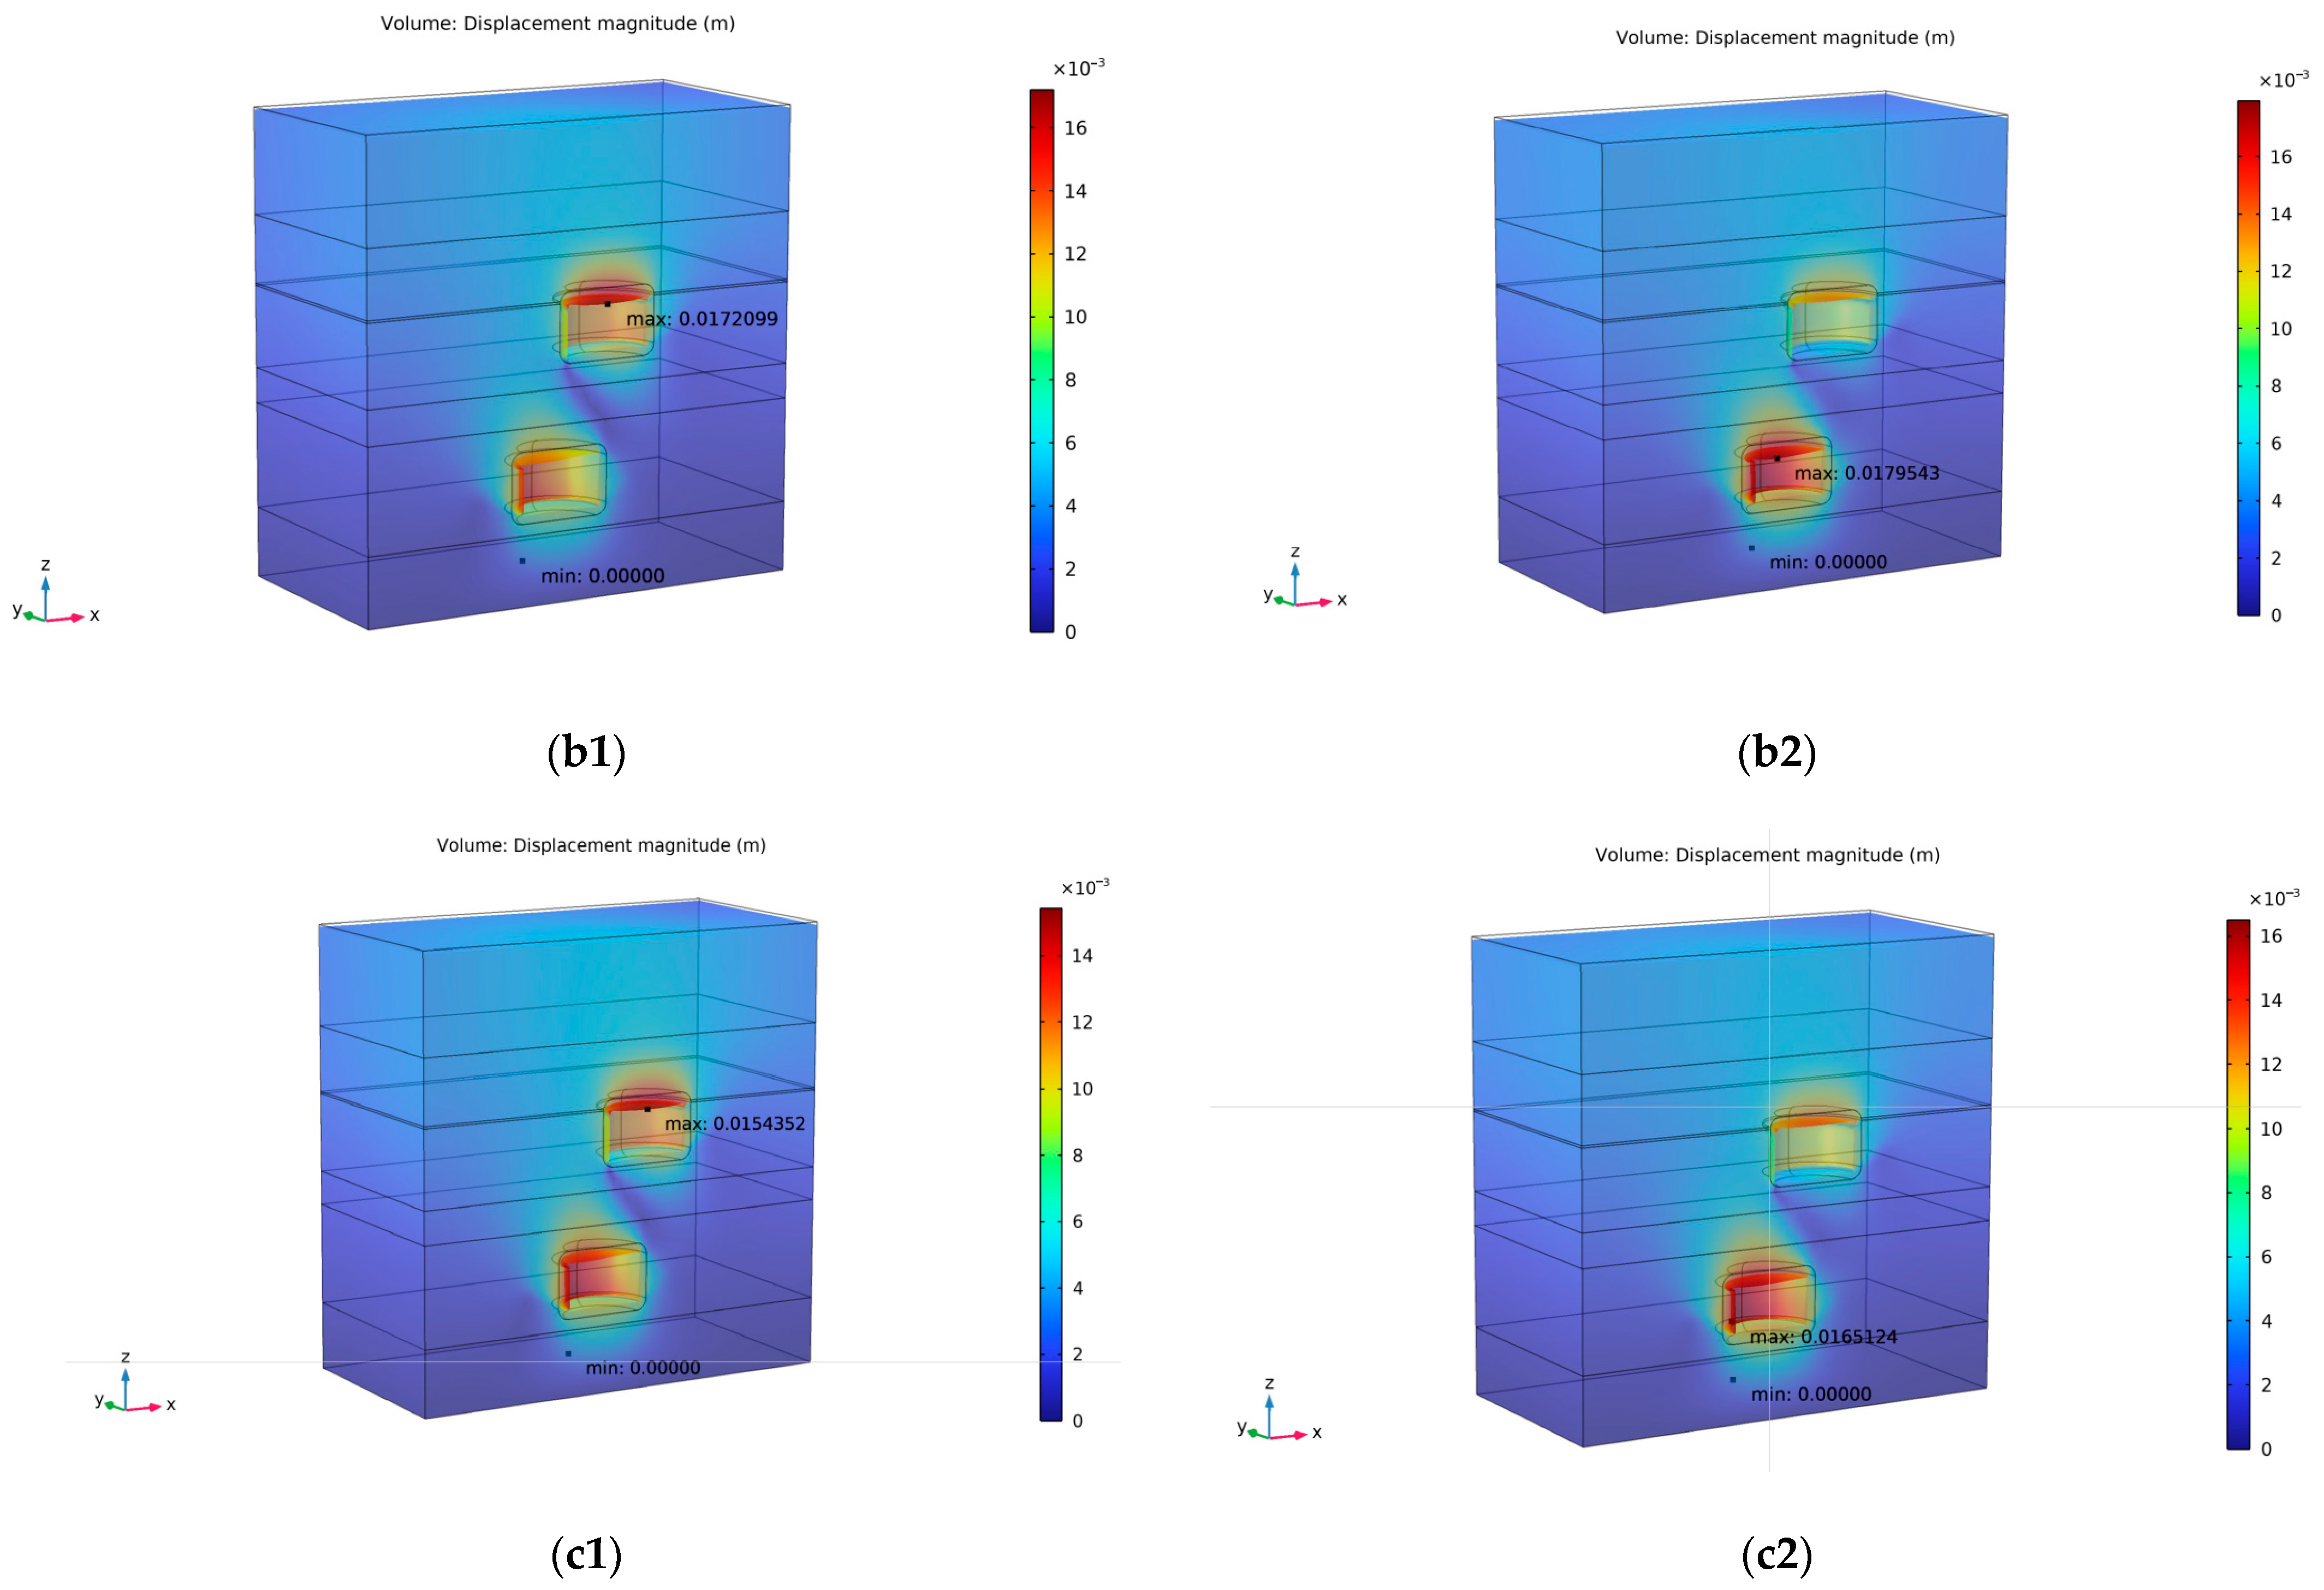
Figure 7 presents the deformation after simulation.
A shrinkage trend is present in all three cases, with the cavern sidewalls exhibiting more pronounced inward extrusion compared to the roof and floor. A slight step-like surface forms along the cavern edges due to differential displacement. Despite these deformations, the overall displacement remains minimal. The shale interlayer shows significantly less deformation than the surrounding salt rock, resulting in a recessed surface along the cavern wall. This mechanical contrast contributes to the pronounced stress concentrations observed within the shale interlayer, highlighting it as a structural weak point within the system.
In both caverns, increasing the pressure level reduces the maximum deformation, decreasing from 1.9 cm to 1.5 cm in the upper cavern and from 2.0 cm to 1.7 cm in the lower cavern. However, a slightly more noticeable reduction in maximum deformation is observed between set 1 and set 2, suggesting that the incremental benefit of increasing minimum working pressure diminishes beyond a certain point. Therefore, to maintain operational efficiency while ensuring structural stability, the minimum working pressure is recommended to be below 0.4 σv.
5.3. Long-Term Stability Evaluation
When evaluating the long-term stability of salt caverns, the plastic and creep deformation are the key points. The pronounced plastic deformation and creep behavior of salt rock make salt caverns more likely to form large deformation and more vulnerable to cycle loads. Therefore, all three sets are simulated for 10-year discharging–charging cycles. The relevant rock properties are shown in
Table 2.
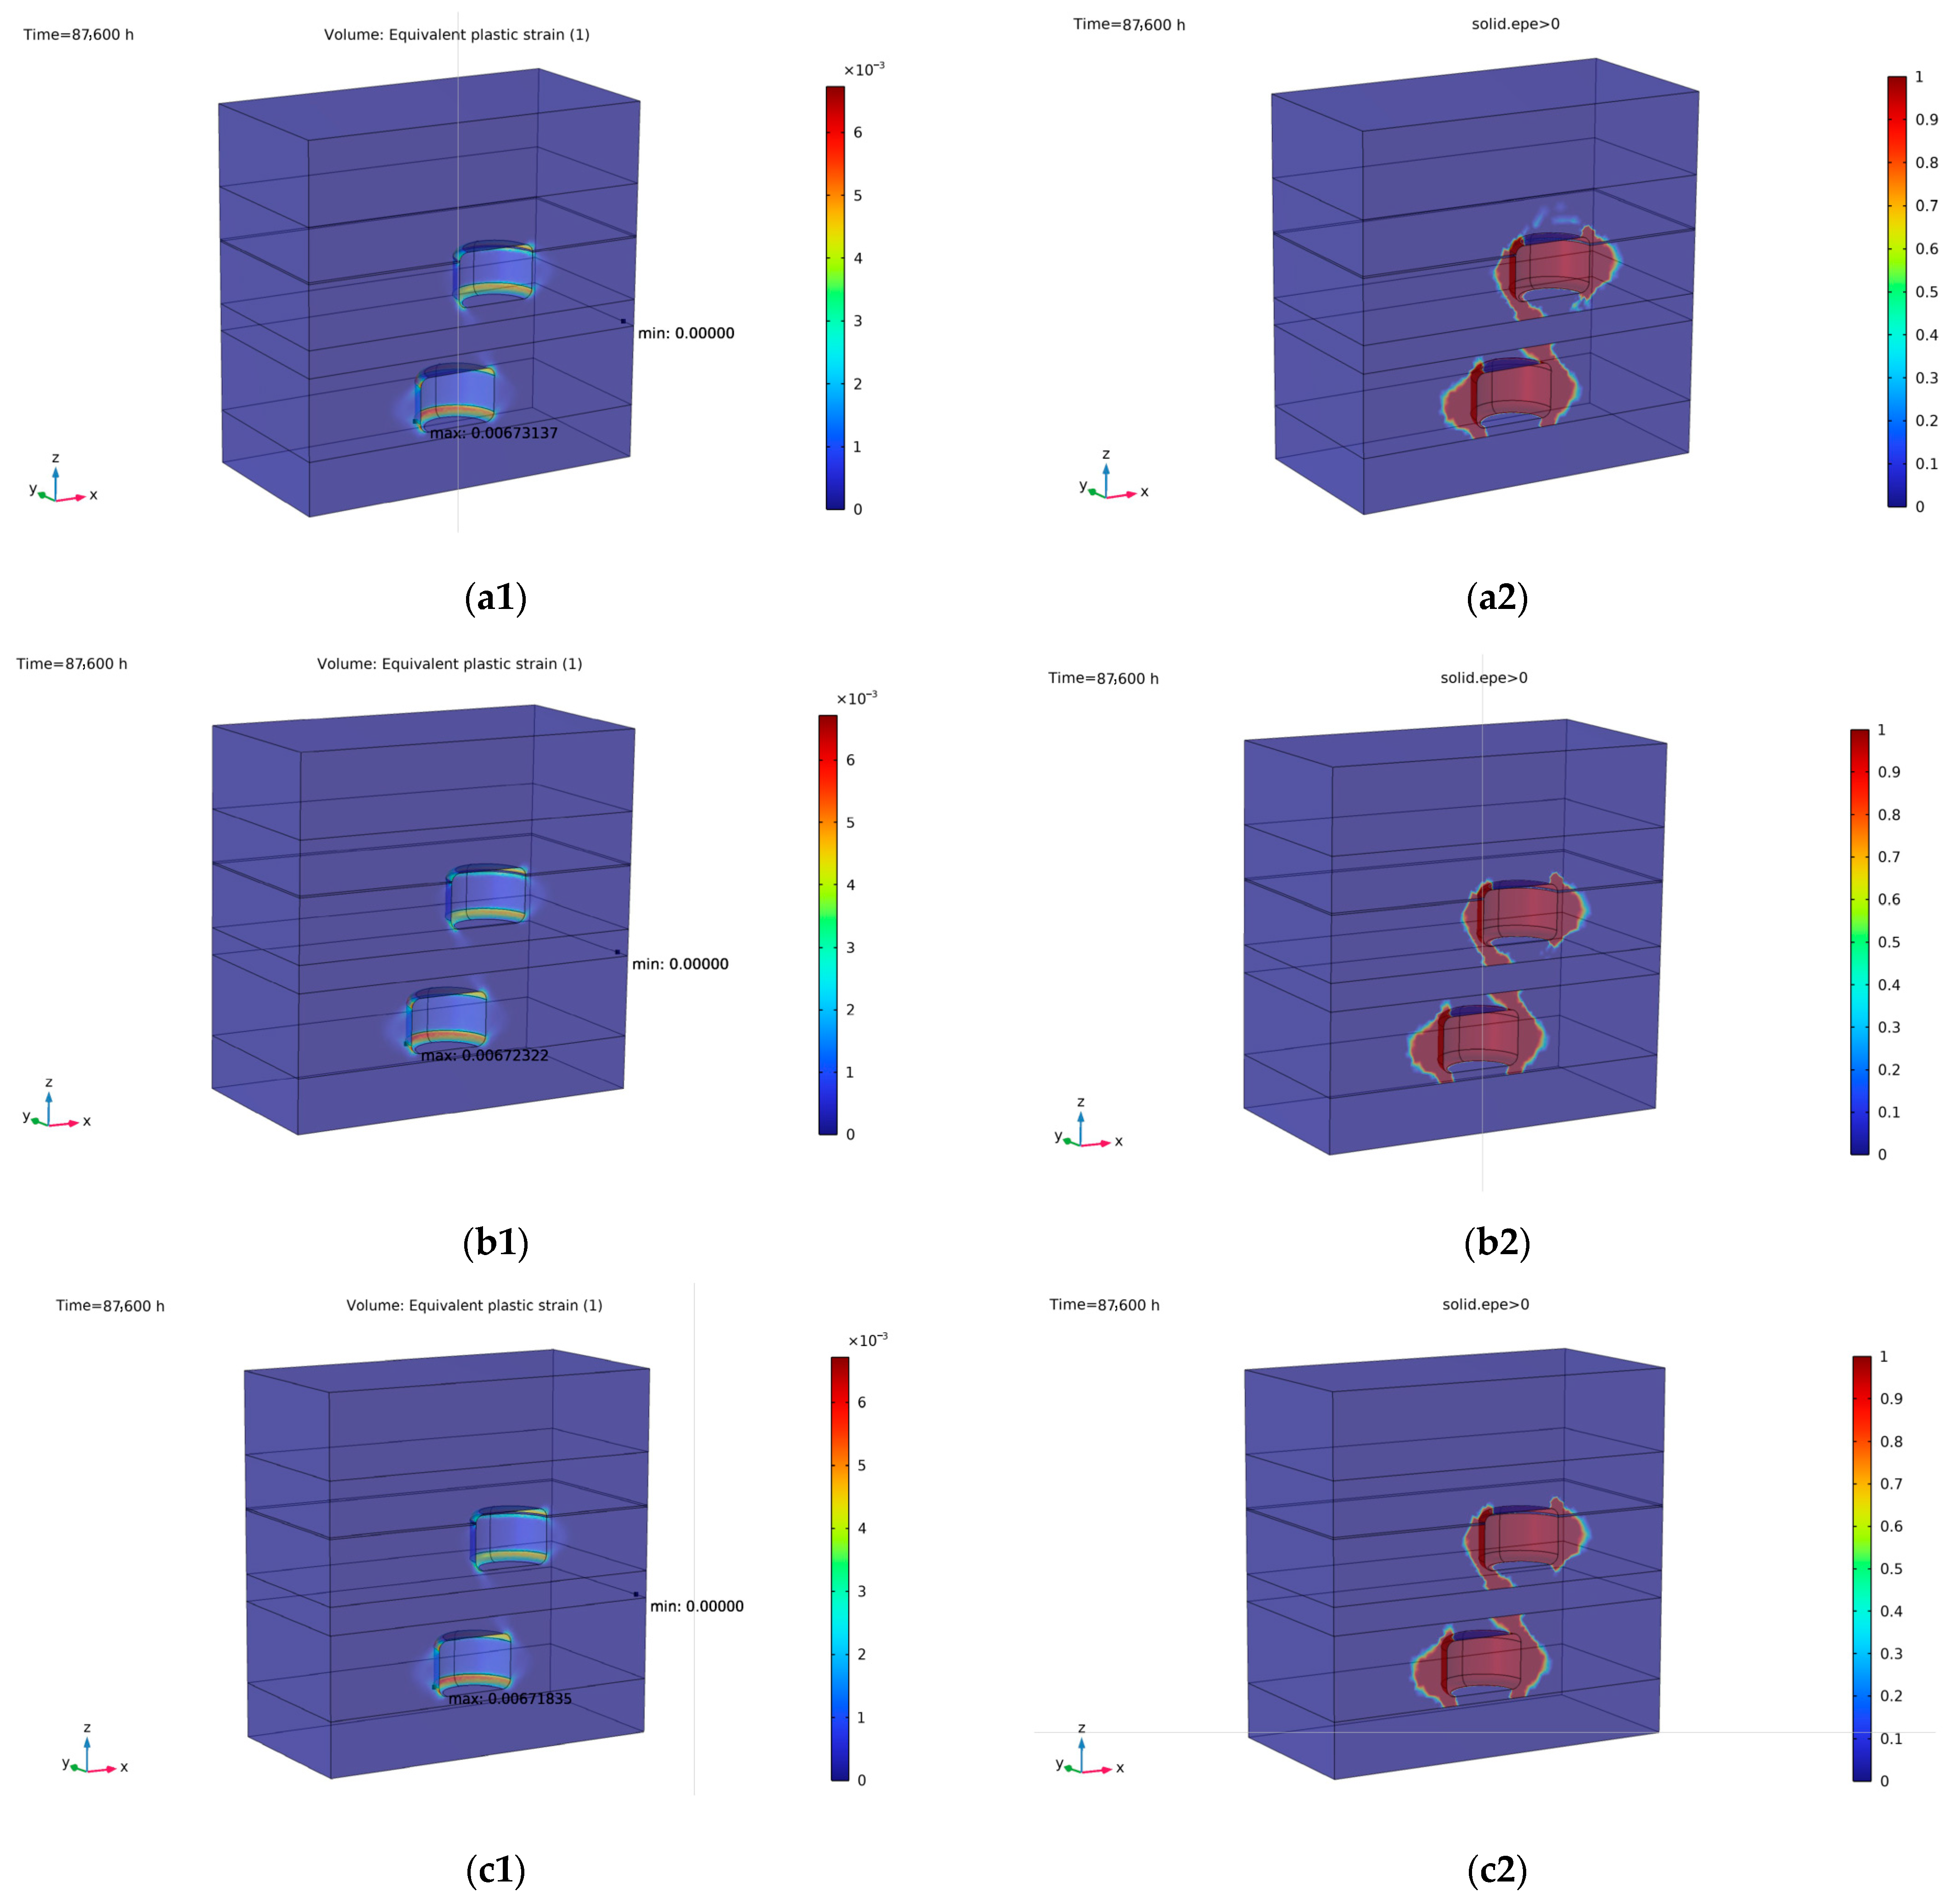
Figure 8 presents the modeling results of equivalent plastic strain.
According to the simulation results, all three pressure sets exhibit only minor plastic deformation. In all cases, the maximum plastic strain is below 0.7%, substantially lower than the commonly accepted engineering limit of 3%, confirming the system’s stability and structural integrity [
39]. The plastic zones are primarily confined to the cavern walls and propagate into the surrounding salt formation, as the cavern walls exhibit more pronounced inward extrusion compared to the roof and floor. The lower cavern shows a higher overall plastic strain than the upper cavern. This is attributed to its greater burial depth, which subjects it to higher in situ stress and necessitates a greater working pressure for brine extraction, resulting in an elevated stress field and thus increased plastic deformation.
As the minimum working pressure increases, the maximum plastic strain exhibits a slight upward trend. However, this increase is negligible, with a difference of less than 0.1%, and the extent of the plastic zone remains nearly unchanged across the three cases. The only exception is the scenario with a minimum working pressure of 0.2 σv, where the plastic zone slightly expands into the salt mass near the upper cavern roof. This indicates that the minimum working pressure has limited influence on plastic deformation development.
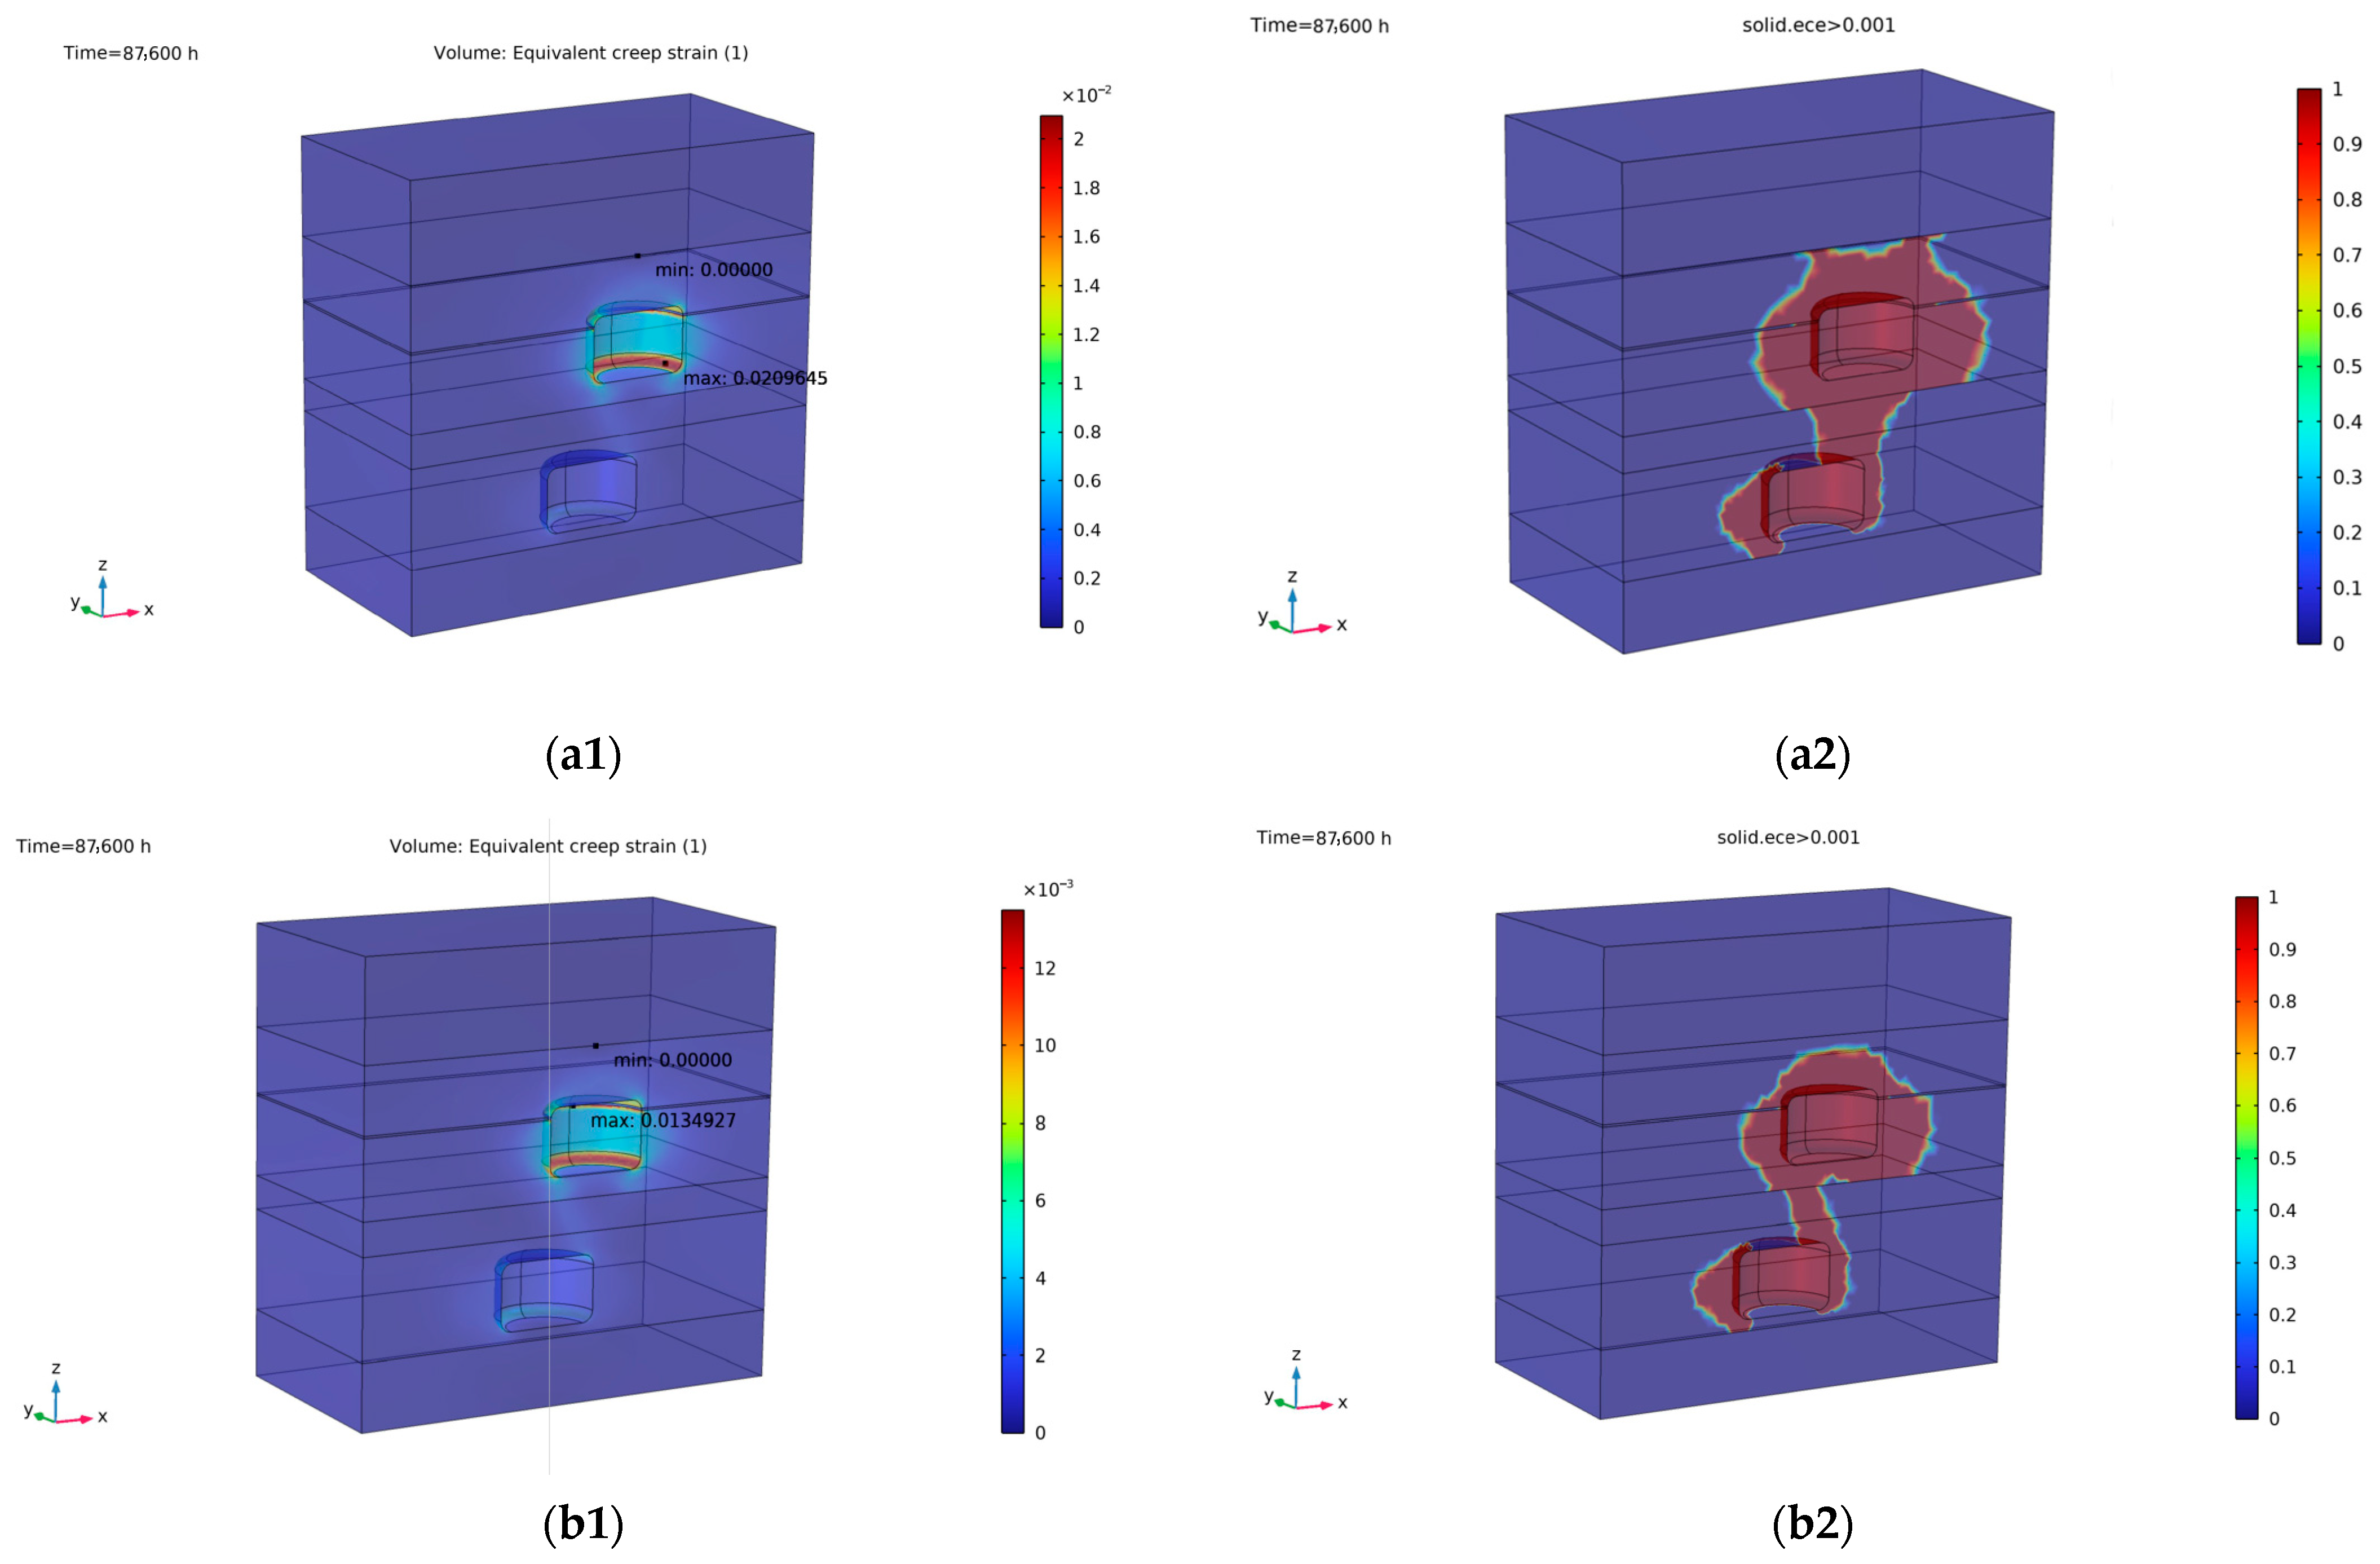
Figure 9 presents the modeling results of equivalent creep strain.
Unlike plastic deformation, creep deformation exhibits a pronounced sensitivity to variations in minimum working pressure. The creep strain is predominantly concentrated near the cavern floor and in the salt mass adjacent to the shale interlayer, with the highest values occurring at the shale interface. In all simulated scenarios, the overall deformation pattern indicates stable structural behavior over the 10-year period. A clear decreasing trend in maximum creep strain is observed as the minimum working pressure increases. Specifically, when the minimum working pressure decreases from 0.4 σv to 0.3 σv, while the maximum creep strain increases from 0.86% to 1.35% and further rises markedly to 2.1% when the pressure drops to 0.2 σv. This sharp increase reflects an accelerated creep response, suggesting the presence of a pressure threshold below which creep deformation intensifies, potentially affecting long-term cavern stability and shortening the operational lifespan of the system.
Using a creep strain threshold of 0.001 to define the onset of the creep zone, the simulation results show that creep deformation is primarily concentrated in the salt mass surrounding the lower cavern sidewalls and extends throughout the upper cavern, with the two zones connected through the intervening limestone layer. As the minimum working pressure decreases, the creep zone rapidly expands into the surrounding salt formation. When the minimum pressure is reduced to 0.3 σv, the creep zone propagates into the shale interlayer, and at 0.2 σv, it extends to the upper boundary of the entire salt formation. This further indicates the great impact minimum working pressure has on creep deformation around cavern.
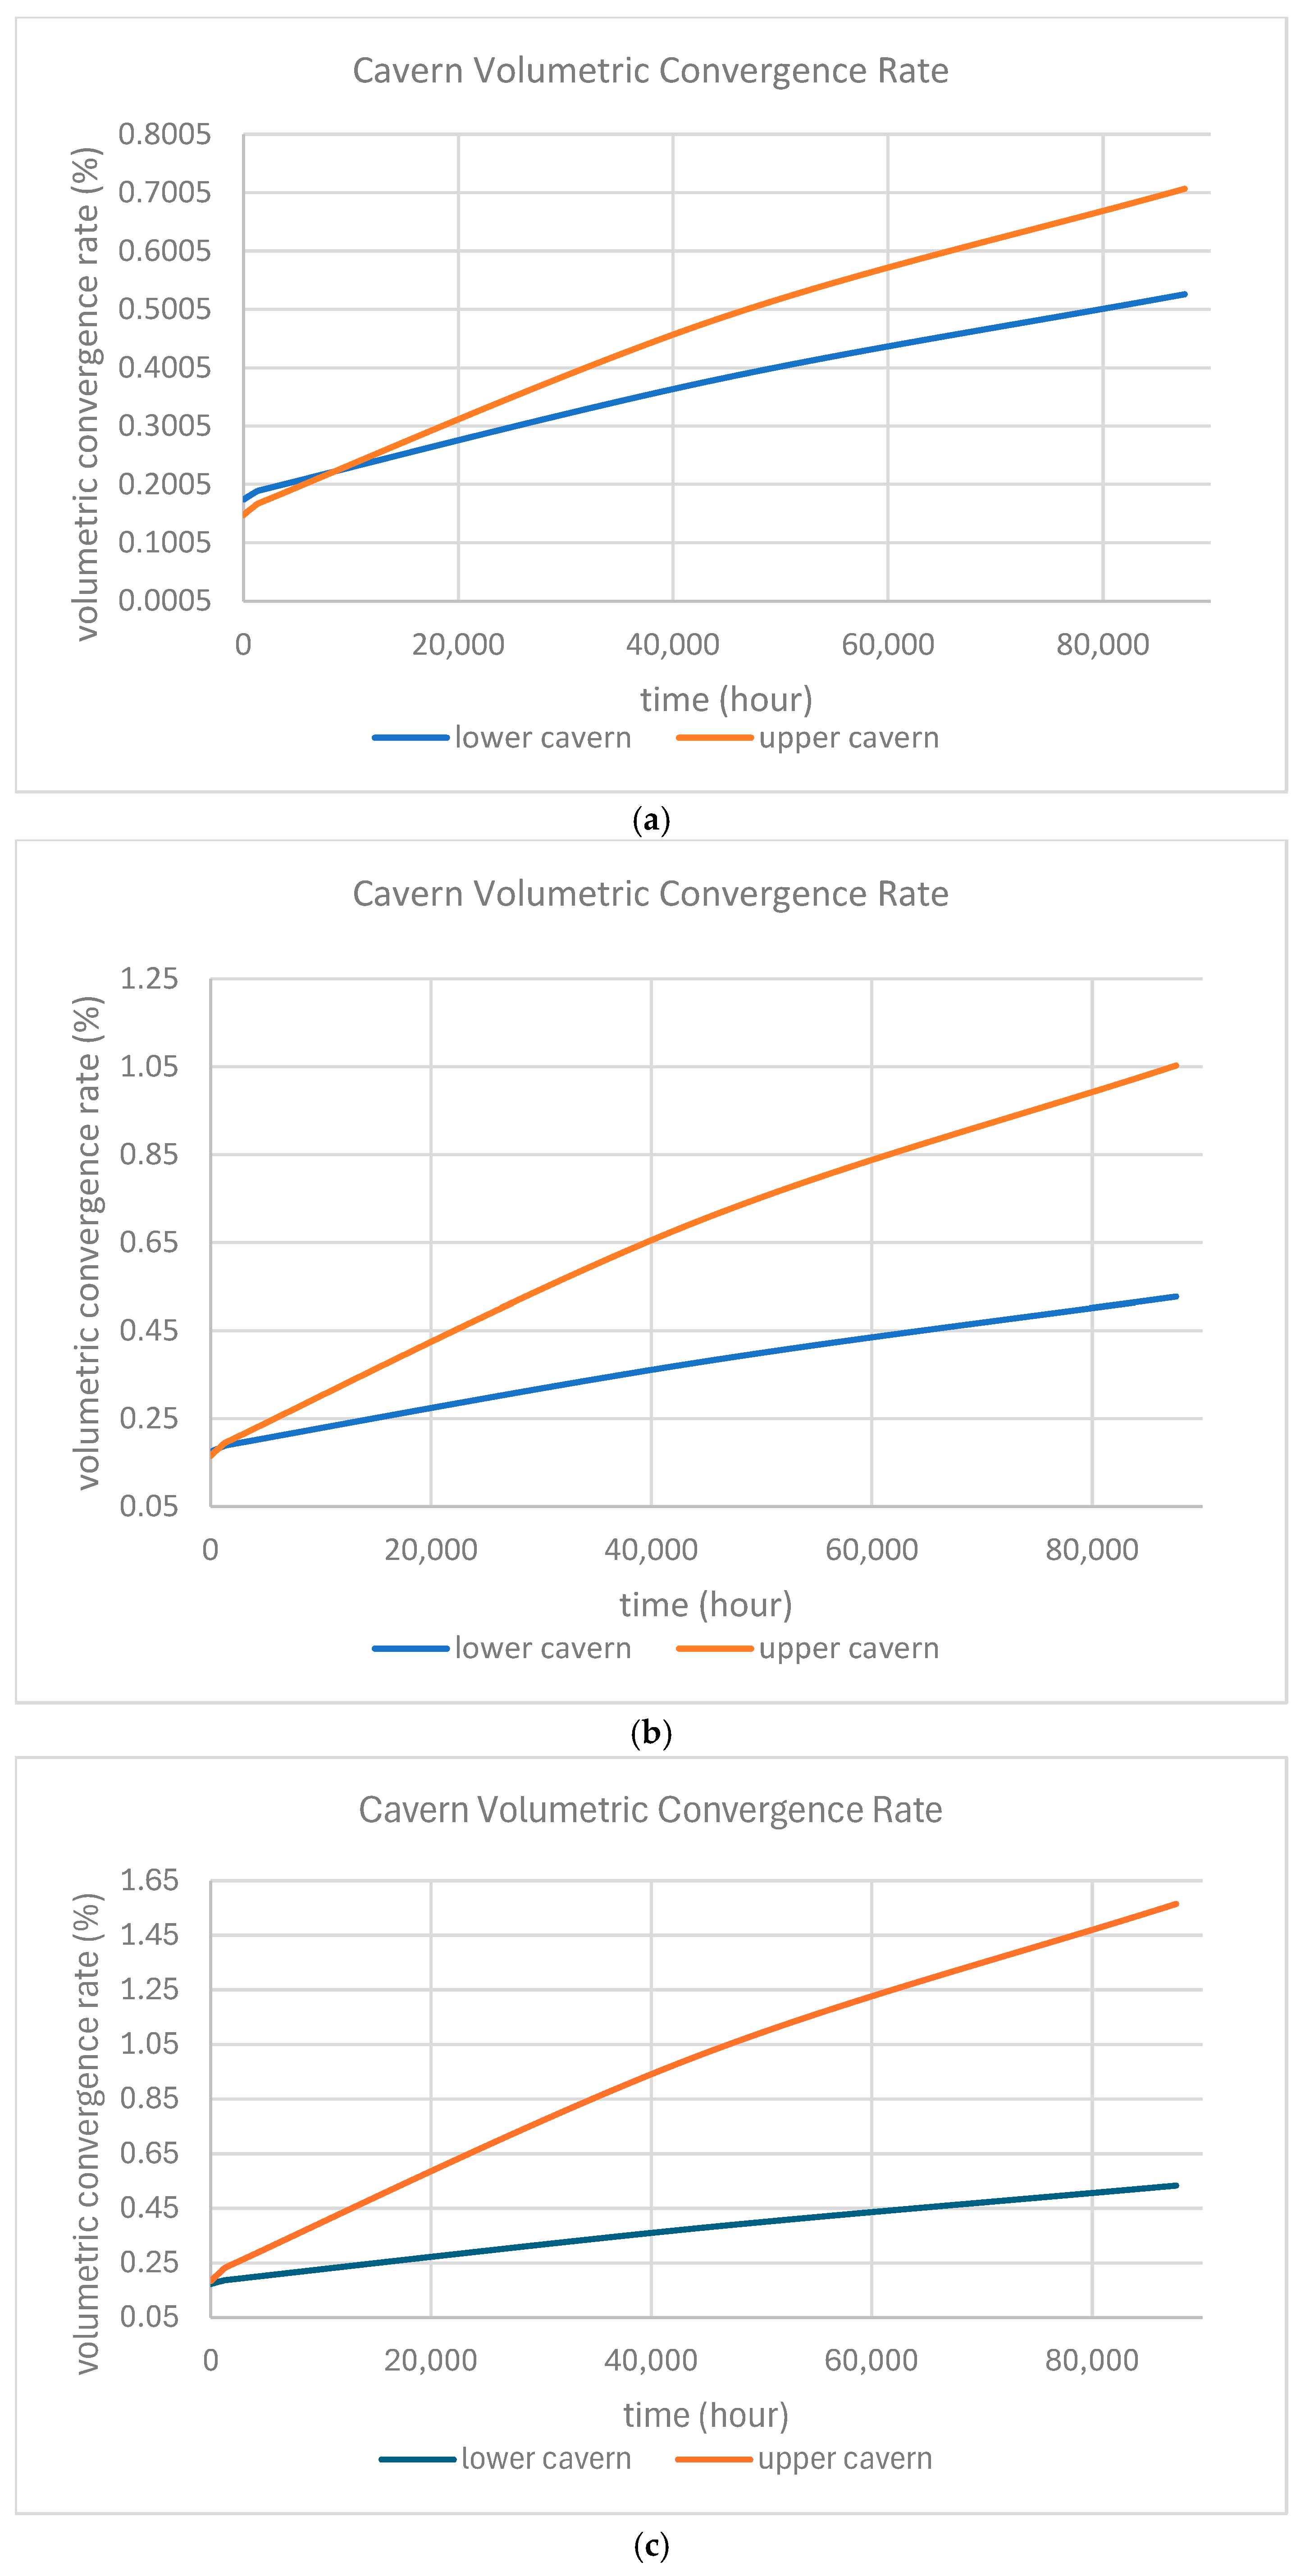
Figure 10 presents the modeling results of volumetric convergence rate.
After 10 years of cycling, both caverns exhibit only minor volumetric shrinkage. A decrease in minimum working pressure leads to an increase in convergence rate, but the magnitude remains low, with the maximum shrinkage not exceeding 1.6% over the simulation period. This value is well within commonly cited engineering criteria for long-term salt cavern stability, which typically recommend limiting volumetric convergence to approximately 1% per year or less for underground energy storage applications [
39]. The convergence–time curves display a clear turning point—an initial rapid increase in shrinkage rate during the early stage, followed by a slowdown and eventual stabilization, indicating that the surrounding salt mass has entered the secondary creep stage. The influence of minimum working pressure is less pronounced for the lower cavern, owing to the higher in situ stress associated with its greater burial depth.
Based on the simulation results, the optimized minimum working pressure is recommended to be around 0.3 σv. Below this threshold, the maximum creep strain slightly exceeds the recommended limit, and the rapid increase in creep deformation poses a potential long-term structural risk. Although the scenario with a minimum working pressure of 0.3 σv demonstrates the highest structural stability, it does not fully utilize the storage capacity of the caverns, and the elevated working pressure results in increased energy consumption.
6. Conclusions
The simulations confirm that small-scale UPHS caverns in the Salina Formation can maintain long-term geomechanical stability under the tested operating conditions. Across all scenarios, creep deformation remains low, and plastic strain stays well within the 3% engineering limit. A minimum working pressure of approximately 0.3 σv achieves the best balance between storage capacity and deformation control, with a 10-year volumetric convergence of 1.4%. At this operating point, the system can store 6.3 MWh per 24 h cycle, sufficient for supplying 210–315 Ontario households, demonstrating the strong potential of the formation for underground energy storage. The observed deformation trends are consistent with well-established physical models of salt behavior. The initial stress redistribution and plastic zones can be explained by the Mohr–Coulomb criterion, while the long-term volumetric convergence follows the kinetics of time-dependent creep described by the Norton–Bailey law. The reduction in creep strain with higher minimum pressure reflects the stress–strain sensitivity of halite rheology. This study provides the first coupled elasto-plastic and creep assessment of UPHS caverns in the Salina Formation of Southern Ontario, offering new insight into the region’s potential for underground energy storage and a framework that can inform future investigations in similar sedimentary basins.
The predicted deformations are minimal, with convergence rates commonly well below 1% per year stability criterion, indicating a substantial stability margin. This conservatism is partly due to model simplifications, including the exclusion of temperature effects, formation heterogeneity, and pre-existing microfractures, which, in reality, could increase creep rates or induce localized instability. While these assumptions may understate potential deformation, the results nonetheless provide valuable guidance for preliminary design and operational planning, demonstrating the strong potential of the Salina Formation for UPHS development. In addition, the proposed operating strategy was assessed under typical Salina Group conditions, without explicitly testing more extreme mining environments. In deep-seam, high-pressure settings, or in formations with high particulate or impurity concentrations, salt creep may accelerate, and stress redistribution could differ significantly from the present results. Future work should incorporate the excluded factors and investigate enhanced operational strategies, such as larger cavern geometries, higher cycling frequencies, and multi-cavern network configurations, to maximize storage capacity. The modeling framework will also be extended to incorporate higher burial depths and elevated stress regimes. Incorporating internal flow dynamics during charging and discharging will also allow for more realistic stress–strain interactions and optimization of injection and withdrawal rates.
