Article

Geotechnical Design of Barrier Pillar Between Boxcut and Underground Mining for Shallow Dipping Orebodies: A Case Study

1
Laboratory of Rock Engineering and Mining Machinery, Graduate School of Engineering, Kyushu University, Fukuoka 819-0395, Japan
2
Department of Mining, Materials and Petroleum Engineering, Jomo Kenyatta University of Agriculture and Technology, Nairobi P.O. Box 620000-00200, Kenya
*
Author to whom correspondence should be addressed.
Mining 2025, 5(3), 56; https://doi.org/10.3390/mining5030056
Submission received: 15 June 2025 / Revised: 28 July 2025 / Accepted: 3 September 2025 / Published: 10 September 2025

Abstract

A barrier pillar between the surface and underground mining sections provides a critical buffer zone in the transition from the boxcut highwall to underground sections by isolating stress fields from underground sections and preventing them from affecting the boxcut highwall slope. In this study, an empirical scaled span method and Rocscience RS2 software were used to conduct parametric studies on key parameters for designing barrier pillars and analyzing the room and pillar design for a planned underground mine on the Great Dyke, Zimbabwe. The approach included analyzing the effect of barrier pillar width, assuming a 10° dipping angle of the orebody, with room and pillar dimensions of 7 m and 6 m, respectively. The impact on boxcut slope stability and the roof of the first stope was monitored. The stability of the barrier pillar was analyzed for varying widths (6 m, 10 m, 20 m, 30 m, and 40 m) and orebody dipping angles (0°, 10°, 20°, 30°, and 40°). The effect of deteriorated rock mass conditions, represented by Geological Strength Index (GSI) values from 30 to 50, was assessed. The optimum room and pillar design was evaluated against the planned 6 m pillar sizes. This comprehensive study aims to support the integrity and longevity of the critical structures of the mining operation.

1. Introduction

Mine access portals are developed within an existing open pit or in a specially developed boxcut to provide access to underground mines [1]. They are critical mine access excavations requiring rigorous design. In this case study, access to the orebody is established via a boxcut and decline system aligned with the orebody horizon. Therefore, it is imperative to leave a barrier pillar to serve as an unextracted buffer ore zone between the boxcut highwall excavated on the surface and the mining sections underground to ensure that there are no global instability problems during the transition. This barrier pillar fundamentally hosts the main service excavations, the access declines, which are punched at the boxcut highwall slope toe. Hence, the barrier pillar design should have a high enough stability factor throughout the life of mine to retain the pillar’s elasticity, as this ensures the structural integrity of the mine.
In designing regional pillars, a key consideration is ensuring sufficient strength to maintain an elastic state for the full duration of the mining operation. Yardmci [2] noted that the primary design parameter is the pillar width or thickness, similarly to crown pillar design. Ozbay et al. [3] recommended using barrier pillars with a width-to-height ratio exceeding 10 so that they remain stable under long-term loading conditions. However, in areas subjected to high stress levels or underlain by weak geological conditions, it is essential to assess foundation failure mechanisms, including footwall heave and punching. Ozbay et al. [3] also suggested incorporating unpayable zones like faults and potholes into these barrier pillars when possible, but cautioned against aligning these pillars with geological weaknesses or joint sets, as this could compromise their stability and induce large ground falls in stopes.
Current pillar design methodologies can be categorized into analytical methods, which encompass both empirical and analytical methods and numerical methods. The empirical and analytical methods are derived from statistical analyses of observations limited to the conditions that comprise a database of case studies. Their greatest limitation, highlighted by Mark [4], is that their applicability is generally constrained to the conditions represented in the original dataset and they offer a partial interpretation of the mechanics governing pillar performance. Different researchers have applied analytical, deterministic, and numerical methods in designing these pillars. Carter [5] developed the empirical method that is most commonly used to analyze boundary pillars, namely, the scaled span method. This method is mainly used to design crown pillars, with the objective of refining the charts with subsequent calculations derived from historical case study datasets, thereby enhancing its applicability as a practical analytical tool. Yardmci [2] studied crown pillars for iron ore mines, using the critical span method to determine the pillar width, and utilized the deterministic method for falling blocks to determine the safety factor for alternative thicknesses. The case was simulated using two-dimensional finite element analysis, Phase 2, and it was concluded that empirical and deterministic approaches resulted in a lower safety factor than numerical modelling. Zhao et al. [6] utilized the deterministic approach and the RFPA2D method to study the safety factor of a boundary pillar from the surface to underground for an iron ore deposit in China. The deterministic Limit Equilibrium approach revealed no difference in the safety factor of different pillars while failure still occurred in the pillars, highlighting the intrinsic limitations of the deterministic approach in handling material properties, irregular geometries, and different operations due to the use of simplified geomechanical models. Kumar et al. [7] carried out an analysis evaluating changes in the depth and width of the orebody and different crown pillar thicknesses, considering various rock mass conditions (GSI, UCS, and E) for steep dipping orebodies, and developed a multivariate regression model, which can be used for designing pillars under diverse geotechnical conditions. Dintwe et al. [8] used FLAC3D numerical simulation to design the crown pillar used for transitioning from the surface to underground in sublevel open stoping at the Zuuntsagaan Del fluorite mine.
Designing underground mine pillars and assessing rock mass behaviour is complex due to varying orebody characteristics, mining methods, geometries, anisotropy, inhomogeneity, and changing geo-mining-induced stress conditions [9,10]. Numerical modelling offers an alternative approach for addressing the limitations of empirical and analytical approaches, with the advantage that numerical models have the capacity to assess pillar performance across a range of geometric layouts and rock mass conditions [4].
The case study mine is situated on the Great Dyke, Zimbabwe, on ground characterized by discontinuities including faults and joints. At this site, the inclination of the orebody creates geotechnical challenges in designing the mine access boxcut, the declines, the barrier pillar between the surface, and the room and pillar underground mining sections. Dzimunya et al. [11] highlighted the prevalence of poor ground conditions on the shallow parts of the Great Dyke deposits, and steep dips are emphasized as some of the challenges in designing pillars. Therefore, this study seeks to employ the RS2 Finite Element Method to design a barrier pillar situated between the boxcut highwall and the underground section under the outlined geological conditions.

2. Engineering Background

2.1. Regional Geology

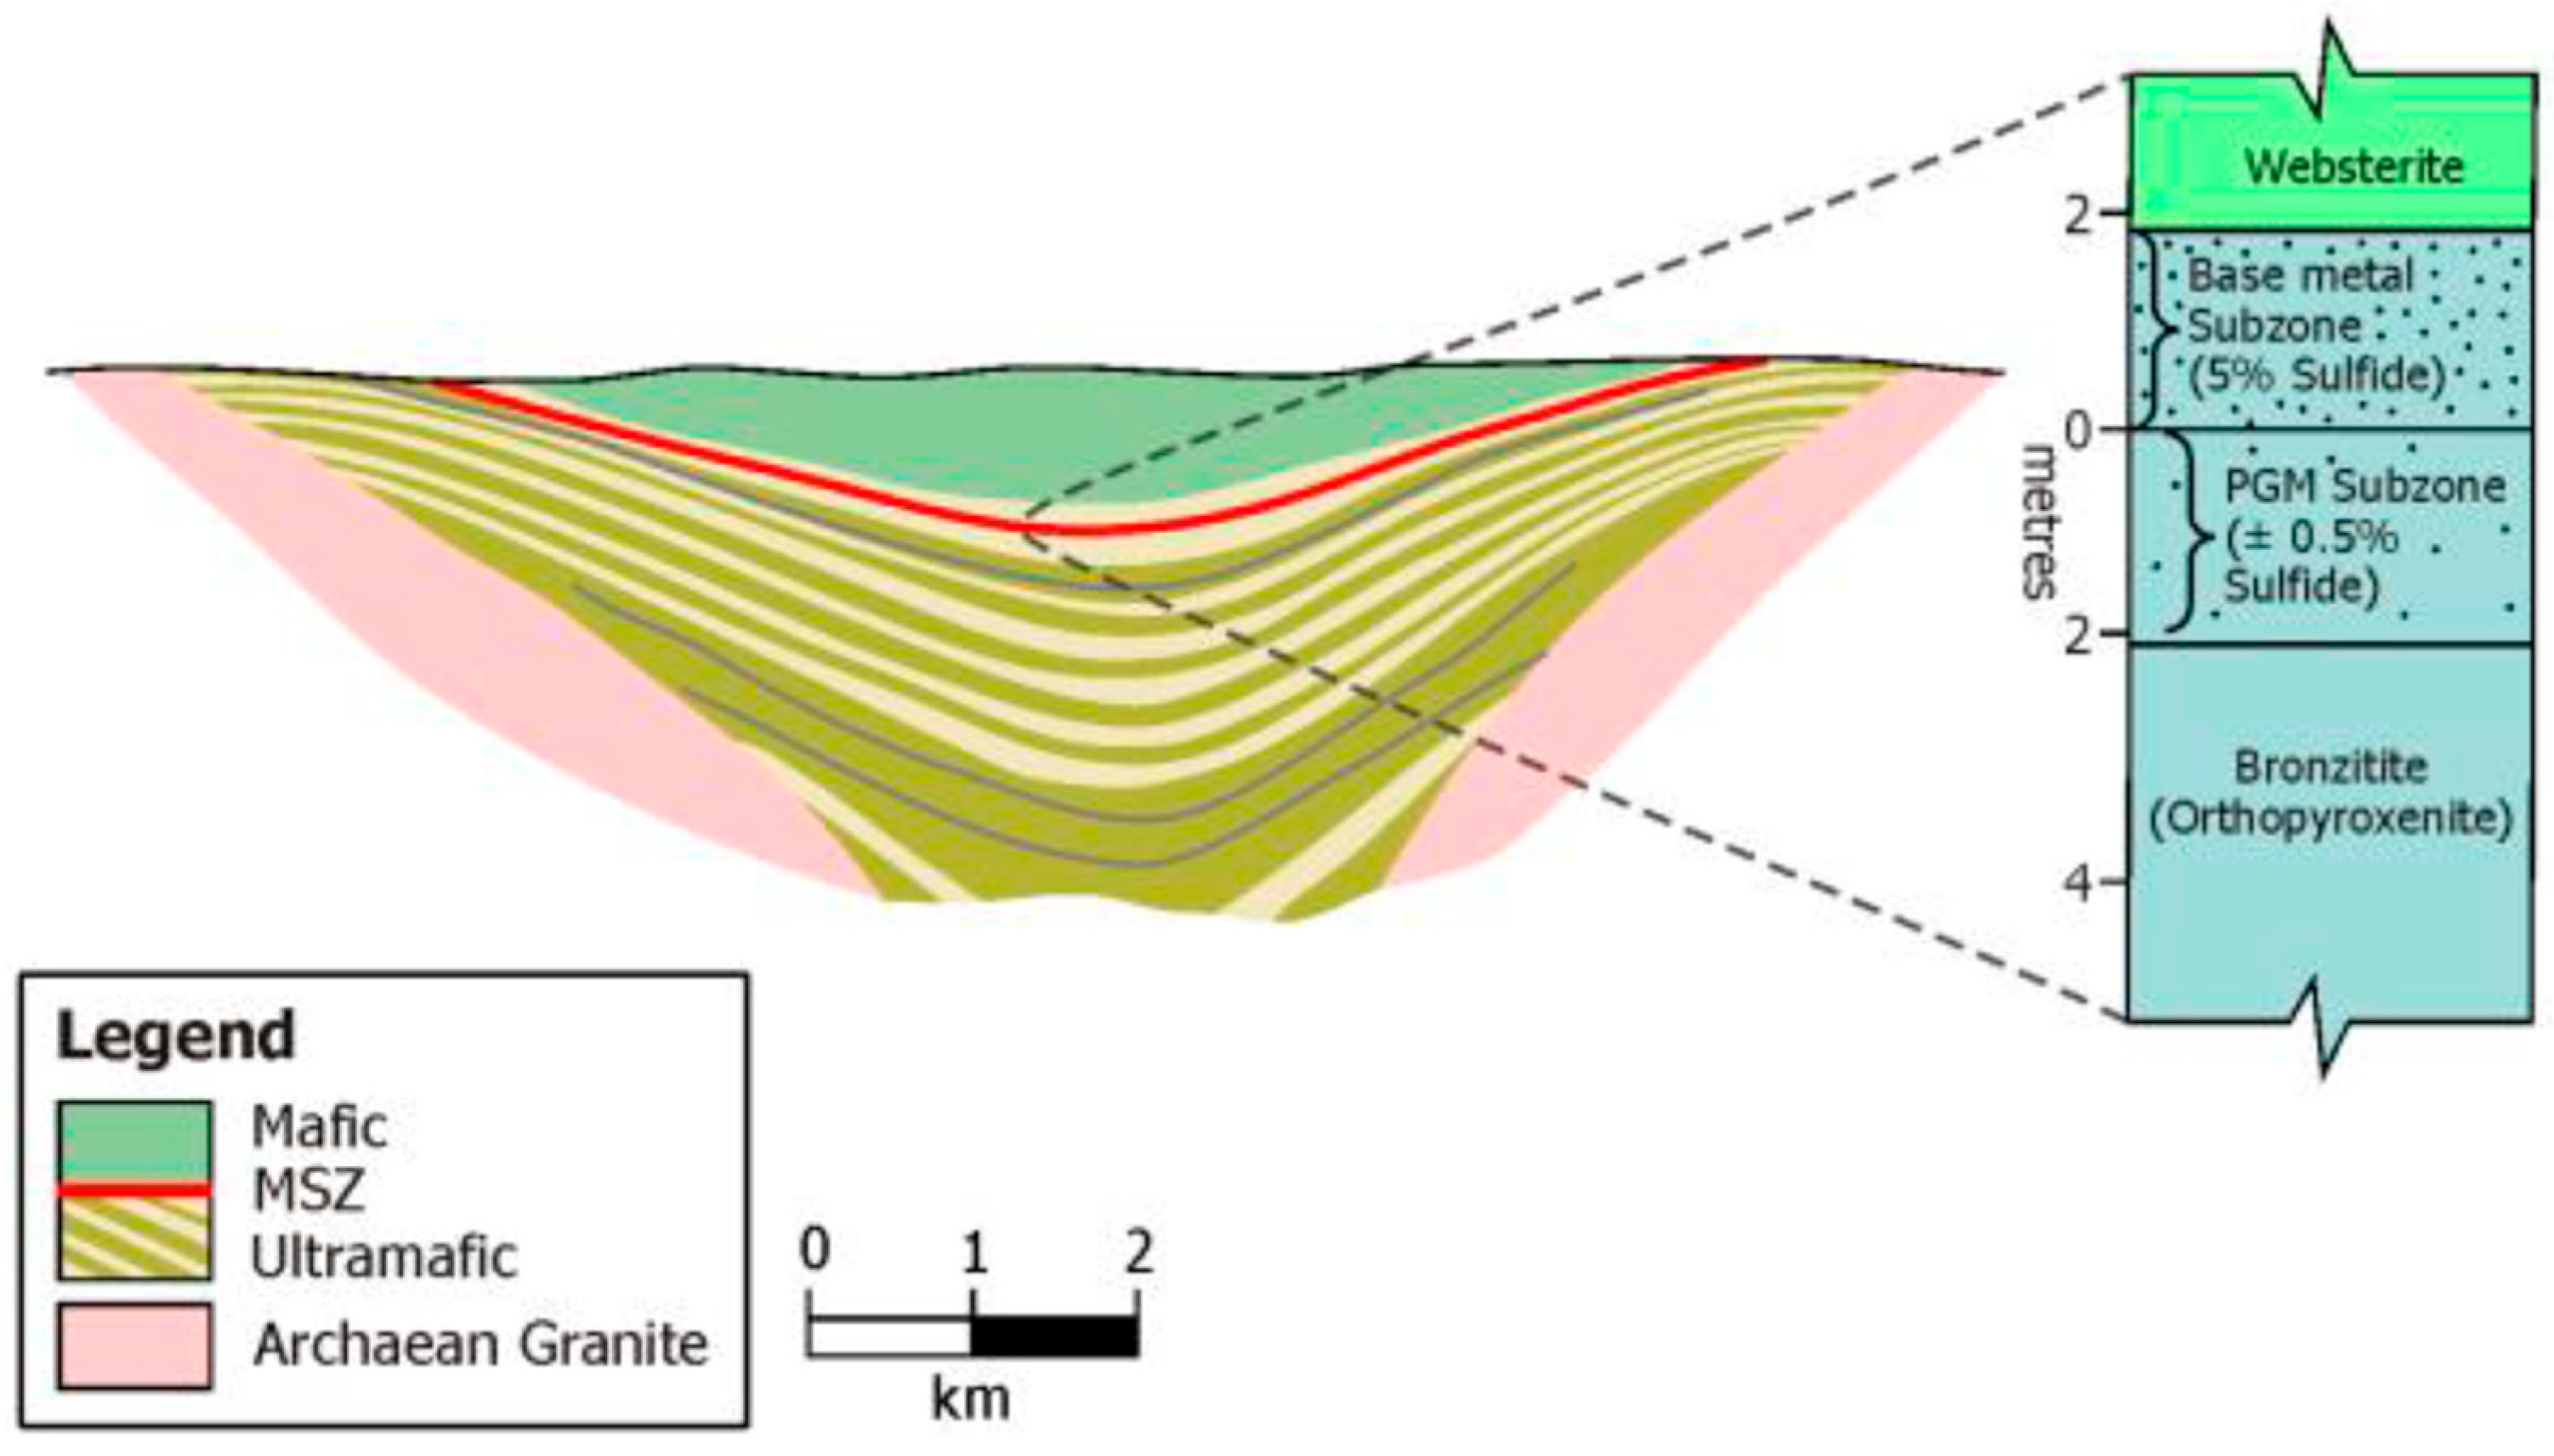
The study area is located within Zimbabwe’s Great Dyke, a major geological feature illustrated in Figure 1. Oberthur [12] highlighted that this formation represents the second-largest global repository of Platinum Group Metals (PGMs), ranking only after South Africa’s Bushveld Complex. According to Wilson and Prendergast [13], longitudinally, it comprises a long intrusion composed of a line of narrow magma chambers and sub-chambers that extends for approximately 550 km in a north–northeast strike, with its width varying between about 4 and 11 km. In cross-section, it is a layered intrusion that is stratigraphically subdivided into a lower ultramafic sequence and the overlying mafic sequence [12,13,14,15]. Li et al. [15] noted that the mineralized main sulphide zone (MSZ), which hosts economic concentrations of PGMs, gold, nickel, copper, and cobalt, is located near the transition between these two sequences. It occurs within bronzitite, just beneath websterite, which marks the top of the ultramafic sequence, as indicated in Figure 2.

2.2. Case Study Mine Geology and Structures

The deposit structure consists of an open synform plunging gently to the south and dipping inwards at dips of around 10°, but locally, dips may be up to 25°. The synform is divided into a series of blocks by a number of east–southeast striking faults. The main sulphide zone (MSZ) has been intruded in several places by younger dolerite dykes and sills and pegmatite veins. In addition to the major east–southeast trending faults, sympathetic faulting and jointing is observed, affecting rock mass conditions. Figure 2 above illustrates the general stratigraphic layering of the deposit, highlighting the mafic, ultramafic, and MSZ, and the orebody lying between websterite and bronzitite.

2.3. Rock Strength and Rock Mass Classification

The laboratory test results obtained from previous studies conducted at the case study site are presented in Table 1 and the estimated properties of the rock mass were derived from observed GSI values at the mine site. The GSI of the rock mass was considered to be between 50 and 30 from three different boreholes located in the study area, and the groundwater conditions were assumed to be dry.

2.4. Planned Mining Method

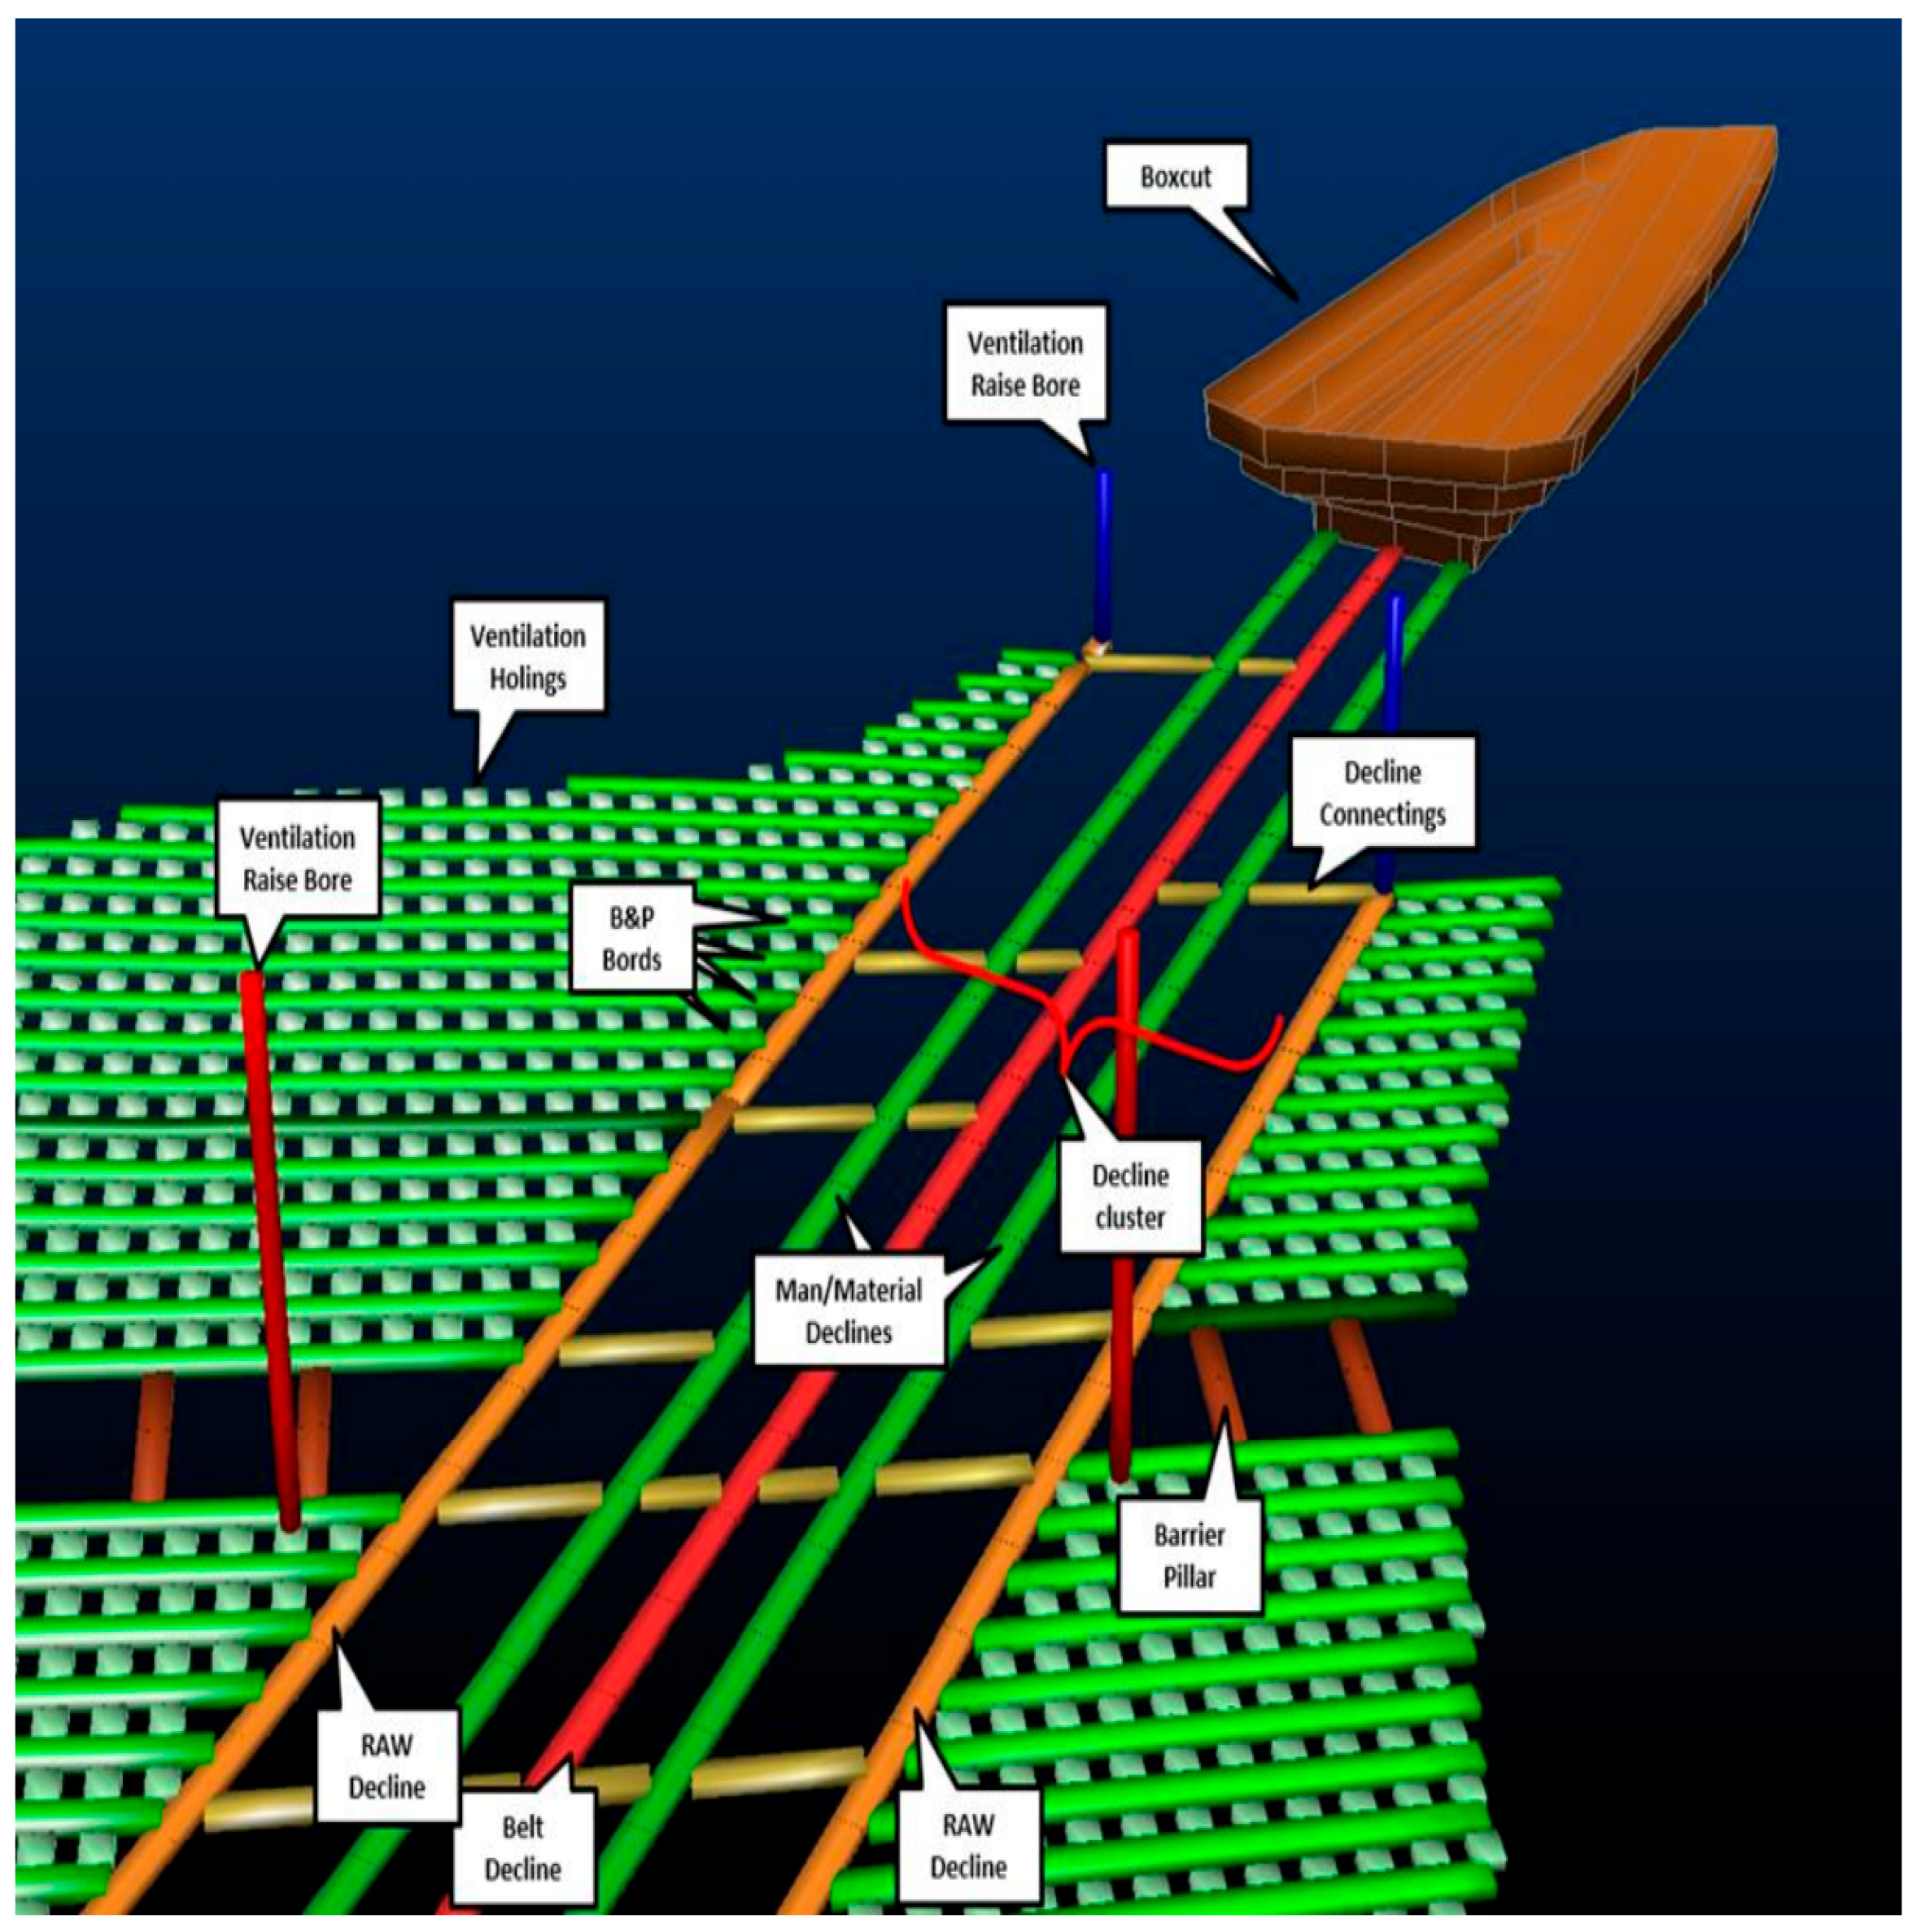
The planned mining operation, the layout of which is depicted in Figure 3, is a mechanized room and pillar mining project estimated to run for 30 years of the mine’s lifetime. The orebody exhibits a gentle dip, starting at approximately 10° on the western limb and becoming nearly horizontal at the base of the syncline. Access to the orebody will be established via a boxcut and decline system aligned with the orebody horizon, and the rooms and pillars will be developed from the decline system. The room and pillar section will be characterized by 7 m wide rooms and 6 m wide pillars, and the excavation heights will range between 2 m and 2.75 m based on the development of the mining block. In this study, a mining block with an extraction height of 2.5 m is considered.

3. Empirical Analysis Method

Empirical assessment techniques are frequently utilized to evaluate the stability of the surface barrier pillar. In earlier practice, these pillars were typically designed based on simple rule-of-thumb guidelines, which often proved inadequate, as evidenced by numerous failures [16]. As a result, efforts have been made to develop empirical design methods based on back-analyses of past failures and a review of previous experience.
Due to the limitations of the rule-of-thumb designs, the scaled span method proposed by Carter [16] has become the predominant approach for crown pillar stability evaluation. This method was formulated through a back-analysis of historical failures and a review of precedent cases, drawing from comprehensive databases with details on crown pillar geometry, rock mass quality, and stability performance [5,16,17]. Carter [5,13] defined scaled span (Cs) as a parameter describing crown pillar geometry, as shown by Formula (1).
C s = S γ T 1 + S R 1 0.4 c o s θ 0.5
Here, S represents the crown pillar span (m), γ denotes the specific gravity, T is crown pillar thickness (m), θ   is the dip of the orebody, and S R refers to the span ratio, obtained via the crown pillar span divided by its strike length.
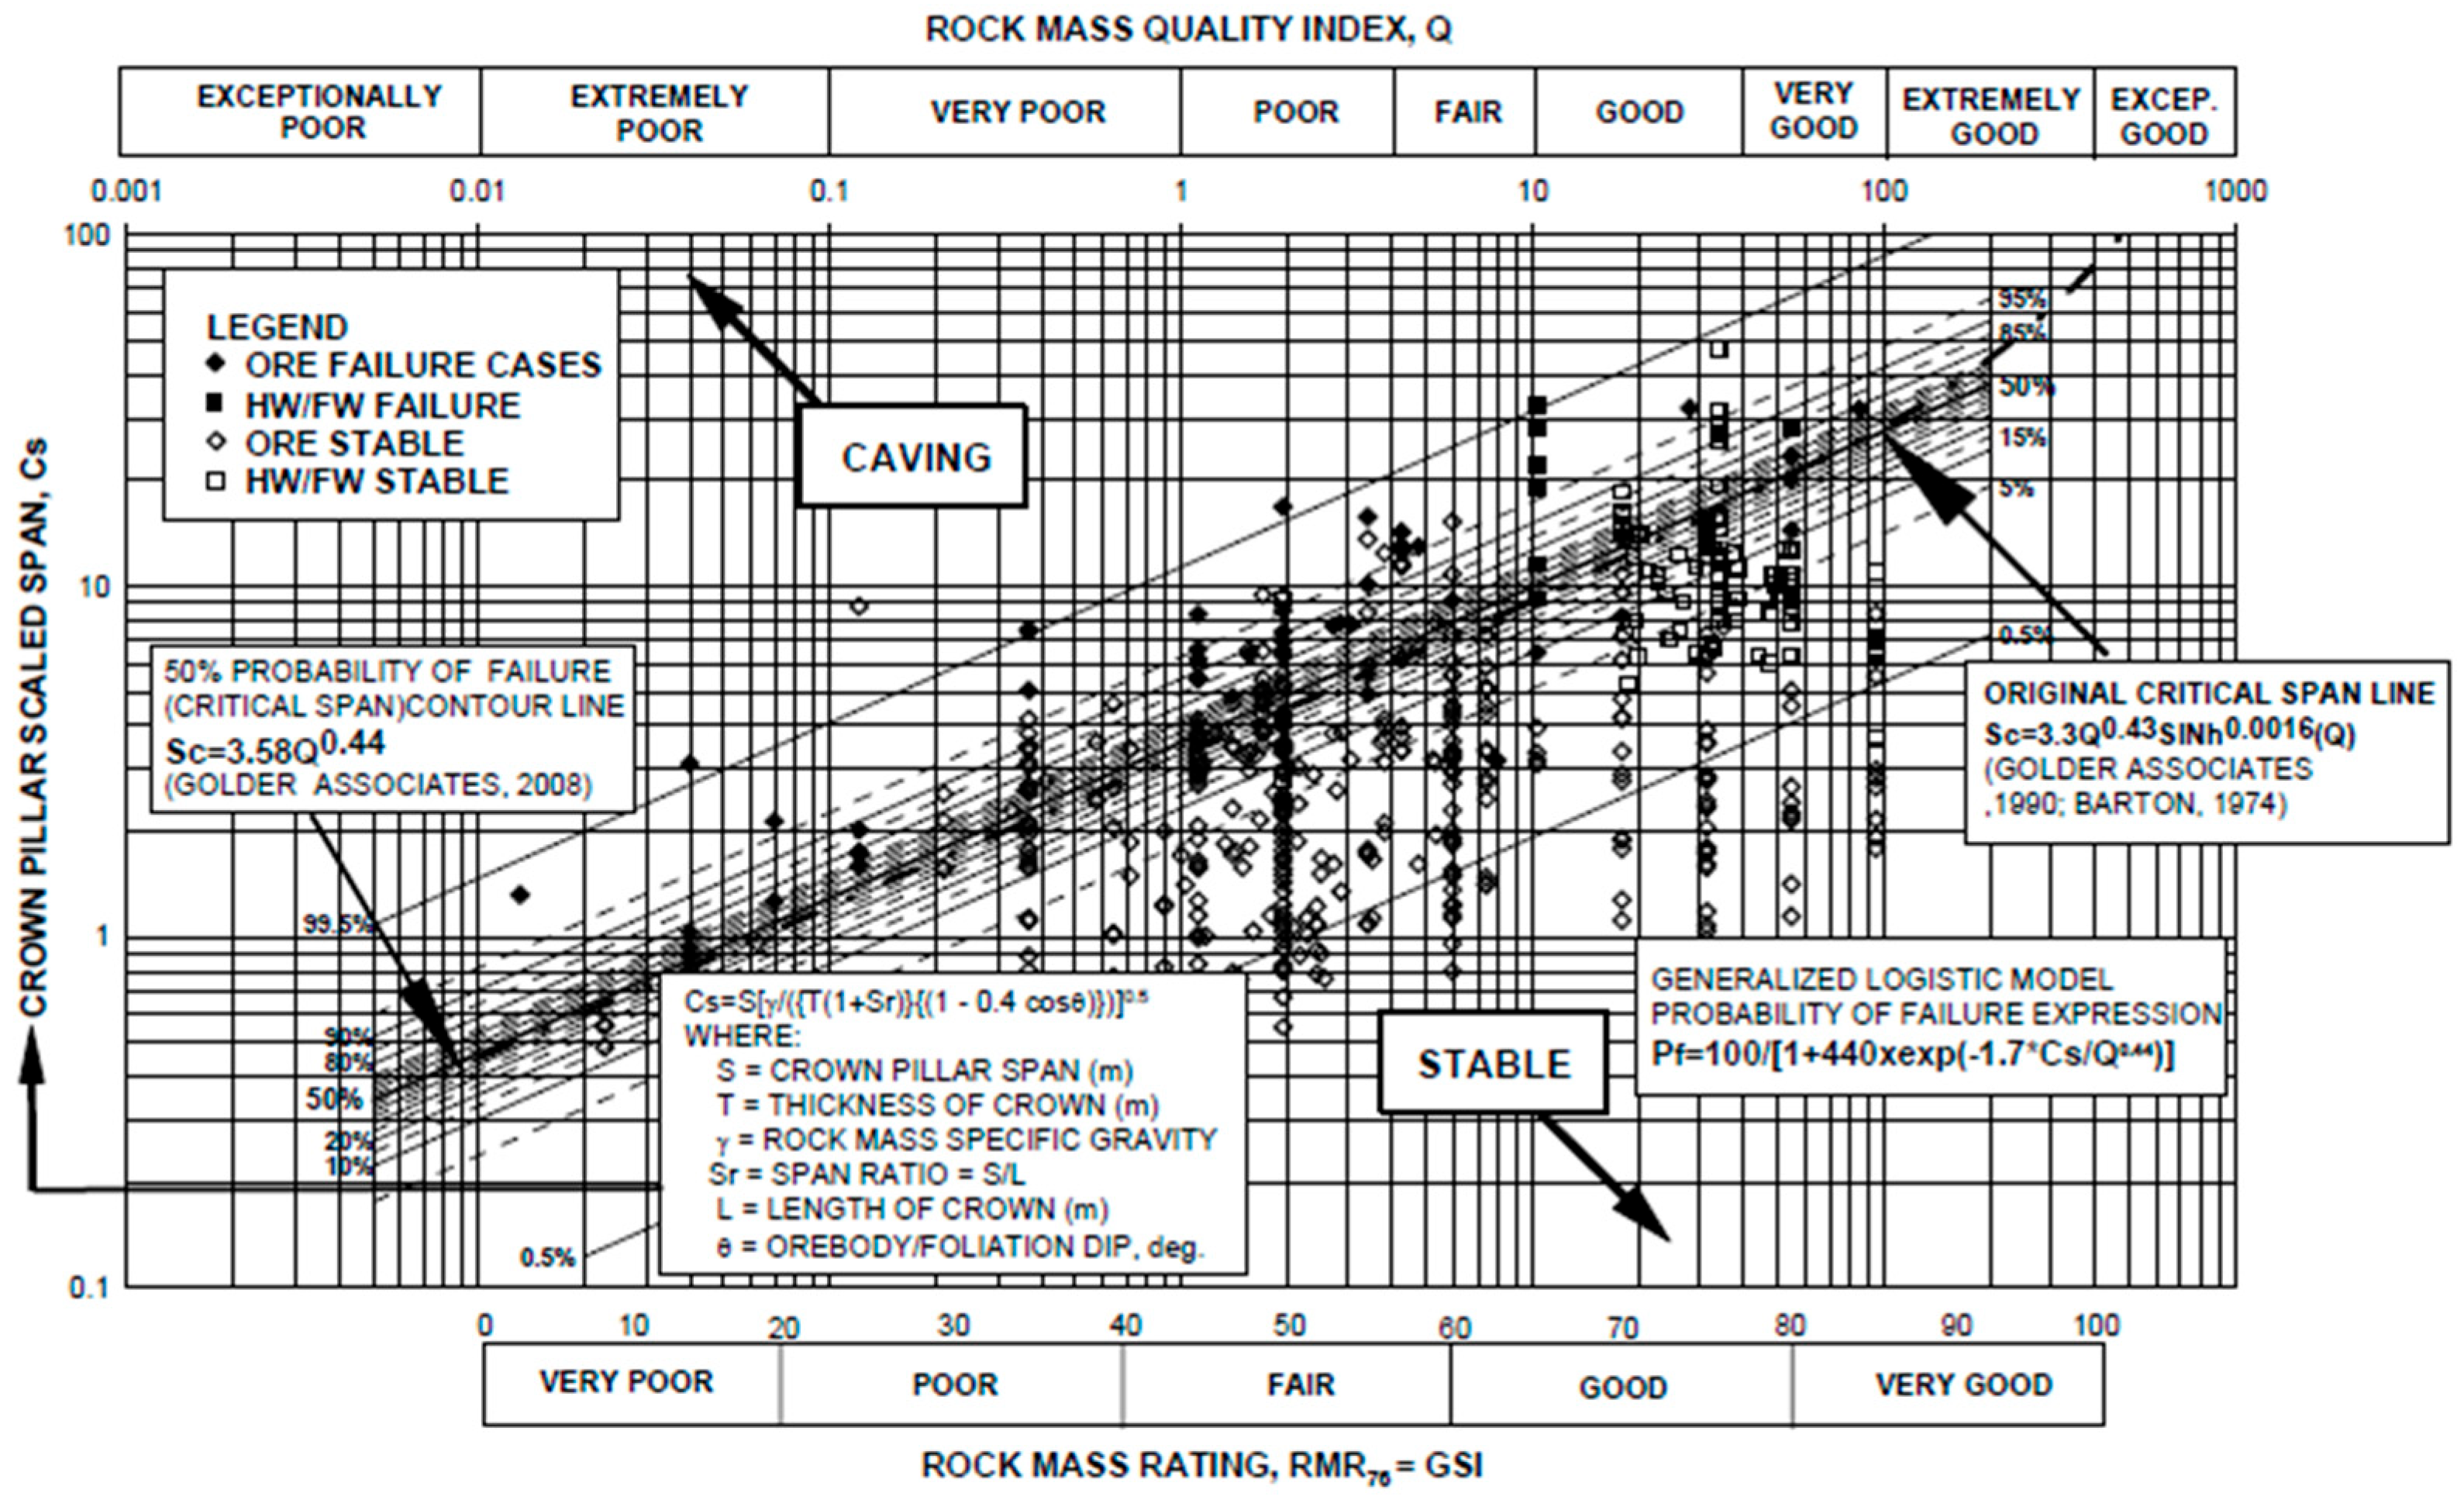
When considering rock mass quality, Figure 4 illustrates the updated scaled span chart [5], where field cases are plotted to corresponding rock mass qualities that allow the minimum stable thickness of a crown pillar to be determined from the calculated scaled span and the Q and RMR system. According to Carter [5,16], a critical scaled span, S c was plotted as a best-fit power regression curve, dividing the failed and stable case records to define where failure might occur; S c is calculated from Equation (2):
S c = 3.3 Q 0.43 × s i n h 0.0016 Q
Here, S c denotes the critical scaled span and Q represents the quality of the crown pillar’s rock mass, defined by the Q rock mass classification system. Under these conditions, the structural instability of the crown pillar is anticipated when the scaled span C s surpasses the critical span S c .
A guide was developed on acceptable risk exposure, shown in Table 2, with the pillars categorized into seven classes for the comparative significance of crown pillar failure [5]. Enslin [18] highlighted that when the acceptable risk level and anticipated standing time are determined, the critical span ( S c ) can be derived through the equations provided in the scaled span ( S c ) approach.
Figure 4. Updated scaled span method for estimating crown pillar thickness after Carter [5,19].
Mining 05 00056 g004
The case study mine has a life of 30 years; therefore, according to the risk assessment in Figure 4, it is classified as class E crown pillar. The scaled span C s is estimated in Equation (3). The Q value for the orebody at GSI 40 is utilized to compute the scaled span C s through the following expression:
C s = 1.84 × Q 0.44   =   1.84 × 3.58 0.44 = 3.22
By reformulating Equation (1) to Equation (4), shown below, the minimum crown pillar thickness can be calculated. Here, S represents the crown pillar span (m), γ denotes the specific gravity, T is the crown pillar thickness (m), θ   is the dip of the orebody, and S R refers to the span ratio, given by the crown pillar span divided by its strike length. For computations, a boxcut width of 120 m was adopted as the strike length of the crown pillar.
T m i n = γ s 2 C s 2 1 + S R 1 0.4 c o s θ = 3.3 × 7 2 3.22 2 1 + 0.058 1 0.4 c o s 10 = 16 m
The empirical approach using the scaled span method suggests a 16 m wide barrier for GSI 40 orebody rock mass conditions. Whilst the scaled span method is a very useful empirical approach, care should be taken as this method was derived from case studies and is mostly relevant to the regions where the data were obtained. It may not be suitable for other locations, as geological conditions are unique to each site and it is often challenging to generalize across different regions [16]. Numerical modelling offers an alternative approach for addressing the limitations of empirical and analytical approaches, with the advantage that numerical models have the capacity to evaluate pillar performance under varying geometric configurations and rock mass conditions [4].

4. Numerical Modelling

Jing [20] highlighted that numerical modelling approaches for solving rock engineering challenges can be grouped into three categories, which include continuum, discontinuum, and hybrid methods. Continuum-based methods consider the rock mass in the form a continuous medium, as highlighted by Zhang et al. [21]; common techniques in this category include the Finite Element Method (FEM), Finite Difference Method (FDM), and the Boundary Element Method (BEM) [20]. Lemos [22], in contrast, stated that discontinuum-based models explicitly highlight the effect of discontinuities; the rock mass is considered to be assemblies of interacting blocks segmented by discontinuities, which include joints, faults, or fractures. Key methods here include the Discrete Element Method (DEM), Discrete Fracture Network (DFN), and Discontinuous Deformation Analysis (DDA) [20,22]. The hybrid technique includes approaches such as FDM/DEM, FEM/DEM (FDEM), and BEM/DEM, which merge continuum analysis with discrete modelling to simulate contact mechanics, fracture propagation, and dynamic interactions [20,23,24]. In this study, the barrier pillar stability analysis employed parametric studies using a continuum FEM, RS2, assigning a generalized Hoek–Brown failure model, and the strength factor and displacement were used to assess the pillar’s stability parameters under different geometric and geological conditions.

4.1. Failure Criterion

In this numerical model, the generalized Hoek–Brown criterion was employed. As described by Hoek and Brown [25], this failure criterion is frequently applied in rock engineering models due to its integration of intact rock properties and discontinuities characterized by the geological strength index, GSI. Represented by Equation (5), Kaiser [26] emphasized that this empirical formulation reduces the strength of intact rock to reflect rock mass behaviour while maintaining the overall form of the strength envelop.
σ 1 = σ 3 + σ c i m b σ 3 σ c i + s a
The effective stresses σ 1 and σ 3 denote the maximum and minimum principal stresses, respectively, while σ c i represents the uniaxial compressive strength of the intact rock [25,27]. The constant m b is a reduced value for the intact rock constant m i , typically determined by triaxial tests, while s relates to friction angle and cohesion, and a signifies the failure envelope shape [25,28,29]. The empirical relationships used to compute these constants are dependent on GSI, mi, and D, given by Equations (6)–(8).
s = e G S I 100 9 3 D
m b = m i e G S I 100 28 14 D
a = 1 2 + 1 6 e G S I 15 e 20 15
Hoek et al. [28] emphasized that D, the disturbance factor, quantifies the extent of mechanical damage in the rock mass resulting from blasting or stress relaxation, and its values range from 0 for intact, undisturbed rock masses to 1 for severely disturbed conditions. A disturbance factor of 0 was assumed in the model based on the planned use of a controlled blasting technique aimed at minimizing disruption in the surrounding fractured rock. The effect of discontinuities was accounted for through the GSI, reflecting the poor-to-fair rock mass conditions observed at the case study mine, as presented in Table 1. The parameters m b , s, and a can be calculated through Equations (6)–(8); alternatively, they can be obtained as peak parameter values from the inbuilt parameter calculator in the RS2 software based on inputted σ c i , GSI, D, and mi values.

4.2. Model Description

The RS2 model designed to carry out the parametric analysis in this case study is shown in Figure 5. It had a width of 300 m, a height of 150 m, a boxcut highwall depth of 30 m at an angle of 30°, a mining height of 2.5 m, and a room width of 7 m. Based on the case study mine, Gabbro norite overlies the websterite, while websterite is modelled as the hanging wall; the orebody MSZ is at an inclination of 10° and bronzitite is modelled as the footwall. The model included three pillars, including two in-stope pillars, with the 2D plane model approach representing a long pillar in the direction perpendicular to the plane.

4.3. Boundary Conditions

Appropriate boundary conditions must be applied to ensure a numerical simulation with zero velocity. In this model, the boundary conditions were applied according to RockScience RS2 software guidelines. All nodes on the external boundary were initially fixed with zero displacement in the initial generated mesh. To replicate the actual ground conditions, the boxcut highwall slope and ground surface were set as free to move by removing restraints on the top boundary segments. The vertical segments of the model, that is, the left- and right-side boundaries, were restrained in the horizontal direction, permitting only vertical displacement. The bottom edge of the boundary was constrained in the vertical direction, permitting only horizontal displacement. Furthermore, the bottom-left and -right corner vertices were pinned to prevent movement in both horizontal and vertical displacement. The generated mesh utilized a graded discretization such that the resolution was finer near the boxcut highwall and the excavated underground sections.

4.4. Numerical Analysis

In this study, pillar stability analysis was conducted using parametric studies with the Finite Element Method (FEM) and Rocscience RS2 software, employing the Generalized Hoek–Brown failure model to focus on the strength factor and evaluate pillar stability parameters. The effect of barrier pillar width was also analyzed, assuming a 10° dipping angle of the orebody, with room and pillar dimensions of 7 m and 6 m, respectively, and monitoring the impact on boxcut slope stability and the roof of the first stope. The stability of the barrier pillar was further analyzed for varying widths (6 m, 10 m, 20 m, 30 m, and 40 m) and orebody dipping angles (0°, 10°, 20°, 30°, and 40°). Additionally, the effect of deteriorated rock mass conditions, represented by Geological Strength Index (GSI) values ranging from 30 to 50 for the orebody, was assessed. A parametric assessment was performed to assess the optimum room and pillar design, which were evaluated against the planned 6 m pillar sizes.

5. Results and Discussion

5.1. Effect of Barrier Pillar Width

The assumed case study situation comprised ore dipping at a 100 angle, operations conducted with a mining height of 2.5 m, and rooms and pillars designed with widths of 7 m and 6 m, respectively. Various mining jurisdictions provide guidelines for pillar design. Munemo [30] highlighted that in Zimbabwe, Section 5.4 subsection (1) of The Mining (Management and Safety) Regulations (SI 109 of 1990) specifies that for boundary pillars, a width of at least 6 m of continuous pillar should be left standing in metallic mines and at least 15 m should be considered for coal mines. Therefore, a minimum barrier pillar width of 6 m was analyzed first, and then 10 m, 20 m, 30 m, and 40 m were subsequently run through the parametric analysis. The barrier pillar width was evaluated according to the low-strength-factor isolation from the underground stopes, preventing it from extending to the boxcut highwall. Figure 6 illustrates the strength factor distribution throughout the model with barrier pillar width adjustments.
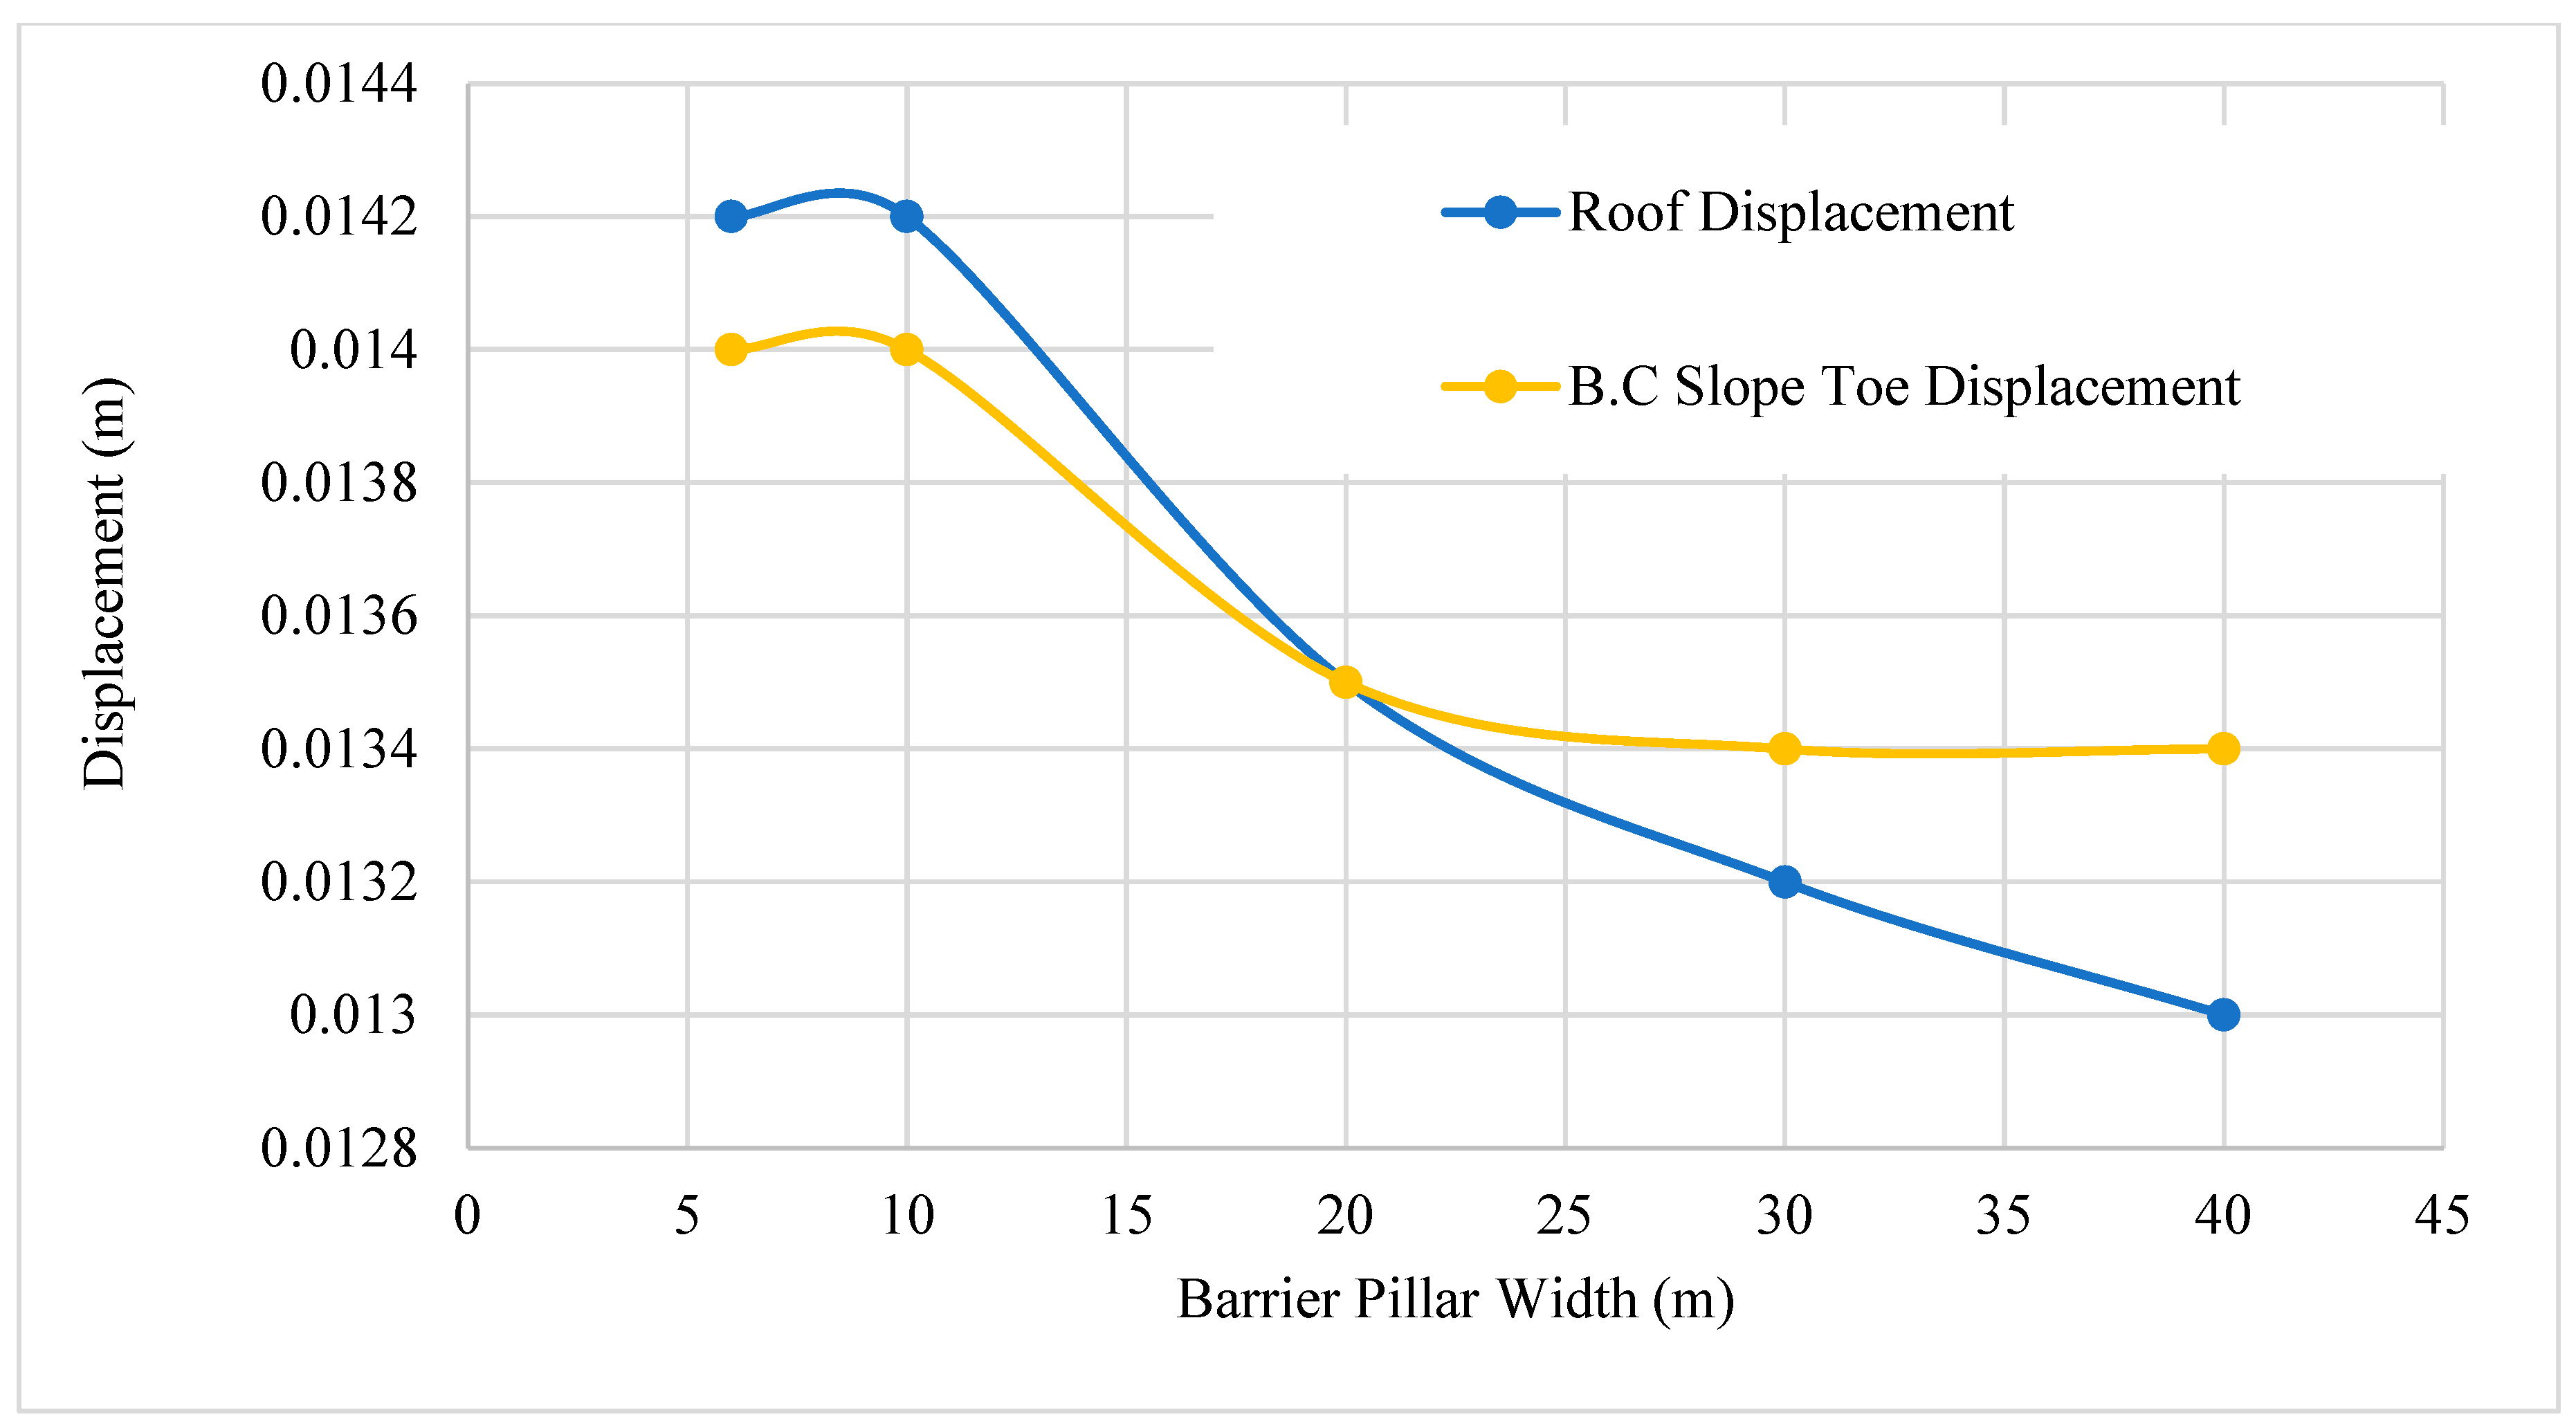
The analysis indicated that a 6 m barrier pillar width may result in a failed pillar with a strength factor of less than 1 that propagates from the underground stope to the boxcut highwall slope toe, and an unstable roof in the underground mining section with a low strength factor that propagates to the highwall slope, with the potential for sinkhole development on the highwall slope. This may result in global instability of the operation as the boxcut hosts the main mine access declines and the unstable stope roof. A 10 m barrier pillar also exhibits an unstable low strength factor on the roof of the first stope, which does not isolate it from the boxcut highwall slope. On the other hand, for a 20 m barrier pillar, isolation of the strength factor between the first stope and the boxcut was observed, implying an optimum barrier pillar width of at least 20 m. To assess performance, monitoring points were placed on the roof of the first stope and at the boxcut slope toe. Figure 7 highlights the high displacement noted on the roof of the first stope and at the slope toe when using barrier pillar widths of 6 m and 10 m, which starts to stabilize at a barrier pillar width of 20 m, corresponding with the strength factor analysis.

5.2. Effect of Orebody Dip Angle on the Barrier Pillar

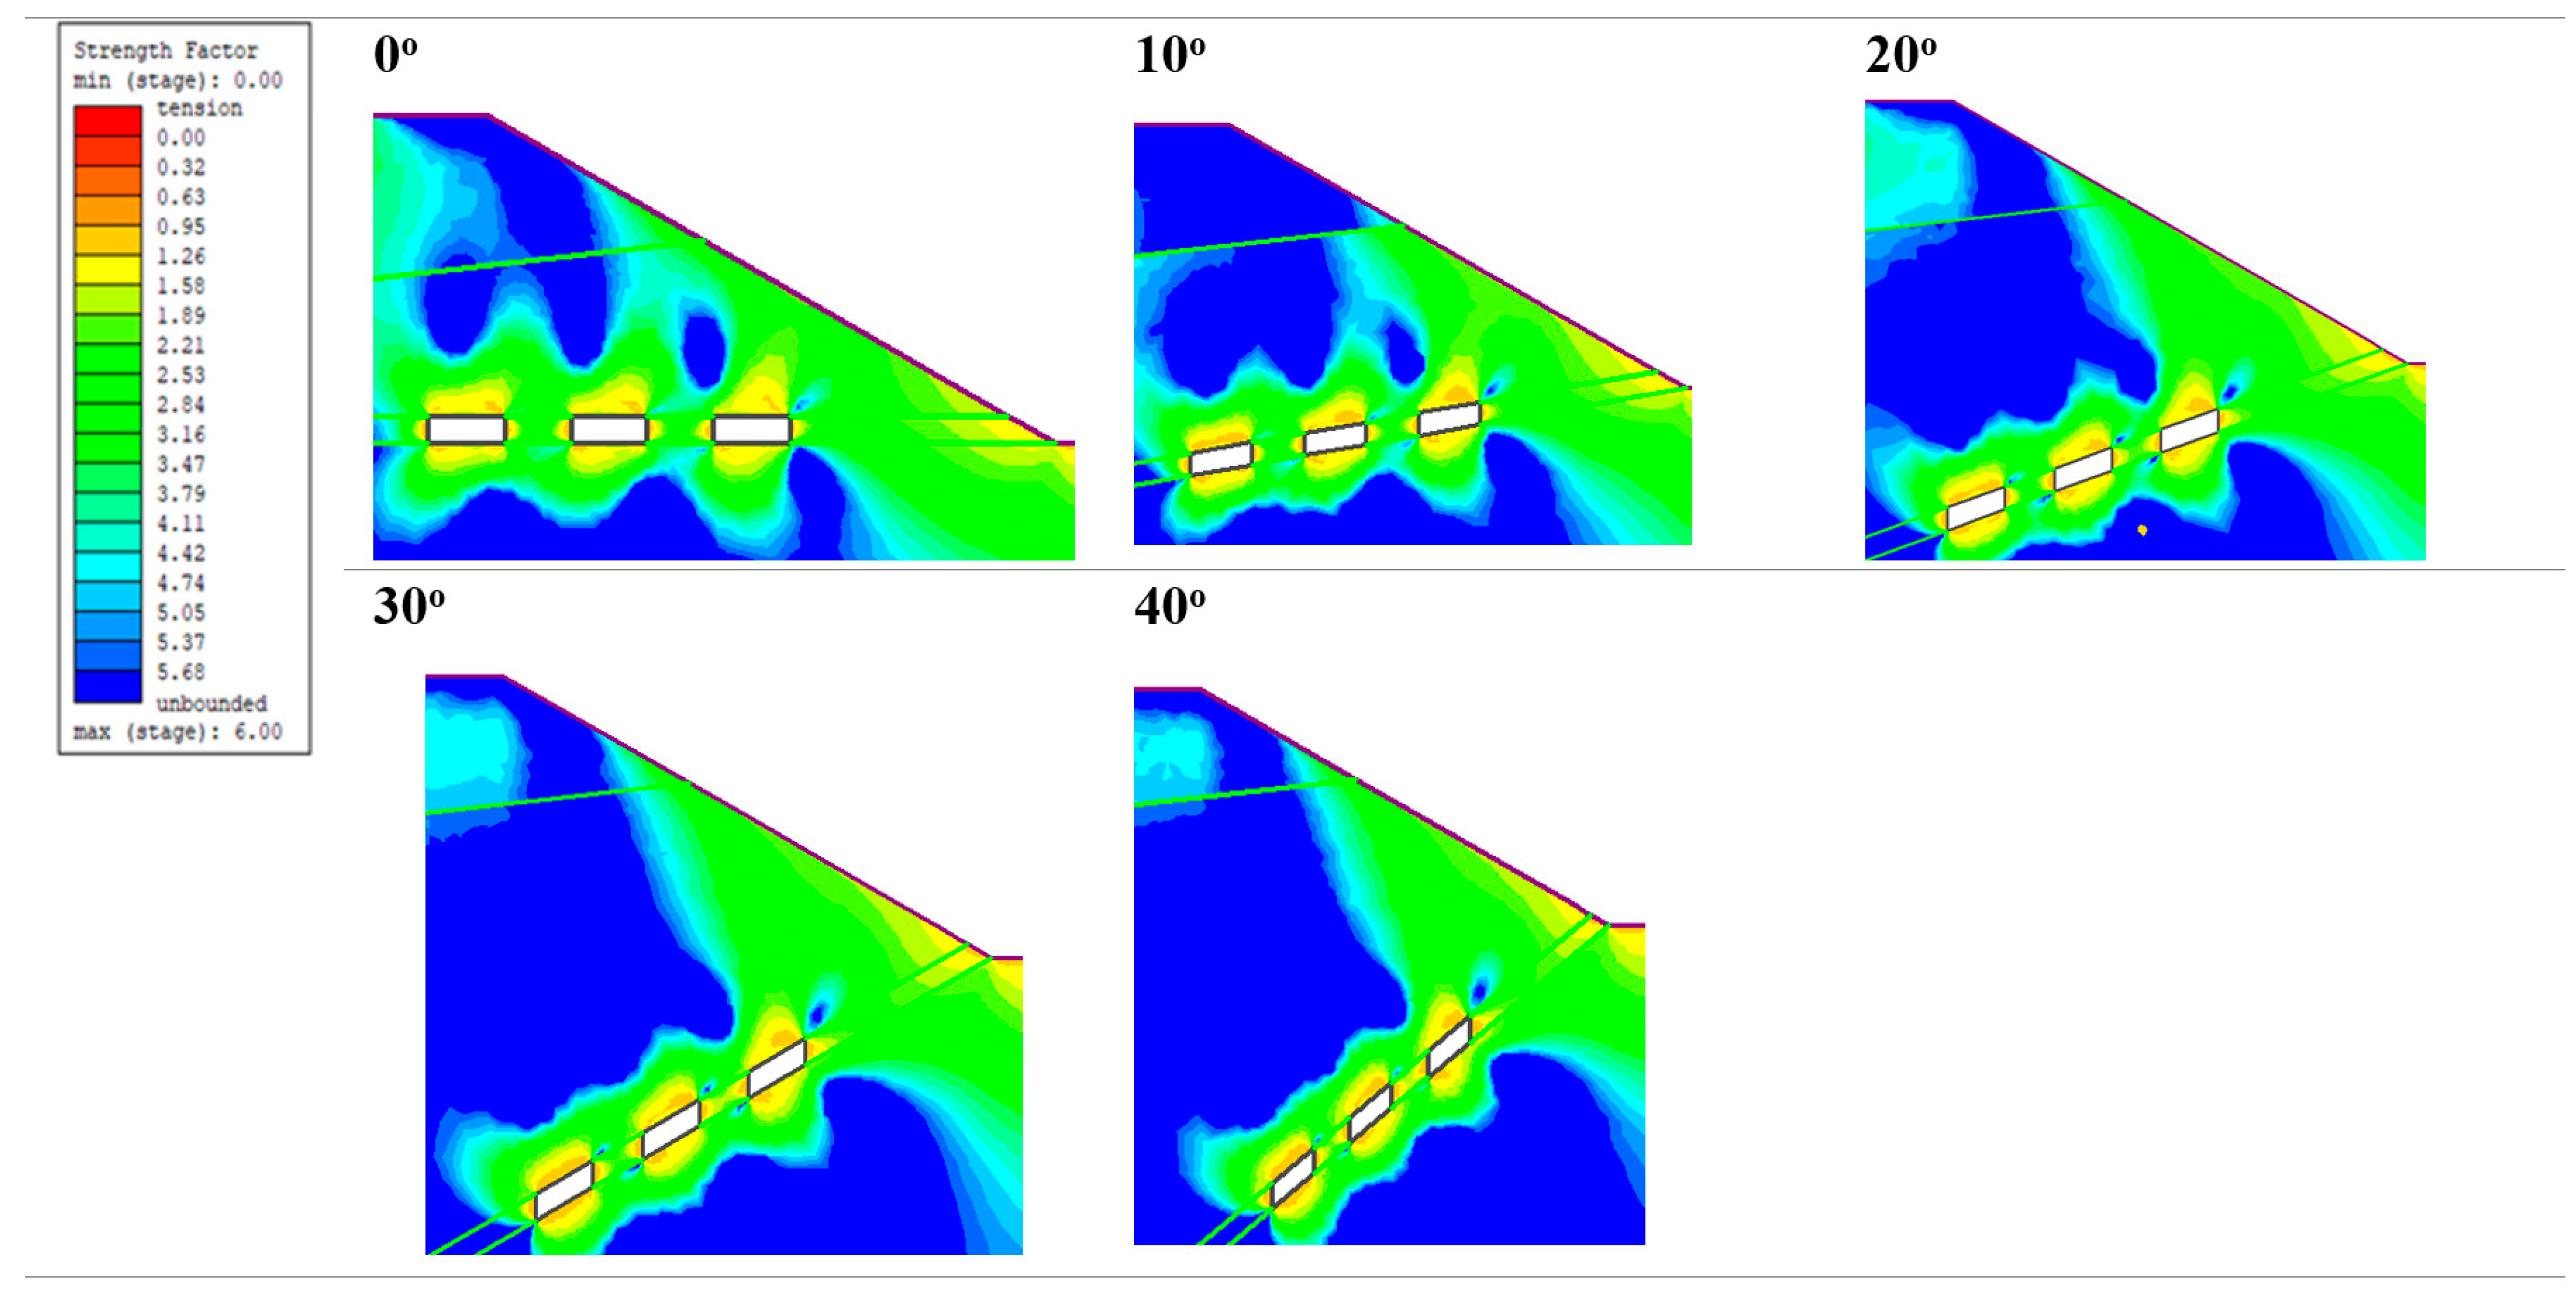
The design of the barrier pillar must account for its inclination relative to the horizontal plane, aligning with the dip in the orebody. In this parametric analysis, dip angles ranging from 0° to 40°, in increments of 10 degrees, were examined to evaluate how variations in inclination influence the performance of the barrier pillar. Throughout the simulation, only the dip angle of the orebody was adjusted, while the model’s geometry and orientation remained unchanged. It was assumed that the selected dip angle remained uniform along the entire strike length of the orebody. Figure 8 illustrates the resulting distribution of the strength factor throughout the model, corresponding with the changes in inclination of the barrier pillar.
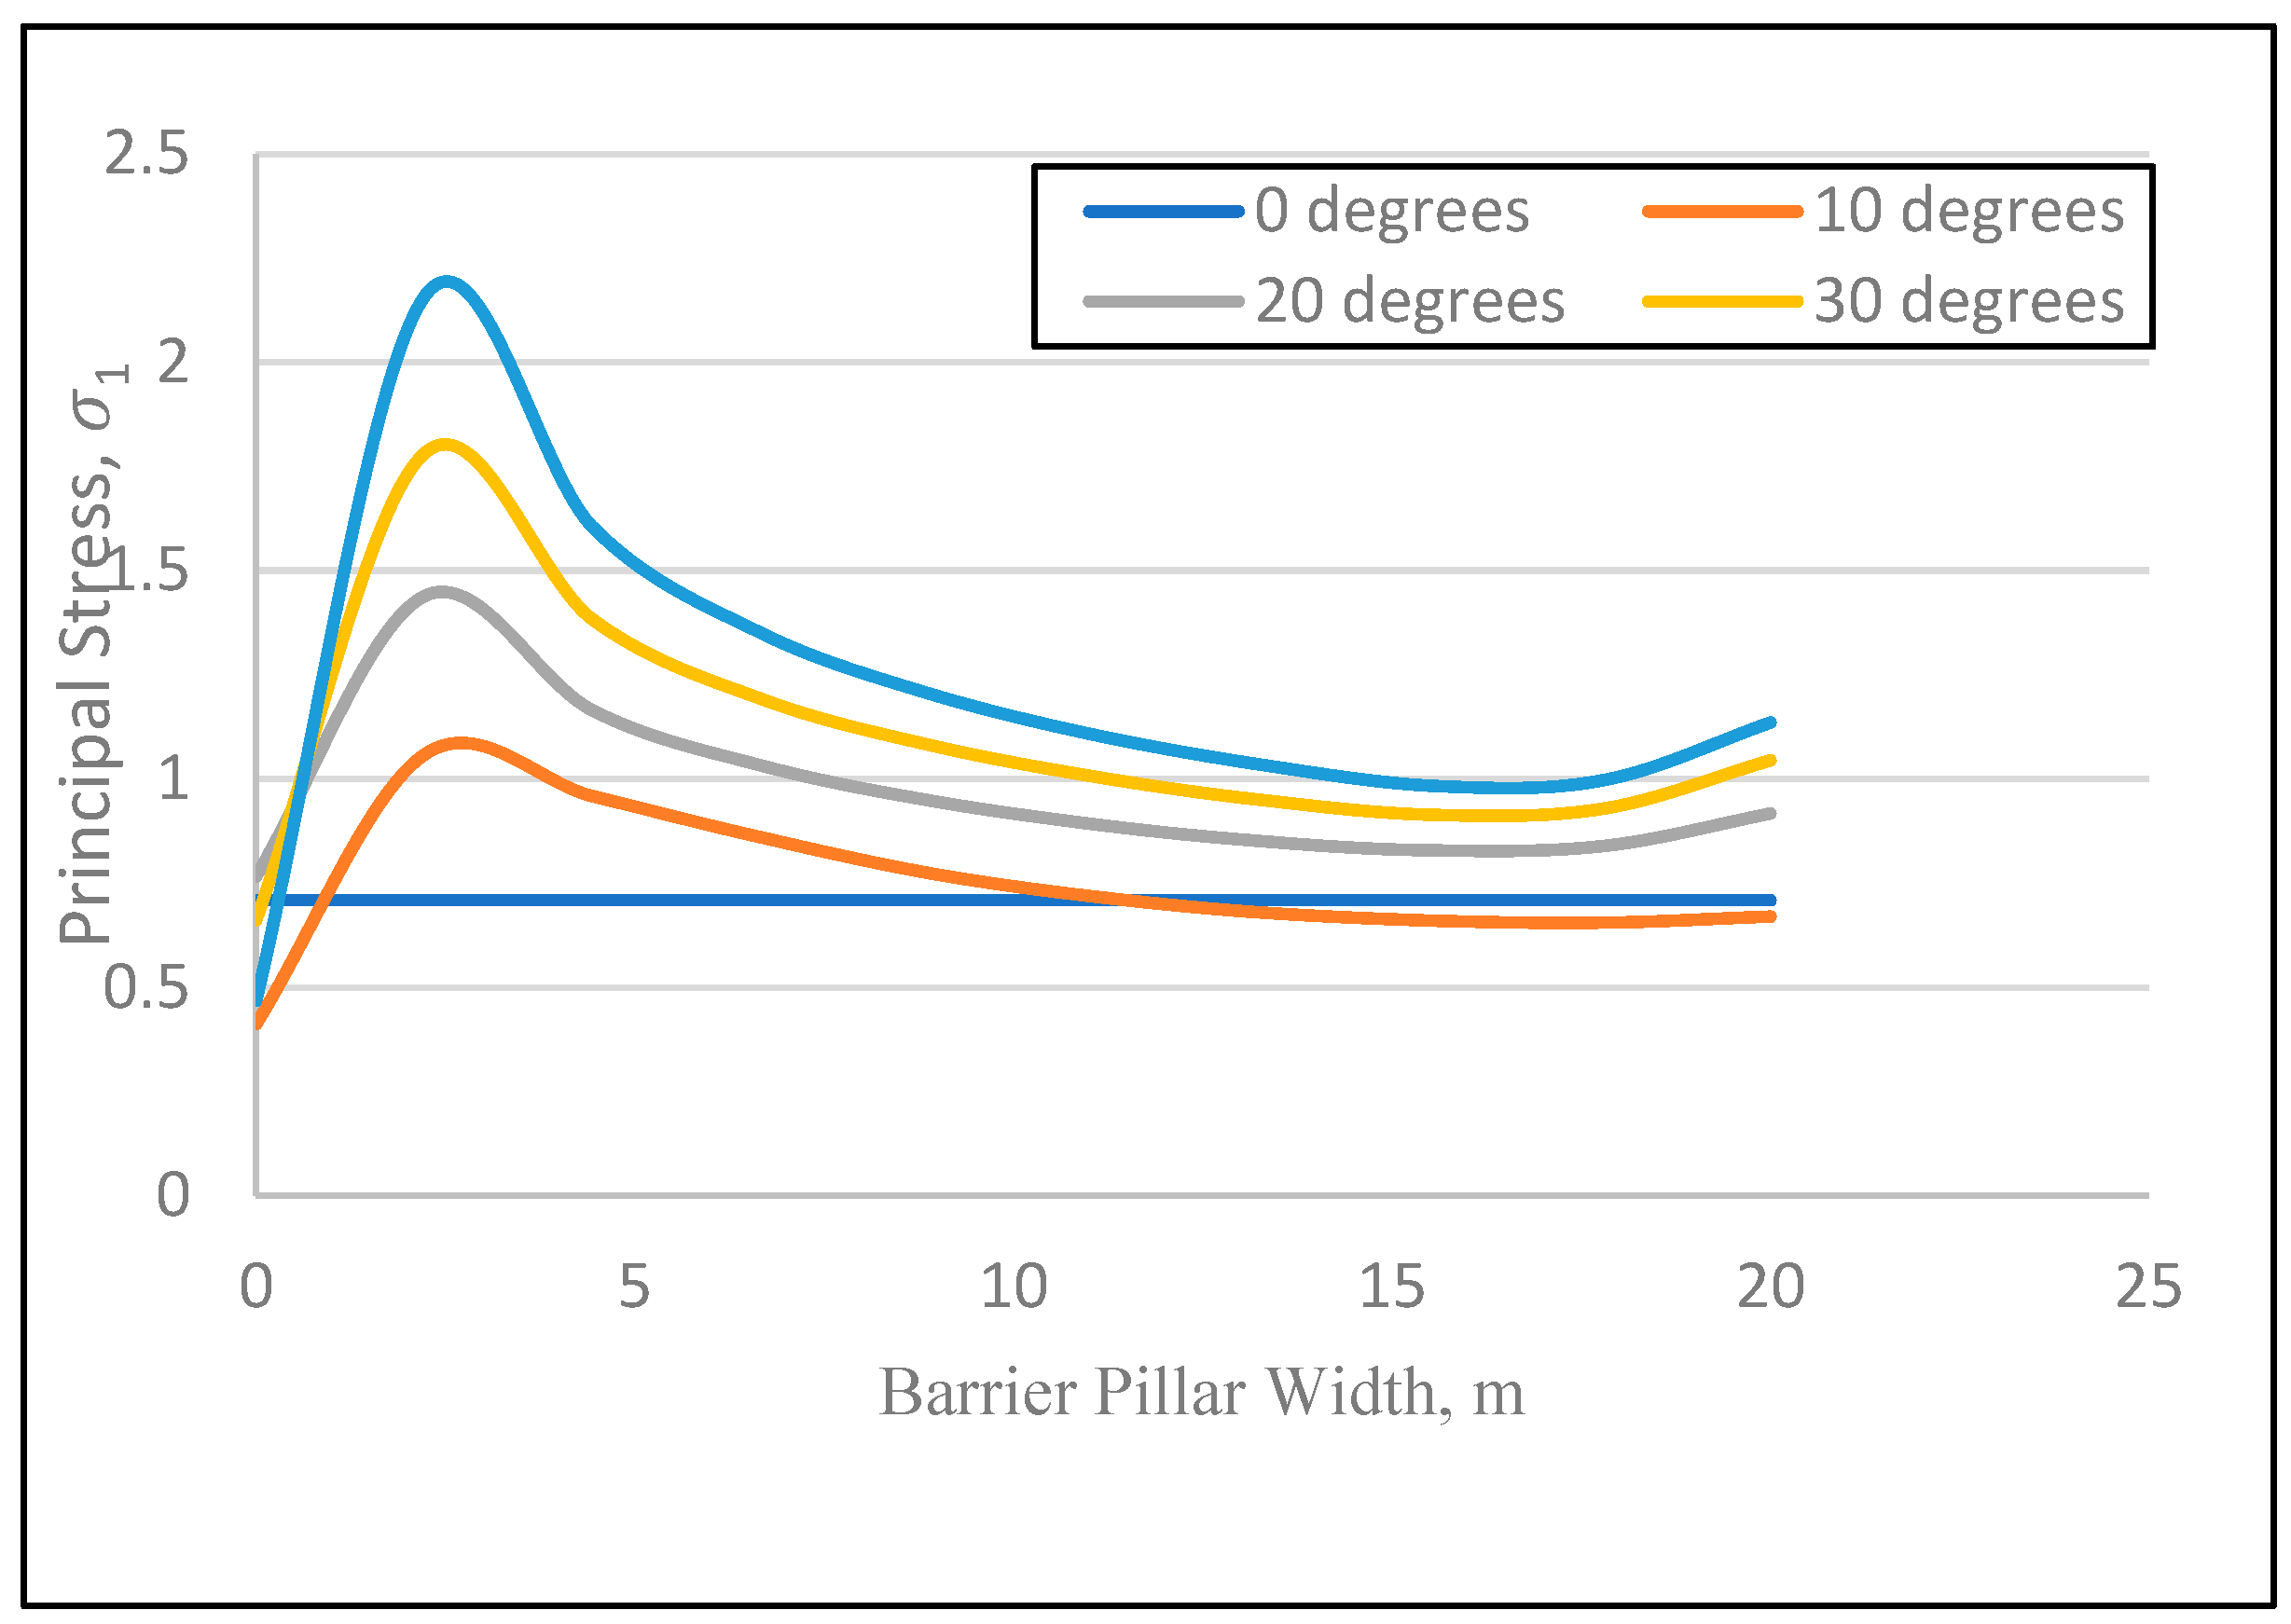
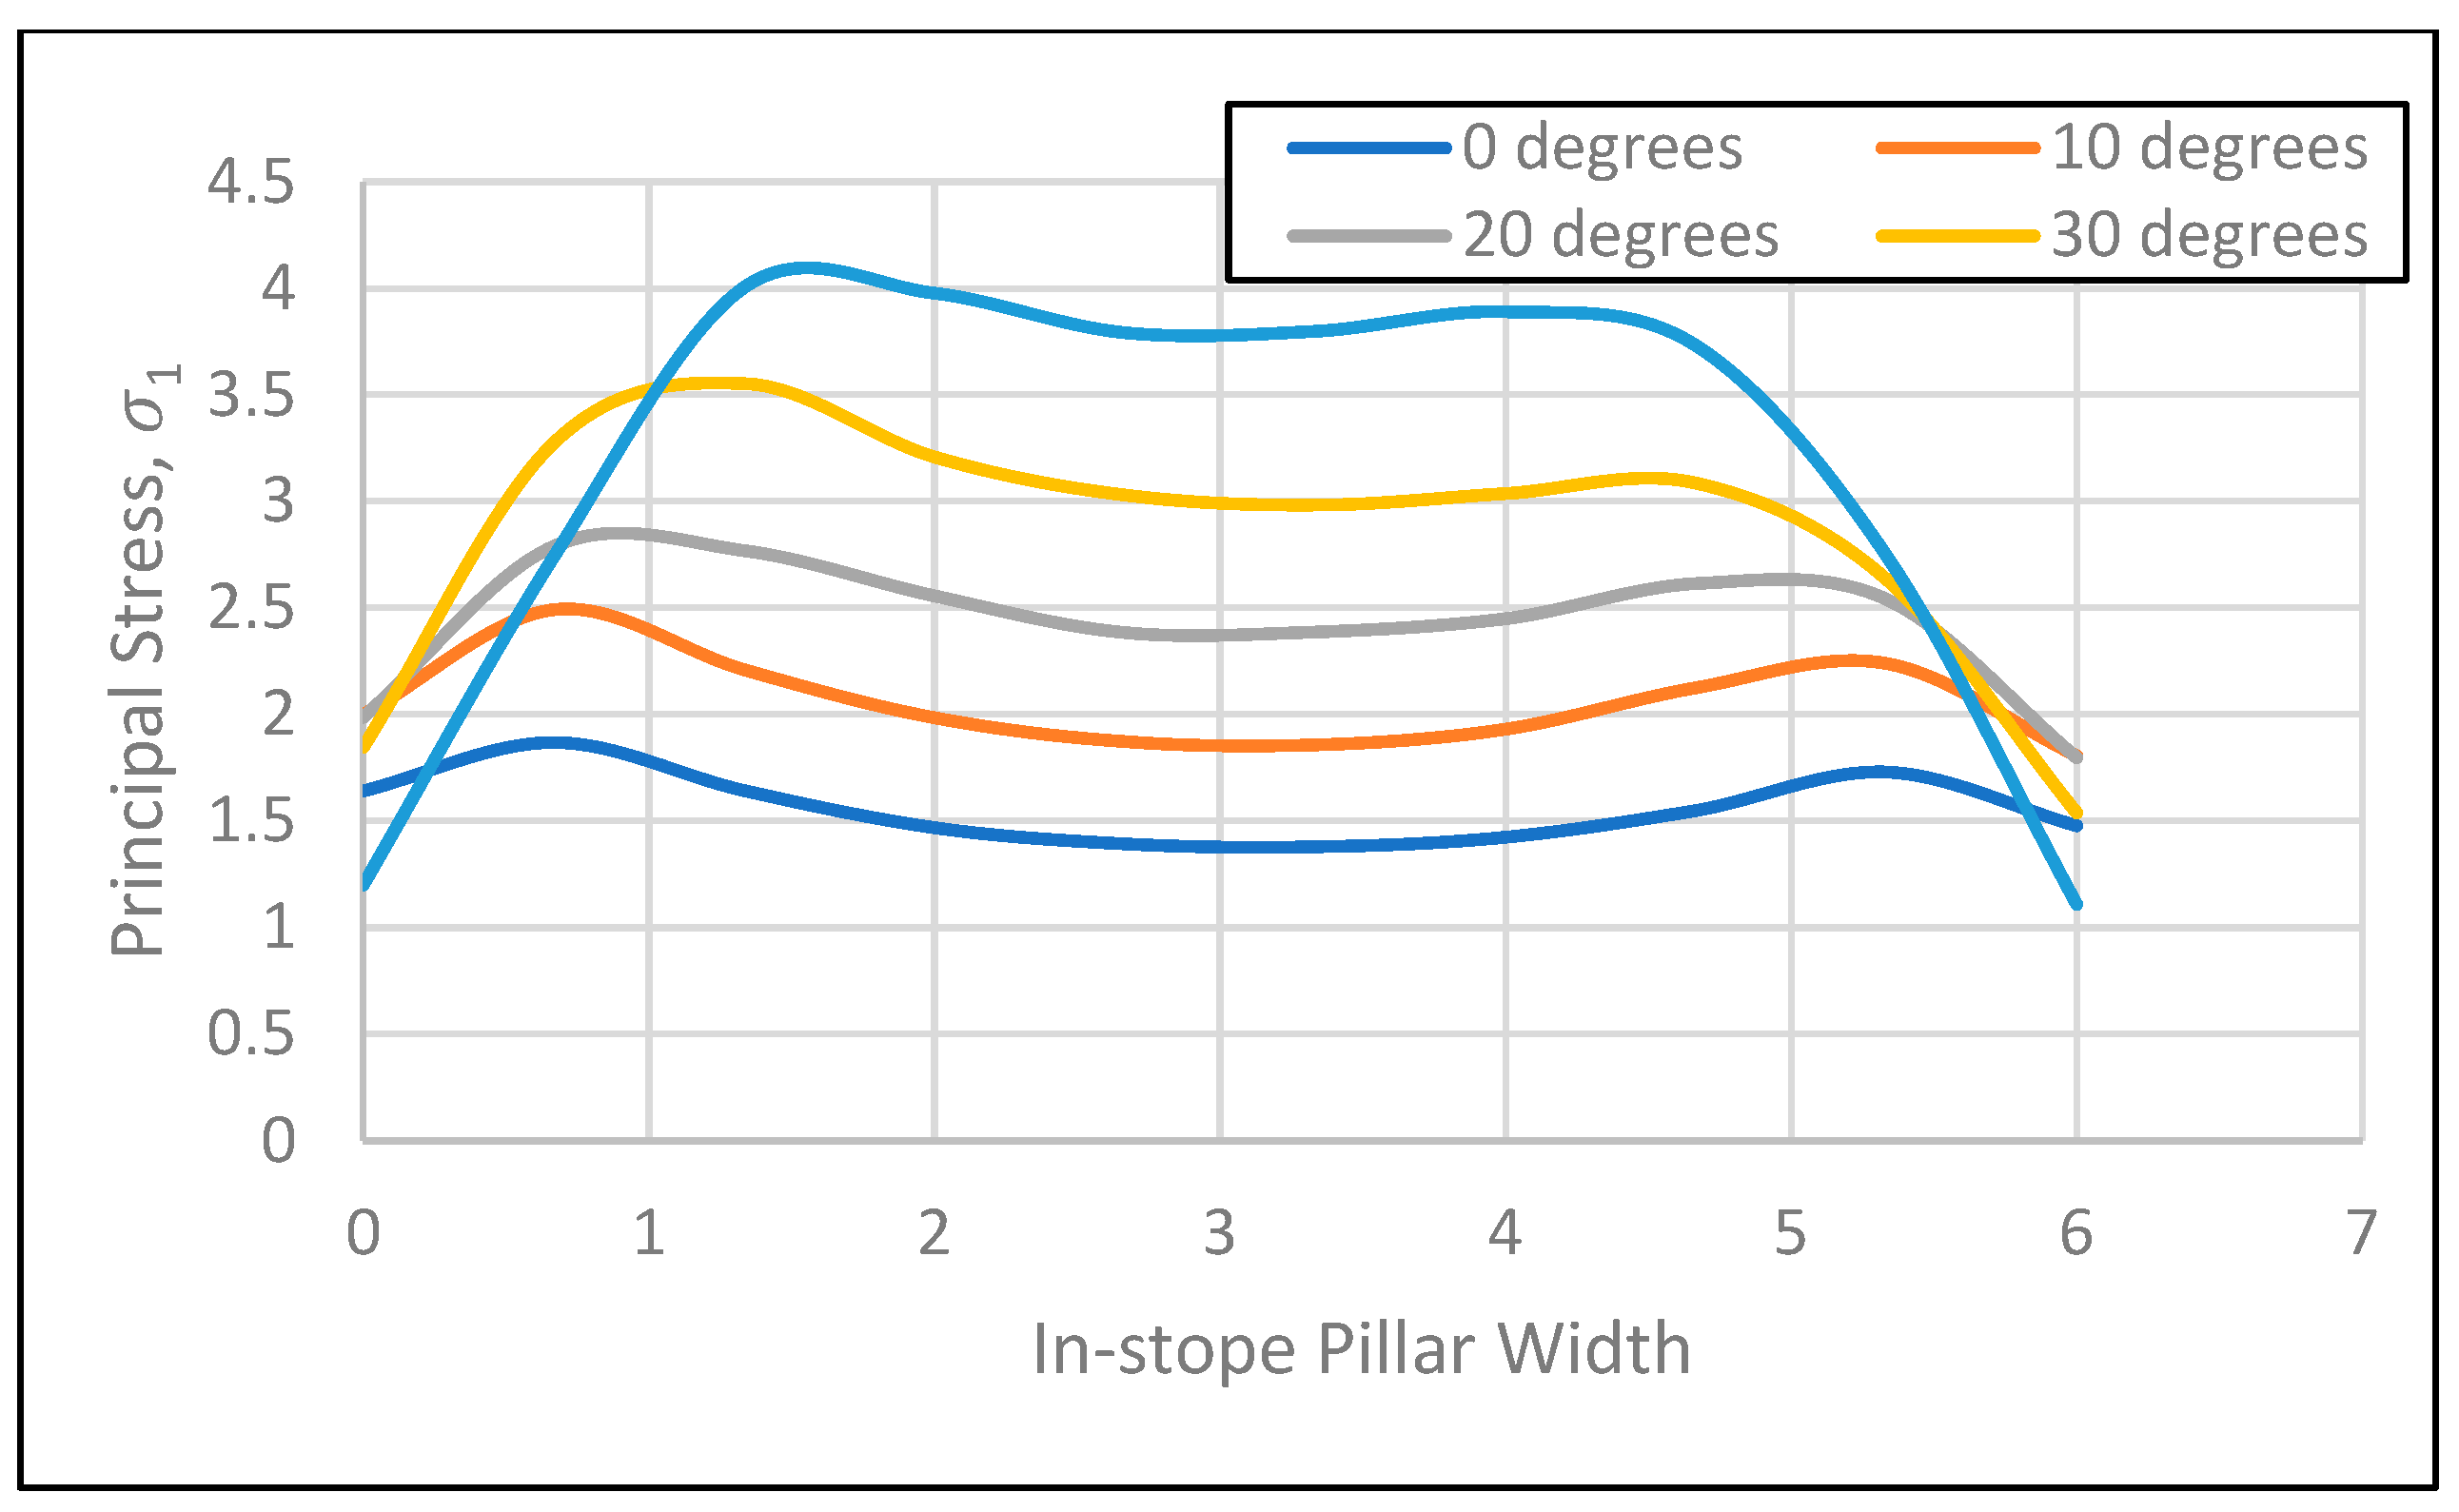
It was observed that the 20 m barrier pillar and the 6 m in-stope pillars were both stable when flat. As the dip angle increased from 10° to 40°, the barrier pillar maintained its strength and the isolation of strength factors between the underground stope and the slope. Das et al. [9] highlighted that increasing the pillar’s width increases its strength factor due to pillar confinement. Therefore, it was concluded that a 20 m barrier pillar had adequate confinement to maintain low strength factor isolation between the boxcut and the underground stopes. However, the in-stope pillars are negatively affected as the strength factor decreases, with dip angle increasing from 10° to 40°. The principal stress, σ 1 , was then measured at the mid-height of the barrier pillar and in-stope pillar. Figure 9 shows a uniform low distribution for the flat-lying pillar and a stress increase as the barrier inclination increases from 10° to 40°; Figure 10 also shows the increase in principal stress acting on the 6 m in-stope pillar with the increase in orebody dip angle.
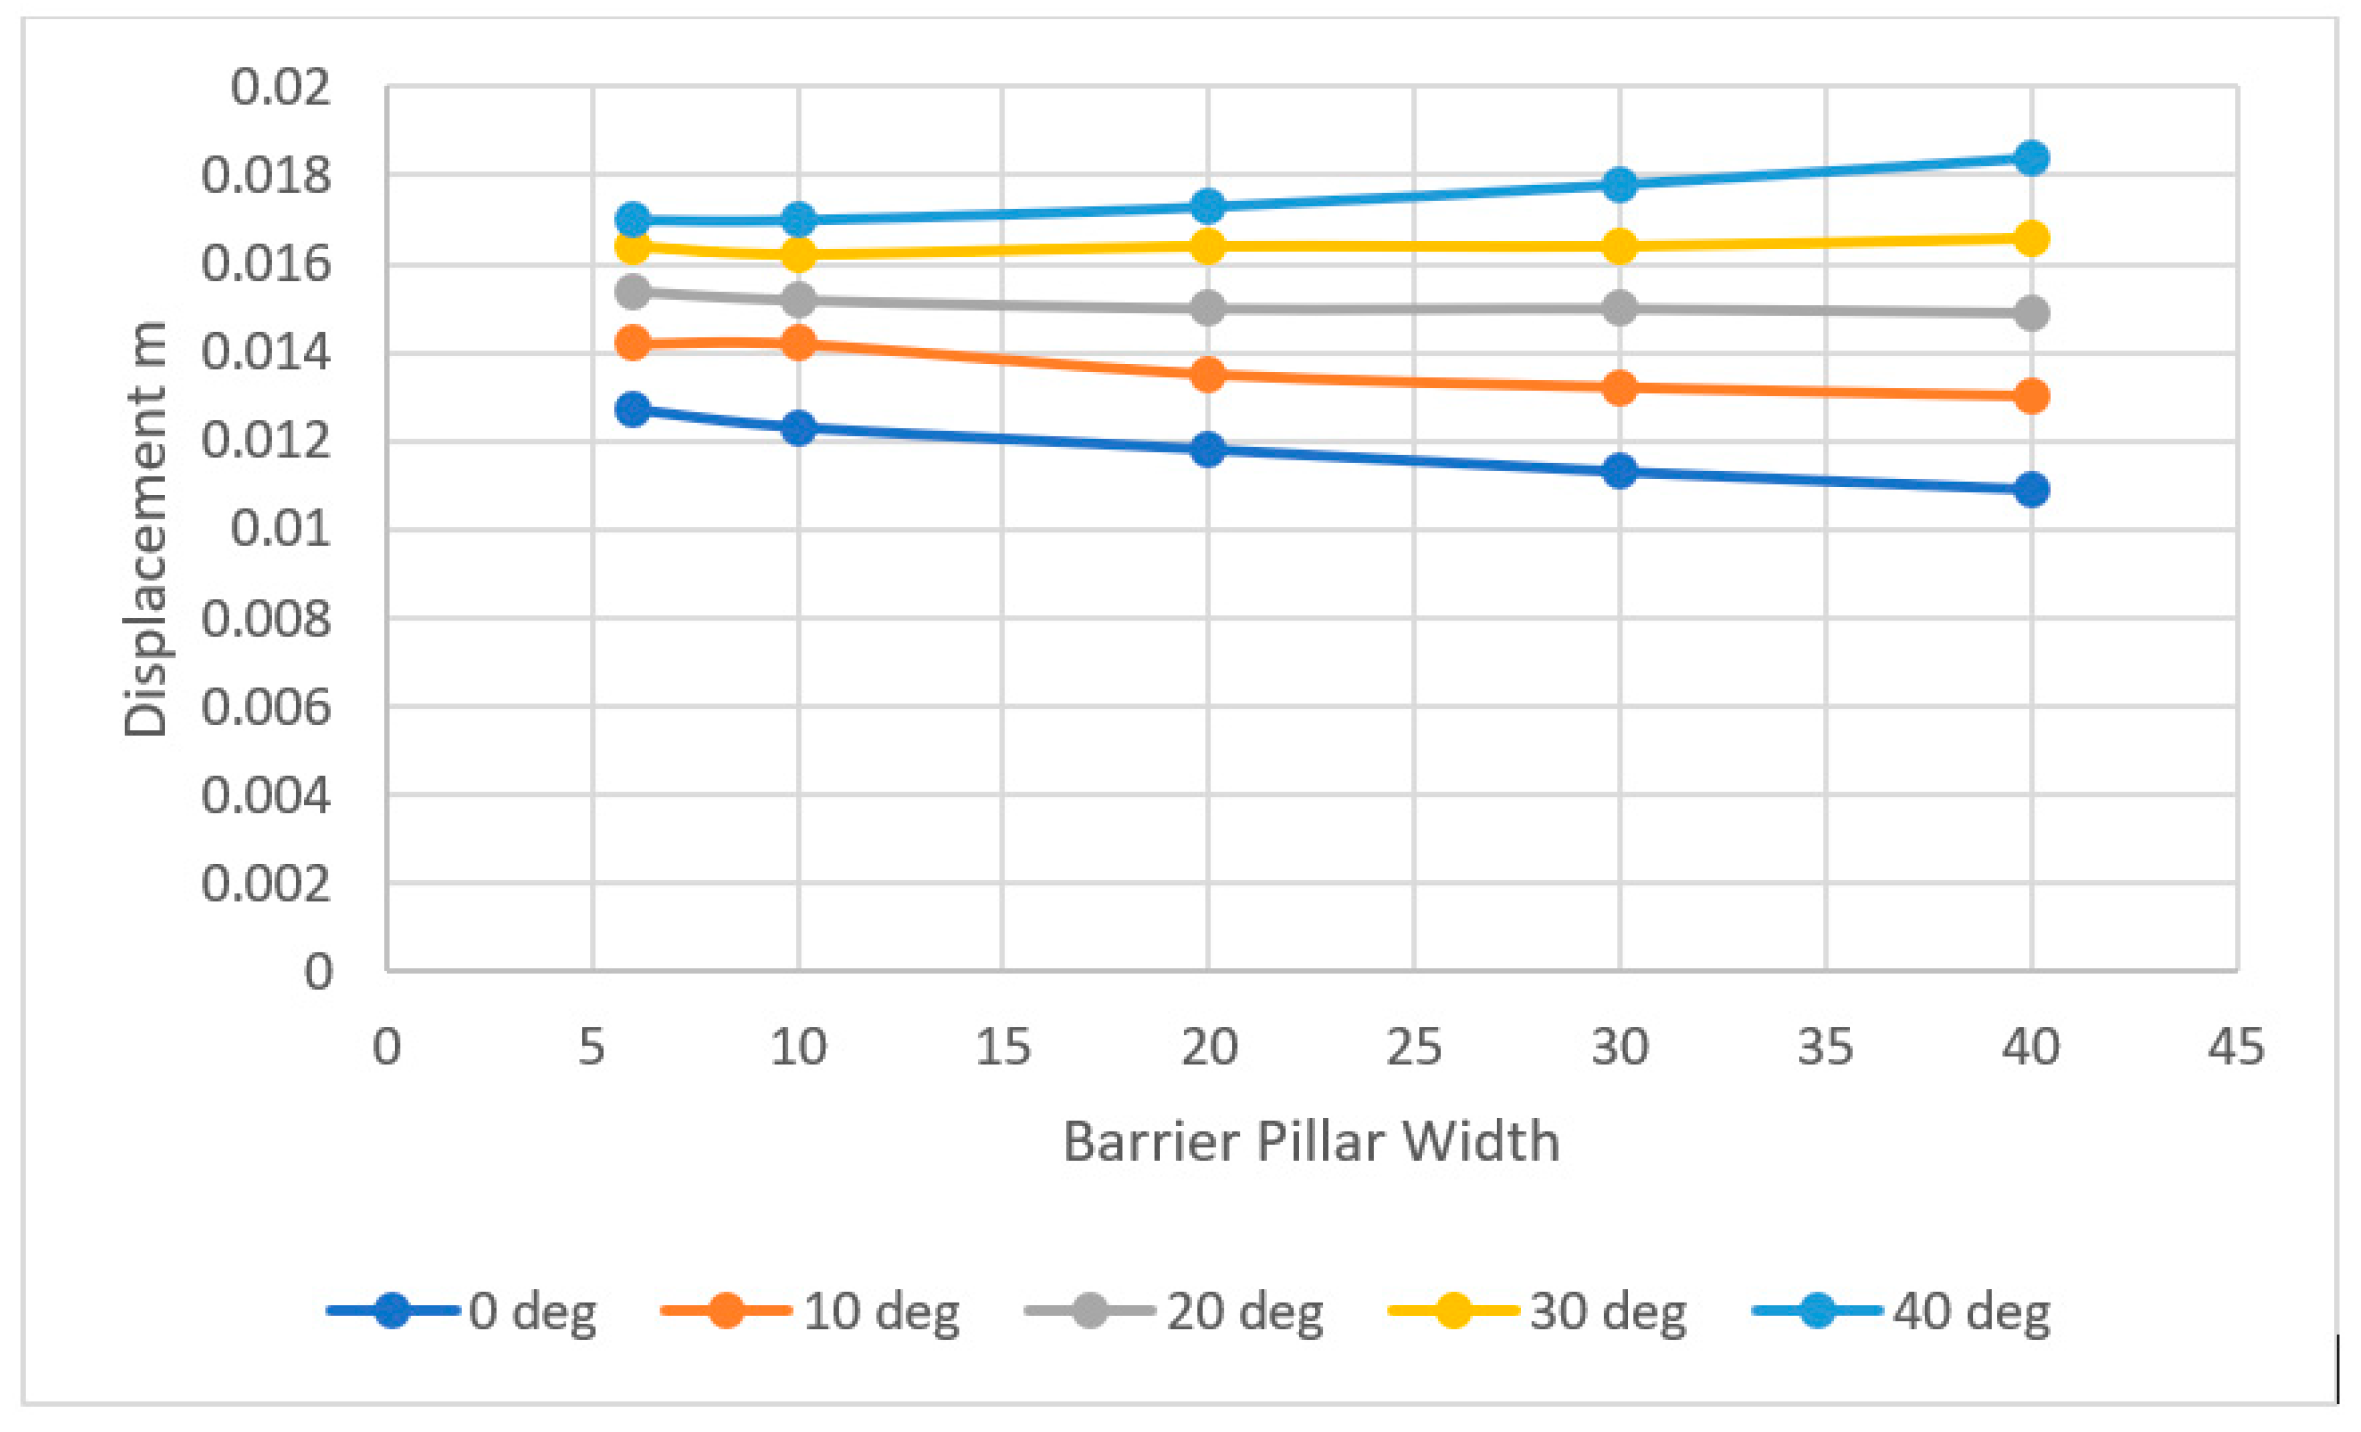
The effect of dip angle was then compared at various barrier pillar widths. The graph in Figure 11 indicates that the highest displacement on the roof of the first stope coincides with the highest dipping angle of 40°, whilst the lowest displacements were observed with horizontal pillars. Therefore, it was concluded that more support will be required with increasing inclination as a result of the increasing shearing stress; hence, roof support is important in the redesign of the in-stope pillars.

5.3. Effect of Rock Mass Conditions on Barrier Pillar Width

Twelve models were designed to vary the barrier pillar width under various rock mass conditions. The considered Geological Strength Index, GSI, was varied four times to represent rock mass deterioration due to fractures caused by faulting and joints in the case study mine, from GSI 50, GSI40, and GSI30, as shown in Figure 10, whilst a parametric analysis of different barrier pillar widths ranging from 10 m to 40 m was also conducted.
For GSI 50, that is, less fractured conditions, the 10 m pillar has a low strength factor from the stope connecting to the slope, and from 20 m, the underground stopes are isolated. Similarly, for GSI 40, the 10 m wide barrier pillar results in a low strength factor from the stope propagating to the slope, and from 20 m, the underground stopes are isolated. For GSI30, the low strength factor is not isolated and there is a higher risk of a sinkhole on the slope and a low strength factor on the highwall slope toe for the 10 m barrier pillar; also, at 20 m, there is no isolation, whilst from 30 m, isolation is noted. Therefore, this suggests that the design boundaries for barrier pillar widths under the various rock mass conditions that are considered will include at least 20 m for conditions GSI 40 and GSI 50, whilst for GSI30 the barrier pillar width should be 30 m or more, as displayed in Figure 12.

5.4. In-Stope Pillar Width Optimization of the Room and Pillar at the Case Study Mine

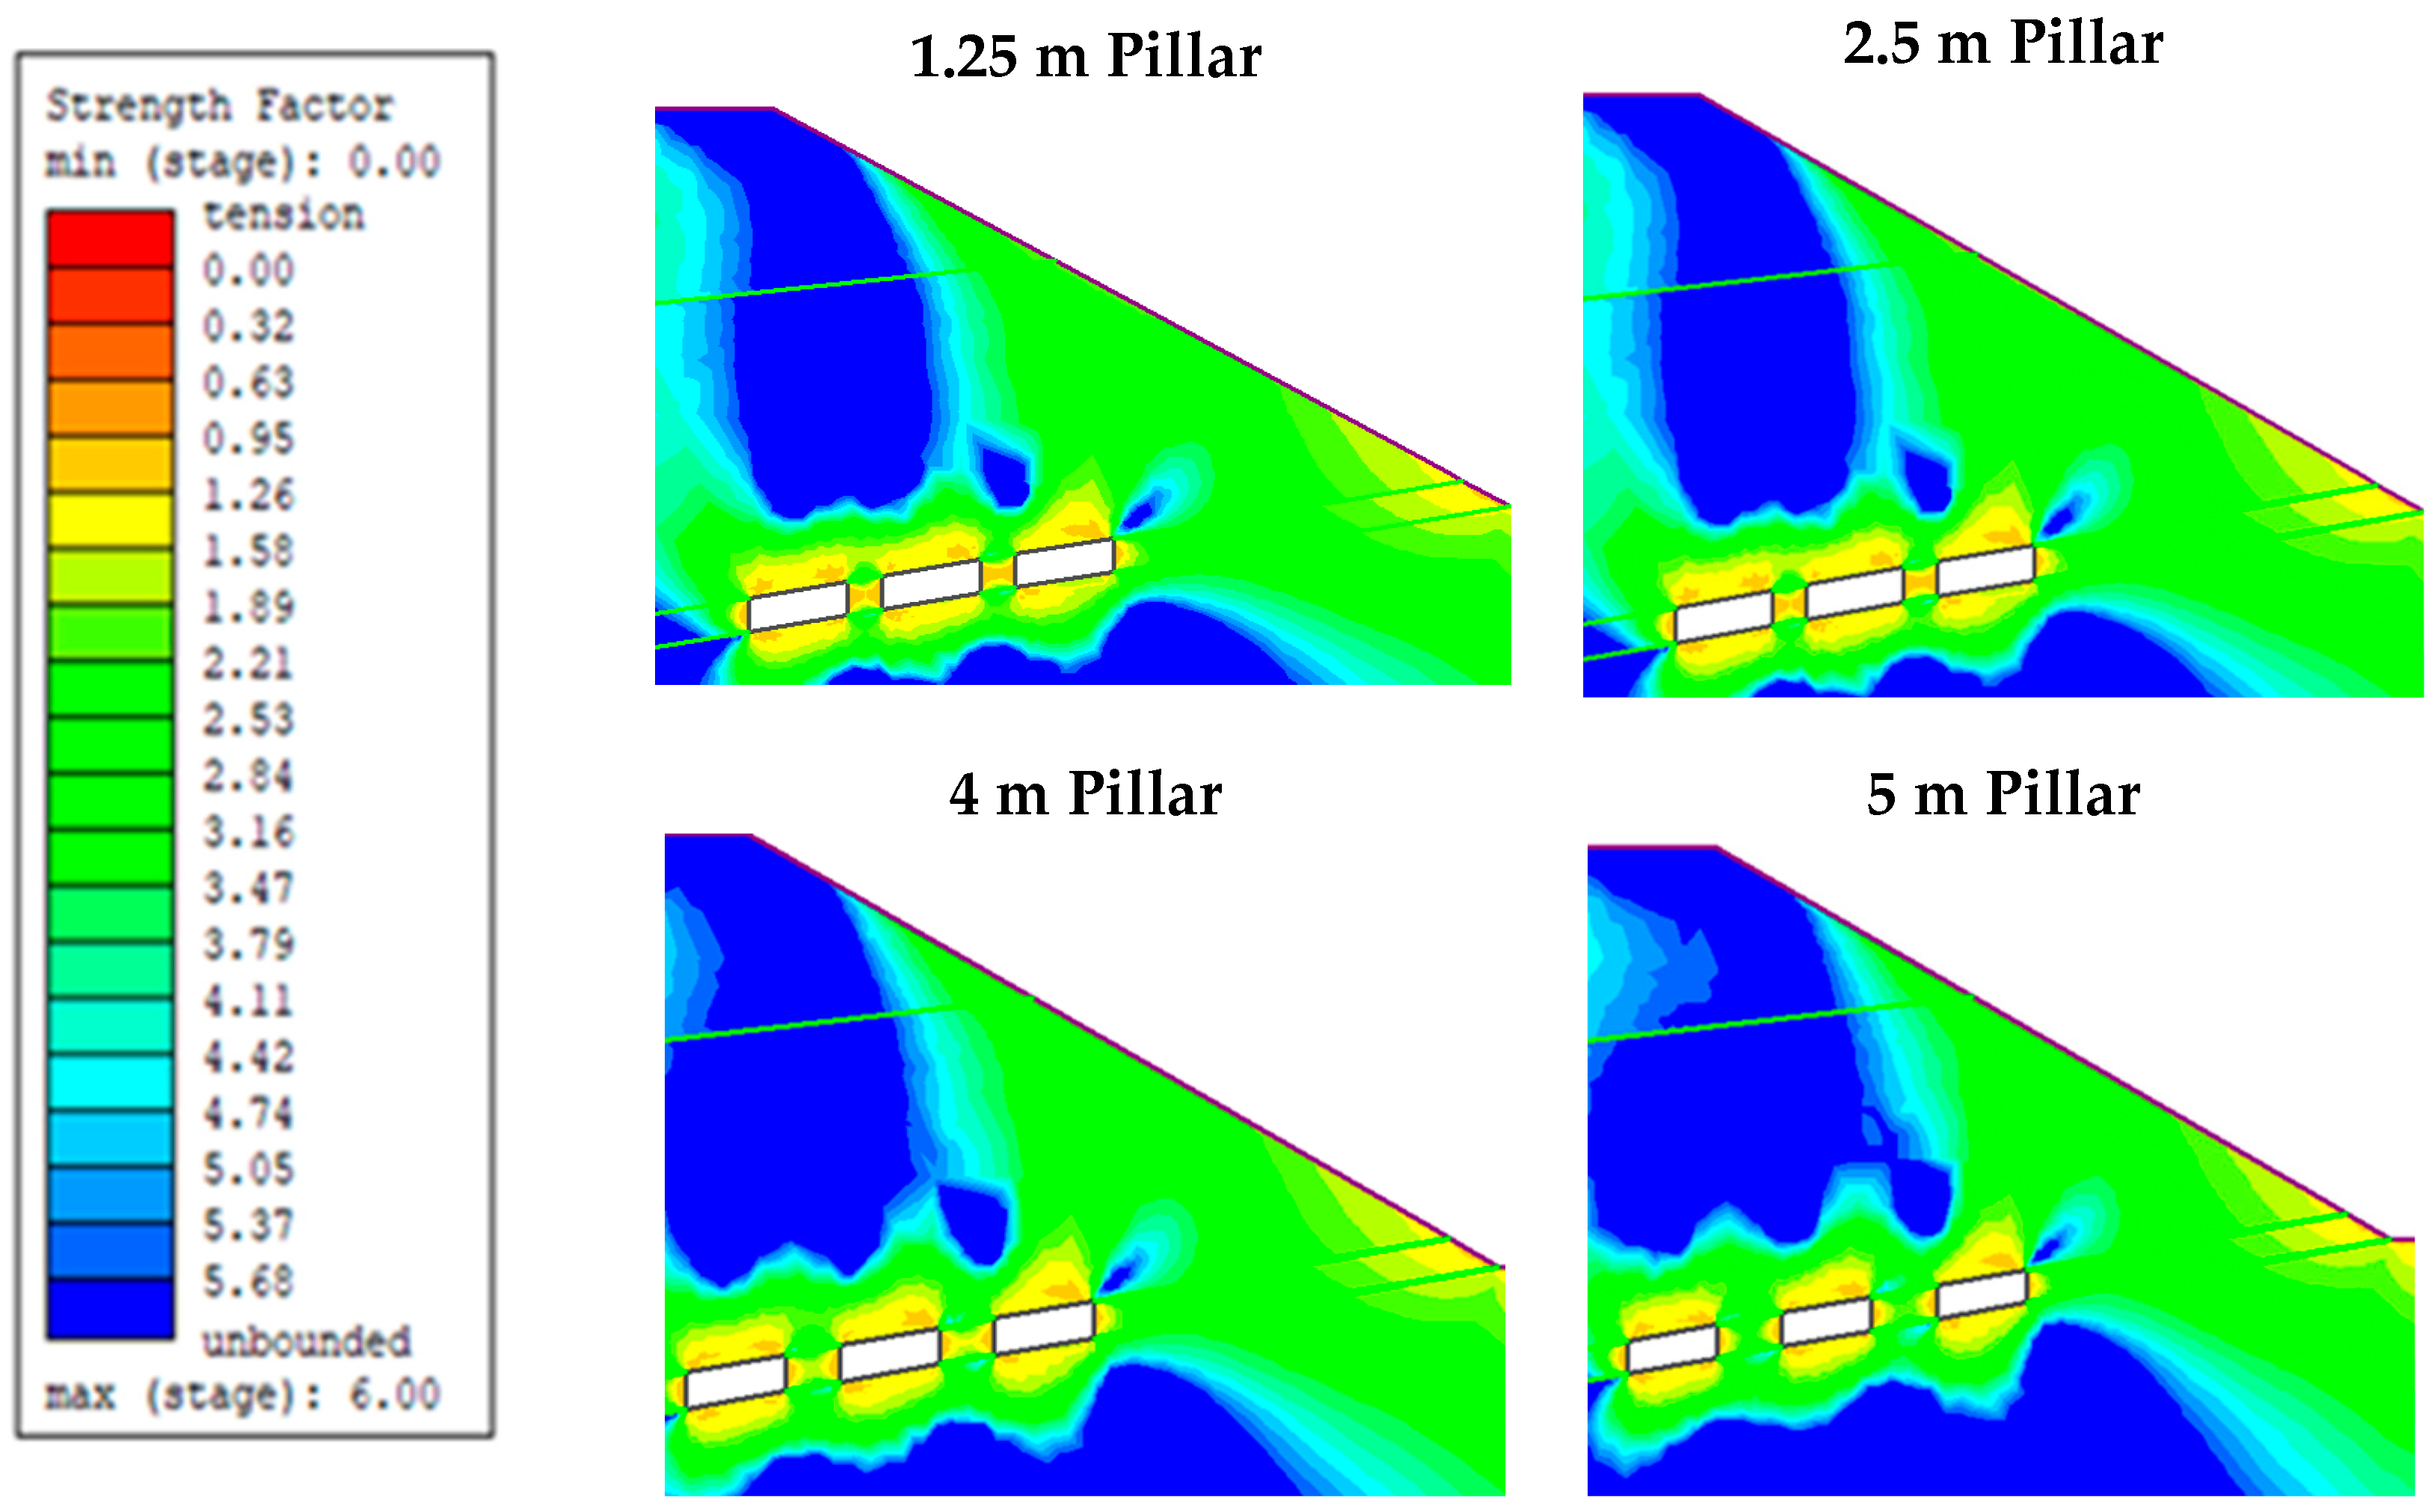
Pillars are critical support elements in underground mining, designed to be robust enough to bear the rock mass loads and maximize ore recovery, so their cross-sectional area needs to be minimized [31]. To minimize pillar size, the case study situation comprised a 7 m room, an orebody dip of 10°, a mining height of 2.5 m, and a barrier pillar of 20 m. Parametric analysis considered pillar width-to-height ratios of 0.5, 1, 1.6, and 2, corresponding to 1.25 m, 2.5 m, 4 m, and 5 m, as shown in Figure 13.
From the parametric analysis, it was observed that the 1.25 m and 2.5 m pillars are unstable, with a strength factor less than one cutting across the pillar, whilst a pillar of at least 4 m exhibits stability, as shown in Figure 13.
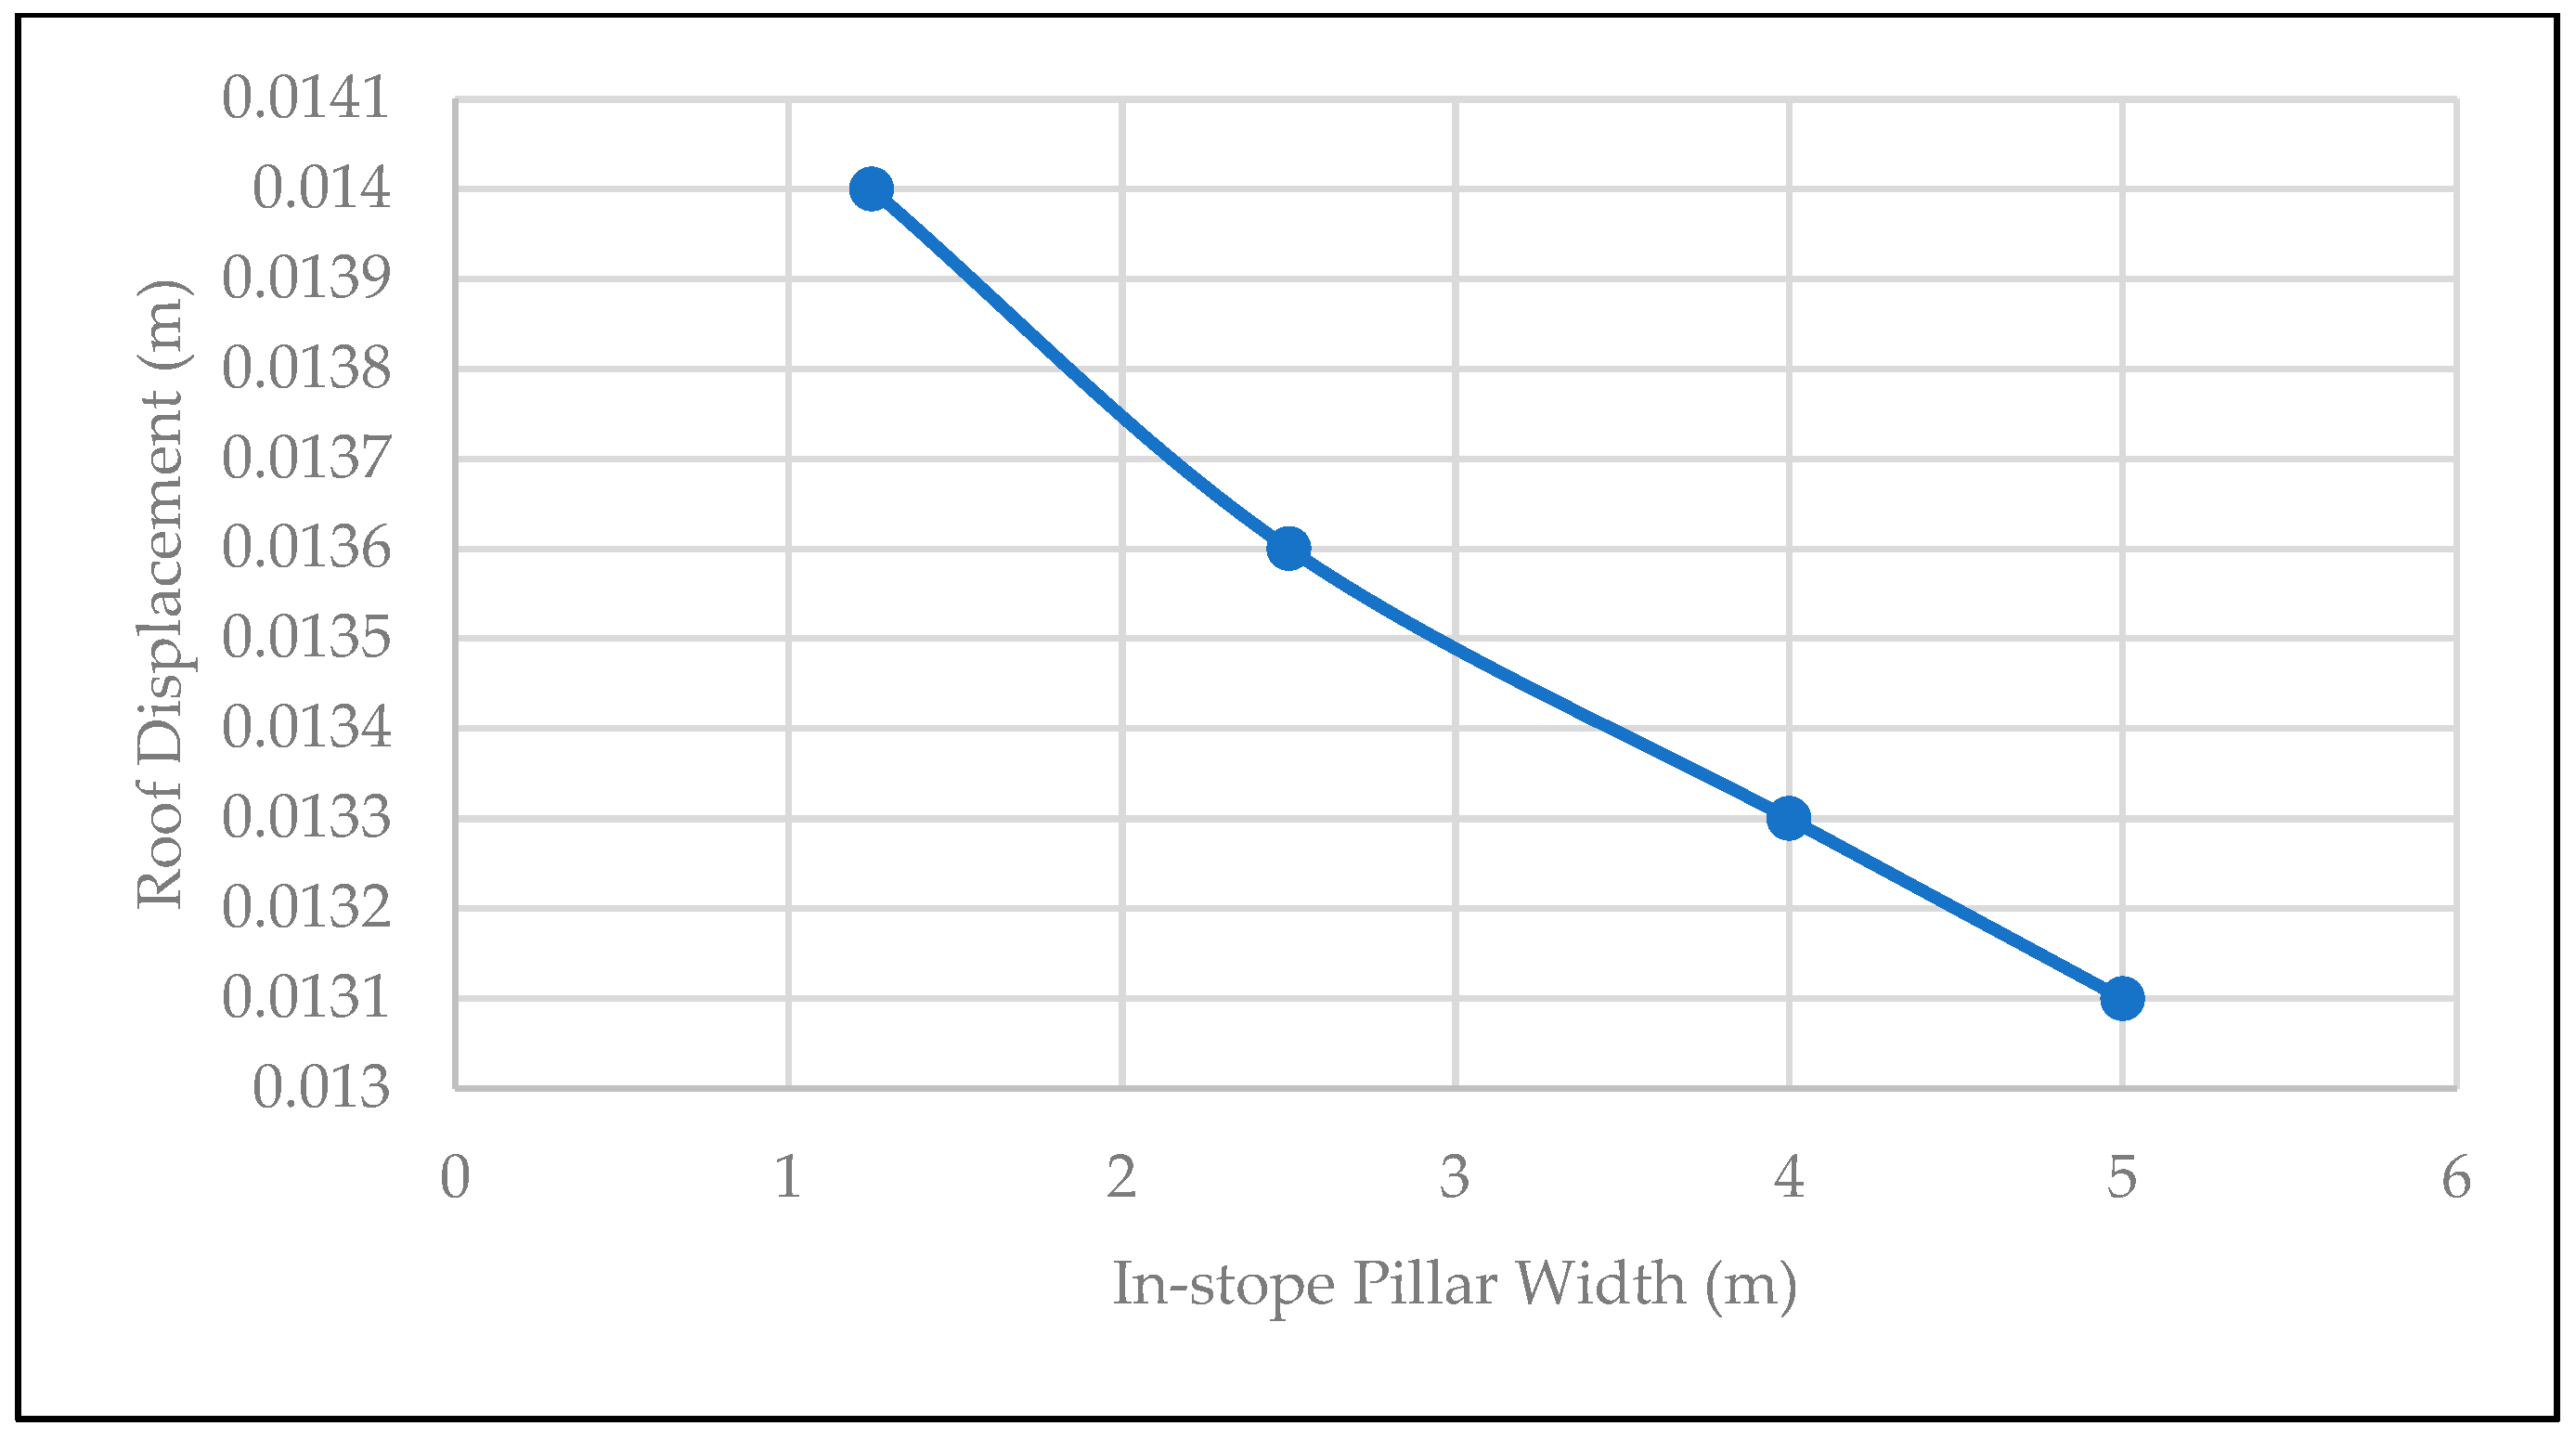
The effect of different in-stope pillar widths was assessed by measuring the displacement from the roof of the second stope, and the result is highlighted in the graph in Figure 14. High displacement of the roof was observed with narrow pillars, that is, 1.25 m and 2.5 m wide pillars with width-to-height ratios of 0.5 and 1, respectively. These pillar widths also correspond to unstable pillars, as highlighted above, with a low strength factor of less than one cutting through them. On the other hand, lower displacements were observed with 4 m and 5 m wide in-stope pillars, which coincide with a stable strength factor. Kaiser [26] noted that this is expected: as the pillars become narrower, they must support higher levels of stress.
Therefore, for the case study situation, the following pillar design is recommended at a shallow depth: a minimum of 20 m for the barrier pillar, a 7 m wide stope with a 4 m wide pillar, and a mining height of 2.5 m.

6. Conclusions

In this study, empirical evaluation techniques were applied to determine the stability of the surface barrier pillar, and the critical span method was used to estimate a barrier pillar width of 16 m under GSI 40. This study further demonstrates that it is critical that the current mining jurisdiction regulatory approach shifts from a fixed minimum allowable 6 m pillar width for metalliferous mines, which may be inadequate under varying geological and operational conditions, to using the safety factor or strength factor as a standard supported by specific numerical modelling. Numerical modelling shows that a 6 m or 10 m barrier pillar width may lead to accidents due to potential slope instability in the boxcut highwall and potential roof falls, suggesting that a width of at least 20 m is necessary for the project. The inclination of the orebody negatively affects barrier and in-stope pillar strength; in a horizontal or flat position, the pillars experience lower principal stress, and the stress increases with increases in the dip angle. For rock mass conditions, if the Geological Strength Index (GSI) is 40 or higher, a 20 m barrier pillar may be adequate, but if the GSI is 30 or lower, a 30 m barrier pillar should be considered. Parametric analysis also suggests that narrower pillars of 4 m may be considered at shallow depths, deviating from the planned 6 m design.

Author Contributions

Conceptualization, B.N., K.K. and J.A.O.; methodology, B.N.; software, B.N.; validation, B.N., K.K. and J.A.O.; formal analysis, B.N.; investigation, B.N.; resources, A.H.; data curation, B.N.; writing—original draft preparation, B.N.; writing—review and editing, B.N.; visualization, B.N.; supervision, H.S. and T.S.; project administration, A.H.; funding acquisition, A.H. All authors have read and agreed to the published version of the manuscript.

Funding

The authors would like to thank the Japan International Cooperation Agency (JICA) Kizuna Program for the financial assistance as part of the doctoral program.

Conflicts of Interest

The authors declare no conflicts of interest.

References

  1. Dunn, M.J.; Parrott, T.T.; Wesseloo, J. Mine Portal Design: Considerations, Methods and Practices; Australian Centre for Geomechanics: Crawley, WA, Australia, 2023; pp. 237–254. [Google Scholar]
  2. Yardmci, A. Crown Pillar Optimization for Surface to Underground Mine Transition in Erzincan/Bizmisen Iron Mine. In Proceedings of the 50th U.S. Rock Mechanics/Geomechanics Symposium, Houston, TX, USA, 26–29 June 2016. [Google Scholar]
  3. Ozbay, M.U.; Ryder, J.A.; Jager, A.J. The Design of Pillar Systems as Practised in Shallow Hard-Rock Tabular Mines in South Africa. J. S. Afr. Inst. Min. Metall. 1995, 95, 7–18. Available online: https://www.saimm.co.za/Journal/v095n01p007.pdf (accessed on 14 July 2025).
  4. Mark, C. Empirical Methods for Coal Pillar Design. In Proceedings of the Second International Workshop on Coalpillar Mechanics and Design, Vail, CO, USA, 6 June 1999. [Google Scholar]
  5. Carter, T.G. Guidelines for Use of the Scaled Span Method for Surface Crown Pillar Stability Assessment; Ontario Ministry of Northern Development and Mines: Sudbury, ON, Canada, 2014. [Google Scholar]
  6. Zhao, X.; Li, L.; Tang, C.; Zhang, H. Stability of Boundary Pillars in Transition from Open Pit to Underground Mining. J. Cent. South Univ. 2012, 19, 3256–3265. [Google Scholar] [CrossRef]
  7. Kumar, H.; Deb, D.; Chakravarty, D. Design of Crown Pillar Thickness Using Finite Element Method and Multivariate Regression Analysis. Int. J. Min. Sci. Technol. 2017, 27, 955–964. [Google Scholar] [CrossRef]
  8. Dintwe, T.K.M.; Sasaoka, T.; Shimada, H.; Hamanaka, A.; Moses, D.N.; Peng, M.; Fanfei, M.; Liu, S.; Ssebadduka, R.; Onyango, J.A. Numerical Simulation of Crown Pillar Behaviour in Transition from Open Pit to Underground Mining. Geotech. Geol. Eng. 2022, 40, 2213–2229. [Google Scholar] [CrossRef]
  9. Das, A.J.; Mandal, P.K.; Paul, P.S.; Sinha, R.K. Generalised Analytical Models for the Strength of the Inclined as Well as the Flat Coal Pillars Using Rock Mass Failure Criterion. Rock Mech. Rock Eng. 2019, 52, 3921–3946. [Google Scholar] [CrossRef]
  10. Kabwe, E. Stability Analysis of Pillars in an Inclined Airleg Stope Under Static Loading Conditions. Geotech. Geol. Eng. 2024, 42, 1541–1572. [Google Scholar] [CrossRef]
  11. Dzimunya, N.; Fujii, Y.; Li, Z.; Amagu Amagu, C. Assessing Pillar Design Strategies in Hard Rock Room-and-Pillar Mining: A Review and Case Studies from the Great Dyke of Zimbabwe. Min. Metall. Explor. 2025, 42, 685–704. [Google Scholar] [CrossRef]
  12. Oberthür, T.; Melcher, F.; Buchholz, P.; Locmelis, M. The Oxidized Ores of the Main Sulphide Zone, Great Dyke, Zimbabwe: Turning Resources into Minable Reserves-Mineralogy Is the Key. J. S. Afr. Inst. Min. Metall. 2013, 113, 191–201. [Google Scholar]
  13. Wilson, A.H.; Prendergast, M.D. Platinum-Group Element Mineralisation in the Great Dyke, Zimbabwe, and Its Relationship to Magma Evolution and Magma Chamber Structure. S. Afr. J. Geol. 2001, 104, 319–342. [Google Scholar] [CrossRef]
  14. Chaumba, J.B.; Musa, C.T. Formation of the Main Sulfide Zone at Unki Mine, Shurugwi Subchamber of the Great Dyke, Zimbabwe: Constraints from Petrography and Sulfide Compositions. Geosphere 2020, 16, 685–710. [Google Scholar] [CrossRef]
  15. Li, C.; Ripley, E.M.; Oberthür, T.; Miller, J.D.; Joslin, G.D. Textural, Mineralogical and Stable Isotope Studies of Hydrothermal Alteration in the Main Sulfide Zone of the Great Dyke, Zimbabwe and the Precious Metals Zone of the Sonju Lake Intrusion, Minnesota, USA. Miner. Deposita 2008, 43, 97–110. [Google Scholar] [CrossRef]
  16. Carter, T.G. A New Approach to Surface Crown Pillar Design. In Proceedings of the 16th Canadian Rock Mechanics Symposium or the Sympodum Canadien de Mecaniques des Roches, Sudbury, ON, Canada, 15–19 June 1992. [Google Scholar]
  17. Hutchinson, D.J.; Phillips, C.; Cascante, G. Risk Considerations for Crown Pillar Stability Assessment for Mine Closure Planning. Geotech. Geol. Eng. 2002, 20, 41–64. [Google Scholar] [CrossRef]
  18. Enslin, Q.; Bosman, J.D. Pillar Stability Assessment Methodology for Massive Mines. In Proceedings of the SANIRE Symposium 2024, Muldersdrift, South Africa, 13–14 June 2024. [Google Scholar]
  19. Barton, N.; Lien, R.; Lunde, J. Engineering Classification of Rock Masses for the Design of Tunnel Support. Rock Mech. 1974, 6, 189–236. [Google Scholar] [CrossRef]
  20. Jing, L. A Review of Techniques, Advances and Outstanding Issues in Numerical Modelling for Rock Mechanics and Rock Engineering. Int. J. Rock Mech. Min. Sci. 2003, 40, 283–353. [Google Scholar] [CrossRef]
  21. Zhang, W.; Dai, B.; Liu, Z.; Zhou, C. Modeling Discontinuous Rock Mass Based on Smoothed Finite Element Method. Comput. Geotech. 2016, 79, 22–30. [Google Scholar] [CrossRef]
  22. Lemos, J.V. Discontinuum Modelling in Rock Engineering. Soils Rocks 2013, 36, 137–156. [Google Scholar] [CrossRef]
  23. Vyazmensky, A.; Elmo, D.; Stead, D.; Rance, J. Numerical Analysis of the Influence of Geological Structures on the Development of Surface Subsidence Associated with Block Caving Mining. In Proceedings of the 5th Conference and Exhibition on Mass Mining, Lulea, Sweden, 9–11 June 2008. [Google Scholar]
  24. Osthus, D.; Godinez, H.C.; Rougier, E.; Srinivasan, G. Calibrating the Stress-Time Curve of a Combined Finite-Discrete Element Method to a Split Hopkinson Pressure Bar Experiment. Int. J. Rock Mech. Min. Sci. 2018, 106, 278–288. [Google Scholar] [CrossRef]
  25. Hoek, E.; Brown, E.T. The Hoek–Brown Failure Criterion and GSI—2018 Edition. J. Rock Mech. Geotech. Eng. 2019, 11, 445–463. [Google Scholar] [CrossRef]
  26. Kaiser, P.K.; Kim, B.; Bewick, R.P.; Valley, B. Rock Mass Strength at Depth and Implications for Pillar Design. Min. Technol. 2011, 120, 170–179. [Google Scholar] [CrossRef]
  27. Brown, E.T.; Potvin, Y.; Carter, J.; Dyskin, A.; Jeffrey, R. Estimating the Mechanical Properties of Rock Masses; Australian Centre for Geomechanics: Crawley, WA, Australia, 2008; pp. 3–22. [Google Scholar]
  28. Hoek, E.; Carranza-Torres, C.; Corkum, B. Hoek-Brown Failure Criterion—2002 Edition. In Mining and Tunnelling Innovation and Opportunity: NARMS-TAC 2002, Proceedings of the 5th North American Rock Mechanics Symposium and 17th Tunnelling Association of Canada Conference, Toronto, ON, Canada, 7–10 July 2002. Available online: https://www.rocscience.com/assets/resources/learning/hoek/Hoek-Brown-Failure-Criterion-2002.pdf (accessed on 14 July 2025).
  29. Bahrani, N.; Kaiser, P.K. Influence of Degree of Interlock on Confined Strength of Jointed Hard Rock Masses. J. Rock Mech. Geotech. Eng. 2020, 12, 1152–1170. [Google Scholar] [CrossRef]
  30. Munemo, P. Prediction of Ground Instability for Coinciding Mining Operations. Master’s Thesis, University of the Witwatersrand, Johannesburg, South Africa, 2021. [Google Scholar]
  31. Napa-García, G.F.; Câmara, T.R.; Navarro Torres, V.F. Optimization of Room-and-Pillar Dimensions Using Automated Numerical Models. Int. J. Min. Sci. Technol. 2019, 29, 797–801. [Google Scholar] [CrossRef]
Figure 1. Map showing the location of the Great Dyke, obtained from Chaumba and Musa [14].
Mining 05 00056 g001
Figure 2. Geological schematic of the main sulphide zone within the Great Dyke.
Mining 05 00056 g002
Figure 3. Layout of the planned underground room and pillar mine.
Mining 05 00056 g003
Figure 5. Model geometry.
Mining 05 00056 g005
Figure 6. Strength factor effect with changing barrier pillar width.
Mining 05 00056 g006
Figure 7. Effect of barrier pillar width on roof and boxcut highwall slope toe.
Mining 05 00056 g007
Figure 8. Strength factor effect with changing ore dip angle for a 20 m barrier pillar.
Mining 05 00056 g008
Figure 9. Barrier pillar stress measured at mid-pillar.
Mining 05 00056 g009
Figure 10. In-stope pillar stress measured at mid-pillar.
Mining 05 00056 g010
Figure 11. Effect of barrier pillar width and inclination on roof displacement.
Mining 05 00056 g011
Figure 12. Highlighted barrier pillar thickness boundaries between GSI 50, 40, and 30.
Mining 05 00056 g012
Figure 13. Panel pillar width optimization.
Mining 05 00056 g013
Figure 14. Effect of in-stope pillar width on roof displacement.
Mining 05 00056 g014
Table 1. Numerical model input: rock mechanical properties.
Rock TypeUnit Weight
(MN/m3)
Poisson’s RationYoung’s Modulus
(GPa)
UCS
(MPa)
Hoek–Brown Parameters
GSImimbsa
Gabbro Norite0.0290.310020150203.3540.003870.506
Websterite0.0330.2512522543273.5260.001780.509
MSZ0.0330.246517040222.5810.001270.511
Bronzitite0.0290.2930.219945253.5060.002210.508
Table 2. Guidelines for acceptable risk level and comparative significance of crown pillar failure, obtained from Carter [5].
ClassProbability of Failure
%
Minimum Factor of SafetyMaximum Scaled Span,
Cs (=Sc)
ESR
(Barton et al., [19])
Design Guidelines for Pillar Acceptability/Serviceable Life of Crown Pillar
ExpectancyYearsPublic
Access
Regulatory
Position on Closure
Operating Surveillance Required
A50–100<111.31Q0.44>5Effectively zero<0.5ForbiddenTotally unacceptableIneffective
B20–501.03.58Q0.443Very, very short-term (temporary mining purposes only); unacceptable risk of failure for temporary civil tunnel portals1.0Forcibly PreventedNot acceptableContinuous sophisticated monitoring
C10–201.22.74Q0.442Very short-term (quasi-temporary stope crowns; undesirable risk of failure for temporary civil works)2–5Actively preventedHigh level of concernContinuous monitoring with instruments
D5–101.52.33Q0.441.6Short-term (semi-temporary crowns, e.g., under non-sensitive mine infrastructure)5–10PreventedModerate level of concernContinuous simple monitoring
E1.5–51.81.84Q0.441.3Medium-term (semi-permanent crowns, possibly under structures)15–20DiscouragedLow to moderate level of concernConscious superficial monitoring
F0.5–1.52.01.12Q0.441Long-term (quasi-permanent crowns, civil portals, near-surface sewer tunnels)50–100AllowedOf limited concernIncidental superficial monitoring
G<0.5>>20.69Q0.440.8Very long-term (permanent crowns over civil tunnels)>100FreeOf no concernNone required
Disclaimer/Publisher’s Note: The statements, opinions and data contained in all publications are solely those of the individual author(s) and contributor(s) and not of MDPI and/or the editor(s). MDPI and/or the editor(s) disclaim responsibility for any injury to people or property resulting from any ideas, methods, instructions or products referred to in the content.