Article

Numerical Investigation of Ultra-Long Gravity Heat Pipe Systems for Geothermal Power Generation at Mount Meager

1
Civil and Environmental Engineering, University of Waterloo, Waterloo, ON N2L 3G1, Canada
2
The Council of Canadian Academies, Ottawa, ON K2P 2K3, Canada
*
Authors to whom correspondence should be addressed.
Mining 2025, 5(3), 55; https://doi.org/10.3390/mining5030055
Submission received: 22 July 2025 / Revised: 28 August 2025 / Accepted: 8 September 2025 / Published: 9 September 2025

Abstract

The Super-long Gravity Heat Pipe (SLGHP) is an efficient geothermal energy utilization technology that can transmit thermal energy by fully utilizing natural temperature differences without external energy input. This study focuses on the high-altitude geothermal environment of Mount Meager, Canada, and employs numerical simulations and dynamic thermal analysis to systematically investigate the thermal transport performance of the SLGHP system under both steady-state and dynamic operating conditions. The study also examines the impact of various structural parameters on the system’s performance. Three-dimensional CFD simulations were conducted to analyze the effects of pipe diameter, length, filling ratio, working fluid selection, and pipe material on the heat transfer efficiency and heat flux distribution of the SLGHP. The results indicate that working fluids such as CO2 and NH3 significantly enhance the heat flux density, while increasing pipe diameter may reduce the amount of liquid retained in the condenser section, thereby affecting condensate return and thermal stability. Furthermore, dynamic thermal analysis using a three-node RC network model simulated the effects of diurnal temperature fluctuations and variations in the convective heat transfer coefficient in the condenser section on system thermal stability. The results show that the condenser heat flux can reach a peak of 5246 W/m2 during the day, while maintaining a range of 2200–2600 W/m2 at night, with the system exhibiting good thermal responsiveness and no significant lag or flow interruption. In addition, based on the thermal output of the SLGHP system and the integration with the Organic Rankine Cycle (ORC) system, the power generation potential analysis indicates that the system, with 100 heat pipes, can provide stable power generation of 50–60 kW. In contrast to previous SLGHP studies focused on generalized modeling, this work introduces a site-specific CFD–RC framework, quantifies structural sensitivity via heat flux indices, and bridges numerical performance with economic feasibility, offering actionable insights for high-altitude deployment. This system has promising practical applications, particularly for providing stable renewable power in remote and cold regions. Future research will focus on field experiments and system optimization to further improve system efficiency and economic viability.

1. Introduction

Geothermal energy offers a clean and continuous baseload power source, particularly attractive in volcanically active regions with high thermal gradients [1,2]. One such region with significant geothermal potential is the Mount Meager volcanic complex in British Columbia, Canada, located ~160 km north of Vancouver as part of the Garibaldi Volcanic Belt [3]. As Canada’s only recently active volcano, Mount Meager exhibits high geothermal gradients and subsurface temperatures exceeding 250 °C at 2 km depth [4].
However, prior exploration efforts—such as five test wells drilled in the 1970s—revealed insufficient natural permeability and fluid flow to support conventional hydrothermal power generation [5]. Enhanced Geothermal Systems (EGSs) have been proposed to overcome such limitations, but concerns about induced seismicity and operational complexity persist [6,7]. As an alternative, closed-loop geothermal systems eliminate fluid extraction by circulating a working fluid in sealed wellbores [8,9,10]. Yet, their reliance on conduction and external pumps introduces efficiency and maintenance challenges.
A promising passive solution is the super-long gravity heat pipe (SLGHP), a two-phase closed-loop system that uses gravity-driven circulation and latent heat to transport thermal energy [11]. Vaporized working fluid rises from deep reservoirs and condenses at the surface, releasing heat without mechanical pumping. Compared to conventional EGS or pumped geothermal systems, SLGHPs offer several advantages, including reduced environmental risks, the elimination of reinjection requirements, and the potential for repurposing abandoned wells. These characteristics make SLGHPs a sustainable and low-maintenance alternative, enhancing project viability by lowering permitting complexity, reducing capital expenditures (CAPEX), and minimizing regulatory and operational constraints [12].
Over the past few years, significant progress has been made in developing and understanding super-long gravity heat pipes for geothermal applications. A number of analytical and numerical studies have explored the key design parameters that govern SLGHP performance, including the pipe length, diameter, working fluid fill ratio, and the properties of the geological formation [10,12,13,14]. One salient finding is that longer and larger-diameter heat pipes can transfer more heat, but only up to the limits set by fluid dynamics and the reservoir’s thermal recharge. A recent comprehensive review by Anand et al. [13] documents the state-of-the-art of this technology and reports that a prototype 3000 m gravity heat pipe was successfully field-tested in China, using water as the working fluid and achieving about 190 kW of geothermal heat extraction. This impressive result, accomplished with a near-zero pressure differential between the hot end and cold end, exemplifies the efficiency of heat pipe heat transfer. It also confirmed the basic viability of the SLGHP concept for power-relevant heat outputs.
Field demonstrations of gravity-driven geothermal heat pipes are now emerging, providing practical insights beyond theoretical models. Notably, Chen et al. [15] describe a geothermal space heating system in Taiyuan, China, which utilizes two SLGHPs of 2.02 km and 2.18 km length installed in closely spaced boreholes. Despite the relatively moderate formation temperature (~63 °C at 2 km depth), the system was able to deliver on the order of 1 MW of heat for building heating (covering ~25,000 m2 of floor area) when coupled with a heat pump. The performance was stable over months of operation, and interestingly, the longer heat pipe yielded significantly more heat than the shorter one due to enhanced downhole convective effects. This real-world case demonstrated the technical viability of SLGHPs for direct-use heating and highlighted the importance of well design and local hydrogeology on heat pipe output. In Europe, parallel efforts are underway: for example, Gselman et al. [14] implemented a pilot gravity heat pipe in an abandoned 3.5 km deep well in northeastern Slovenia as part of a feasibility study for geothermal power generation. Such pilot projects will provide valuable data on long-term heat extraction and guide the scaling of gravity heat pipe systems. In addition, researchers are investigating optimal working fluid selection to maximize heat transfer efficiency under various reservoir conditions. The working fluid must be chosen based on its thermodynamic phase change characteristics at the operating temperature–pressure range, vapor density (which influences pressure drop), and compatibility with the well materials [15]. Water is often the default choice due to its high latent heat and availability, but other fluids (e.g., organic refrigerants or nitrogen/CO2 in certain cases) may offer advantages in specific temperature regimes. This growing body of literature—spanning simulation studies, experimental tests, and early field deployments—underpins the potential of gravity-driven geothermal heat pipes and frames the remaining challenges.
While previous studies have explored SLGHPs using experimental and numerical approaches, they often focus on isolated parameters and generalized sites, with limited relevance to high-altitude regions like Mount Meager. Moreover, few works systematically quantify the influence of design parameters or link heat transfer performance to techno-economic feasibility. To address these gaps, this study integrates CFD and dynamic RC modeling with sensitivity and cost-performance analysis, aiming to guide practical SLGHP deployment in complex geothermal settings. In summary, the gravity geothermal heat pipe offers a simpler and potentially more sustainable way to use high-temperature geothermal resources at Mount Meager compared to traditional systems. The following sections provide a numerical analysis of long gravity heat pipes with different diameters, lengths, filling rates, and working fluids under realistic conditions. Basic power potential and efficiency estimates will also be discussed.

2. Mt Meager Geothermal Resources and Wellbore Assessment

The Mount Meager volcanic complex is located in interior British Columbia at the northern end of the Garibaldi Volcanic Belt, approximately 160–170 km north of Vancouver (Figure 1). Regional geological surveys and radiometric dating indicate ongoing volcanic activity over the past two million years. The region features significant volcanic ash deposits and hydrothermal surface expressions, including numerous high-temperature hot springs and fumaroles (e.g., Meager Creek and Pebble Creek), which confirm the presence of an active hydrothermal system [3].
Recent shallow temperature probe monitoring along Meager Creek has further delineated near-surface thermal anomalies, consistent with borehole profiles and highlighting zones of elevated geothermal potential (Figure 2). Despite seasonal surface variability, the deeper temperature structure effectively reflects upwelling mantle heat, validating the spatial continuity of the geothermal reservoir [17].
Topographic relief in the area is substantial, with elevation differences of several hundred meters between valleys and peaks. These variations produce complex surface heat exchange dynamics and influence snowmelt and convective processes. Therefore, any geothermal heat pipe deployment must account for terrain, snow cover, and thermal stability when optimizing system layout and operational safety [16,18].
In summary, Mount Meager possesses several key attributes favorable for gravity heat pipe-based geothermal development: high-enthalpy reservoirs with elevated heat flux, stable hydrothermal activity, pre-existing wells suitable for retrofitting, and topographical conditions conducive to gravity-driven thermosiphon operation. These factors provide a robust geotechnical foundation for subsequent numerical simulations and field validation.

3. Heat Pipe Technology Scheme Selection and Design Optimization

3.1. Principle of Closed Super-Long Gravity Heat Pipe

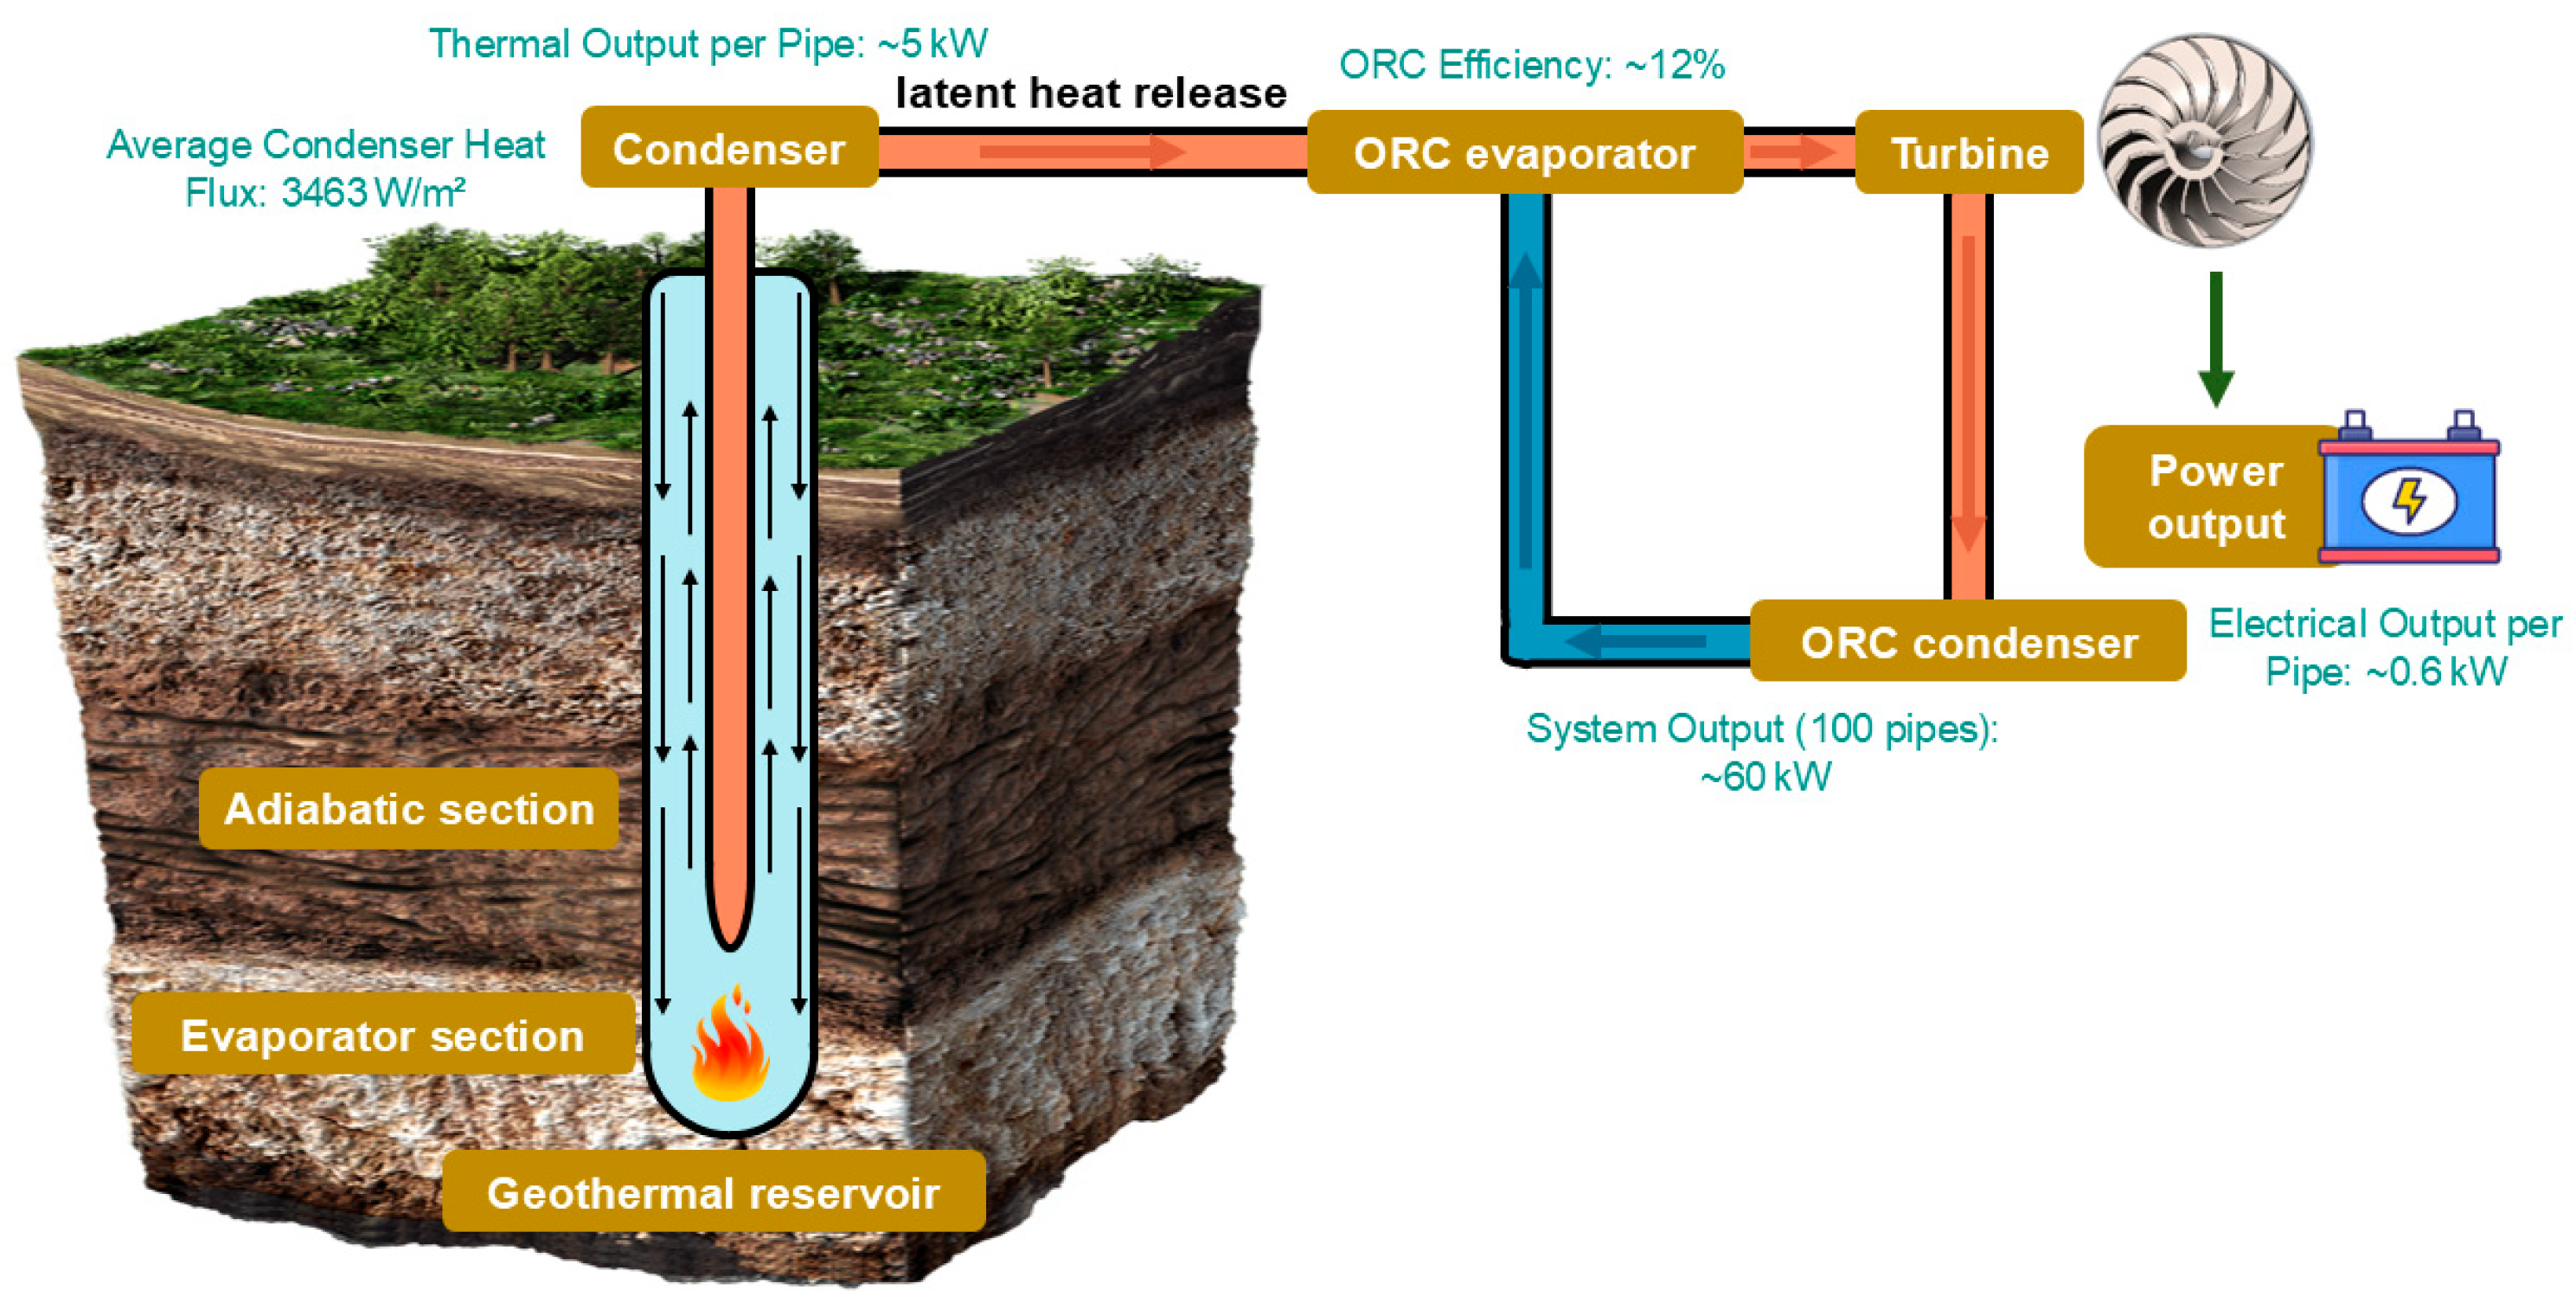
The closed SLGHP operates through a two-phase circulation mechanism that enables passive geothermal heat extraction and delivery to the surface [13]. In this system, the working fluid undergoes evaporation in the high-temperature zone at depth and rises to the surface through the adiabatic section, where it condenses and releases latent heat in the condenser [19]. The condensed liquid then returns to the bottom of the well under gravity, forming a sealed loop that enables stable heat transport without mechanical pumping or active circulation devices. This approach leverages latent heat transfer and natural thermosiphon effects to achieve efficient heat transfer under modest temperature differences, supporting reliable long-term operation with minimal maintenance requirements [20].
In practical applications, the thermal energy released at the surface condenser can be directly coupled with an organic Rankine cycle (ORC) module for small-scale power generation. In this integrated configuration, the heat released by the SLGHP condenser is used to vaporize a low-boiling-point ORC working fluid in the ORC evaporator, producing high-pressure vapor that drives a micro-turbine connected to a generator for electricity production [21,22]. After expansion through the turbine, the ORC vapor enters a condenser where it is cooled and converted back into liquid form, which is subsequently recirculated to the ORC evaporator to complete the closed-loop cycle (Figure 3). In this configuration, the SLGHP delivers a steady-state condenser heat flux of approximately 3463 W/m2, corresponding to a thermal output of ~5 kW per pipe. With an ORC conversion efficiency of 12%, this yields about 0.6 kW of net electrical output per unit, enabling a total system capacity of roughly 60 kW when scaled to 100 parallel units. These values demonstrate the quantitative thermal–electrical coupling achieved in the integrated SLGHP–ORC system.

3.2. Working Fluid Selection and Performance Analysis

The selection of working fluids is a critical factor influencing the heat transfer efficiency, startup performance, and long-term stability of the SLGHP system [23]. Considering the high-temperature (250–300 °C) deep geothermal conditions and complex pressure environment of the Mount Meager region [16], this study systematically evaluates the applicability of water (H2O), carbon dioxide (CO2), ammonia (NH3), and selected organic fluids (e.g., propane, butane) in SLGHP systems. The analysis focuses on comparing their thermal stability, latent heat of vaporization, density, viscosity, thermal conductivity, corrosiveness, and environmental safety to guide practical engineering selection and numerical optimization [20].
Water has a high latent heat of vaporization (~2257 kJ/kg), enabling significant heat transfer and stable circulation under high-temperature deep-well conditions. It is inexpensive, environmentally friendly, and widely used in geothermal applications [24]. However, water may dissolve minerals under high-temperature and high-pressure conditions, leading to scaling and potential corrosion issues, necessitating careful consideration of material compatibility and anti-scaling measures. Additionally, water’s low-temperature startup characteristics are relatively poor in cold environments, which may reduce initial circulation efficiency [25].
CO2 exists as a liquid below its critical point (31 °C, 7.38 MPa) and exhibits small gas–liquid density differences, low viscosity, and good thermal conductivity under supercritical conditions, facilitating improved circulation and heat transfer efficiency within the SLGHP system. CO2 can achieve low-temperature startup under high-pressure conditions, reducing thermal inertia and aiding initial startup and stable operation in cold climates. However, the latent heat of vaporization of CO2 (~200 kJ/kg) is lower than that of water and ammonia, necessitating higher circulation flow rates to compensate for the lower latent heat [26]. Additionally, CO2 can form carbonic acid when in contact with water at high temperatures, potentially causing corrosion, which requires the use of corrosion-resistant materials such as 316L stainless steel [27].
Ammonia has a low boiling point (−33.4 °C) and a moderate latent heat of vaporization (~1370 kJ/kg), coupled with good thermal conductivity and low viscosity, making it highly suitable for SLGHP systems requiring low-temperature startup and rapid thermal response, especially in high-latitude cold regions. Ammonia is chemically active and can corrode copper and certain aluminum alloys; however, it exhibits good stability in stainless steel structures. Appropriate sealing designs and material selection can effectively mitigate leakage and corrosion risks. Additionally, ammonia leaks are easily detectable in closed systems, and the use of tracers and monitoring systems can ensure safe and controlled operation [28].
Some organic fluids, such as propane, butane, and R245fa, have low boiling points and good thermal stability, enabling efficient circulation under low to moderate temperature conditions. However, under the high-temperature (250–300 °C) deep-well conditions at Mount Meager, these fluids may exhibit insufficient thermal stability and potential decomposition, making them unsuitable as primary working fluids [21].
Considering the high-temperature and high-pressure conditions of the Mount Meager region, fluid properties, material compatibility, and on-site operational and maintenance economics, this study recommends water, carbon dioxide, and ammonia as the priority candidate working fluids for the SLGHP system. Subsequent CFD numerical simulations and dynamic operational analyses will be conducted to verify the circulation stability and heat extraction efficiency of the SLGHP system under different single-fluid and mixed-fluid scenarios, providing a solid theoretical and data foundation for field deployment and scalable geothermal energy development [29].
From an environmental and regulatory perspective, NH3 is classified as a toxic and hazardous substance under many national guidelines, requiring strict containment, leak monitoring, and compliance with safety regulations for transport and storage. While ammonia leaks are easily detectable and manageable with proper sealing and materials, their use may be restricted in environmentally sensitive zones. Similarly, although CO2 is generally considered non-toxic, it can pose asphyxiation risks in confined spaces, and its high-pressure behavior requires appropriate design of safety valves and pressure relief systems. These considerations must be integrated into site-specific risk assessments and regulatory planning for SLGHP deployment.

3.3. Structural Parameter Optimization of the Heat Pipe

The structural parameters of the SLGHP largely determine its heat flux density, circulation stability, and the reliability and economic viability of long-term system operation. Based on the geological structure, well depth distribution, and deep geothermal temperature characteristics of the Mount Meager region, it is recommended that the SLGHP system utilize a pipe diameter range of 76–114 mm and a length range of 600–2000 m to enable efficient and stable extraction and utilization of deep geothermal energy under varying well depths and geothermal gradients [23]. Specifically, a 76 mm diameter is suitable for medium-to low-power and cost-sensitive projects, maintaining basic circulation stability while reducing material and construction costs. In contrast, a 114 mm diameter is appropriate for high-power output and circulation efficiency-focused scenarios, ensuring low flow resistance and pressure drop under high thermal loads, enhancing the stability of vapor ascent and condensate return, and maintaining a high continuous heat flux output under deep high-temperature conditions [23]. Reasonable diameter selection requires a balance between performance optimization and cost control to avoid excessive conductive heat loss and increased structural complexity due to oversized pipes. Regarding length design, depths exceeding 600 m can access stable high-temperature zones conducive to effective working fluid vaporization, ensuring efficient operation of the evaporator section. Extending the pipe length to 2000 m allows for further acquisition of deep high-temperature energy [15,30].
For material selection, it is recommended to use metallic materials with excellent high-temperature resistance and corrosion resistance as the primary structure. Stainless steel (304/316L) offers good chemical stability and mechanical strength, making it suitable for long-term operation with various working fluids. Aluminum alloys, due to their higher thermal conductivity, can be used locally in sections requiring enhanced heat transfer but require effective anti-corrosion measures to extend service life [31].
The filling ratio is a critical parameter affecting phase-change heat transfer efficiency and circulation stability within the system [32]. It is recommended to maintain a filling ratio of 30–50%, ensuring a continuous liquid supply in the evaporator section to prevent dry-out while providing sufficient space for vapor ascent, thereby avoiding liquid blockage and ensuring stable and efficient system operation.
For insulation design, to reduce heat loss along the transfer path and enhance heat transfer efficiency, it is advisable to adopt a multi-layer insulation structure for the non-heat-extraction section between the evaporator and the surface condenser of the SLGHP [33]. Utilizing high-performance insulation materials combined with reflective layers will help maintain stable heat transfer within the system, maximizing the usable heat output at the surface.
Based on the above structural parameter scheme, a combination of numerical simulation and one-dimensional lumped parameter modeling will be employed to optimize and verify the system. The analysis will look at flow and heat flux of the SLGHP under different pipe sizes, lengths, filling rates, and working fluids. This will help roughly estimate thermal efficiency and power use to find better design and operating choices [34].

4. Thermal Performance Simulation and Validation

4.1. Thermal Performance Simulation Framework

To systematically evaluate and validate the heat extraction capacity and dynamic response characteristics of the closed SLGHP under deep high-temperature geothermal conditions in the Mount Meager region, and to provide a reliable foundation for subsequent engineering design and economic analysis, this study adopts a multi-faceted simulation framework that integrates CFD numerical simulation validation, simplified 1D thermal resistance network (TRN) cross-comparison, and dynamic RC network thermal analysis.
First, under steady-state conditions, a three-dimensional numerical model of the SLGHP is constructed using ANSYS Fluent [2023 R2] software to systematically compare different combinations of key parameters, including working fluids (H2O, NH3, CO2), pipe diameters (76 mm, 90 mm, 114 mm), pipe lengths (600 m, 1200 m, 2000 m), filling ratios (30%, 40%, 50%), and pipe materials (304L stainless steel, aluminum alloys). The model simulates the temperature distribution, phase-change interface location, and steady-state heat flux density across the evaporator, adiabatic, and condenser sections to obtain a complete heat transfer pathway and the system’s heat extraction capacity, evaluating its performance under deep geothermal temperatures (250–265 °C) with a surface heat rejection temperature of 35 °C. Concurrently, a simplified one-dimensional thermal resistance network (1D TRN) model is established, incorporating formation thermal resistance, pipe wall conductive resistance, and condenser convective resistance, to calculate the heat flux density and cross-validate with CFD results, ensuring a deviation within 1% to confirm the reliability of the numerical approach and provide accurate boundary conditions for subsequent dynamic simulations.
Second, to investigate the dynamic thermal response characteristics of the SLGHP under typical winter diurnal temperature fluctuations (−12 °C to −3 °C) and wind speed variations in the Mount Meager region, a simplified three-node dynamic RC network model is developed (see Appendix B for the Python code). This model couples the deep rock formation (stable high-temperature heat source), the working fluid in the evaporator section (heat exchange node), and the condenser section’s convective interface (heat dissipation node), comprehensively considering the effects of different working fluids, pipe diameters (three levels), pipe lengths (three levels), filling ratios (three levels), and materials on heat pipe performance. The model simulates the dynamic variations in heat flux density and temperature distribution over a 24 h period, analyzing the system’s startup performance, dynamic response time, and heat output fluctuations under diurnal cycles, thereby providing essential data for the efficient coupling design of the SLGHP with an ORC micro-power generation module. It is acknowledged that the current simulation framework adopts a simplified geological domain with homogeneous thermal properties and planar terrain boundaries. While this approach facilitates the isolation and analysis of key design parameters (e.g., pipe length, working fluid, material selection), it does not fully account for the geological heterogeneity and topographic complexity inherent to the Mount Meager region. Moreover, the RC network model used for dynamic thermal analysis employs a lumped-parameter formulation, which lacks spatial resolution and does not capture non-linear effects such as mass accumulation, transient interfacial transport, or fluid–structure interactions. The economic model further relies on generalized cost estimates and assumed system configurations, without incorporating site-specific market conditions or regulatory constraints, which may affect the accuracy of financial projections. Lastly, the current study remains purely numerical and lacks field-scale experimental validation. Future research will incorporate stratified geological layers, terrain-informed boundary conditions, and in situ measurement data to enhance model fidelity. Additionally, pilot-scale demonstrations and field deployments will be pursued to validate the thermal performance, long-term stability, and techno-economic viability of the SLGHP–ORC system under real operating conditions.
Finally, based on the steady-state validation and dynamic simulation results, quantitative analysis and optimization are conducted from the following perspectives: (1) Using steady-state surface heat flux data to check if the SLGHP can stably extract heat under Mount Meager’s high-temperature geothermal conditions. (2) Using vapor–liquid volume fraction and heat flux data to see how different fluids, pipe sizes, lengths, fill rates, and materials affect heat transfer performance. (3) Checking how these design choices impact heat flux and efficiency to improve SLGHP design while keeping costs in mind.

4.2. Steady-State Simulation Validation Results

4.2.1. Test Matrix Design for Simulation

To verify the steady-state heat extraction capacity of the SLGHP system under deep high-temperature geothermal conditions at the Mount Meager site and to investigate the influence of key design parameters on thermal performance, a refined and efficient simulation matrix consisting of 10 representative cases was established. These cases were strategically selected to independently evaluate the effects of five primary structural variables: working fluid type, pipe diameter, pipe length, filling ratio, and pipe material. Specifically, the matrix includes three levels of pipe diameter (76 mm, 90 mm, 114 mm), three pipe lengths (600 m, 1200 m, 2000 m), three filling ratios (30%, 40%, 50%), and two material types (304 stainless steel and aluminum alloy), while also covering three typical working fluids (H2O, NH3, and CO2). Each case is designed to enable clear one-variable comparisons against a designated baseline, ensuring that the thermal transport mechanisms and sensitivity patterns associated with each parameter can be effectively isolated and analyzed. The specific configurations of these 10 cases are summarized in Table 1.

4.2.2. Numerical Simulation Methods and Boundary Conditions

To assess the steady-state heat transfer performance of the SLGHP system under deep high-temperature geothermal conditions at the Mount Meager site, and to analyze the effects of key design parameters such as working fluid, geometry, and pipe material, a series of three-dimensional steady-state simulations were conducted using ANSYS Fluent [2023 R2]. The simulation domain includes the evaporator, adiabatic, and condenser sections, with consideration of multiphase convection, latent heat transfer, buoyancy-driven flow, and thermophysical property variations under operating conditions.
The conservation of mass is governed by the continuity equation:
ρ t + ( ρ v ) = 0
where ρ is the fluid density (kg/m3), v is the velocity vector (m/s), and t represents time (s). This equation ensures mass balance within each control volume by accounting for inflow and outflow rates.
The momentum conservation equation, formulated as the Navier–Stokes equation, governs the fluid motion under pressure, viscous, and gravitational forces:
ρ v t + v v = p + μ v + v T + ρ g
Here, p is the static pressure (Pa), μ is the dynamic viscosity (Pa·s), and g denotes gravitational acceleration (m/s2). The viscous term accounts for shear-induced momentum diffusion. Turbulent flow in the vapor phase is captured using the standard k-ε model. The standard k-ε turbulence model was selected based on its widespread application in gravity-driven heat pipe and two-phase thermosyphon simulations involving similar Reynolds number regimes and phase-change dynamics [10,29]. While more advanced models (e.g., Reynolds Stress or LES) may capture finer flow structures, the k–ε model offers a reliable balance between stability and computational cost for high-aspect-ratio domains. Its adequacy for the present application is supported by the agreement of predicted vapor–liquid interface patterns and localized heat flux peaks with prior experimental and field-scale observations [10,15].
Thermal energy transport within the system is described by the energy conservation equation:
ρ c p T t + v T = ( k T ) + S p h a s e
In this equation, T is the temperature (K), c p is the specific heat at constant pressure (J/(kg·K)), k is the thermal conductivity (W/(m·K)), and S p h a s e represents the energy source term associated with phase change.
The phase change process is modeled using the Lee model, which introduces a latent heat source term defined as:
S p h a s e = m ˙ p h a s e h f g , m ˙ p h a s e = C ρ s a t ρ τ
where m ˙ p h a s e is the mass transfer rate per unit volume (kg/(m3·s)), h f g is the latent heat of vaporization (J/kg), ρ s a t is the saturation density (kg/m3), C is an empirical tuning constant, and τ is the characteristic phase change time (s). This approach captures the effects of local saturation deviation and enables a gradual, numerically stable transition between phases.
The gas–liquid interface is resolved using the Volume of Fluid (VOF) method, which tracks the volume fraction of each phase within the computational domain. The transport equation for the volume fraction α q of phase q is written as:
α q t + ( α q v ) = 0
subject to the constraint ∑ α q = 1, ensuring the physical consistency of multiphase domains. The interface between vapor and liquid phases is implicitly defined by regions where α q ≈ 0.5.
Boundary conditions were defined based on measured geothermal gradients and field data specific to the Mount Meager site [16,17]. The lower boundary of the system, representing the geothermal heat source, was maintained at 250–265 °C, reflecting observed subsurface temperatures. The condenser section was assigned a fixed wall temperature of 30–40 °C, simulating heat rejection to ambient air or cooling media. A convective heat transfer coefficient in the range of 10–20 W/(m2·K) was applied to external surfaces to represent natural and forced convection effects near the surface.
Thermophysical properties of working fluids—including density, viscosity, specific heat, thermal conductivity, and latent heat—were defined based on pressure- and temperature-dependent values from reliable databases. Local mesh refinement was applied in regions of strong phase interaction, particularly near the evaporator and condenser sections. Simulations were performed under steady-state conditions and considered converged when residuals for all governing equations dropped below 10−6. Additional convergence criteria included stabilization of temperature and vapor volume fraction fields over successive iterations.
In this numerical investigation, heat loss from the outer surface of the heat pipe to the surrounding environment was explicitly accounted for through convective heat transfer. A convective boundary condition, with a heat transfer coefficient ranging between 10 and 20 W/(m2·K), was applied to the condenser section, representing realistic natural convection conditions. Dynamic variations in ambient temperature and convective heat transfer coefficients were also incorporated into transient simulations using a three-node RC network model. Pipe material conduction losses were considered by assigning appropriate thermal conductivities for selected pipe materials (304 stainless steel and aluminum alloys). Radiative heat losses were not explicitly modeled, as the outer surface temperatures of the SLGHP remain below ~120 °C under all simulated conditions. At these temperatures, the radiative heat flux is estimated to be <5% of the total heat loss, and thus considered negligible relative to convective and conductive pathways.
A mesh independence study was conducted using three grid levels for Case 1 (coarse: ~0.5 million cells, baseline: ~1.2 million, fine: ~2.5 million), revealing less than 2.1% variation in average condenser heat flux and confirming mesh-insensitive results. Boundary conditions, including geothermal source temperatures (250–265 °C) and surface convection coefficients (10–20 W/m2·K), were assigned based on published site measurements and regional geological survey data [16,17]. To ensure numerical stability, simulations were monitored using both residual convergence criteria (10−6) and the temporal smoothing of key fields such as temperature and vapor volume fraction. Throughout all steady-state and transient simulations, no divergence, non-physical artifacts, or convergence failures were observed.

4.2.3. Steady-State Simulation Results and Model Validation

To gain an in-depth understanding of the steady-state heat transfer and flow behavior of the SLGHP system under representative operating conditions, this study selects Case 1 as the pipe material—for three-dimensional numerical simulation and visualization. The analysis focuses on the spatial characteristics of Total Surface Heat Flux and the volume fraction distribution of the working fluid in the evaporator section. Additionally, a simplified one-dimensional thermal resistance network model (1D TRN) is constructed to verify and compare the simulation results.
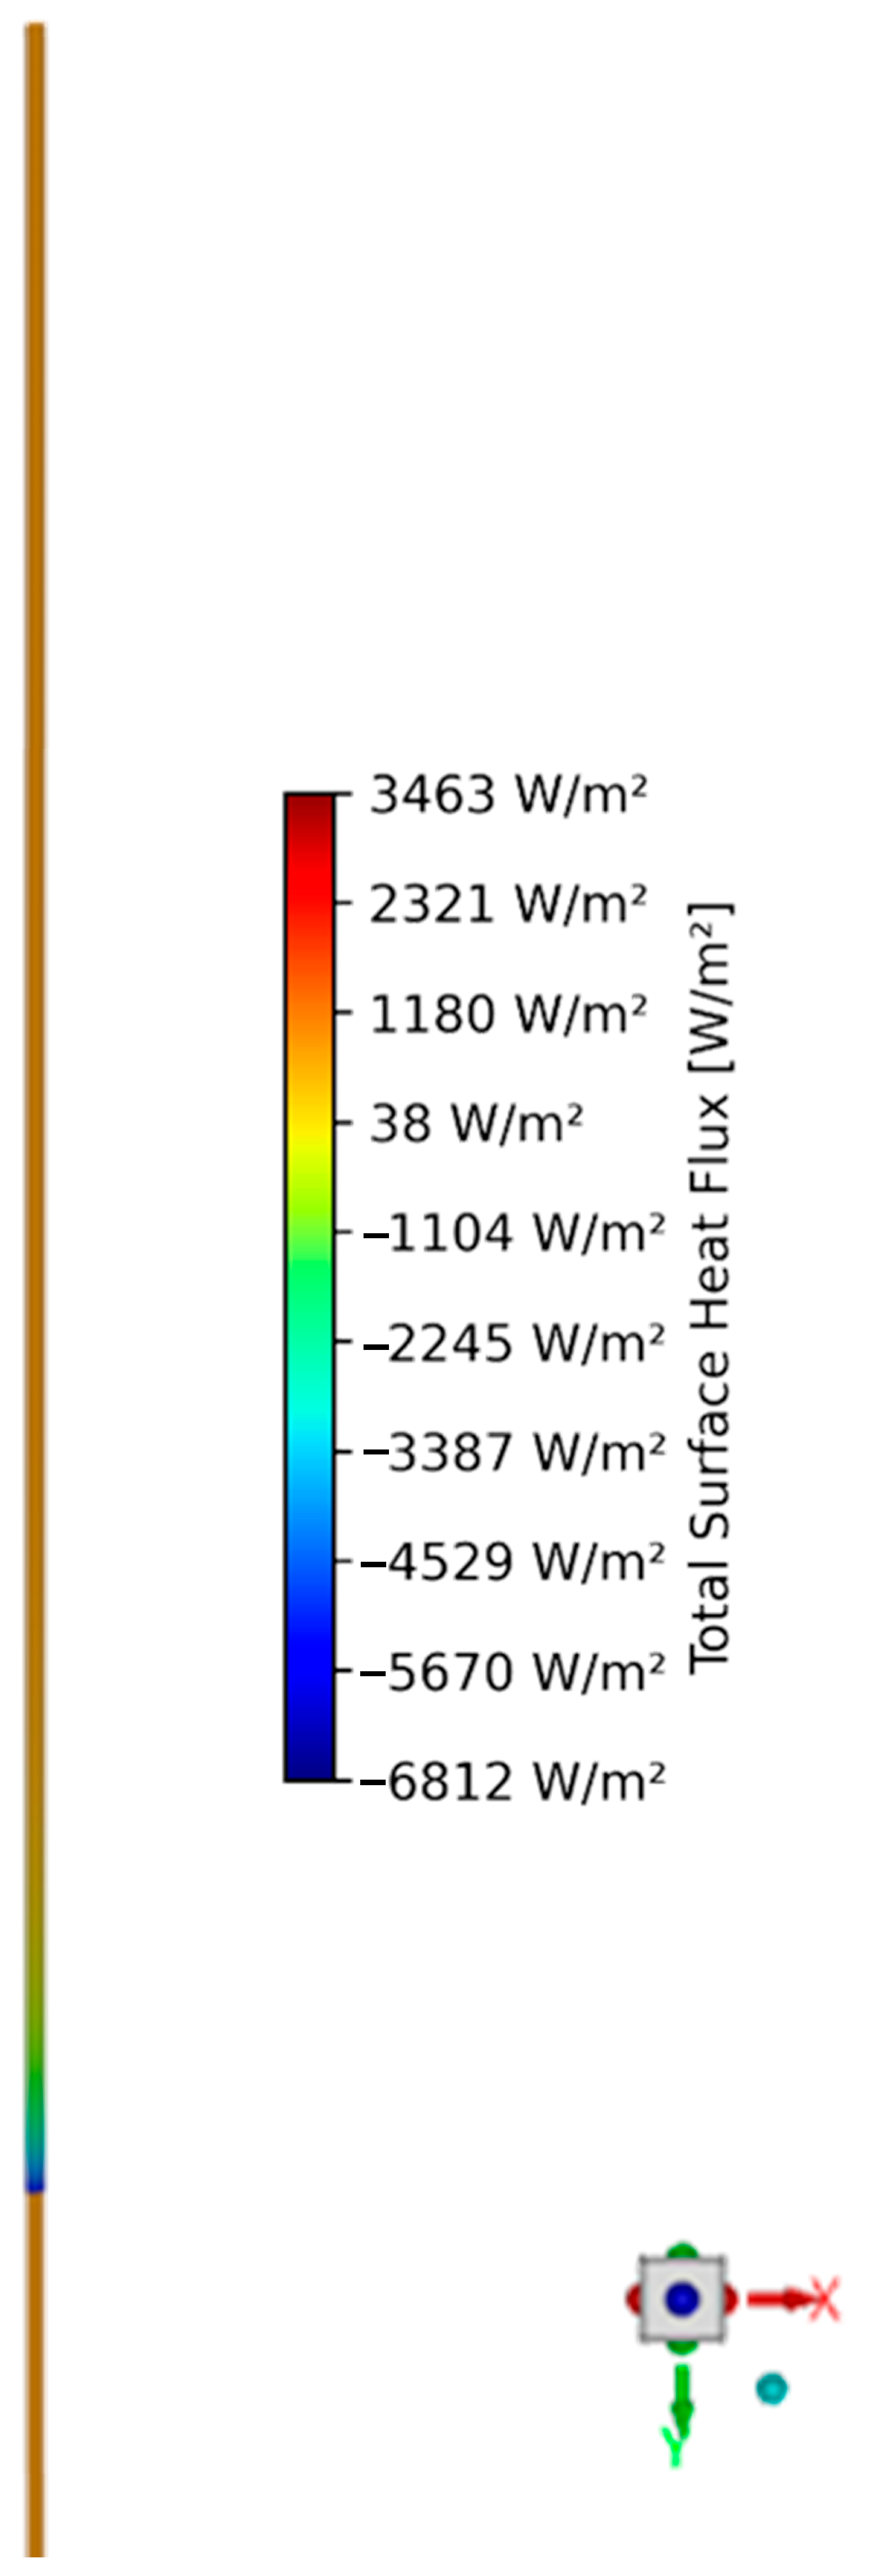
As shown in Figure 4, the surface heat flux along the SLGHP outer wall under Case 1 exhibits significant non-uniformity. Heat transfer is highly concentrated in the bottom 200 m of the evaporator section, with a maximum flux of 3463 W/m2. In contrast, the adiabatic and condenser sections maintain near-zero or even negative heat fluxes, with a peak reverse heat flux of approximately −6812 W/m2 in localized regions, indicating intense heat release due to condensation at the top. This distribution clearly reflects the classic “bottom-heating, top-cooling” operational mechanism of SLGHP systems.
Figure 5 presents the corresponding liquid-phase volume fraction distribution. The results indicate significant liquid accumulation at the pipe bottom (Volume Fraction > 0.8), while the condenser section is predominantly vapor (Volume Fraction < 0.3). The vapor–liquid interface is located approximately within the lower third of the pipe length. The phase interface appears stable and continuous, with no abrupt fluctuations, suggesting the system has reached a typical steady-state regime. The internal flow is primarily driven by gravitational head and latent heat of phase change, with no large-scale recirculation or instability observed.
To further verify the accuracy of the CFD model in estimating heat transfer performance, this study employs a one-dimensional thermal resistance network (1D TRN) model to independently calculate the heat flux under the same operating conditions. This method simplifies the heat transfer path into a series of three thermal resistances—comprising the surrounding geological formation, the pipe wall, and the condenser—thereby providing a computationally efficient approach for approximating the steady-state heat transfer process.
For the geological conduction, the thermal resistance R g e o accounts for radial heat transfer from the far-field formation to the outer wall of the pipe. It is given by:
R g e o = 1 2 π k g e o L l n r r p i p e
where k g e o is the thermal conductivity of the formation, L is the pipe length, r is the equivalent far-field radius, and r p i p e is the outer radius of the pipe.
The pipe wall conduction resistance R w a l l accounts for axial heat transfer through the stainless steel wall and is expressed as:
R w a l l = l n ( r o / r i ) 2 π k w a l l L
where r i and r o are the inner and outer radii of the pipe, respectively, and k w a l l is the thermal conductivity of the pipe material.
The convective heat transfer resistance at the condenser, denoted R c o n d , is defined as:
R c o n d = 1 h c o n d A
where h c o n d is the convective heat transfer coefficient at the condenser and A is the outer surface area of the pipe.
Based on this model and the representative physical parameters and boundary conditions, the estimated surface heat flux from the 1D TRN method is 3375.5 W/m2. Compared with the CFD simulation result of 3463 W/m2, the relative deviation is approximately 2.5%. This discrepancy is primarily attributed to the TRN model’s inability to account for localized enhancements in phase-change heat transfer and fluid motion near the liquid–vapor interface. Nonetheless, the high degree of agreement between the two methods confirms the validity and reliability of the CFD model in capturing the steady-state heat transfer mechanism of the SLGHP system. The 1D TRN calculation process has been fully implemented in Python 3.10.13, and the complete source code is provided in Appendix A.
Given the large number of tested operating conditions, presenting individual contour plots of heat flux and liquid volume fraction for each case would result in redundant visual information and compromise the clarity of comparative analysis. To enhance the compactness of data presentation and improve the distinguishability of parameter-based comparisons, this study adopts line plots to systematically compare key thermal indicators—namely the condensation section heat flux and liquid volume fraction—under varying parametric conditions. This approach aims to highlight the influence mechanisms and sensitivity enhancement trends of critical operating parameters on the steady-state thermal performance of the SLGHP system.
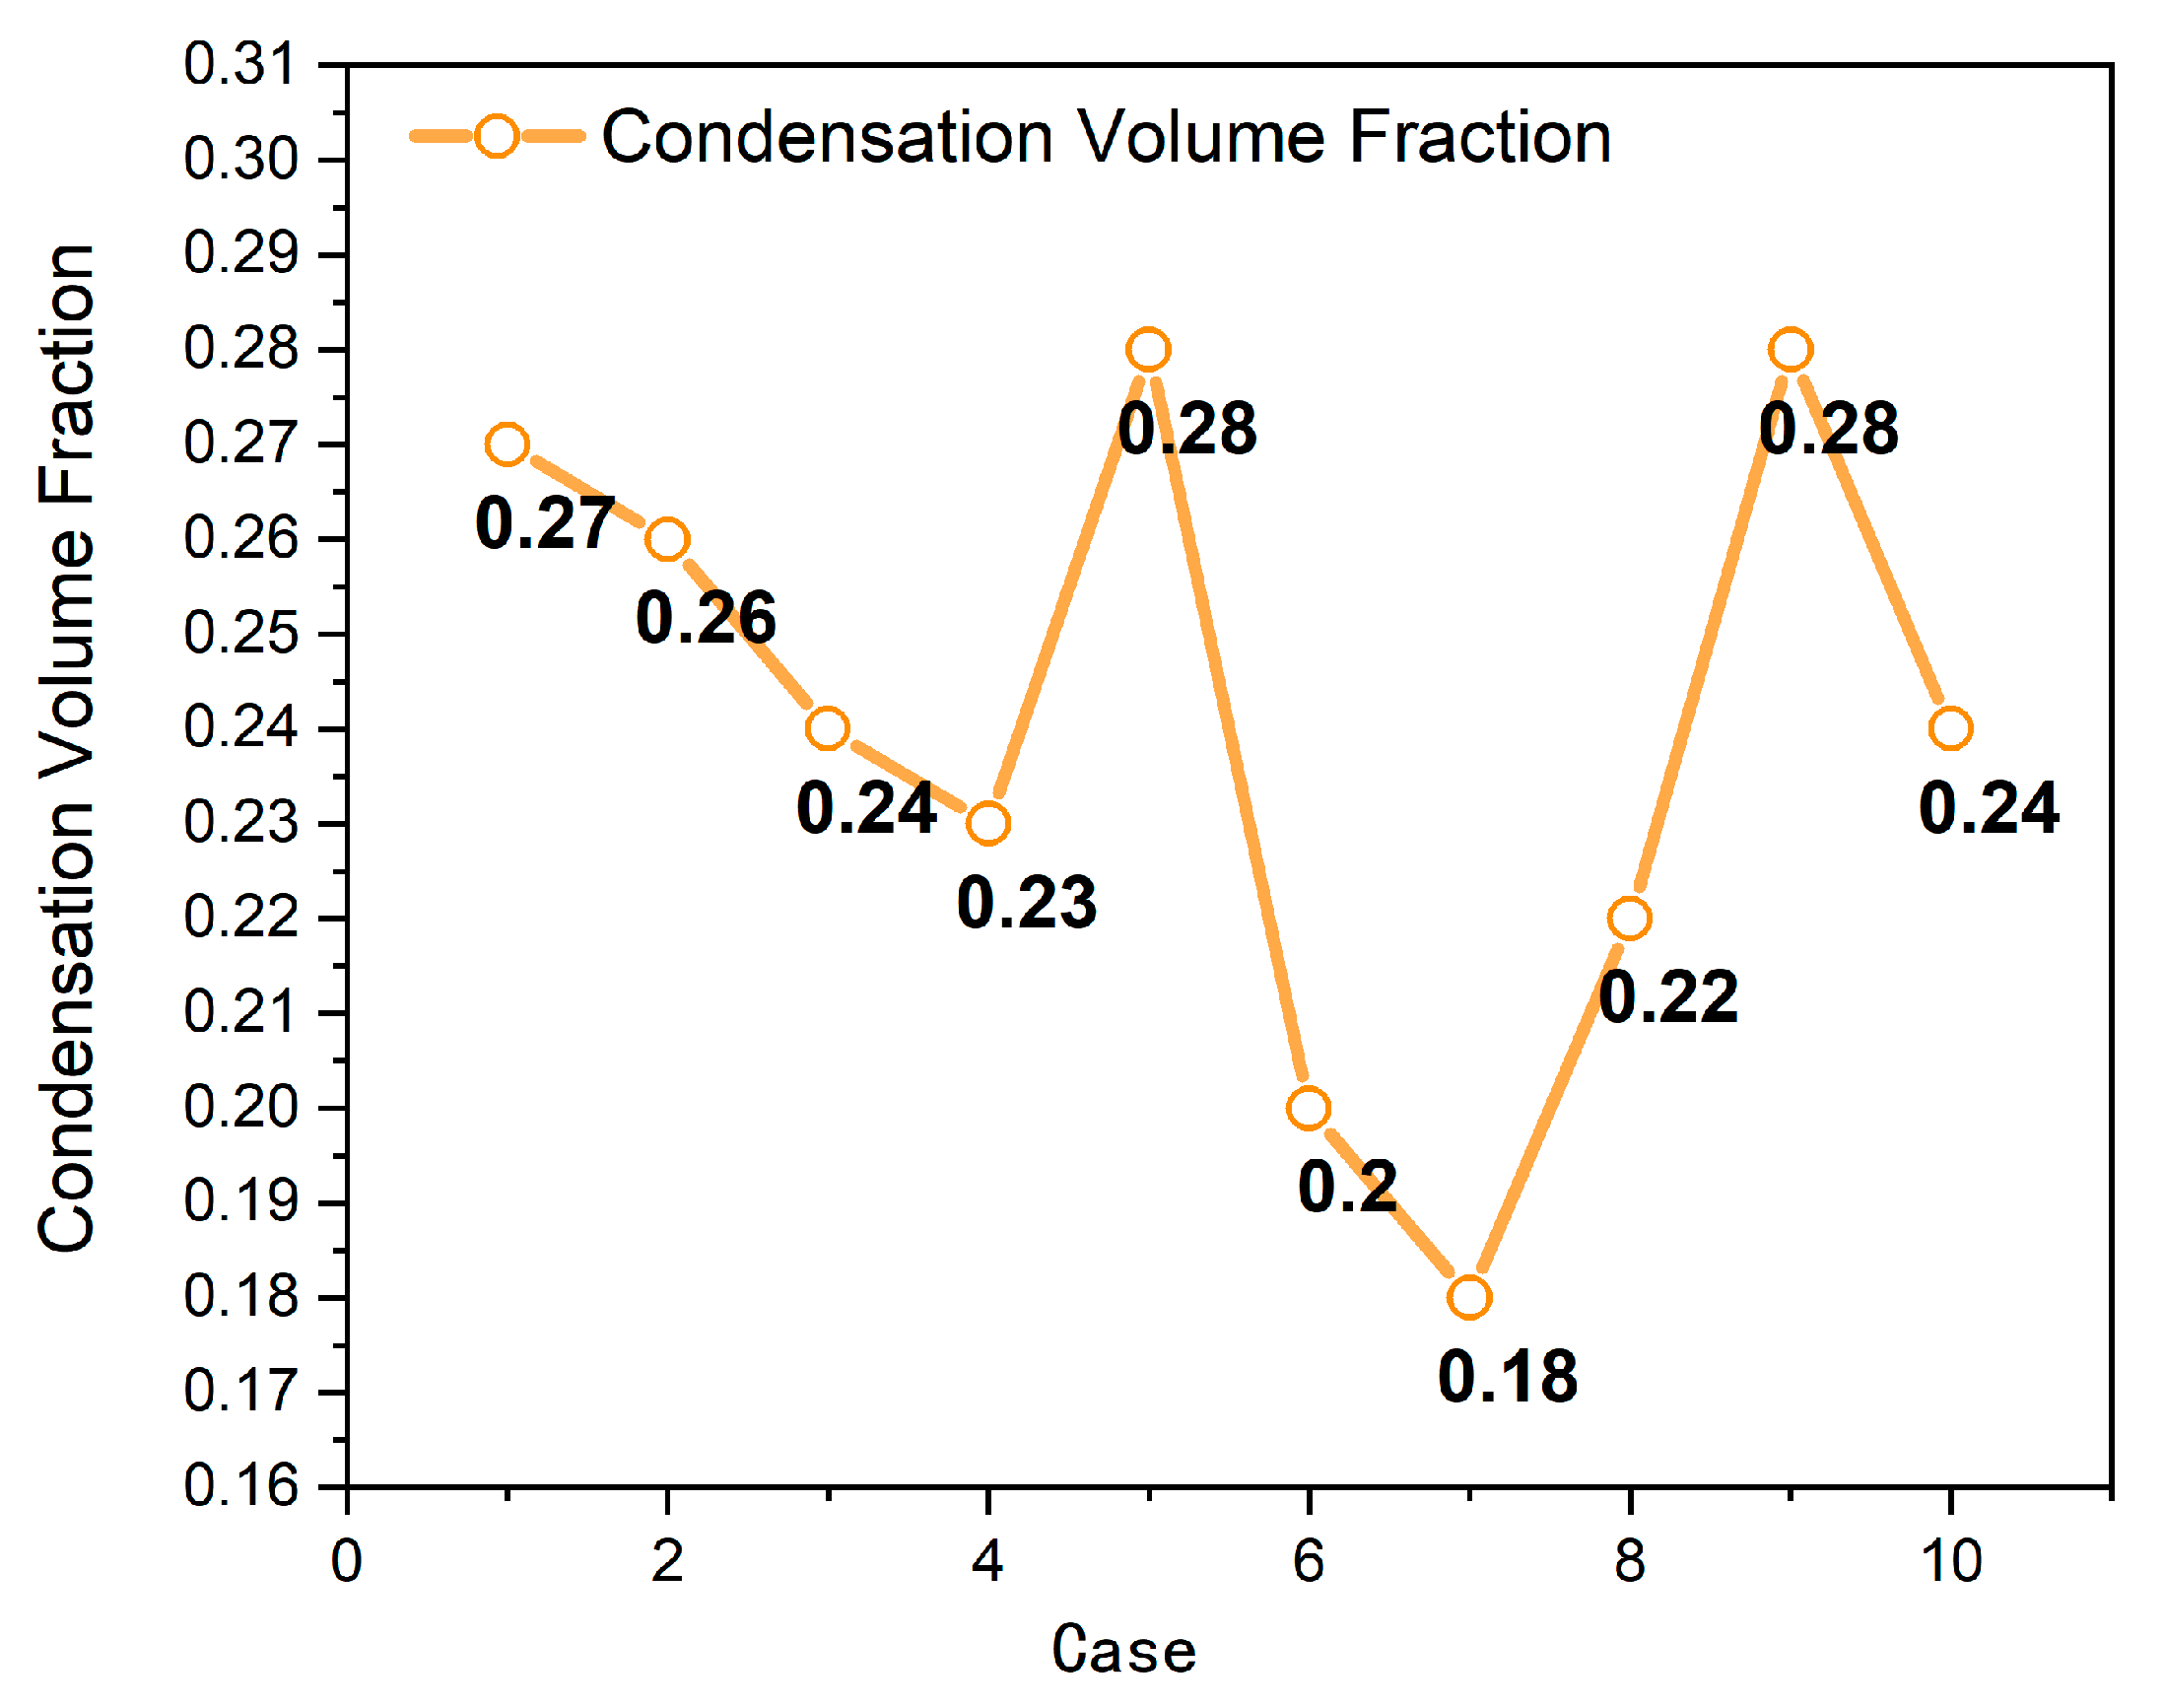
In the multi-variable comparison of condensation section heat transfer performance, various structural parameters exhibit significant physical influences on the thermal transport capacity and liquid-phase stability of the SLGHP system. Using Case 1 as the baseline configuration, the system achieves a condensation heat flux of 6812 W/m2 and a liquid volume fraction of 0.27 under representative operating conditions. Pipe diameter changes have a notable effect on condensation performance: as the diameter increases to 90 mm and 114 mm (Cases 2 and 3), the heat flux decreases to 6130.8 W/m2 and 5449.6 W/m2, while the corresponding liquid volume fraction drops to 0.26 and 0.24 (see Figure 6 and Figure 7). This indicates that although larger diameters improve overall flow capacity, the condensation efficiency per unit surface area declines due to reduced wall shear and intensified vapor–liquid stratification, leading to diminished liquid accumulation in the condenser section [35].
Pipe length variations further reveal the coupling effect between steam condensation distribution and gravitational liquid return. For a shorter pipe of 600 m (Case 4), the heat flux slightly increases to 6743.9 W/m2, while in the longer 2000 m pipe (Case 5), the liquid volume fraction rises to 0.28, but the unit-area heat flux drops significantly to 5211.2 W/m2 [36]. Working fluid substitution exhibits even more pronounced effects: NH3 and CO2 (Cases 6 and 7) yield condensation heat fluxes of 8174.4 W/m2 and 9536.8 W/m2, respectively, yet their liquid volume fractions drop substantially to 0.20 and 0.18, suggesting enhanced vapor-phase transport but limited condensate return stability [37].
Filling ratio adjustments display a bidirectional modulation effect. At 30% filling (Case 8), inadequate liquid supply reduces both heat flux (5517.7 W/m2) and liquid accumulation (0.23), whereas a higher filling ratio of 50% (Case 9) enhances liquid film coverage and raises heat flux to 6444.6 W/m2 and liquid volume fraction to 0.30 [38]. In terms of material, the aluminum pipe (Case 10), despite its higher thermal conductivity, shows lower performance (heat flux: 5395.1 W/m2; liquid volume fraction: 0.24), likely due to lower thermal inertia and insufficient temperature gradient to drive phase change [39].
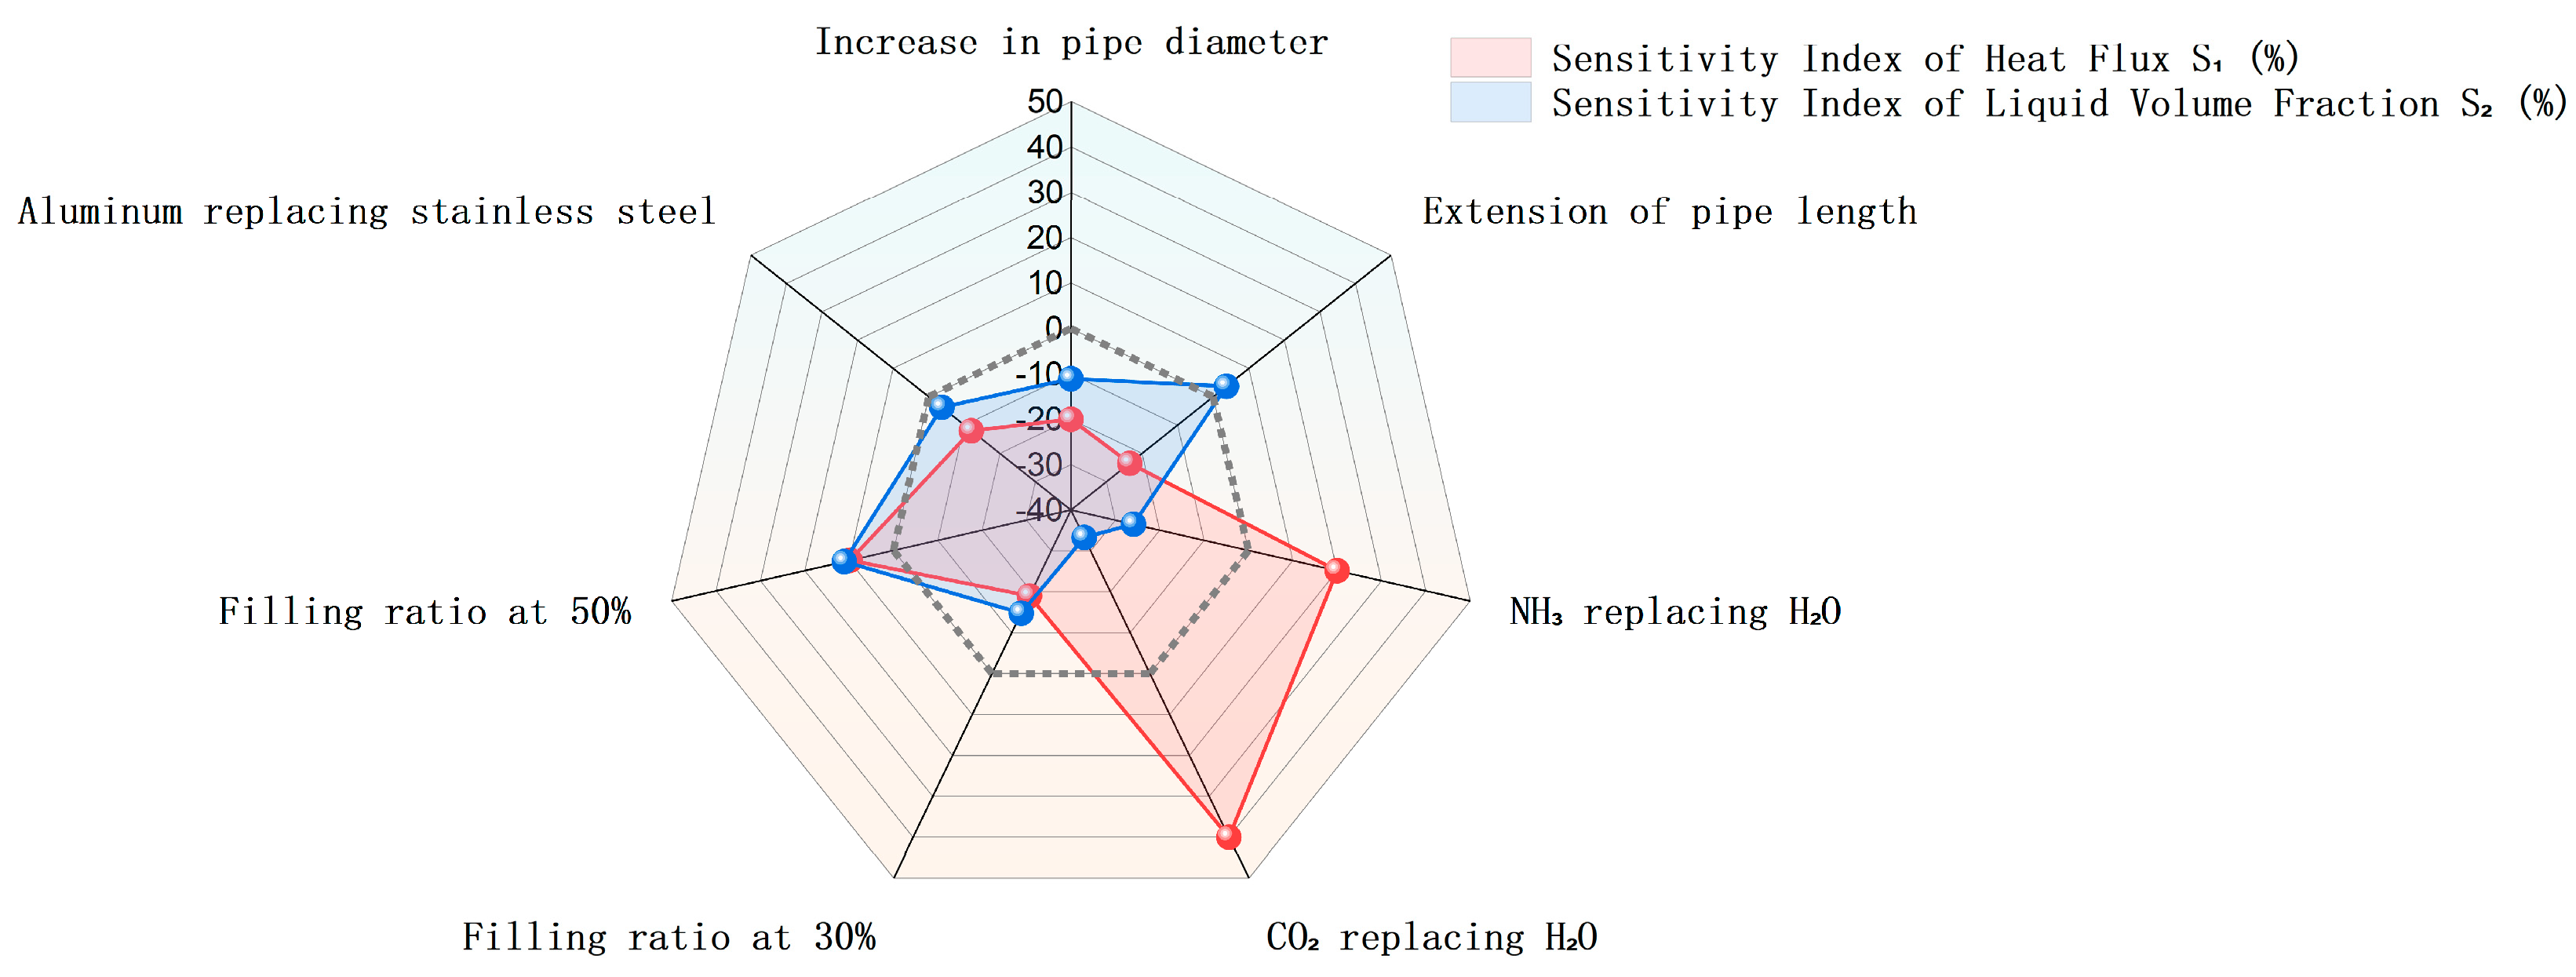
To quantitatively assess the influence of various structural parameters on the performance of the SLGHP condensation section, this study introduces a sensitivity index framework based on two key indicators: condensation heat flux (q) and liquid volume fraction (α). Taking the baseline condition (Case 1) as a reference, the heat flux sensitivity index is defined as S1 = Δq/q0 × 100%, and the liquid volume fraction sensitivity index as S2 = Δα/α0 × 100%.
The results indicate that the working fluid is the most dominant factor. Specifically, substituting CO2 for H2O results in a significant 40.0% increase in heat flux, accompanied by a 33.3% reduction in liquid volume fraction. Similarly, NH3 replacement leads to a 20.0% heat flux enhancement while reducing the liquid volume fraction by 25.9%, suggesting that vapor-phase dominant fluids may enhance thermal transport but compromise phase-change stability. Among the structural variables, increasing the pipe diameter (φ76 → 114 mm) leads to a 20.0% decrease in heat flux and an 11.1% reduction in liquid volume fraction. Pipe length extension (1200 → 2000 m) causes a 23.5% decrease in heat flux, whereas the liquid fraction shows a slight increase of 3.7%, highlighting the stabilizing effect of an extended condensation zone on condensate return.
Adjustments in filling ratio exhibit a dual regulatory effect: increasing to 50% enhances both heat flux (+9.8%) and liquid accumulation (+11.1%), while decreasing to 30% results in performance deterioration on both metrics. In contrast, material substitution has a relatively moderate impact: replacing stainless steel with aluminum reduces heat flux by 12.0% and liquid fraction by 3.7%. These quantified parameter effects are summarized in Table 2, and the comparative results are visualized in a radar plot shown in Figure 8. The findings provide a basis for multi-objective structural optimization and sensitivity-weighted design strategies for SLGHP systems.
Although explicit uncertainty bands are not shown in Figure 4, Figure 5, Figure 6, Figure 7 and Figure 8, the reliability of the CFD simulation results has been cross-validated using a one-dimensional thermal resistance model, yielding less than 3% deviation in heat flux predictions under baseline conditions. Mesh independence tests and convergence criteria (residuals < 10−6) were also rigorously enforced to ensure numerical stability. While statistical metrics such as p-values are not directly applicable in deterministic CFD outputs, comparative performance trends remain robust across tested configurations.

4.2.4. Comparison with Published Field-Scale Results

To further validate the reliability of our CFD and RC-network models, the simulation results obtained in this study were compared with experimental data and operational records from previous field-scale SLGHP projects. Notably, the field test conducted by Chen et al. (2024) [15] in Taiyuan, China, reported heat transfer rates of approximately 1 MW from two SLGHPs with lengths of 2.02 km and 2.18 km, operating under moderate formation temperatures (~63 °C). Scaled by surface area, this corresponds to an average unit-area heat flux of ~3700 W/m2, which is highly consistent with the 3463–5246 W/m2 range predicted in our Case 1 configuration under higher geothermal input (~260 °C). Similarly, Gselman et al. (2024) [14] reported successful deployment of a 3.5 km SLGHP in Slovenia, with estimated condenser-side heat fluxes exceeding 5000 W/m2 during peak operation—again comparable to our transient simulation peaks shown in Figure 9.
Additionally, the liquid–vapor distribution patterns observed in our simulations (Figure 5) align with the stratified phase separation zones described by Liu et al. (2022) [10] in their experimental visualization of high-aspect-ratio gravity heat pipes. These consistent observations support the physical accuracy of our simulation framework and reinforce its predictive capacity for field-scale SLGHP applications. To gain an in-depth understanding of the steady-state heat transfer and flow behavior of the SLGHP system under representative operating conditions, this study selects Case 1 as the pipe material—for three-dimensional numerical simulation and visualization.
While previous field-scale demonstrations have provided valuable empirical validation of SLGHP technology, they were conducted in moderate-temperature geothermal environments and focused on overall thermal outputs without detailed parametric or dynamic analysis. For example, the Taiyuan project in China operated under formation temperatures of approximately 63 °C, primarily supporting building heating applications. Similarly, the pilot project in Slovenia utilized an abandoned 3.5 km well to demonstrate SLGHP feasibility but lacked quantitative sensitivity evaluations and temporal performance modeling. In contrast, the present study investigates a high-enthalpy and high-relief geothermal system at Mount Meager (>250 °C), characterized by steep thermal gradients, complex pressure regimes, and significant diurnal variability. By employing three-dimensional CFD simulations combined with a dynamic RC-network model, this work captures both steady-state and transient thermal behaviors of the SLGHP system. Sensitivity to critical design variables—such as working fluid selection, pipe geometry, and filling ratio—is systematically quantified. Additionally, the simulation results are coupled with techno-economic indicators (e.g., per-unit power output, capital cost efficiency), providing a deployment-oriented framework that extends beyond the scope of existing field implementations.

4.3. Dynamic Thermal Performance Analysis

To further assess the thermal stability of the SLGHP system under typical diurnal meteorological disturbances in alpine regions, this section develops a simplified dynamic thermal model based on Case 1 configuration. A three-node RC network model is constructed to simulate the transient heat flux responses over a 24 h cycle, capturing the effect of ambient temperature fluctuations and variations in the convective heat transfer coefficient at the condenser section. The objective is to investigate the heat transfer mechanisms and flow stability under non-steady boundary conditions, providing theoretical reference for energy support systems in high-altitude unmanned areas.
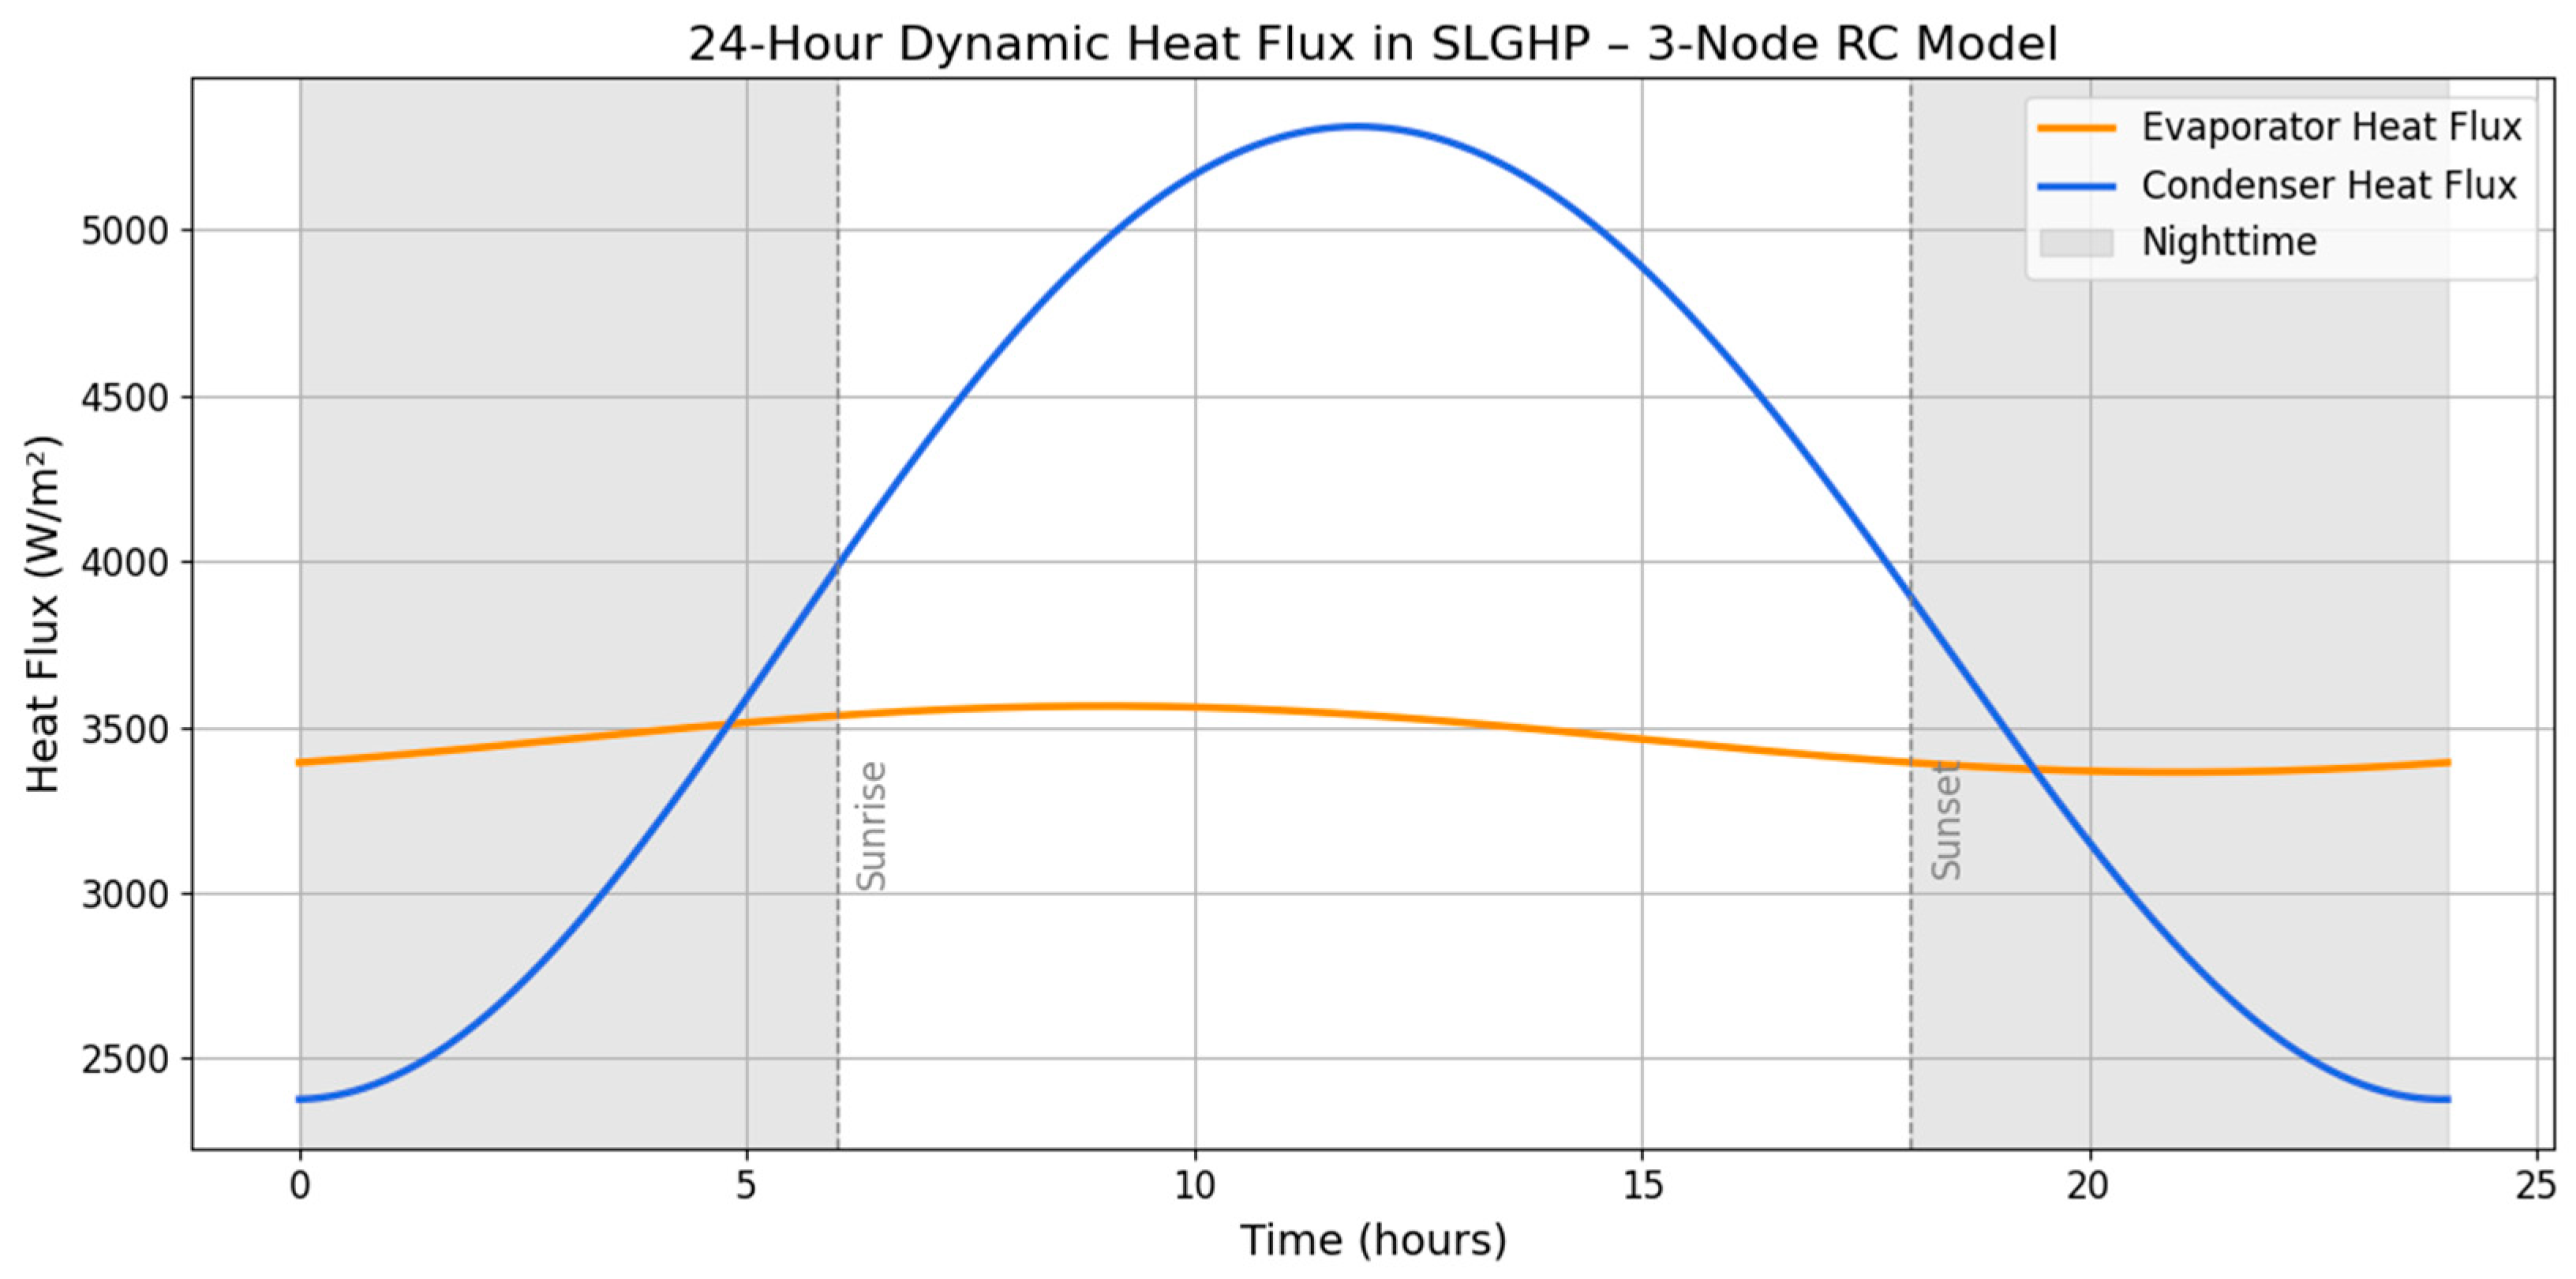
The model consists of three thermal nodes coupled through thermal resistance and heat capacity: the bottom of the evaporator section acts as a constant heat source (260 °C) representing deep geothermal input; the working fluid in the evaporator node reflects vapor generation behavior influenced by latent heat and liquid replenishment stability; the condenser node includes the outer wall and ambient interaction, subjected to natural convection boundaries with time-varying conditions. Specifically, the ambient temperature is set to 35 °C during daytime (06:00–18:00) and 15 °C at night (18:00–06:00), while the convective heat transfer coefficient ranges from 50 W/m2·K (day) to 20 W/m2·K (night). CFD simulation results are employed to validate boundary conditions and parameter consistency.
As shown in Figure 9, the condenser heat flux exhibits a pronounced sinusoidal variation over the 24 h period. During nighttime (00:00–06:00), the heat flux remains between 2400 and 2600 W/m2, with a minimum of 2368 W/m2, reflecting limited condensation due to weak thermal driving force. Nevertheless, the system maintains continuity of heat transfer without thermal lag or interruption.
With the increase in ambient temperature and wind speed during the daytime, the condenser heat flux rises sharply, peaking between 11:00 and 15:00, reaching a maximum of 5246 W/m2. This peak indicates strong coupling between vapor generation in the evaporator and heat release in the condenser, driven by enhanced external convection.
The daily average condenser heat flux is approximately 3400 W/m2, and the system demonstrates consistent and balanced heat transfer under dynamic thermal boundary conditions. Meanwhile, the evaporator heat flux fluctuates only slightly, ranging between 3400 and 3600 W/m2, indicating that the geothermal input remains stable and the system’s thermal response is primarily governed by changes at the condenser interface.
The steady-state result in Figure 4 confirms that under Case 1 conditions, the heat flux is strongly concentrated within the bottom 200 m of the evaporator section, with a peak of 3463 W/m2. In contrast, the condenser region displays a peak reverse heat flux of −6812 W/m2, corresponding to intense condensation heat release. This spatial heat flux pattern aligns well with the transient simulation trends, affirming the stability of the vertical heat transfer pathway in the SLGHP system. The dynamic thermal analysis presented in Figure 9 is derived from parameterized sinusoidal inputs that simulate ambient temperature and convective coefficient variations over a 24 h cycle. Given the semi-analytical formulation of the 3-node RC network model and its reliance on boundary conditions obtained from validated steady-state CFD simulations, the results are intended to reflect representative diurnal trends rather than precise temporal predictions. Although conventional statistical measures such as confidence intervals or p-values are not directly applicable to this deterministic framework, the predicted heat flux profiles remain consistent with steady-state ranges, thereby supporting the credibility and interpretability of the modeled thermal response.
To validate the RC network model, the steady-state heat flux and fluid temperature values used as boundary conditions were extracted from CFD simulations (e.g., evaporator heat flux ~3463 W/m2, working fluid temperature ~100 °C). The predicted diurnal variation in condenser heat flux (ranging from ~2368 to 5246 W/m2) aligns with the CFD-derived thermal response under similar conditions, confirming that the RC model captures the magnitude and phase of heat transfer fluctuations. Although the RC model does not resolve spatial details, its temporal trends and heat flux amplitudes are consistent with CFD predictions, supporting its use for preliminary dynamic analysis in geothermal applications.
Despite its effectiveness in capturing system-level thermal trends, the RC network model has inherent limitations. The lumped-element formulation does not resolve spatial variations in temperature, pressure, or vapor distribution along the pipe, which may be significant under steep thermal gradients or complex terrain conditions. Furthermore, the model assumes constant effective heat capacity within each node and linear thermal resistances, omitting non-linear effects associated with phase change, mass accumulation, and interfacial transport. As a result, dynamic responses under rapidly fluctuating boundary conditions may be oversimplified. These limitations should be considered when interpreting the RC model outputs, particularly for detailed design or control strategy development.

4.4. Power Generation Potential and System Concept

Building upon the previous assessments of the SLGHP system’s steady-state and dynamic thermal performance, this section explores the feasibility of integrating the SLGHP with an ORC system for low-grade geothermal power generation. This conceptual design aims to address energy needs in high-altitude and low-temperature regions, particularly in remote, off-grid environments such as border outposts, meteorological stations, and scientific research facilities.
According to the simulation results, the SLGHP condenser section can deliver an average daily heat flux of approximately 3400 W/m2 under typical operating conditions, with peak values reaching up to 5246 W/m2 during midday hours. Considering a typical effective heat transfer area of approximately 1.5 square meters per pipe, each individual SLGHP unit can extract around 5 kilowatts of thermal power. When scaled to a modular array of 100 heat pipes, the total thermal input to the ORC system could reach several hundred kilowatts. This thermal energy, transferred via compact heat exchangers, is capable of driving a turbine or expander in an ORC unit operating with mid-to-low temperature working fluids such as R245fa or R1233zd. Under such conditions, the ORC system typically achieves a thermal-to-electric conversion efficiency in the range of 10 to 15 percent. As a result, the system can be expected to provide a stable electrical output in the range of 50 to 60 kilowatts. This level of power generation is sufficient to meet the routine electricity demands of small to medium-sized facilities in remote areas, including communication systems, lighting, environmental sensors, and water pumping operations. Furthermore, the residual heat from the condenser section—often available at moderate temperatures—can be utilized for secondary applications such as domestic water preheating, permafrost protection, or auxiliary heating in greenhouses, thereby enhancing the overall energy utilization efficiency.

5. System Engineering Challenges and Economic Feasibility Discussion

Simulation results presented earlier indicate that geothermal conditions at Mount Meager significantly surpass those encountered in previous field-scale applications. This is most evident in elevated subsurface temperatures and high conductive heat fluxes, both of which are critical enablers for efficient geothermal power production. Organic Rankine Cycle (ORC) power generation systems, in particular, stand to benefit from these high-grade resources. In past deployments, the rated thermal input per ultra-long gravity-assisted heat pipe was typically around 50 kW. Under improved geothermal gradients, individual pipe outputs can be substantially increased, allowing for larger-capacity ORC modules and reducing specific capital costs via scale efficiencies.
Given these advantages, a detailed evaluation of economic feasibility is essential. The following subsections break down the anticipated capital and operational expenditures, followed by a preliminary revenue model to support future optimization and risk-adjusted financial planning.

5.1. Investment Cost

The total capital investment is categorized into two major components: (1) geothermal well construction and thermal energy collection infrastructure, and (2) surface power generation and control systems. The breakdown includes drilling, heat pipe manufacturing and installation, ORC system procurement, integration, and site commissioning.
Drilling remains the most significant cost component in geothermal developments, typically comprising 70–75% of the total capital expenditure. Current estimates place the cost of deep geothermal drilling at approximately USD 4000 per m (equivalent to ~CAD 5400/m), consistent with industry averages for complex high-temperature wells requiring specialized casing programs, cementing operations, and safety oversight [40]. For heat pipe applications extending to depths exceeding 2000 m, the drilling cost per well can exceed CAD 10 MM, assuming vertical single-bore completions.
The proposed system utilizes ultra-long gravity-assisted heat pipes constructed from 304 stainless steel, chosen for its excellent mechanical strength, corrosion resistance, and high-temperature endurance. These pipes are pre-charged with a suitable working fluid and are expected to operate maintenance-free for the project’s 25-year design life. According to MBM Tubes, the unit material cost of 304 stainless steel is approximately USD 4/kg, and its density is 8000 kg/m3. A pipe of 0.09 m outer diameter and 10 mm wall thickness has a linear mass of approximately 18 kg/m, leading to a material cost of ~CAD 130/m, excluding fabrication, sealing, and thermal interface layers.
The surface-level ORC system includes major components such as evaporators, condensers, circulation pumps, expanders or micro-turbines, generators, and programmable logic control (PLC) units. Capital costs vary widely depending on plant size. For small-scale binary cycle systems (<500 kW), typical turnkey costs range from CAD 2000 to 4000 per installed kilowatt [41,42], encompassing equipment procurement, site preparation, thermal integration, and vendor commissioning. Key cost drivers include the evaporator and condenser units (30% of total system cost [43]), and the expander/generator assembly (15–20%).
Installation and integration tasks—including site excavation, module anchoring, thermal connection between pipe and evaporator, electrical tie-in, and safety instrumentation—are conservatively estimated to contribute 5–10% of total capital cost. These values are consistent with prior geothermal developments where non-drilling expenditures (site infrastructure, labor, commissioning) range from 5 to 8% of total investment, depending on the extent of surface infrastructure and local logistical constraints [44].

5.2. Operation Cost Model

The system’s operating costs are divided into five primary categories: depreciation, operations and maintenance (O&M), energy consumption, personnel, and working fluid replenishment.
Due to the modular and automated nature of the ORC system and heat pipe arrays, labor costs are expected to be minimal. Routine operations can be handled via remote supervisory control and data acquisition (SCADA) systems, complemented by scheduled annual inspections. It is assumed that a single part-time technician will suffice, with an annual labor cost of approximately CAD 70,000.
Fixed O&M costs are projected at 2% of the capital cost annually (excluding drilling), consistent with geothermal industry benchmarks [45]. Depreciation is applied linearly over the project’s 25-year life span. The high reliability of ORC systems and the passive nature of gravity heat pipes (with no moving parts) result in low unscheduled maintenance.
The parasitic load—primarily from ORC fluid circulation pumps and cooling fans—is typically 5–10% of gross generation capacity [46]. Given the site’s low-cost electricity sourced from local hydropower and wind, the cost of self-consumption is minimal. However, this also limits arbitrage opportunities or resale value for excess generation.
The closed-loop nature of the ORC and heat pipe systems ensures minimal working fluid loss. The expected makeup volume is negligible and is considered part of routine maintenance supplies.

5.3. Revenue Model

The economic returns from the system are categorized as static revenues (direct electricity sales) and dynamic revenues (ancillary services, demand response, carbon credits). This preliminary assessment focuses solely on static revenues.
Annual revenue is calculated based on electricity output, operational hours, and prevailing market tariffs. Unlike intermittent renewables, geothermal generation offers a high capacity factor and can operate up to 8750 h per year. This allows for a stable baseload power output, a key advantage in balancing regional grids.
In regions dominated by hydro and wind, electricity prices are typically lower. However, geothermal power’s reliability and year-round availability may qualify it for premium pricing under clean baseload incentive programs or long-term power purchase agreements (PPAs). Additionally, depending on jurisdiction, carbon offset credits and renewable energy certificates (RECs) may be available, further enhancing project viability.
As the number of deployed units increases, economies of scale are expected to reduce the unit cost of drilling, fabrication, and integration. This not only shortens the project payback period but also improves the internal rate of return (IRR) and net present value (NPV), potentially matching or surpassing the financial performance of more mature renewable technologies such as wind and solar.

5.4. Sensitivity Analysis of Economic Parameters

To evaluate the robustness of the proposed SLGHP system’s financial performance, a sensitivity analysis was conducted by varying four key parameters: electricity price, drilling cost per meter, ORC conversion efficiency, and discount rate. Table 3 summarizes the ranges tested and their corresponding effects on the Net Present Value (NPV) and payback period over a 25-year project horizon.
As shown in the table, electricity price and drilling cost have the highest impact on financial viability. For instance, increasing the electricity tariff from CAD 0.09/kWh to 0.12/kWh improves the NPV by over 40%, while a drilling cost reduction from CAD 5400/m to CAD 4500/m shortens the payback period by 2.1 years. In contrast, the system is less sensitive to moderate variations in discount rate and ORC efficiency, due to the relatively passive nature of heat pipe operation and the stable baseload output of geothermal systems.

5.5. Coupling Thermal Performance with Economic Outcomes

To establish a quantitative linkage between the SLGHP system’s thermal performance and its economic viability, a simplified techno-economic coupling model is developed. This model translates simulation-derived heat flux values into net electrical output and associated capital cost metrics under representative design configurations (Table 4). Under baseline conditions (Case 1), the steady-state condenser heat flux is 3463 W/m2, corresponding to approximately 5 kW of thermal output per pipe (assuming an effective surface area of 1.5 m2). With an ORC conversion efficiency of 12%, this yields approximately 0.6 kW of net electrical output per pipe, resulting in a total system capacity of 60 kW for a 100-pipe array. Substituting the working fluid with CO2 (Case 7) leads to a 40% increase in heat flux (to 4850 W/m2), raising the net electrical output to approximately 0.84 kW per pipe and 84 kW total. Assuming a capital cost of CAD 3000 per kilowatt (including ORC and infrastructure), this configuration reduces the levelized cost per installed kilowatt by approximately 20% while maintaining the same number of heat pipe units. In contrast, extending the pipe length to 2000 m (Case 5) decreases the heat flux by 23.5%, lowering the net output to approximately 0.46 kW per pipe. Combined with increased drilling costs (estimated at ~CAD 10.8 million per well), this configuration diminishes investment efficiency and extends the project payback period by an estimated 2–2.5 years.
To provide a standardized assessment of the system’s economic competitiveness, the Levelized Cost of Electricity (LCOE) was calculated using the following equation:
L C O E =   T o t a l   C a p i t a l   C o s t   + t = 1 n O & M t ( 1 + r ) t t = 1 n E t ( 1 + r ) t
where r is the discount rate, nnn is the project lifetime (25 years), Et is the annual net electricity generation (assumed to be 60 kW × 8750 h/year = 525,000 kWh), and O&M costs are estimated at 2% of capital annually. Under a base-case capital cost of CAD 180,000 and a discount rate of 6%, the resulting LCOE is approximately CAD 0.112/kWh. This value compares favorably with small-scale off-grid geothermal and diesel alternatives, supporting the system’s potential for remote clean energy deployment.
To enhance the interpretability of the sensitivity results for decision-makers, a parameter-impact matrix is constructed (Table 5), ranking each input variable based on its normalized influence on NPV and technical performance. Design recommendations are also provided based on sensitivity trends. This framework allows practitioners to prioritize investment decisions under cost, performance, or policy constraints.

6. Conclusions

This study presents a comprehensive investigation into the heat transfer performance, structural sensitivity, and dynamic operational behavior of an SLGHP system, with a focus on its potential for deployment in cold, high-altitude geothermal environments such as the Mt. Meager region. Compared to existing literature, this work provides three new insights: (1) A coupled CFD–RC simulation framework tailored for high-altitude geothermal environments, enabling dynamic analysis of thermal stability under diurnal variation; (2) a quantitative sensitivity index system that ranks the relative importance of working fluids, dimensions, and materials on heat extraction efficiency and liquid holdup; (3) a techno-economic linkage between thermal simulation outputs and power yield/capital cost, offering design-to-deployment guidance for modular SLGHP–ORC systems. The findings from steady-state numerical simulations, parametric sensitivity analyses, and dynamic thermal modeling provide the following key conclusions:
First, the SLGHP system exhibits a distinct “bottom-heating, top-cooling” thermal transport mechanism. Under baseline conditions (Case 1), the system achieves a peak evaporator heat flux of 3463 W/m2 and a condenser-side reverse heat release up to 6812 W/m2, indicating effective phase change-driven circulation. The liquid phase is predominantly concentrated in the bottom third of the pipe, supporting stable stratified flow.
Second, structural parameters—including pipe diameter, length, filling ratio, working fluid, and material—demonstrate varying levels of impact on system performance. Among these, working fluid type exerts the greatest influence, with CO2 significantly enhancing heat flux (up to 40%) while reducing liquid holdup. Pipe diameter and length show coupled effects on vapor transport and return flow stability, and filling ratio adjustments enable modulation between heat flux intensity and liquid distribution. These findings are quantitatively summarized through a sensitivity index framework, enabling future multi-objective design optimization.
Third, dynamic simulation under diurnal boundary fluctuations confirms that the SLGHP system maintains high thermal responsiveness and structural thermal inertia. During peak daytime hours, the condenser heat flux exceeds 5000 W/m2, while nighttime performance remains stable without flow reversal or thermal delay. The RC-network-based model accurately captures the transient behavior, verifying the robustness of the SLGHP system under unsteady boundary conditions.
Overall, the combination of superior geothermal resources, passive heat extraction technology, and modular ORC systems presents a compelling case for economic feasibility at Mount Meager. While upfront capital costs—particularly for drilling—remain a barrier, the long operational life, minimal O&M requirements, and reliable power output offer strong potential for long-term returns. Further work should include sensitivity analyses, risk assessments, and scenario-based modeling under various pricing and subsidy frameworks to fully capture the economic potential of this system.

Author Contributions

Writing—original draft preparation, Y.C., W.C. and A.R.; Supervision, S.A. and S.Y. All authors have read and agreed to the published version of the manuscript.

Funding

This research received no external funding.

Data Availability Statement

The corresponding author will provide the data generated or analyzed during this study upon reasonable request.

Conflicts of Interest

The authors declare no financial or personal relationships that could have influenced the work reported in this manuscript.

Appendix A

1D TRN Python Code for Heat Flux Estimation

import numpy as np
# ----------------------------
# Input Parameters (SI Units)
# ----------------------------
L = 1200        # [m] Pipe length (based on Case 1 configuration)
r_i = 0.038      # [m] Inner radius of 76 mm pipe (ID)
r_o = r_i + 0.003   # [m] Outer radius assuming 3 mm wall thickness
r_inf = r_o * 1.01   # [m] Far-field boundary for radial conduction (slightly > r_o)
k_wall = 16      # [W/m·K] Thermal conductivity of 304 stainless steel (pipe wall)
k_geo = 2.5      # [W/m·K] Thermal conductivity of surrounding formation (Mount Meager data)
h_cond = 15.083    # [W/m2·K] Convective HTC at condenser surface (from CFD)
T_bottom = 260 + 273.15 # [K] Deep reservoir temperature
T_top = 35 + 273.15    # [K] Surface condenser temperature
# Outer surface area of the SLGHP
A_outer = 2 * np.pi * r_o * L # [m2]
# ----------------------------
# Thermal Resistance Calculations
# ----------------------------
R_geo = np.log(r_inf / r_o) / (2 * np.pi * k_geo * L)     # Rock formation conduction resistance
R_wall = np.log(r_o / r_i) / (2 * np.pi * k_wall * L)   # Pipe wall conduction resistance
R_cond = 1.0 / (h_cond * A_outer)          # Condenser-side convective resistance
R_total = R_geo + R_wall + R_cond          # [K/W] Overall thermal resistance
# ----------------------------
# Heat Transfer Calculations
# ----------------------------
Q_total = (T_bottom−T_top) / R_total   # [W] Total heat transfer rate
q_flux = Q_total / A_outer       # [W/m2] Surface heat flux density
# ----------------------------
# Output Result
# ----------------------------
print(f"Estimated heat flux by 1D TRN model (Case 1): {q_flux:.1f} W/m2")

Appendix B

Python Simulation Code of the 3-Node RC Thermal Network Model

import numpy as np
import matplotlib.pyplot as plt
# ----------------------------
# Time Vector: 24-hour period
# ----------------------------
t = np.linspace(0, 24, 1000) # [hours]
# ----------------------------
# Node 1—Geothermal Source
# ----------------------------
T_ground = 260 # [°C] Constant geothermal source temperature
# ----------------------------
# Node 2—Working Fluid in Evaporator Section
# ----------------------------
T_fluid_steady = 100 # [°C] Steady-state temperature from CFD
C_eff = 1.5 # Damping coefficient for thermal inertia
T_fluid = T_fluid_steady + 2 * np.sin(2 * np.pi * (t−3) / 24) * np.exp(−C_eff * 0.1)
# ----------------------------
# Node 3—Ambient Air at Condenser
# ----------------------------
T_env = −12.5 + 7.5 * np.sin(2 * np.pi * (t−6) / 24) # [°C] Diurnal ambient temperature
h = 35 + 15 * np.sin(2 * np.pi * (t−6) / 24) # [W/m2·K] Convective heat transfer coefficient
# ----------------------------
# Heat Flux Calculations
# ----------------------------
q_cond = h * (T_fluid−T_env) # Condenser heat flux [W/m2]
q_evap = 3463 + 100 * np.sin(2 * np.pi * (t−3) / 24) # Evaporator heat flux [W/m2]
# ----------------------------
# Plotting
# ----------------------------
plt.figure(figsize=(12, 6))
plt.plot(t, q_evap, label='Evaporator Heat Flux', color='darkorange', linewidth=2.5)
plt.plot(t, q_cond, label='Condenser Heat Flux', color='royalblue', linewidth=2.5)
# Add nighttime shading (0–6 and 18–24 hours)
plt.axvspan(0, 6, color='gray', alpha=0.2, label='Nighttime')
plt.axvspan(18, 24, color='gray', alpha=0.2)
# Annotate sunrise and sunset
plt.axvline(6, color='gray', linestyle='--', linewidth=1)
plt.axvline(18, color='gray', linestyle='--', linewidth=1)
plt.text(6.2, max(q_evap)*0.96, 'Sunrise', rotation=90, va='top', fontsize=12, color='gray')
plt.text(18.2, max(q_evap)*0.96, 'Sunset', rotation=90, va='top', fontsize=12, color='gray')
# Axis labels and title
plt.xlabel('Time (hours)', fontsize=14)
plt.ylabel('Heat Flux (W/m2)', fontsize=14)
plt.title('24-Hour Dynamic Heat Flux in SLGHP – 3-Node RC Model', fontsize=16)
# Font sizes and legend
plt.xticks(fontsize=12)
plt.yticks(fontsize=12)
plt.legend(loc='upper right', fontsize=12)
plt.grid(True)
plt.tight_layout()
# Display the plot
plt.show()

References

  1. Barbier, E. Geothermal energy technology and current status: An overview. Renew. Sustain. Energy Rev. 2002, 6, 3–65. [Google Scholar] [CrossRef]
  2. Reinsch, T.; Dobson, P.; Asanuma, H.; Huenges, E.; Poletto, F.; Sanjuan, B. Utilizing supercritical geothermal systems: A review of past ventures and ongoing research activities. Geotherm. Energy 2017, 5, 16. [Google Scholar] [CrossRef]
  3. Lewis, T.J.; Souther, J.G. Meager Mountain, B.C.: A Possible Geothermal Energy Resource; Energy, Mines and Resources Canada, Earth Physics Branch: Ottawa, ON, Canada, 1978. [Google Scholar]
  4. Geoscience, B.C. Garibaldi Geothermal Volcanic Belt Project Summary; Technical Report; Geoscience BC: Vancouver, BC, Canada, 2017; Available online: https://www.geosciencebc.com (accessed on 6 July 2025).
  5. Allen, S. Searching for Mount Meager’s Geothermal Heart. In Eos–Science Updates; American Geophysical Union: Washington, DC, USA, 2023; Available online: https://eos.org/science-updates/searching-for-mount-meagers-geothermal-heart (accessed on 25 August 2025).
  6. Evans, K.F.; Zappone, A.; Kraft, T.; Deichmann, N.; Moia, F. A survey of the induced seismic responses to fluid injection in geothermal and CO2 reservoirs in Europe. Geothermics 2012, 41, 30–54. [Google Scholar] [CrossRef]
  7. Majer, E.L.; Baria, R.; Stark, M.; Oates, S.; Bommer, J.; Smith, B.; Asanuma, H. Induced seismicity associated with Enhanced Geothermal Systems. Geothermics 2007, 36, 185–222. [Google Scholar] [CrossRef]
  8. Miller, S. Modeling enhanced geothermal systems and the essential nature of large-scale changes in permeability at the onset of slip. Geofluids 2015, 15, 338–349. [Google Scholar]
  9. Kelly, J.; McDermott, C. Numerical modelling of a deep closed-loop geothermal system: Evaluating the Eavor-Loop. AIMS Geosci. 2022, 8, 175–212. [Google Scholar] [CrossRef]
  10. Liu, L.; Yu, H.-L.; Wang, Y.-Y.; Wang, H.-B.; Zhu, B.-Z.; Sun, Y.-L.; Huang, L.-Y.; Wu, S.-C. Exploitation of Geothermal Energy by Installing Gravity Heat Pipe in Abandoned Oil and Gas Wells. In Proceedings of the International Field Exploration and Development Conference 2021, Singapore, 1–3 November 2021; Lin, J.E., Ed.; Springer Nature: Singapore, 2022; pp. 3604–3617. [Google Scholar]
  11. Ma, W.; Chen, Y.; Wang, Y.; Yang, C.; Yang, C.; Xiao, C.; Liu, G. Multi-parameter design and optimization of enhanced geothermal system based on unit effective permeable area. Appl. Therm. Eng. 2023, 225, 120184. [Google Scholar] [CrossRef]
  12. Nemec, P. Gravity in Heat Pipe Technology. In Gravity-Geoscience Applications, Industrial Technology and Quantum Aspect; IntechOpen: London, UK, 2018. [Google Scholar]
  13. Anand, R.S.; Li, A.; Huang, W.; Chen, J.; Li, Z.; Ma, Q.; Jiang, F. Super-long gravity heat pipe for geothermal energy exploitation—A comprehensive review. Renew. Sustain. Energy Rev. 2024, 193, 114286. [Google Scholar] [CrossRef]
  14. Gselman, U.; Peršak, V.; Goričanec, D. Numerical Analysis of Low-Enthalpy Deep Geothermal Energy Extraction Using a Novel Gravity Heat Pipe Design. Sustainability 2024, 16, 6660. [Google Scholar] [CrossRef]
  15. Chen, J.; Li, Z.; Huang, W.; Ma, Q.; Li, A.; Wang, B.; Sun, H.; Jiang, F. Super-long gravity heat pipe geothermal space heating system: A practical case in Taiyuan, China. Energy 2024, 299, 131521. [Google Scholar] [CrossRef]
  16. Geoscience, B.C. Garibaldi Geothermal Energy Project-Phase 1; Geoscience BC: Vancouver, BC, Canada, 2021. [Google Scholar]
  17. Geological Survey of Cananda Geothermal Measurements in the Mount Meager Area, British Columbia, Canada; Geological Survey of Canada: Ottawa, ON, Canada, 2022.
  18. Chai, Y.; Chen, Z.; Yin, S. A Preliminary Analysis of In-Situ Stress at Mount Meager by Displacement Discontinuity Method with Topography and Tectonics Considered. Energies 2023, 16, 1397. [Google Scholar] [CrossRef]
  19. Liu, Z.-H.; Zheng, B.-C.; Wang, Q.; Li, S.-S. Study on the thermal storage performance of a gravity-assisted heat-pipe thermal storage unit with granular high-temperature phase-change materials. Energy 2015, 81, 754–765. [Google Scholar]
  20. Chen, J.; Huang, W.; Cen, J.; Li, Z.; Li, F.; Li, A.; Sun, H.; Lin, W.; Ma, Q.; Jiang, F. Operational characteristics of the super-long gravity heat pipe for geothermal energy exploitation. Appl. Therm. Eng. 2024, 236, 121530. [Google Scholar]
  21. Rahbar, K.; Mahmoud, S.; Al-Dadah, R.K.; Moazami, N.; Mirhadizadeh, S.A. Review of organic Rankine cycle for small-scale applications. Energy Convers. Manag. 2017, 134, 135–155. [Google Scholar] [CrossRef]
  22. C.A.I. Technologies. Heat Pipe Systems Brochure; Version 3; C.A.I. Technologies: Sheffield, UK, 2019. [Google Scholar]
  23. Gao, T.; Long, X.; Xie, H.; Sun, L.; Wang, J.; Li, C.; Gao, M.; Xia, E. A review of advances and applications of geothermal energy extraction using a gravity-assisted heat pipe. Geothermics 2024, 116, 102856. [Google Scholar]
  24. DiPippo, R. Geothermal Power Plants: Principles, Applications, Case Studies and Environmental Impact, 4th ed.; Butterworth-Heinemann: Amsterdam, The Netherlands, 2015; pp. 1–762. [Google Scholar]
  25. Gallup, D.L. Production engineering in geothermal technology: A review. Geothermics 2009, 38, 326–334. [Google Scholar] [CrossRef]
  26. DiPippo, R. Geothermal Power Plants: Principles, Applications, Case Studies and Environmental Impact; Butterworth-Heinemann: Amsterdam, The Netherlands, 2016. [Google Scholar]
  27. Choi, Y.-S.; Nešic, S. Corrosion Behavior Of Carbon Steel In Supercritical CO2-Water Environments. In Proceedings of the CORROSION 2009, Atlanta, GA, USA, 22–26 March 2009; pp. 1–20. [Google Scholar]
  28. Zarrouk, S.J.; Moon, H. Efficiency of geothermal power plants: A worldwide review. Geothermics 2014, 51, 142–153. [Google Scholar] [CrossRef]
  29. Wang, X.; Liu, H.; Wang, Y.; Zhu, Y. CFD simulation of dynamic heat transfer behaviors in super-long thermosyphons for shallow geothermal application. Appl. Therm. Eng. 2020, 174, 115295. [Google Scholar] [CrossRef]
  30. DiPippo, R. Geothermal Power Plants: Principles, Applications and Case Studies; Butterworth-Heinemann: Amsterdam, The Netherlands, 2008. [Google Scholar]
  31. Ochsner, K. Geothermal Heat Pumps: A Guide for Planning and Installing; Earthscan: Abingdon, UK, 2008. [Google Scholar]
  32. Abdulshaheed, A.A.; Wang, P.; Huang, G.; Zhao, Y.; Li, C. Filling Ratio Optimization for High-Performance Nanoengineered Copper-Water Heat Pipes. J. Therm. Sci. Eng. Appl. 2021, 13, 051025. [Google Scholar]
  33. Lu, X.; Liu, J.; Tong, X.; Dai, R.; Xiao, Y.; Deng, J. Experimental investigation on thermal performance of gravity heat pipe with different pipe configurations. Case Stud. Therm. Eng. 2025, 65, 105695. [Google Scholar]
  34. Renaud, X.; Zarrouk, S. In Supercritical CO2 as Heat Transmission Fluid in Deep Closed-Loop Geothermal Systems: A Review. In Proceedings of the Stanford Geothermal Workshop, Standford, CA, USA, 12–14 February 2018. [Google Scholar]
  35. Rajasekar, K.; Raja, B. Heat and mass transfer characteristics during spray drying of Na2Fe0.6Mn0.4PO4F/C cathode material for Na-ion batteries. Appl. Therm. Eng. 2023, 221, 119838. [Google Scholar] [CrossRef]
  36. Wu, W.; Yang, X.; Zhang, G.; Chen, K.; Wang, S. Experimental investigation on the thermal performance of heat pipe-assisted phase change material based battery thermal management system. Energy Convers. Manag. 2017, 138, 486–492. [Google Scholar] [CrossRef]
  37. Cai, C.; Wang, Y.; Fang, J.; Chen, H.; Zheng, Q.; Zhang, H. Multiple aspects to flight mission performances improvement of commercial turbofan engine via variable geometry adjustment. Energy 2023, 263, 125693. [Google Scholar] [CrossRef]
  38. Barthwal, M.; Rakshit, D. No fins attached? Numerical analysis of internal–external fins coupled PCM melting for solar applications. Appl. Therm. Eng. 2022, 215, 118911. [Google Scholar] [CrossRef]
  39. Li, J.; Qiao, L.; Chen, M.; Song, D.; Zeng, X. Metal oxide nanofluid-enhanced closed-loop pulsating heat pipes considering the characteristics of base solution: Thermal performance improvement for battery thermal management in cryogenics. Energy 2025, 333, 137409. [Google Scholar] [CrossRef]
  40. Adepoju, Y.; Shor, R.; Chen, Z. Geothermal Energy Development in the Canadian Cordillera, a Case Study. GRC Trans. 2020, 44, 768–783. [Google Scholar]
  41. Tartière, T.; Astolfi, M. A World Overview of the Organic Rankine Cycle Market. Energy Procedia 2017, 129, 2–9. [Google Scholar] [CrossRef]
  42. Tocci, L.; Pal, T.; Pesmazoglou, I.; Franchetti, B. Small Scale Organic Rankine Cycle (ORC): A Techno-Economic Review. Energies 2017, 10, 413. [Google Scholar] [CrossRef]
  43. Zhang, J.; Hu, X.; Wu, D.; Huang, X.; Wang, X.; Yang, Y.; Wen, C. A comparative study on design and performance evaluation of Organic Rankine Cycle (ORC) under different two-phase heat transfer correlations. Appl. Energy 2023, 350, 121724. [Google Scholar] [CrossRef]
  44. Teodoriu, C.; Falcone, G. Comparing completion design in hydrocarbon and geothermal wells: The need to evaluate the integrity of casing connections subject to thermal stresses. Geothermics 2009, 38, 238–246. [Google Scholar] [CrossRef]
  45. Walraven, D.; Laenen, B.; D’haeseleer, W. Minimizing the levelized cost of electricity production from low-temperature geothermal heat sources with ORCs: Water or air cooled? Appl. Energy 2015, 142, 144–153. [Google Scholar] [CrossRef]
  46. Pethurajan, V.; Sivan, S.; Joy, G.C. Issues, comparisons, turbine selections and applications–An overview in organic Rankine cycle. Energy Convers. Manag. 2018, 166, 474–488. [Google Scholar] [CrossRef]
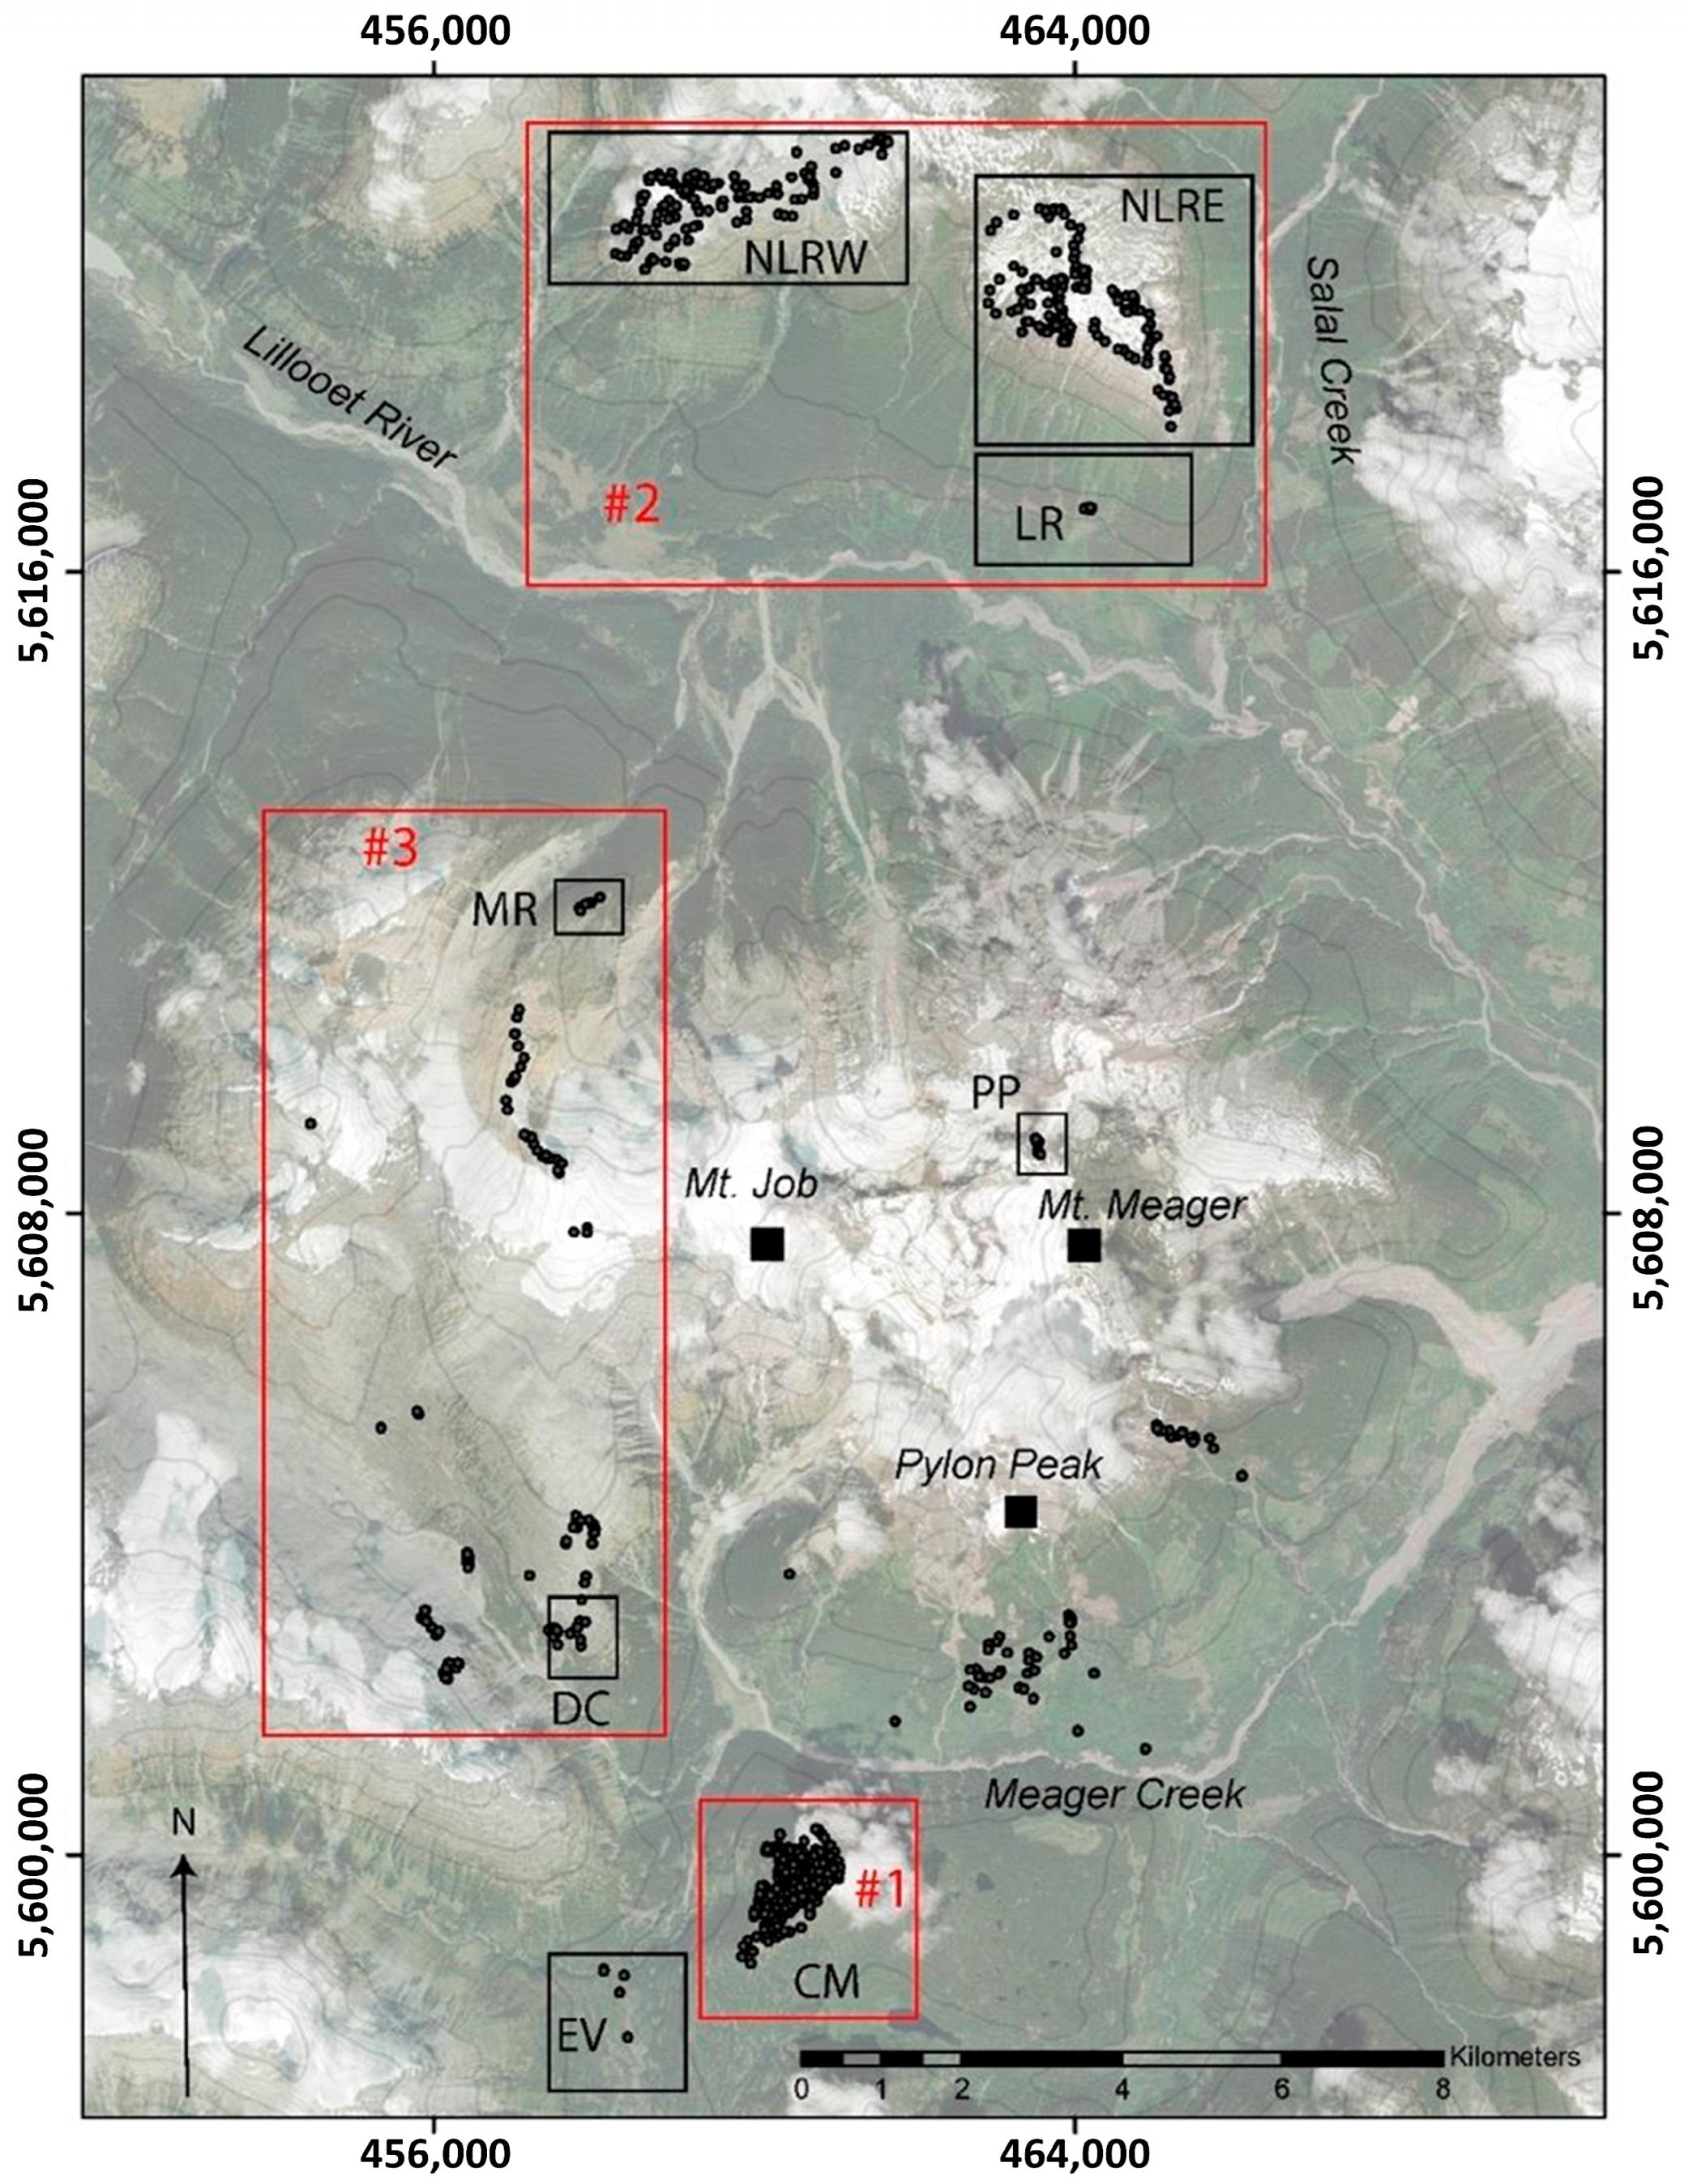
Figure 1. Mount Meager regional location and geological background map [16]. Abbreviations: CM, Capricorn Mountain; NLRW, North Lillooet River; LR, Lillooet River; MR, Meager River; DC, Devastation Creek. Drilling and thermal logging data reveal that the deep geothermal gradient in this area significantly exceeds the average continental background, with recorded temperatures reaching 250–260 °C at depths of ~2 km [17]. According to the Geological Survey of Canada, regional heat flux ranges from 100 to over 150 mW/m2, with localized geothermal gradients exceeding 60 °C/km—indicative of active mantle upwelling and shallow hydrothermal circulation [16].
Mining 05 00055 g001
Figure 2. Mount Meager regional geothermal gradient profile [17]. Labels “1A–22A” denote survey station IDs; the suffix “A” indicates the A-series sites used in this study.
Mining 05 00055 g002
Figure 3. Integrated slghp + orc geothermal power generation closed-loop process flow diagram.
Mining 05 00055 g003
Figure 4. Surface heat flux distribution under Case 1, showing bottom-concentrated heating and intense condenser-side release.
Mining 05 00055 g004
Figure 5. Liquid volume fraction distribution of SLGHP under Case 1, indicating stable stratification with lower condenser liquid content.
Mining 05 00055 g005
Figure 6. Variation trend of condensation heat flux under different operating conditions, showing the dominant role of working fluid type.
Mining 05 00055 g006
Figure 7. Variation trend of condensation liquid volume fraction under different operating conditions, revealing trade-offs between fluid volatility and liquid hold-up.
Mining 05 00055 g007
Figure 8. Radar chart of sensitivity indices with 0% baseline for Case 1 reference, showing the highest sensitivity for working fluid type.
Mining 05 00055 g008
Figure 9. The 24 h dynamic heat flux response of the evaporator and condenser sections in the SLGHP system under Case 1 conditions, demonstrating thermal stability and daytime enhancement.
Mining 05 00055 g009
Table 1. Simulation case matrix.
CaseWorking FluidPipe Diameter (mm)Pipe Length (m)Filling Ratio (%)Material
1H2O76120040304 SS
2H2O90120040304 SS
3H2O114120040304 SS
4H2O9060040304 SS
5H2O90200040304 SS
6NH376120040304 SS
7CO276120040304 SS
8H2O90120030304 SS
9H2O90120050304 SS
10H2O90120040Aluminum
Table 2. Sensitivity analysis of structural parameters on condensation performance in SLGHP.
ParameterΔ Heat Flux (W/m2)Sensitivity Index of Heat Flux (%)Δ Liquid Volume FractionSensitivity Index of Liquid
Volume Fraction (%)
Increase in pipe diameter−1362.4−20−0.03−11.1
Extension of pipe length−1600.8−23.50.013.7
NH3 replacing H2O1362.420−0.07−25.9
CO2 replacing H2O2724.840−0.09−33.3
Filling ratio at 30%−1294.3−19−0.04−14.8
Filling ratio at 50%632.69.80.0311.1
Aluminum replacing stainless steel−817.4−12−0.01−3.7
Table 3. Sensitivity of NPV and payback period for key economic parameters.
ParameterBase CaseRange TestedNPV Impact (±)Payback Period Impact (±)
Electricity Price (CAD/kWh)0.090.05–0.15±42%±3.6 years
Drilling Cost (CAD/m)54004000–7000±35%±2.1 years
ORC Efficiency (%)1210–16±12%±1.0 year
Discount Rate (%)64–10±8%±0.6 year
Table 4. Coupling between SLGHP thermal performance and economic output metrics under representative case configurations.
CaseHeat Flux (W/m2)Net Output per Pipe (kW)Total Output (100 Pipes) (kW)Capital Cost per kW (CAD)NPV Impact
Case 1 (H2O, baseline)34630.6603000Base
Case 7 (CO2)48500.84842400+42%
Case 5 (longer pipe)26500.46463800−30%
Case 9 (50% fill)64450.75752700+15%
Case 10 (aluminum)53950.5503300−12%
Table 5. Sensitivity ranking of SLGHP design parameters and their coupled effects on thermal performance and economic output.
ParameterCategoryNormalized Sensitivity Score (0–1)Direction of InfluenceRecommended Design Implication
Working Fluid Type (CO2 vs. H2O)Technical1↑ Heat Flux, ↓ Liquid Hold-upPrefer CO2 for high-output scenarios if stability is manageable
Pipe Length (2000 m vs. 1200 m)Technical and Economic0.85↓ Heat Flux, ↑ CostLimit length to ≤1200 m for optimized balance
Drilling CostEconomic0.82↓ NPVExplore multi-pipe in single borehole to reduce per-unit cost
Electricity PriceEconomic0.78↑ NPVConsider long-term PPAs or carbon credits
Filling RatioTechnical0.62Non-linearOptimal range: 40–50%
Pipe DiameterTechnical0.55↓ Heat FluxAvoid oversized diameter unless targeting low-flow zones
ORC EfficiencyEconomic0.3↑ NPVAcceptable between 12–14%
Discount RateEconomic0.2↓ NPVUse ≤ 6% in risk-adjusted models
Pipe Material (Al vs. SS)Technical0.18↓ PerformancePrefer SS304/316L for thermal stability
Working Fluid Type (CO2 vs. H2O)Technical1↑ Heat Flux, ↓ Liquid Hold-upPrefer CO2 for high-output scenarios if stability is manageable
Note: Arrows indicate the direction of influence—↑ means an increase in the corresponding metric, ↓ means a decrease, and ↔ denotes non-linear or neutral influence.
Disclaimer/Publisher’s Note: The statements, opinions and data contained in all publications are solely those of the individual author(s) and contributor(s) and not of MDPI and/or the editor(s). MDPI and/or the editor(s) disclaim responsibility for any injury to people or property resulting from any ideas, methods, instructions or products referred to in the content.