Article

ASTER and Hyperion Satellite Remote Sensing Data for Lithological Mapping and Mineral Exploration in Ophiolitic Zones: A Case Study from Lasbela, Baluchistan, Pakistan

by
Saima Khurram
1,2,
Zahid Khalil Rao
3,
Amin Beiranvand Pour
1,*,
Khurram Riaz
1,
Arshia Fatima
2 and
Amna Ahmed
4
1
Institute of Oceanography and Environment (INOS), Universiti Malaysia Terengganu (UMT), Kuala Nerus 21030, Terengganu, Malaysia
2
Geological Survey of Pakistan, Petroleum Division, Ministry of Energy, Karachi 74400, Pakistan
3
Department of Remote Sensing and GIS, Institute of Space Technology (IST), Gulshan-e-Iqbal, Karachi 75300, Pakistan
4
Department of Biomedical Engineering, NED University of Engineering & Technology (NEDUET), University Road, Karachi 75270, Pakistan
*
Author to whom correspondence should be addressed.
Mining 2025, 5(3), 53; https://doi.org/10.3390/mining5030053
Submission received: 16 June 2025 / Revised: 12 August 2025 / Accepted: 28 August 2025 / Published: 2 September 2025

Abstract

This study evaluates the capabilities of the Advanced Spaceborne Thermal Emission and Reflection Radiometer (ASTER) and Hyperion remote sensing sensors for mapping ophiolitic sequences and identifying manganese mineralization in the Bela Ophiolite region, located along the axial fold–thrust belt northwest of Karachi, Pakistan. The study area comprises tholeiitic basalts, gabbros, mafic and ultramafic rocks, and sedimentary formations where manganese occurrences are associated with jasperitic chert and shale. To delineate lithological units and Mn mineralization, advanced image processing techniques were applied, including band ratio (BR), Principal Component Analysis (PCA), and Spectral Angle Mapper (SAM) on visible and near-infrared (VNIR) and shortwave infrared (SWIR) bands of ASTER. Using these methods, gabbros, basalts, and mafic-ultramafic rocks were effectively mapped, and previously unrecognized basaltic outcrops and gabbroic outcrops were also discovered. The ENVI Spectral Hourglass Wizard was used to analyze the hyperspectral data, integrating the Minimum Noise Fraction (MNF), Pixel Purity Index (PPI), and N-Dimensional Visualizer to extract the spectra of end-members associated with Mn-bearing host rocks. In addition, the Hyperspectral Material Identification (HMI) tool was tested to recognize Mn minerals. The remote sensing results were validated by petrographic analysis and ground-truth data, confirming the effectiveness of these techniques in ophiolite mapping and mineral exploration. This study shows that ASTER band combinations (3-6-7, 3-7-9) and band ratios (1/4, 4/9, 9/1 and 3/4, 4/9, 9/1) provide optimal results for lithological discrimination. The results show that remote sensing-based image processing is a powerful tool for mapping ophiolites on a regional scale and can help geologists identify potential mineralization zones in ophiolitic sequences.

1. Introduction

In Pakistan, ophiolitic sequences formed along the Neotethys ocean floor before the Late Cretaceous collision between the Indian and Eurasian plates. These sequences are observed across various regions, from the Karakorum–Himalaya to the Lasbela District [1,2]. While the northern belts have been extensively studied, the southwestern margin, specifically the Bela Ophiolitic Complex (BOC), remains relatively underexplored [3]. The BOC, located along the Indian–Asian boundary, is the largest ophiolitic belt in Pakistan, extending over 450 km in length and approximately 10 km in width, much of which is obscured by alluvial cover [4]. The BOC consists of serpentinized mantle harzburgite, layered peridotite, gabbros, sheeted dykes, basaltic pillow lavas, and sedimentary rocks [5]. Its economic significance is demonstrated by the occurrence of metals such as Fe, Mn, Ti, Cr, Ni, Co, Zn, and Pb. The mafic and ultramafic sequences, in particular, are prime targets for metallogenic studies [6,7].
Hydrothermal manganese deposits of volcanogenic sedimentary origin have been proposed within this complex, supported by magnetic signatures and aeromagnetic anomalies [8], which collectively reinforce the BOC’s mineralization potential. Ref. [9] further substantiated this by integrating magnetic, geophysical, and geochemical analyses to identify enrichment zones for Mn, Fe, Zn, and Cu, advocating a multidisciplinary approach for subsurface mineral exploration. In the region northwest of Karachi, the Bela Ophiolites comprise a variety of rock types, including serpentinized ultramafics, peridotite, dunite, basalt, gabbro, pelagics, and carbonate formations. Understanding these ophiolite complexes offers insights into the processes of crustal accretion and oceanic lithosphere evolution [10,11]. The underlying metamorphic rocks, located beneath harzburgite layers, often exhibit reverse metamorphism, indicative of tectonic uplift and crustal replacement mechanisms [12].
The prevalence of traditional field-based techniques in Pakistan has presented logistical and financial obstacles for ophiolite mapping, especially in challenging landscapes. Satellite-based techniques have increasingly been used for chromite and manganese exploration [13,14]. The use of satellite data for lithological mapping and mineral exploration is expanding [15,16]. Hyperspectral and multispectral sensors are particularly effective in identifying minerals based on spectral signatures [17].
The launch of NASA’s ASTER sensor revolutionized geological investigations by enabling regional lithological mapping of ophiolitic terrains [18,19,20]. With its 14 spectral bands, ASTER is capable of detecting key minerals through its SWIR bands, which are sensitive to Al-OH, Fe, Mg-OH, Si-O-H, and CO3 features [21,22]. ASTER has been effectively applied to ophiolite-related chromite exploration in various regions [23,24,25]. Hyperion hyperspectral imagery, with its high spectral resolution and 242 bands, is well suited for detecting subtle lithological variations and hydrothermal alteration minerals [26,27]. It has been used in combination with image classification methods such as band ratios, Minimum Noise Fraction (MNF), Feature-Oriented Principal Components (FOPCs), Maximum Likelihood Classifier (MLC), Spectral Angle Mapper (SAM), Matched Filtering (MF), and Linear Spectral Classification (LSC) [28].
Despite these advancements, the Bela Ophiolitic Complex remains inadequately mapped using ASTER and Hyperion data, especially with respect to manganese mineralization. Remote sensing offers a promising and efficient alternative for exploration in this remote and geologically intricate region. This research aims to map lithological units and manganese mineralization zones in the Bela Ophiolite (BO) region, specifically near Uthal and Bela Tehsils. This study integrates field-based rock sampling with ASTER and Hyperion satellite data to establish reference spectral signatures. Advanced image processing techniques, including band ratio (BR), False Color Composites (FCCs), Principal Components (PCs), Optimum Index Factor (OIF), and Spectral Angle Mapper (SAM), are applied to discriminate lithological units and mineralization zones.

2. Geology of the Study Area

Lasbela District, located in southwestern Pakistan, lies along the western margin of the Indo-Pakistan continental plate. This region hosts a significant segment of the ophiolitic belt that developed on the Neotethys oceanic crust prior to its collision with the Eurasian plate during the Late Cretaceous [1]. The Bela Ophiolite Zone (BOZ) within Lasbela is surrounded by a complex framework of tectonic and lithological units, reflecting its position in an active orogenic setting [29]. To the north, the Khuzdar “knot” comprises Mesozoic rocks with distinctively deformed and folded structures [30], beyond which lie the Kalat Plateau, Quetta Syntaxis, Muslimbagh Ophiolites, and the major Chaman Fault. The Khuzdar knot and Quetta Syntaxis show a prominent east–west arcuate structural pattern that sharply contrasts with the dominant north–south alignment of the axial fold–thrust belt [31,32,33].
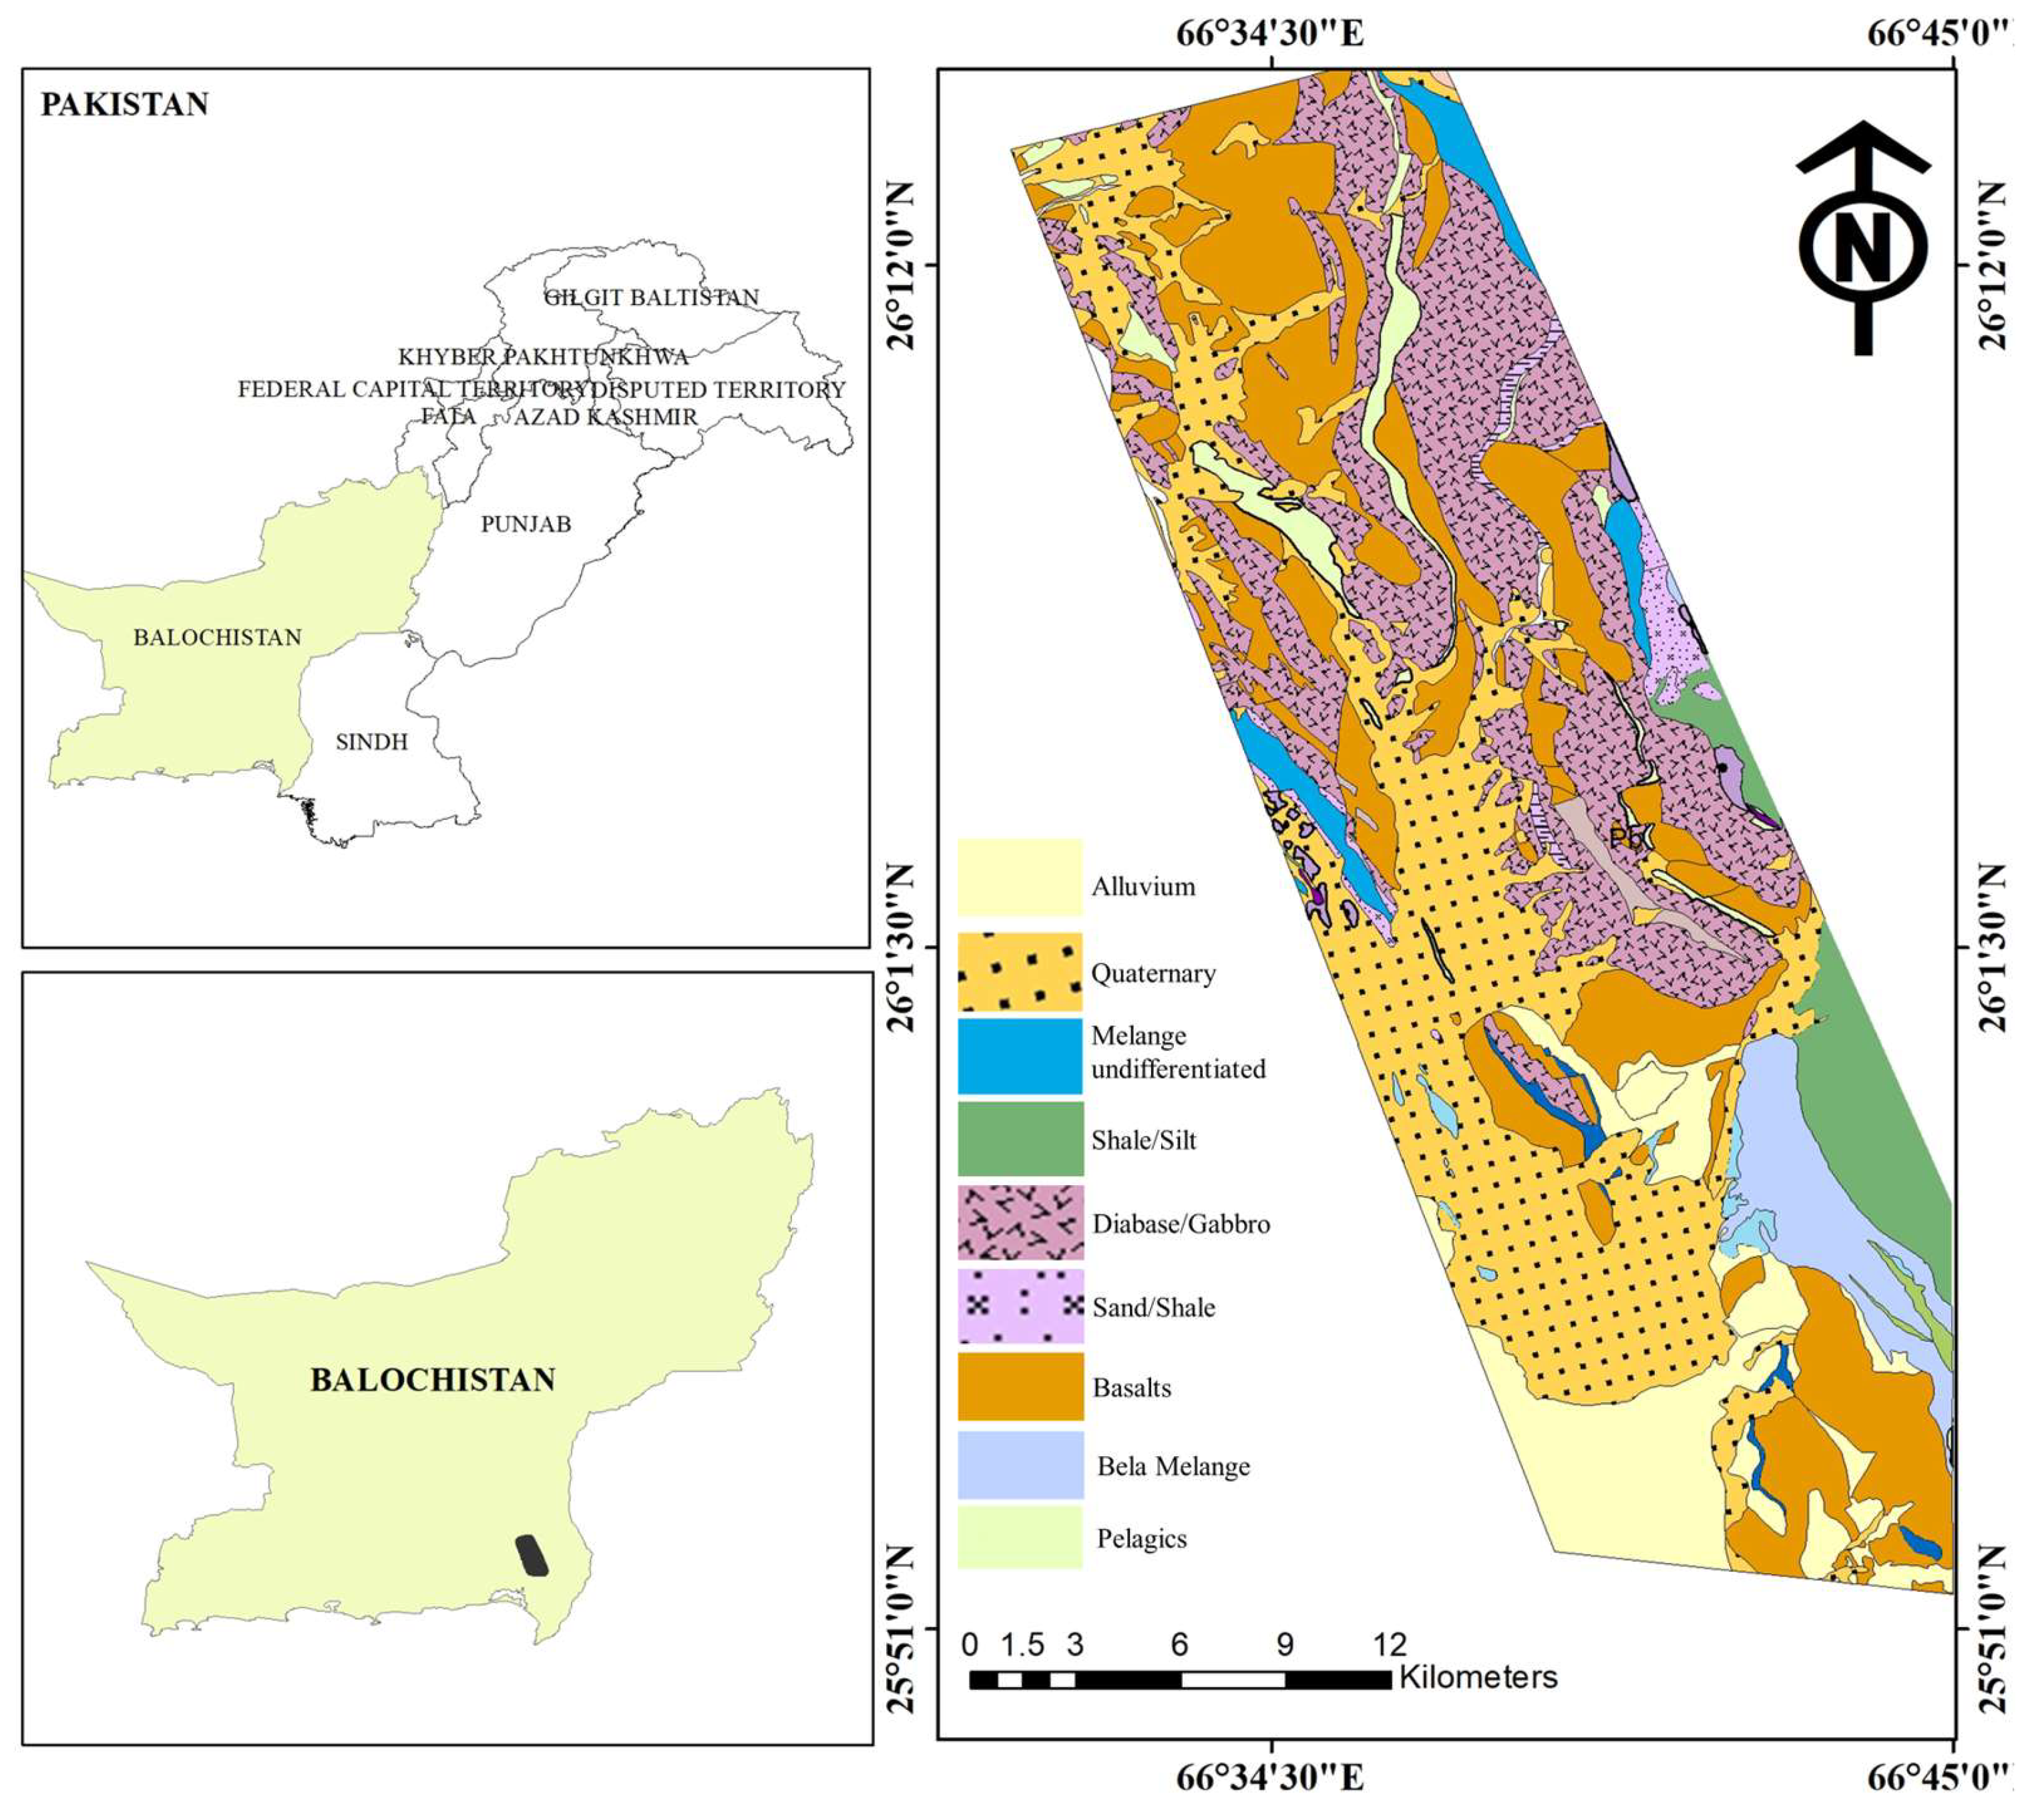
To the east of the BOZ are the Mor, Pab, and Kirthar mountain ranges. The contact zone between the ophiolites and adjacent sedimentary formations is tectonically defined and marked by a 25 m wide crush zone comprising sheared shales, gabbros, diabases, and calcareous slates [1]. The stratigraphy of the Bela Ophiolite exhibits a classical ophiolitic sequence, progressing from ultramafic rocks—such as lherzolite, harzburgite, and dunite—to layered gabbros, sheeted dykes, pillow basalts, and associated deep-marine sediments [14,34]. Manganese mineralization in the region is believed to have originated through the interaction of basaltic oceanic crust with seawater and hydrothermal fluids, possibly aided by mantle-derived volatiles. This has led to the formation of Mn-bearing minerals in jasperitic cherts and associated pelagic sediments [35,36]. The Bela Ophiolite Complex holds geological significance not only due to its well-preserved sequence (Figure 1) and mineral potential but also as part of the larger Tethyan ophiolite belt, which extends across Iran, Afghanistan, and Oman. Despite its scale and economic promise, this segment of the ophiolitic belt remains underexplored in terms of detailed lithological mapping, particularly through advanced remote sensing techniques.

3. Materials and Methods

3.1. Remote Sensing Datasets

The Advanced Spaceborne Thermal Emission and Reflection Radiometer (ASTER) is a multispectral imaging sensor designed to record both reflected and emitted electromagnetic radiation from the Earth’s surface and atmosphere across 14 spectral bands. These include three bands (Table 1) in the visible and near-infrared (VNIR) range (0.52–0.86 μm) with a spatial resolution of 15 m, six bands in the shortwave infrared (SWIR) range (1.6–2.43 μm) at 30 m resolution, and five bands in the thermal infrared (TIR) range (8.125–11.65 μm) with a spatial resolution of 90 m. With a 60 km swath width, ASTER has proven highly effective for regional geological mapping applications [38].
In this study, ASTER Level 1B data from 2002 were obtained through the Earth Remote Sensing Data Analysis Center (ERSDAC) in Japan. The images were georeferenced using UTM zone 42N and the WGS-84 datum. Atmospheric correction was applied using the log residual technique for the VNIR and SWIR bands. In this research, atmospheric correction was conducted on both ASTER and Hyperion data utilizing the FLAASH (Fast Line-of-sight Atmospheric Analysis of Spectral Hypercubes) module within ENVI. For ASTER, the VNIR and SWIR bands were converted from radiance to surface reflectance by employing scene-specific parameters, including acquisition date, sensor altitude, visibility, and solar zenith angle. For Hyperion, a preprocessing workflow was adhered to, which involved destriping, eliminating noisy bands (e.g., bands 1–7, 58–76, and 225–242), and subsequently applying FLAASH to rectify atmospheric distortions in the VNIR-SWIR spectrum. The high spectral resolution of Hyperion renders it especially susceptible to residual atmospheric characteristics; nevertheless, precise parameterization (such as column water vapor and aerosol model) and calibration against field/laboratory spectra contributed to alleviating these effects. Additionally, post-correction validation was carried out through spectral matching with samples from the USGS spectral library, bolstered by petrographic and geochemical field data. This methodology reduced spectral misidentification and ensured that atmospheric residuals did not significantly affect the lithological and mineral identification. Following preprocessing, the data were subjected to several analytical techniques including correlation coefficient analysis, Optimum Index Factor (OIF), Principal Component Analysis (PCA), and band ratio (BR) analysis for the purpose of lithological discrimination and mapping.
The Hyperion sensor represents one of the earliest operational satellite-based hyperspectral imaging systems, offering fine spectral resolution across the 0.4–2.5 μm range at 10 nm intervals. It is a push-broom-type instrument that acquires data across 242 contiguous spectral bands, with a swath width of 7.6 km and a spatial resolution of 30 m [17,41,42]. For this study, Hyperion imagery was acquired as ortho-rectified scenes covering a full 185 km tile, processed at Level 1 (L1_T). The preprocessing steps included conversion from digital numbers (DN) to radiance, radiance to surface reflectance transformation, and atmospheric correction to ensure accurate spectral interpretation and consistency across datasets.

3.2. Methods

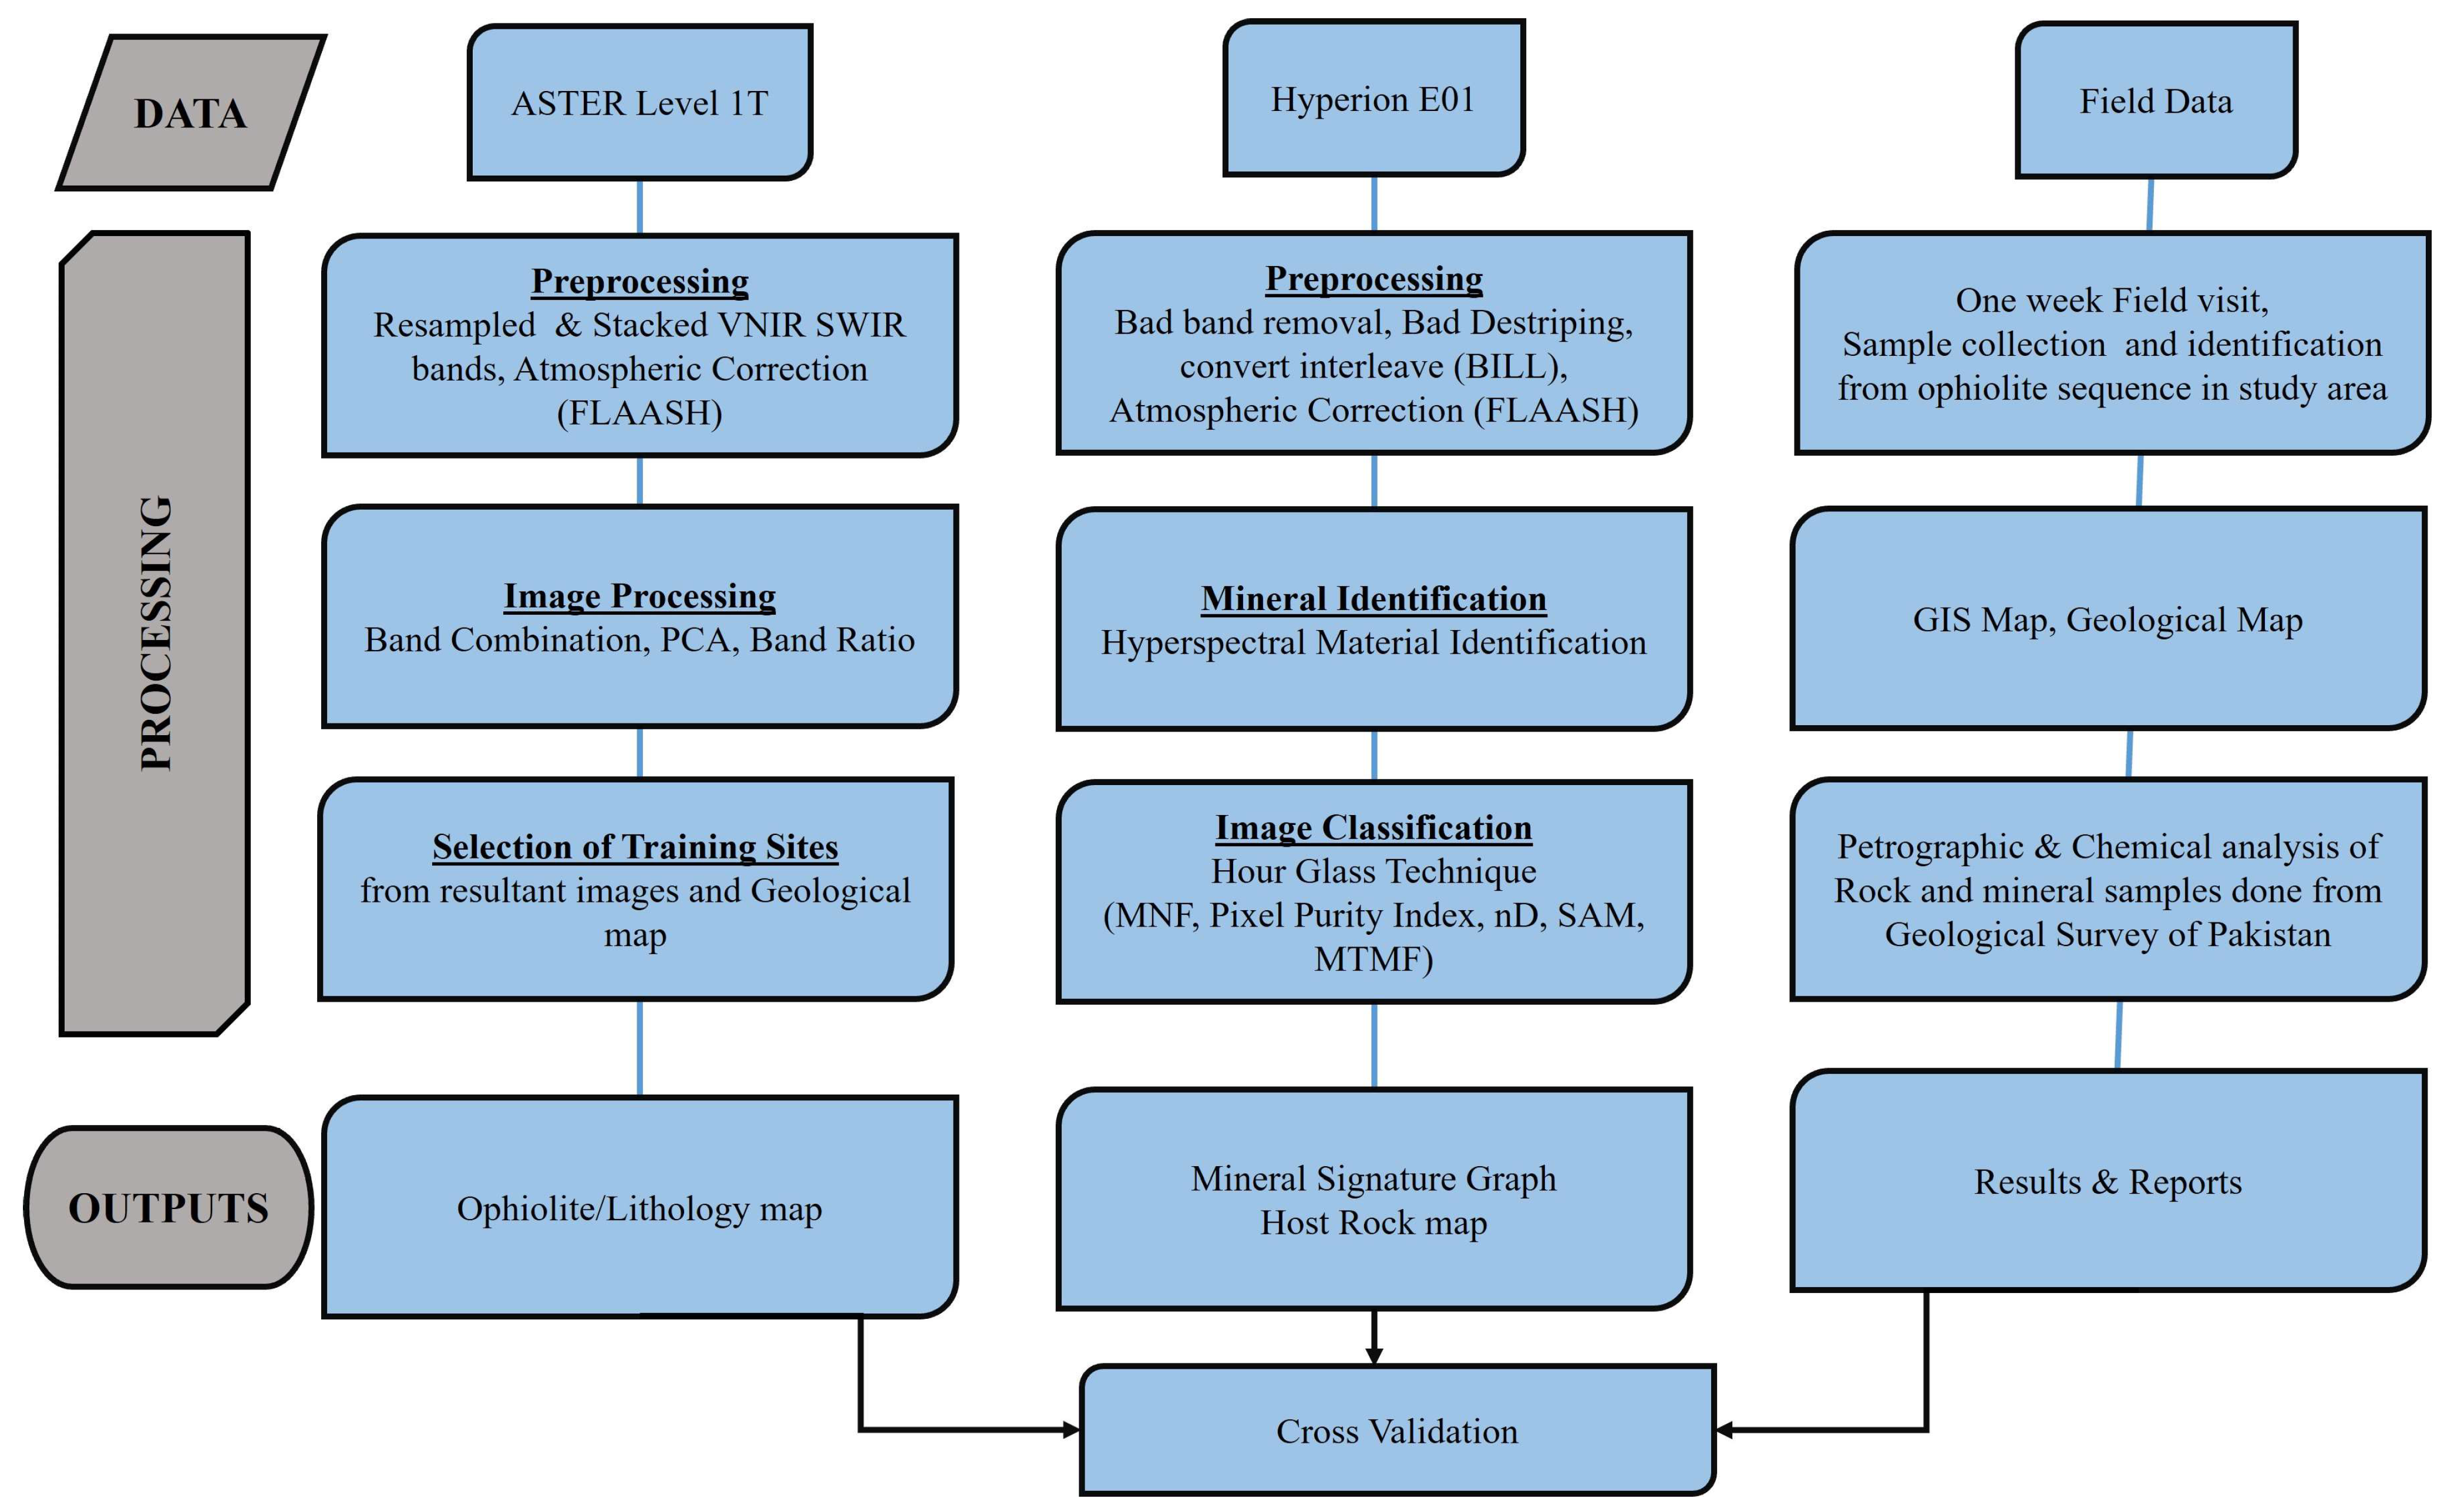
The methodological framework for ASTER Level 1T data begins with standard preprocessing, including the resampling and stacking of VNIR and SWIR bands. Atmospheric correction was performed using the FLAASH (Fast Line-of-sight Atmospheric Analysis of Spectral Hypercubes) model, following the procedures outlined by [43]. Subsequent image processing involved the application of band combinations, Principal Component Analysis (PCA), and band ratio (BR) techniques to enhance lithological contrast. Training sites for supervised classification were selected based on these processed images in conjunction with a regional geological map.
For the Hyperion EO-1 hyperspectral data, preprocessing steps included the removal of bad bands and columns, destriping, and interleave conversion to Band Interleaved by Line (BIL) format. Atmospheric correction was again conducted using the FLAASH method, incorporating refinements suggested [44]. Mineral identification was performed using Hyperspectral Material Identification (HMI) tools in ENVI, while image classification followed the Spectral Hourglass Workflow. This included the application of Minimum Noise Fraction (MNF), Pixel Purity Index (PPI), n-Dimensional Visualizer (n-D), Spectral Angle Mapper (SAM), and Mixture-Tuned Matched Filtering (MTMF). Identified spectral signatures were used to generate a classified host rock map.
The classification results were cross-validated through field data collected during a one-week geological survey, which included targeted rock sampling and in situ identification within the ophiolitic terrain. Integration of GIS data with geological maps supported spatial analysis and interpretation. Petrographic and geochemical analyses of the rock and mineral samples were carried out by the Geological Survey of Pakistan. The comprehensive workflow ensured both spectral and ground-truth consistency, enabling accurate lithological and mineralogical interpretation (Figure 2).

3.3. Image Processing Techniques

3.3.1. ASTER Data Processing

The VNIR and SWIR bands of ASTER data were used. Firstly, data was corrected atmospherically and radiometrically. The VNIR and SWIR dataset used the FLAASH model to rectify the atmospheric influence and transform radiance data into reflectance images. Finally, the data with reduced noise was processed after removing topographic and atmospheric negative effects.

Optimum Index Factor

The Optimum Index Factor (OIF) is a statistical method used to determine the most informative combination of three spectral bands for image interpretation. It evaluates potential RGB band combinations by calculating the total variance (standard deviation) and the degree of inter-band correlation [45]. Band combinations that yield high standard deviations and low inter-band correlations are considered optimal, as they maximize spectral information content while minimizing redundancy.
O I F = S t d i + S t d j + S t d k C o r r i , j + C o r r j , k + C o r r i , k
where
  • Stdi is the standard deviation of band i;
  • Stdj is the standard deviation of band j;
  • Stdk is the standard deviation of band k;
  • Corri,j is the correlation coefficient between bands i and j;
  • Corrj,k is the correlation coefficient between bands i and j;
  • Corri,k is the correlation coefficient between bands i and j.
This occurs such that
Standard   Deviation   ( Std ) :   σ x = 1 N i = 1 N ( x i x ¯ ) 2
where N is the number of points and x ¯ is the mean.
Correlation   Coefficient :   C o r r x y = C o v ( x , y ) σ x σ y
where σx and σy represent the standard deviation of x and y, respectively.

Band Ratios

Band ratio (BR) imaging is a useful enhancement method for identifying different lithological units and alteration zones, especially in ophiolite complexes and mineral exploration. This technique generates images by dividing the digital number (DN) values of two bands, resulting in a grayscale output that improves spectral differences that may not be evident in individual bands [46,47,48]. BR images are particularly effective in emphasizing spectral signatures useful for mapping ophiolitic rocks and related mineral resources [49,50,51,52]. These images are commonly utilized to differentiate rock types like harzburgite and serpentinite–dunite in ophiolitic environments [46,47,53,54,55].
In practical applications, BR techniques have been utilized for lithological mapping in the northwest area of Karachi, particularly along the axial fold–thrust belt of Lasbela, Balochistan. For example, Ref. [54] utilized ASTER band ratios such as 4/7, 4/1, 2/3 × 4/3, along with 4/7, 3/4, and 2/1 in RGB combinations to map Neoproterozoic Allaqi Suture units, which consist of ophiolitic, volcanoclastic, metasedimentary, and granitoid rocks in southeastern Egypt. In another study, Ref. [56] suggested alternative ASTER band ratios, ((2 + 4)/3, (5 + 7)/6, (7 + 9)/8), as more effective for distinguishing lithologic units in ophiolite complexes.
To further improve the interpretation of BR images, false color composite (FCC) band ratio imagery is used to assess the extent and spread of various rock units in the study region. Specifically, BR images have been created to identify exposed mafic and ultramafic lithological units utilizing the Optimum Index Factor (OIF) method. The OIF process involves a correlation matrix among three sets of images to create all possible band ratio combinations across nine bands. The first set of images includes 36 ratios using higher band numbers over lower ones (e.g., B7/B5); the second set consists of 36 ratios with lower band numbers over higher ones (e.g., B4/B9); and the last set combines all 72 band ratios from the first two sets. OIF analysis is then conducted to identify the best three-band combinations by evaluating the total variance and correlation among the bands, ultimately classifying them based on their statistical information content for effective lithological discrimination.

Principal Component Analysis (PCA)

Principal Component Analysis (PCA) is a powerful and reliable technique in image processing that decreases the dimensionality of multispectral datasets by converting the original, correlated spectral bands into a reduced number of uncorrelated output bands [57]. It simplifies intricate spectral data, improving interpretability and highlighting subtle differences in surface materials. This method has become widely adopted in geological studies, especially for mapping lithological and alteration zones in metallogenic regions (e.g., refs. [46,55,56]). PCA has been particularly applied to the VNIR and SWIR spectral bands of ASTER to distinguish ultramafic host rocks and locate mineralized areas within ophiolitic sequences, such as those found in the Eastern Khoy ophiolite complex.
From a technical standpoint, PCA operates by converting all spectral data from the initial correlated bands into a smaller number of new bands that are uncorrelated. The first principal component (PC1) image preserves the highest variance and encapsulates the combined positive contributions from all original bands. The second principal component (PC2) image captures the next highest variance, while the final component usually retains the least variance and often signifies noise [58]. In geological remote sensing, PCA has been successfully utilized on the nine VNIR and SWIR bands of ASTER imagery to highlight and enhance geological characteristics. Among the combinations of Principal Components, the RGB arrangement of PC3, PC2, and PC1 bands has proven particularly effective in identifying ophiolitic rocks.
Furthermore, researchers have shown that integrating PCA images with either an original band or a specific band ratio image often results in improved outcomes compared to traditional false color composite (FCC) imagery. This method is preferred due to the increased image variance of PCA-enhanced composites, which offer better lithological contrast and mineralogical differentiation [59,60]. Consequently, PCA continues to be a vital tool in the spectral data analysis for geological mapping and mineral exploration, providing enhanced precision in the interpretation of multispectral and hyperspectral remote sensing data.

End-Member Collection/Spectral Training Sites

Image spectra of discriminated ophiolitic rock (basalt, gabbro, serpentine) were also collected from ASTER VNIR and SWIR bands. Training sites were selected from PCA results, band ratio images, and geological maps (Figure 1), which were also converted to ROI for end-member selection.

Spectral Angle Mapper (SAM)

The Spectral Angle Mapper (SAM) method is a sophisticated, physics-based image classification technique designed to identify different minerals and rock formations within a specified study area. This method is based on the concept of the spectral angle, which represents the angle between two vectors in an n-dimensional spectral space, with each vector corresponding to a spectral signature [61]. It determines the angle between the spectrum of each pixel in the image and reference spectra by treating them as vectors. Smaller angles indicate a greater similarity, and only those that fall within a predetermined threshold are classified. This vector-based assessment enables SAM to be relatively unaffected by lighting and albedo variations, especially when it utilizes calibrated reflectance data, thereby improving its reliability in various imaging scenarios [62].
The reference spectra used for SAM classification can be obtained from different sources, including laboratory analyses, field measurements, or directly from the imagery [63]. For this study, the end-member spectra were obtained using Region-of-Interest (ROI) average spectra and were sourced from ASCII files or spectral libraries. More specifically, the minerals serpentine, talc, antigorite, and chrysolite were chosen as reference materials and identified using data from the USGS spectral library [64].
SAM has demonstrated versatility, being effective at various spatial resolutions, making it appropriate for both extensive and detailed geological mapping projects. Its straightforward nature and flexibility allow for seamless integration with other image processing methods like spectral enhancement and segmentation [64,65]. The algorithm’s dependence on angular distance, rather than absolute reflectance values, makes it resilient to differences in lighting, and when properly calibrated, even radiance data can produce minimal error as long as the spectral origin remains close to zero. When used in remote sensing software such as ENVI 5.3, SAM enables swift and precise classification of lithologic units based on spectral similarity, making it an effective instrument in mineral exploration and lithological analysis.

3.3.2. Hyperion Data Processing

Prior to atmospheric correction, Hyperion imagery underwent preprocessing steps including the elimination of noisy bands and defective columns, ultimately retaining 156 high-quality spectral bands for analysis. To correct for atmospheric interference and convert radiance to surface reflectance, both Radiative Transfer Models and empirical correction techniques were evaluated. The FLAASH model was adopted for final atmospheric correction due to its effectiveness in hyperspectral datasets. Following correction, dimensionality reduction was essential for subsequent image analysis. The data were processed using the Spectral Hourglass Workflow in ENVI software, which included Minimum Noise Fraction (MNF) transformation and Pixel Purity Index (PPI) calculations. The n-Dimensional Visualizer (n-D) was then employed to identify spectrally pure end-members, where “n” corresponds to the number of selected spectral dimensions. These end-members were cross-referenced against the USGS spectral library using the Spectral Analyst tool.
Spectral classification of host rocks, particularly for manganese-bearing lithologies, was conducted using the Spectral Angle Mapper (SAM) algorithm. This approach allowed the identification of manganese mineral signatures with reference to library spectra. The Hyperspectral Material Identification (HMI) module in ENVI was utilized to classify unknown spectral features by comparing them with standard library entries. The classification relied on three key statistical indicators.
The ACE (Adaptive Coherence Estimator) evaluates the similarity between image spectra and reference spectra. Values range from −1 to 1, with values closer to 1 indicating strong spectral matches.
The likelihood compares multiple spectra to determine relative probability of match. The likelihood values sum to 1, facilitating direct material comparison.
The Full Pixel (FP) Correlation assesses how well a pixel’s spectrum aligns with each candidate spectrum in the library. Values also range from −1 to 1, with higher values indicating better matches. Common background materials such as soil or vegetation typically show lower ACE values.

3.4. Field Data and Laboratory Analysis

A field investigation of the study area was also conducted for cross validation. Fieldwork was performed during February 2020. A geological map, satellite imageries, toposheets, and handheld GPS were used to mark locations for rock samples. In the study area, a total of 20 new rock samples were obtained from accessible and exposed ophiolites. These rock samples were scrutinized for petrography to further validate resultant lithological maps obtained from the satellite images. Mafic lavas and jasperitic chert-type pelagic sediments are almost exclusively associated with the manganese (Mn) deposits. Samples for Mn ore deposits in the study area (north part) were collected previously for geochemistry and to study origin of Mn deposit by a GSP team [6]. Four (04) locations of these deposits were selected for hyperspectral analysis of manganese ore deposits and host rock (pelagic).
The ophiolitic rock units identified by the image processing techniques were confirmed with in situ inspection and thin-section study of 20 rock samples collected during field reconnaissance carried out in February 2020. A total of 20 fresh rock samples were collected from accessible and exposed ophiolites in the study area (Figure 1). Samples from Mn ore deposits (north part) were collected previously for geochemistry and to study origin of Mn deposits [50] by a GSP team. A geochemical analysis was also conducted and was used to validate manganese minerals (psilomelane and braunite) identified by Hyperspectral Material Identification and Spectral Angle Mapper.

4. Results and Analysis

4.1. Lithological Discrimination of Ophiolite Sequence

4.1.1. Color Composite Combinations (Univariate Statistics)

The Optimum Index Factor (OIF) is a statistical method used to identify the most informative three-band combinations from multispectral satellite imagery. It quantifies both the total variance (via standard deviation) and inter-band correlation (via correlation coefficients), aiming to maximize spectral information while minimizing redundancy.
In this study, the ASTER imagery, comprising nine spectral bands from the VNIR and SWIR ranges, was analyzed using OIF to evaluate 84 possible three-band combinations. The standard deviation of each band quantified its individual spectral variability, while the correlation matrix assessed the degree of redundancy between band pairs. The combinations yielding the highest OIF values were considered optimal for lithological discrimination. According to the analysis, the band combinations (3, 6, 7) and (3, 7, 9) both achieved the highest OIF score of 89.15 (Table 2, Table 3 and Table 4). These combinations demonstrated the highest spectral variance and the lowest inter-band correlation, indicating their superior capability for distinguishing lithological units. These high OIF scores suggest that the selected band composites enhance the spectral contrast between different rock types while minimizing information overlap. Consequently, ASTER RGB composites using bands 3, 6, 7 and 3, 7, 9 were identified as the most effective for visualizing the lithological variations within the ophiolitic sequence of the study area.
The base lithological map generated in this study primarily utilizes the ASTER RGB band combination 3, 6, 7 (Figure 3), identified through the Optimum Index Factor (OIF) analysis as one of the most information-rich composites. This combination proved particularly effective for discriminating lithological units within the Late Cretaceous ophiolite sequence exposed in the study area, especially those exhibiting a north–south (NS) structural orientation.
The map successfully differentiates key geological formations: pelagic sediments that host manganese mineralization are distinctly rendered in green, while ultramafic rocks—especially those altered to serpentinites—are clearly delineated in the northwestern sector of the mapped region. The spectral contrast enabled by this band composite enhances the visibility of lithological contacts and facilitates the interpretation of spatial relationships among mafic, ultramafic, and sedimentary units.

4.1.2. Band Ratios Composite Image

Image enhancement techniques play a critical role in improving the interpretability of satellite data for geological applications. Among these, band ratioing is particularly effective for highlighting spectral differences between lithological units by computing the ratio of digital number (DN) values between specific spectral bands. However, selecting the most informative band ratio combinations poses a key challenge, especially in complex geological terrains.
To address this, the Optimum Index Factor (OIF) method was applied to evaluate and rank all potential RGB band ratio combinations. OIF assesses each set of band ratios based on two statistical parameters: total variance (measured via standard deviation) and redundancy (assessed through correlation coefficients). Higher OIF values indicate combinations with greater spectral variability and minimal correlation, thus offering enhanced lithological discrimination.
In this study, all 72 possible band ratios derived from four VNIR and five SWIR bands of ASTER imagery were computed and analyzed. The results indicated that the combinations 1/4, 4/9, 9/1 and 3/4, 4/9, 9/1 achieved the highest OIF values, specifically 139.4 and 138.71, respectively (see Table 5 and Table 6). These high OIF scores suggest that these RGB band ratio composites are most suitable for mapping ophiolitic lithologies in the study area, providing optimal spectral separation for mafic and ultramafic units.
The geological interpretation of the ASTER band ratio composite image using the 1/4, 4/9, 9/1 combination (in RGB) revealed significant improvement in the spectral differentiation of various lithological units within the ophiolite sequence (Figure 4). In this composite, gabbroic rocks appear in distinct red tones, clearly separating them from adjacent units. Basalts are represented in yellow to yellowish-green, while diabase is discernible in light green. Serpentinites exhibit a reddish-yellow hue, and an additional purplish tone distinguishes some basaltic exposures, enhancing their visibility.
While this band ratio combination enabled effective lithological differentiation and visualization of spatial relationships among mafic and ultramafic units, it lacked the precision needed to define sharp lithological boundaries and structural features. In particular, fault lines, unit contacts, and transitional zones remained ambiguous. To overcome these limitations and enhance boundary delineation, Principal Component Analysis (PCA) was subsequently applied to the ASTER dataset, offering improved structural clarity and lithological discrimination.

4.1.3. PCA Analysis

Principal Component Analysis (PCA) was conducted on the ASTER VNIR and SWIR bands following preprocessing. The covariance matrix facilitated the extraction of eigenvalues and eigenvectors, with PC1, PC3, and PC4 selected based on their contribution to eigenvalues and their effectiveness in highlighting lithological and structural features. The results of PCA were presented as RGB composites to aid in the visual identification of lithological units and faults. This approach greatly enhanced the spectral separability and geological significance of the classification outcomes. PC1, PC3, and PC4 enhance lithological contrast and delineate sharp boundaries among various mafic and ultramafic rock units, particularly basalt, gabbro, and serpentinite. The PCA transformation improved feature discrimination by reducing data dimensionality while preserving the most significant spectral variance.
The integration of PCA outputs with band ratio composites facilitated the identification of a previously undocumented basaltic exposure in the northeastern part of the study area (Figure 5). Additionally, two new gabbroic prospects—not recorded in earlier geological surveys—were identified through this enhanced analytical approach. Structural features, especially fault lines, were distinctly observed in the PCA images, offering improved insights into the tectonic fabric of the region and enhancing the interpretive accuracy of lithological boundaries.

4.1.4. SAM Classification

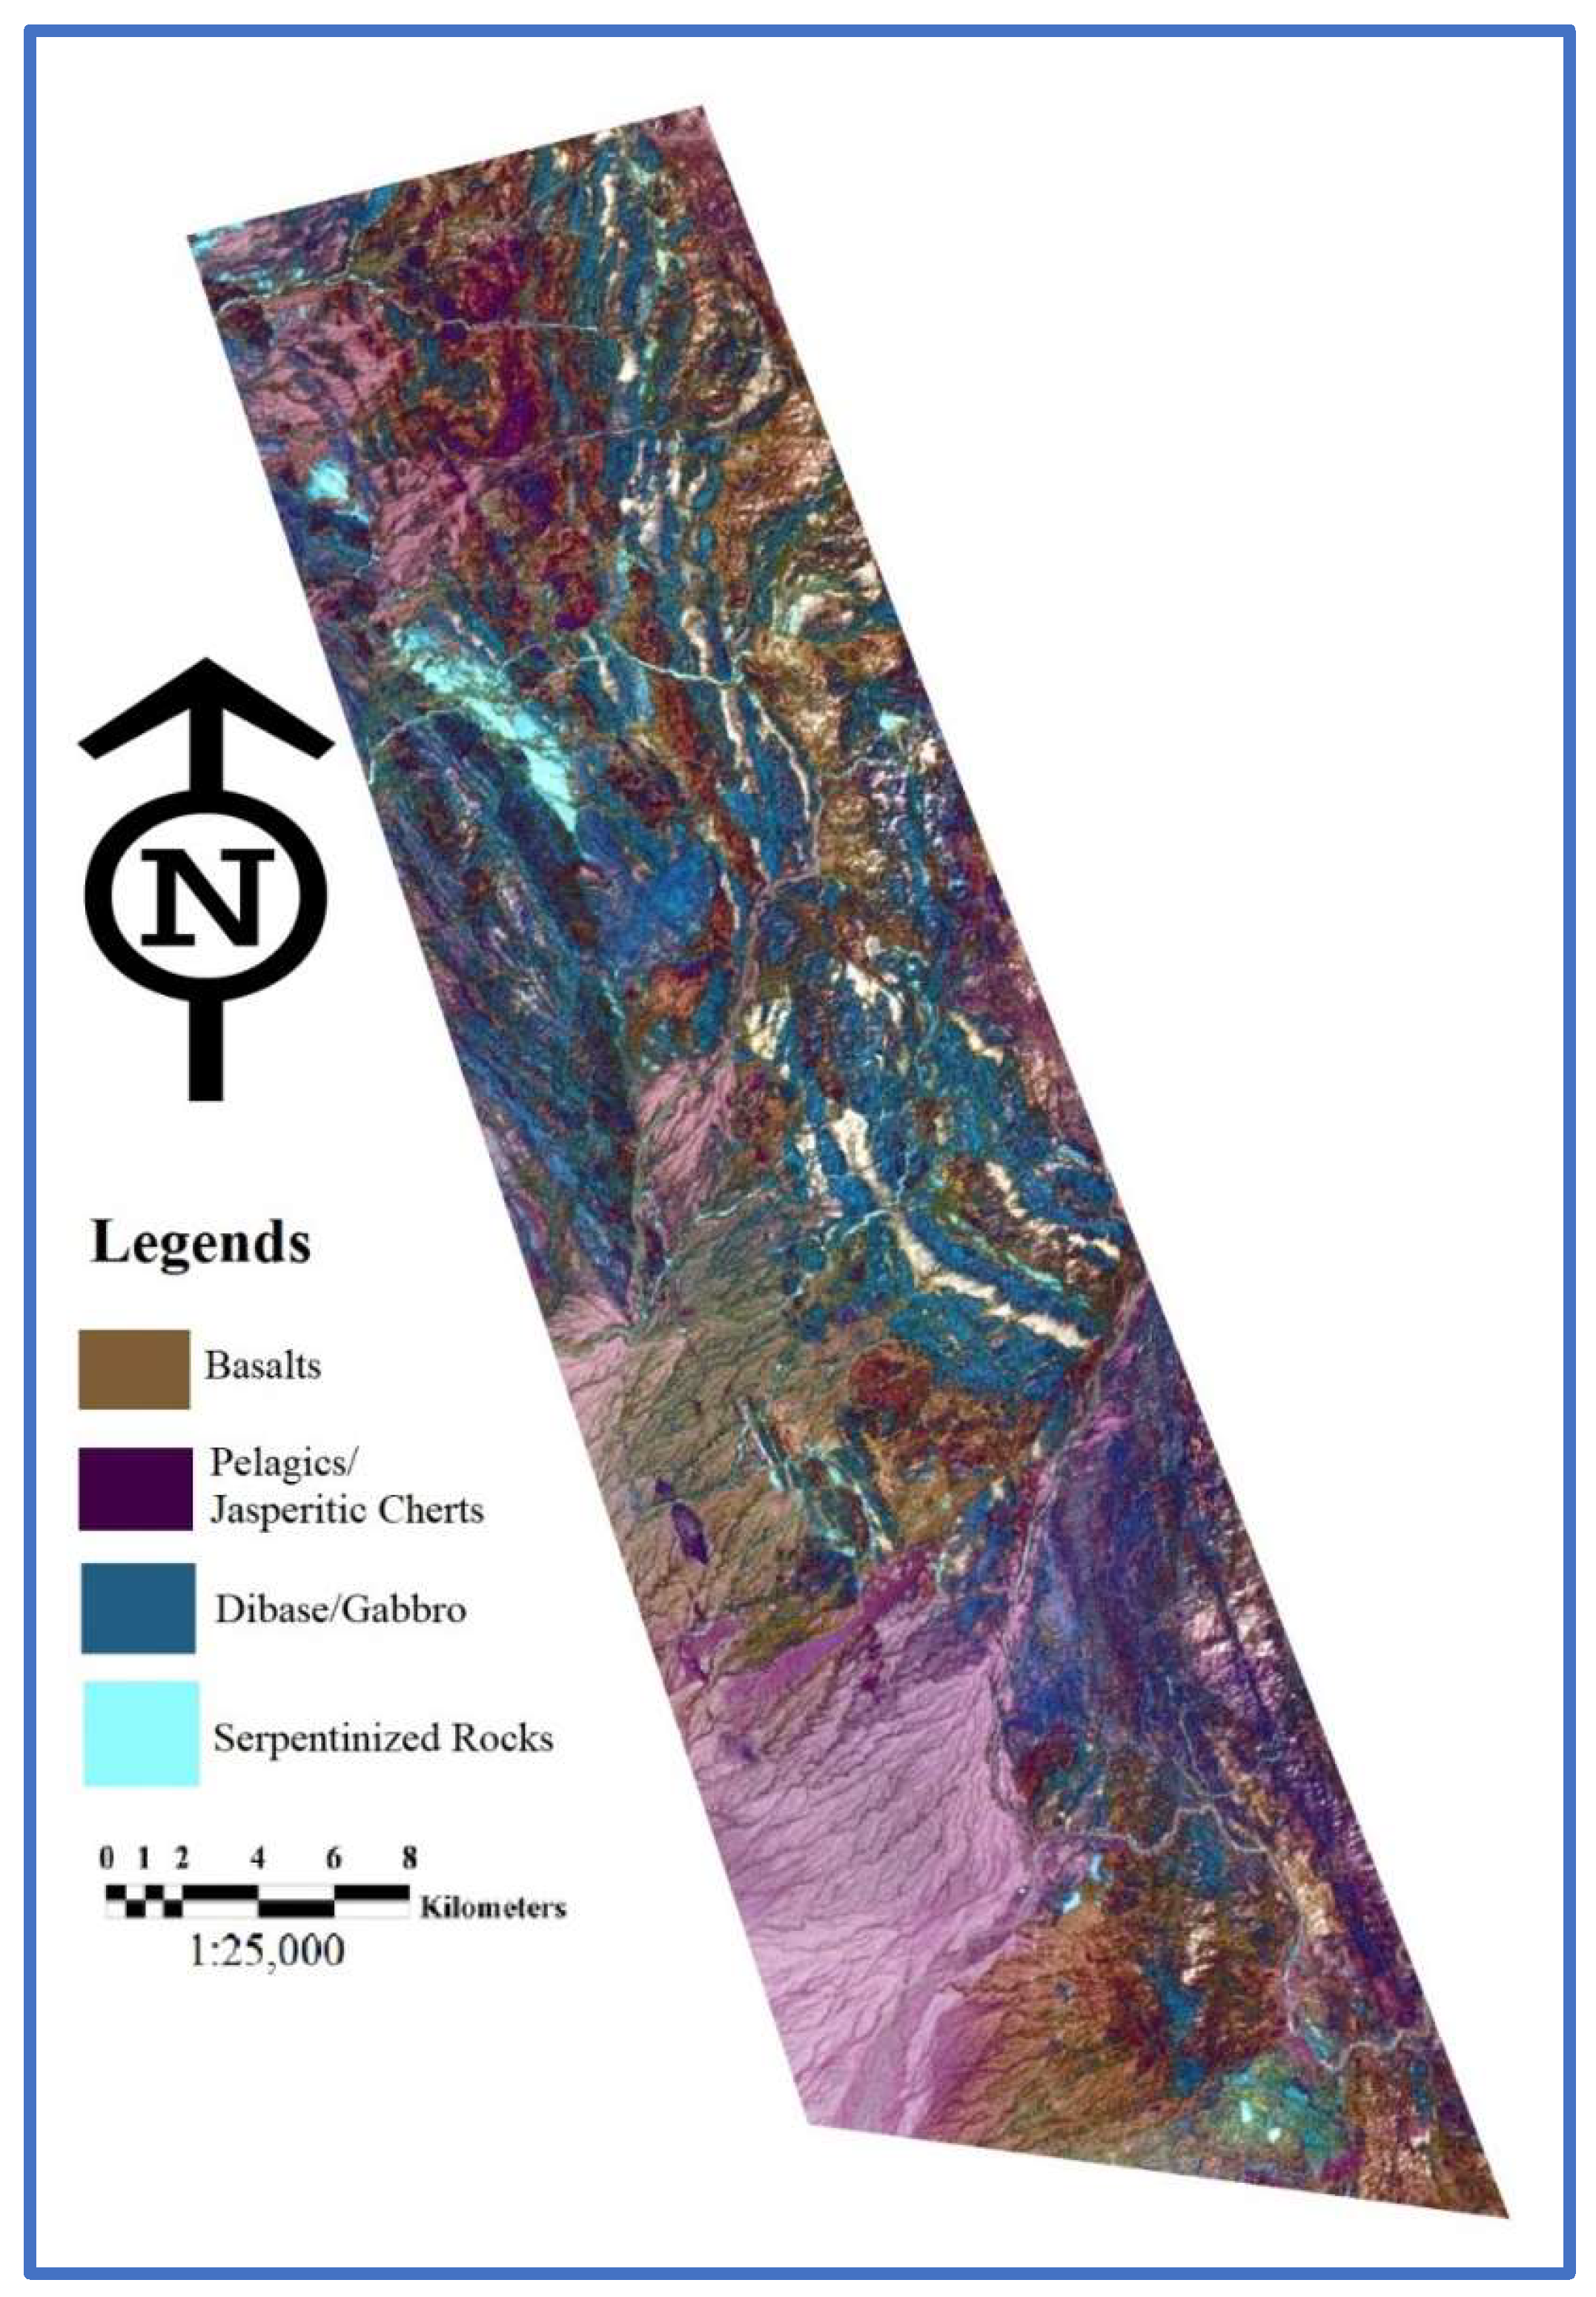
For the development of the training datasets, commonly referred to as Regions of Interest (ROIs), we relied on geological maps along with processed ASTER satellite imagery that had been enhanced through Principal Component Analysis (PCA) and band ratio techniques. Weathering alters surface mineralogy, affecting spectral reflectance, especially in SWIR. ROIs were selected from fresh, homogeneous exposures and matched with minimally weathered reference spectra. Fault zones cause spectral mixing due to lithological blending and alteration. These areas were cross-checked with geological maps and excluded or interpreted cautiously. PCA and band ratio enhanced lithological contrasts and reduced noise. These ROIs were carefully selected to ensure they maintained spectral consistency and geological relevance, serving as inputs for the Spectral Angle Mapper (SAM) classification processed in ENVI. The SAM algorithm functions by evaluating the angle between the spectral signature of each pixel and the reference spectra (end-members) within a multidimensional framework. We set the spectral angle threshold at 0.1 radians, a choice made through experimentation to achieve a suitable balance between effectively identifying similar materials and reducing false positives. The reference spectra were obtained from the USGS spectral library and verified through field samples of all lithological units. The resultant lithological classification map (Figure 6) delineates key geological units, including serpentinized ultramafic rocks (host to chromite), jasperitic cherts (host to manganese mineralization), and the broader distribution of mafic and ultramafic units along with a colored mélange complex.
The SAM results clearly distinguished the colored mélange in the southern part of the study area, characterized by a heterogeneous assemblage of ophiolitic components, volcanic rocks, jasperitic cherts, and pelagic limestones. Specific lithologies were well classified by color codes: basalts in dark brown, diabase/gabbro in dark blue, and serpentinite and other ultramafic exposures in light blue, predominantly in the northwest. Quaternary and recent deposits appeared in light purple.
Of particular significance, jasperitic cherts, consistently associated with pillow basalts, were identified in dark purple with sharply defined boundaries. The SAM classification effectively corroborated field mapping and petrographic observations, validating its capability to distinguish manganese-hosting lithologies and chromite-bearing ultramafic rocks with spatial accuracy across complex terrain.

4.1.5. Field Validation

To support and validate the remote sensing interpretations, petrographic analysis was performed on representative rock samples, including diabase gabbro, ultramafic units, and pillow basalts (Table 7). The primary objective was to confirm mineralogical composition and assess the degree of alteration and serpentinization within ultramafic rocks.
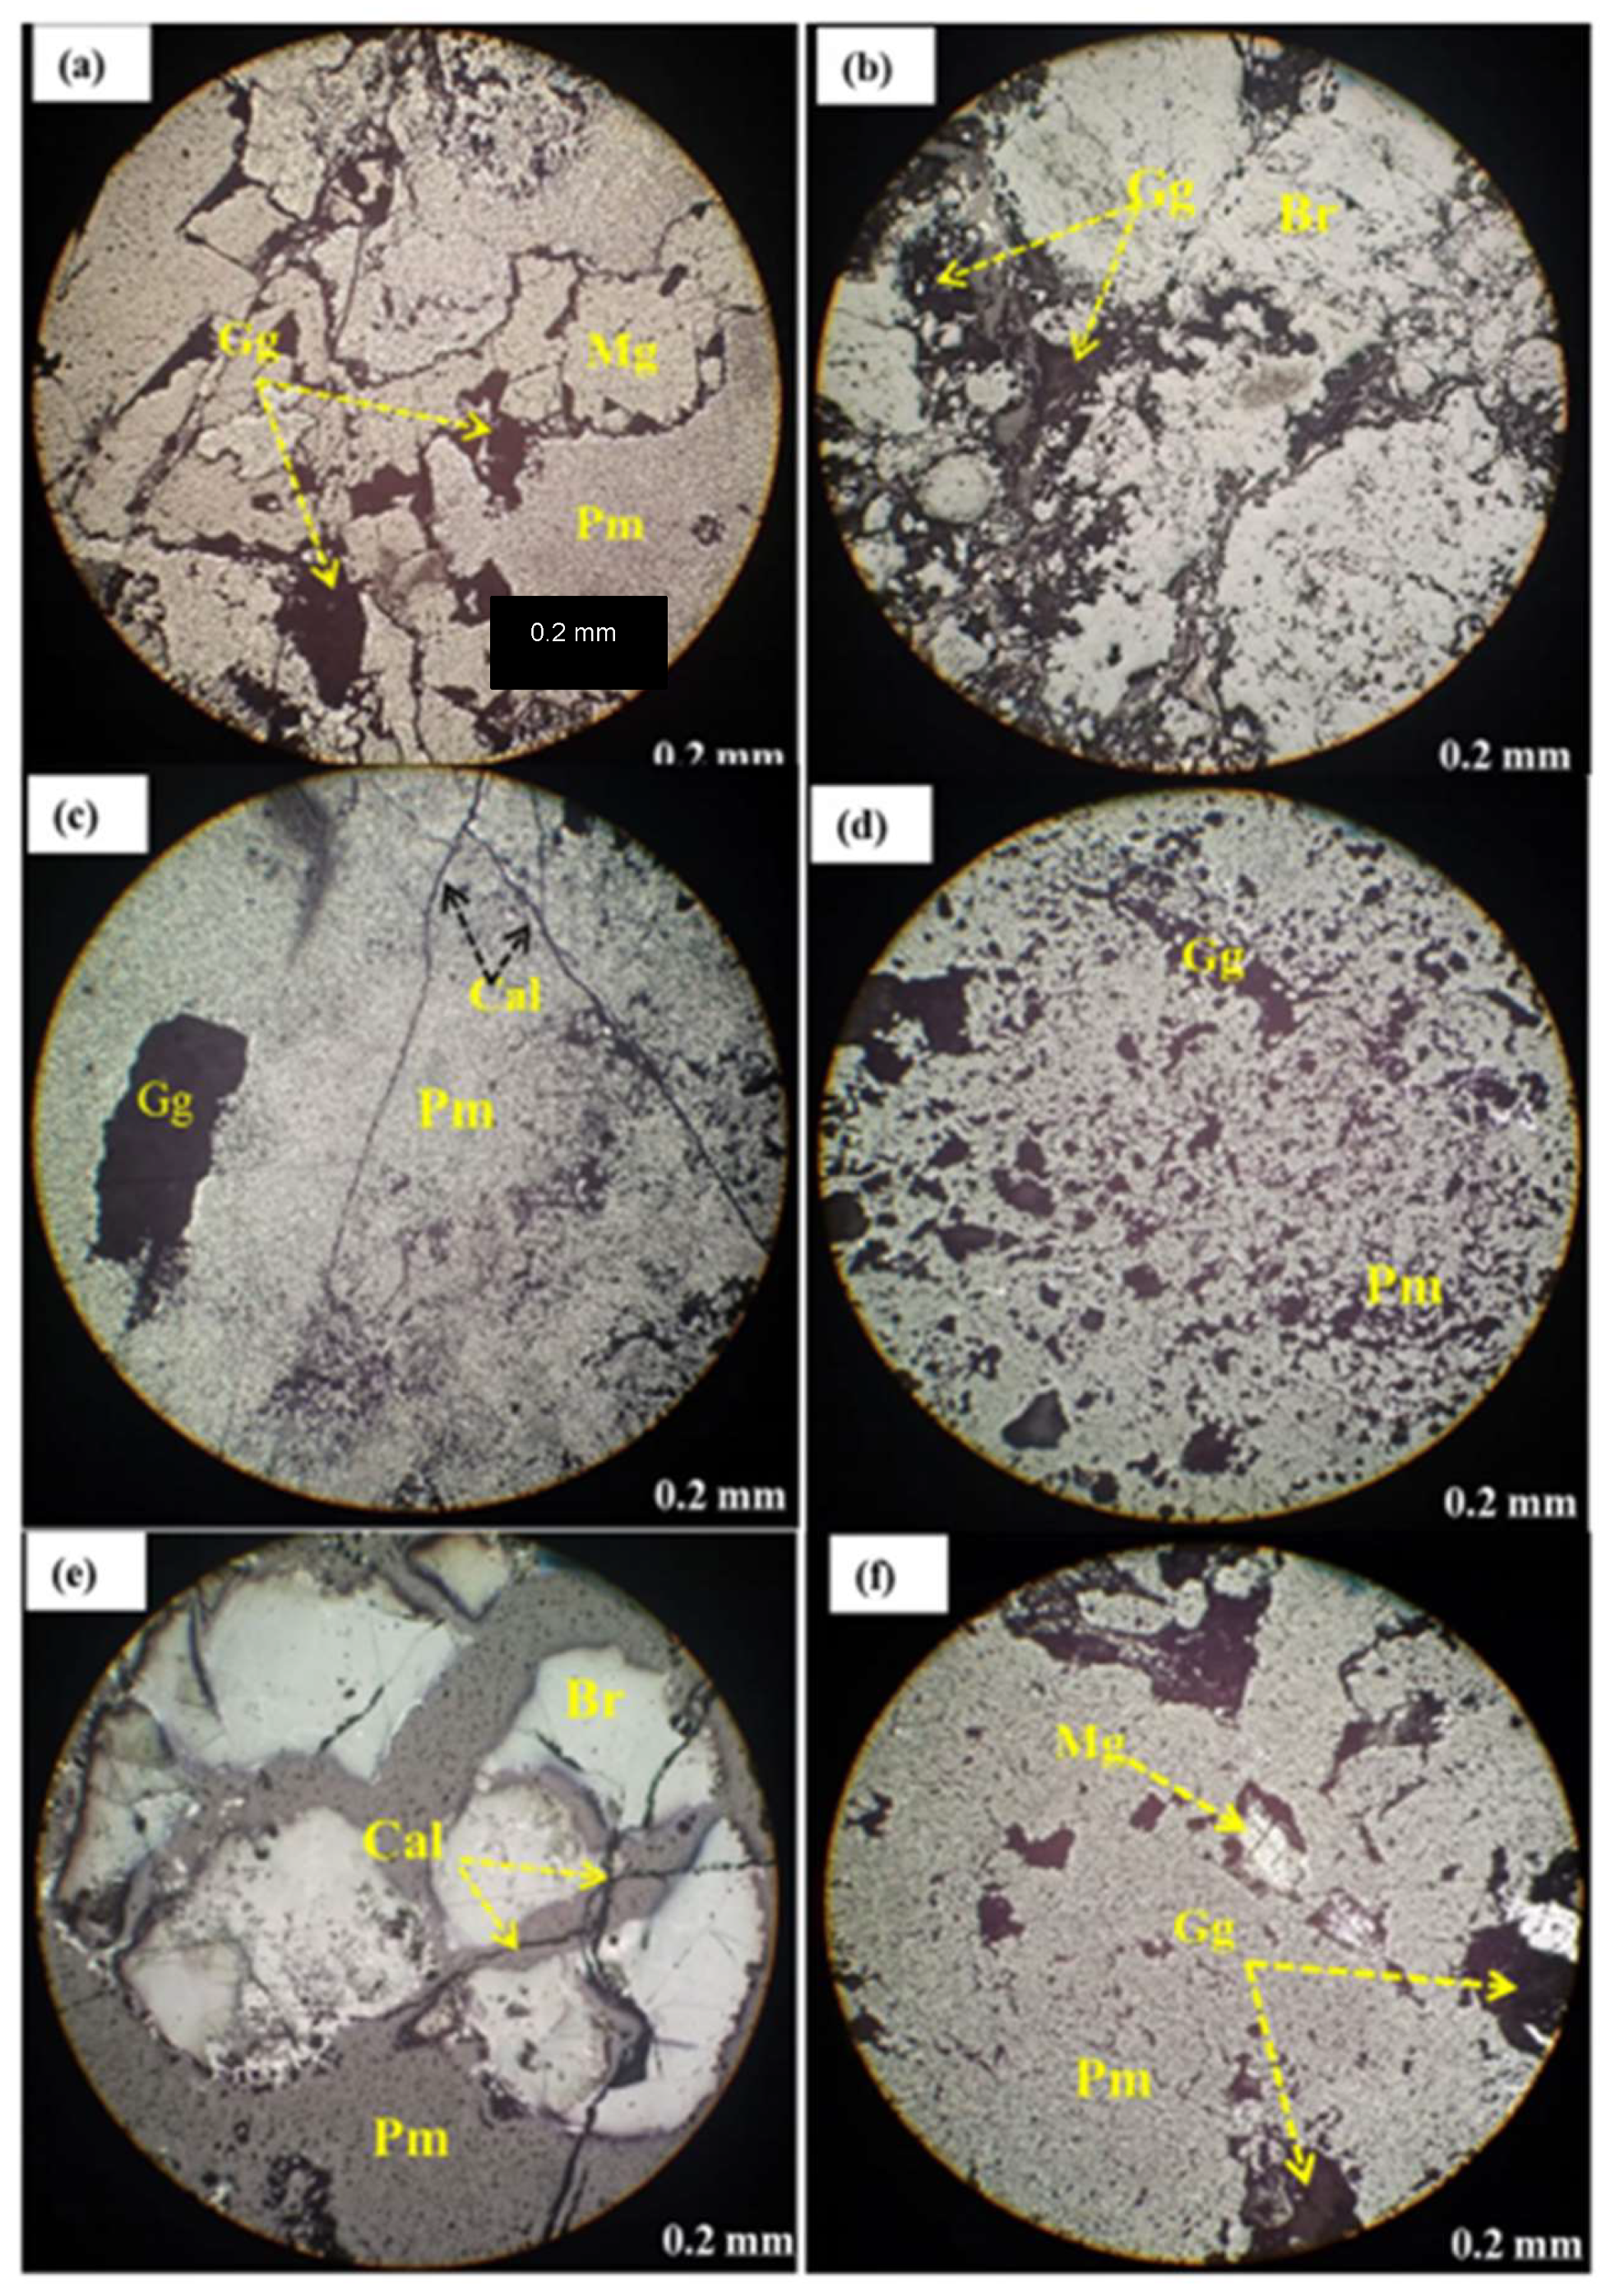
Thin-section analyses were conducted under polarized light microscopy (Figure 7a–f). In diabase gabbro samples, textures such as ophitic to sub-ophitic intergrowths of pyroxenes and plagioclase were observed, along with accessory opaque minerals including magnetite and ilmenite. The ultramafic samples revealed evidence of serpentinization, including characteristic mesh and bastite textures, suggesting alteration of olivine and orthopyroxene, respectively. Dominant secondary minerals such as antigorite were identified, with occasional relics of primary phases.
Pillow basalts were found to be fine-grained and altered, with plagioclase laths and clinopyroxenes variably affected by uralitization. These petrographic observations were consistent with the lithological units interpreted from ASTER-based image processing, particularly in differentiating altered ultramafics from other mafic rocks.
The petrographic data thus provided a critical line of validation, aligning with the spectral classifications and confirming the presence and alteration state of the major rock types mapped through remote sensing.
Diabase Gabbro Sills:
Petrographic examination reveals that the diabase gabbro sills are melanocratic and holocrystalline, and they exhibit medium- to coarse-grained textures, ranging from ophitic to sub-ophitic. The dominant mafic minerals are subhedral to anhedral pyroxenes, primarily clinopyroxene, with minor occurrences of hornblende. These mafic phases are enclosed within a matrix of euhedral to subhedral plagioclase, which frequently displays polysynthetic twinning, consistent with the albite law.
The plagioclase is predominantly labradorite (An52–55), and moderate sericitization is commonly observed. The clinopyroxenes exhibit varying degrees of uralitization, and in some grains, a feathery texture is evident, indicative of mineral alteration. Accessory opaque minerals such as magnetite and ilmenite are also present. Overall, the rocks display signs of alteration and fracturing, and their textural characteristics transition between typical gabbroic and diabase compositions.
Ultramafics Sequence:
The petrographic investigation of the ultramafic rocks is complicated by extensive alteration, which has significantly modified the primary mineral assemblages. The main rock types identified within the ultramafic sequence are serpentinite and hornblendite.
These rocks exhibit textures and mineralogical features indicative of post-magmatic transformation, primarily through hydration and metasomatic processes, making it challenging to identify original igneous components. Detailed descriptions of each lithology are provided below.
Serpentinite:
The serpentinite samples predominantly exhibit mesh and bastite textures, indicative of extensive alteration. These textures are diagnostic: bastite texture forms due to the alteration of orthopyroxene, while mesh texture is associated with the serpentinization of olivine. The presence of orthopyroxene relics in some thin sections provides petrographic evidence that the rock originally contained pyroxenes, which were subsequently altered. The dominant serpentine phase identified is antigorite, suggesting low- to medium-grade metamorphic conditions. Hematite and magnetite are locally observed, and chromite grains are present in trace amounts, consistent with the mineral assemblage typically associated with serpentinized ultramafics.
Hornblendite:
Hornblendite is characterized by a coarse-grained texture and is dominated by hornblende, occurring in both longitudinal and basal sections. The hornblende grains range from subhedral to euhedral, reflecting relatively slow crystallization. Fine-grained clinopyroxenes are dispersed in patches throughout the rock. Additionally, calcite veins and patches displaying high-order interference colors are present, suggesting that the calcite is secondary and likely introduced during late-stage hydrothermal alteration. This mineralogical assemblage indicates a metasomatized ultramafic origin with subsequent overprinting by fluid-related processes.
Pillow Basalts:
The pillow basalts are fine-grained and equigranular, and they exhibit a high degree of fracturing and alteration, which obscures definitive textural identification. Plagioclase laths are largely altered, reducing their visibility under the microscope; however, in less altered zones, the plagioclase displays extinction angles between 31° and 33°, indicative of labradorite composition. Clinopyroxenes are dispersed throughout the rock and often show signs of uralitization, a common secondary process reflecting low-grade metamorphism. The pervasive alteration suggests hydrothermal activity post-emplacement.
Columnar Basalt:
The columnar basalts are melanocratic and holocrystalline, and they range from fine- to medium-grained. The texture is predominantly intergranular to sub-ophitic, composed of interlocking plagioclase crystals intergrown with anhedral pyroxenes and accessory opaque minerals such as ilmenite and magnetite. A finer-grained sub-type of columnar basalt is also observed, exhibiting a sub-ophitic texture with lath-like plagioclase, medium-grained pyroxenes (anhedral to subhedral), and irregularly shaped uralite. The opaque minerals display a variety of morphologies, including elongated, rhombic, and skeletal forms, with magnetite being the dominant phase.

4.1.6. Accuracy Assessment

An error (confusion) matrix compares classified pixels with reference data to evaluate classification performance [66]. Rows represent the classified output, while columns represent ground-truth classes. The kappa coefficient measures agreement beyond chance, with values of 0.6–0.8 indicating substantial agreement [67]. For this study, comparison with GPS field data yielded an overall accuracy of 80% and a kappa of 0.733 (Table 8), reflecting high reliability and minimal confusion among the mapped lithological units using ASTER imagery.

4.2. Mineral and Host Rock Identification

Manganese (Mn) deposits exhibit distinct spectral absorption characteristics, enabling their remote identification using hyperspectral data. The reflectance spectra of manganese ores (Figure 8 and Figure 9) are influenced by the surface mineral composition, primarily dominated by pyrolusite and psilomelane, along with a mixture of host rock minerals and weathering products. In the study area, these Mn deposits are spatially associated with mafic lavas and jasperitic chert-type pelagic sediments.
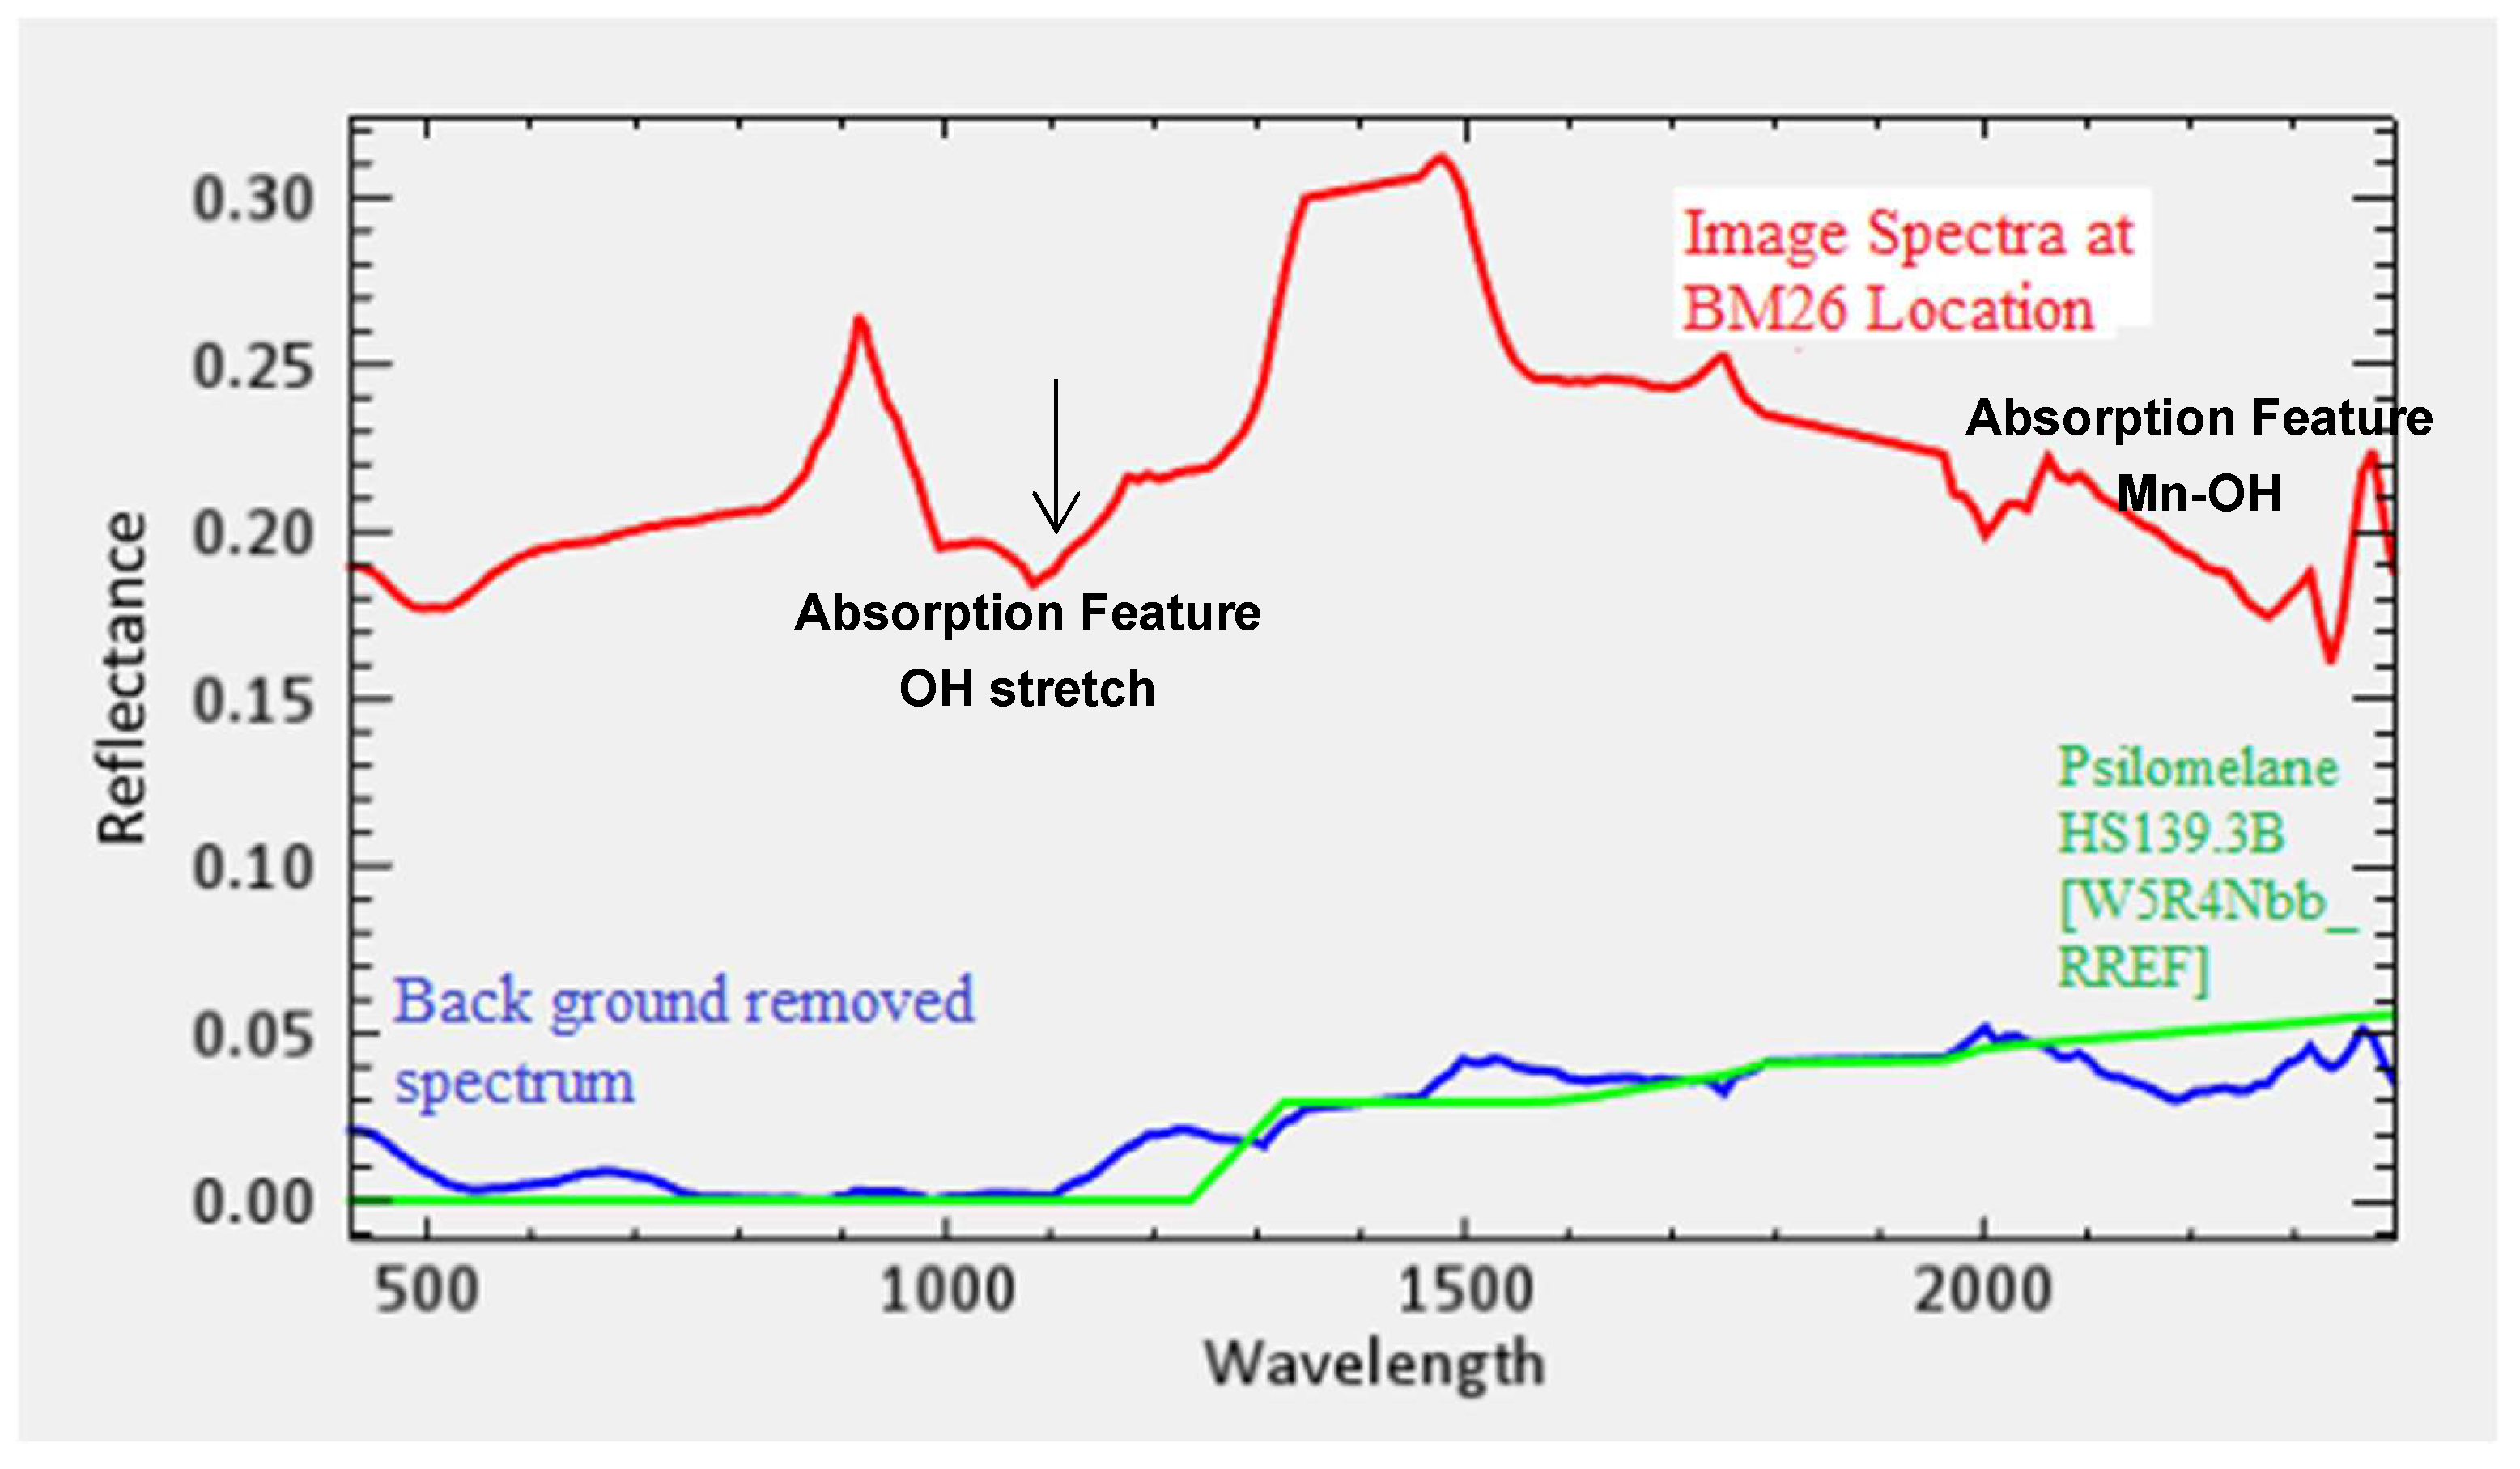
Unknown spectral signatures extracted from Hyperspectral Material Identification (HMI) analysis were compared against reference spectra in the USGS spectral library using ENVI software. The spectral profiles from the sample locations showed a strong match with psilomelane HS139.3B [W5R4Nbb_RREF], a manganese-bearing mineral (Table 9). The Adaptive Coherence Estimator (ACE) values for sample locations BM26 and BM27 were both 1.0000, indicating an excellent spectral match. Additionally, likelihood values of 1.0000 confirmed the highest probability of similarity with the reference spectrum. The Full Pixel (FP) Correlation and Background-R (Bknd-R) Correlation metrics further supported the spectral classification (Table 9).
The psilomelane spectra identified in HMI analysis exhibit broad absorption features with relatively low reflectance across the VNIR and SWIR spectral regions, which are typical for manganese oxides. These spectral responses are presented in Figure 8 and Figure 9, highlighting the diagnostic absorption patterns attributable to Mn-OH bonds and other manganese-bearing mineral features.
The spectral profile of psilomelane, as shown in Figure 8 and Figure 9, is characterized by moderately low reflectance and prominent absorption features across the visible and shortwave infrared (SWIR) regions. These spectral characteristics are primarily attributed to the abundance of Mn-O molecular bonds within the mineral structure. The hyperspectral analysis of four manganese ore samples consistently revealed absorption features indicative of hydroxyl (O–H) bonding, further confirming the identification of psilomelane as the dominant manganese phase.
The spectral interpretation is corroborated by petrographic examination and geochemical analysis (X-ray diffraction analysis) (Table 10) of samples BM26 and BM27; as detailed in Table 4. the elemental composition of these samples is dominated by MnO content (30.84% in BM26 and 34.1% in BM27), along with significant proportions of SiO2, Fe2O3, and Al2O3, supporting the presence of manganese oxides and associated gangue minerals such as silica and iron oxides.

4.3. Microscopic Observations and Mineral Characterization

Microscopic analysis of manganese ore samples (Figure 10) revealed the presence of two primary manganese minerals: (1) psilomelane and (2) braunite. Magnetite also appears as a common accessory phase. The gangue mineral assemblage predominantly includes quartz, cryptocrystalline silica, and calcite, also identified in the micrographs. The co-occurrence of psilomelane and braunite, along with magnetite, was substantiated by petrographic observations and supported by the elevated iron (Fe) content revealed in geochemical assays, suggesting magnetite contributes significantly to the total Fe content. The combined presence of cryptocrystalline silica and quartz accounts for the silicon (Si) detected in elemental analysis. The manganese mineralization displayed two distinct phases, each with specific morphological and paragenetic characteristics.
I. Psilomelane
Psilomelane was identified as the dominant manganese mineral across most thin sections. It occurs in both granular and botryoidal forms and displays moderate reflectance under reflected light. Its color varies from light gray to grayish-white and yellowish-gray. Petrographic observations indicate that psilomelane often replaces braunite, forming overgrowths or alteration rims. This mineralogical transformation is consistent with formation under moderate-temperature hydrothermal conditions, where psilomelane precipitates either as a direct hydrothermal phase or as an alteration product of earlier manganese oxides.
II. Braunite
Braunite appears as a secondary yet widespread phase in the analyzed samples. It is considered a primary manganese mineral that undergoes alteration to psilomelane in localized zones, as evidenced by rim structures observed at mineral boundaries (Figure 7). It generally exhibits a botryoidal texture and higher reflectance compared to psilomelane. Braunite’s typical color under the microscope ranges from grayish-white to pale gray, distinguishing it visually from psilomelane.
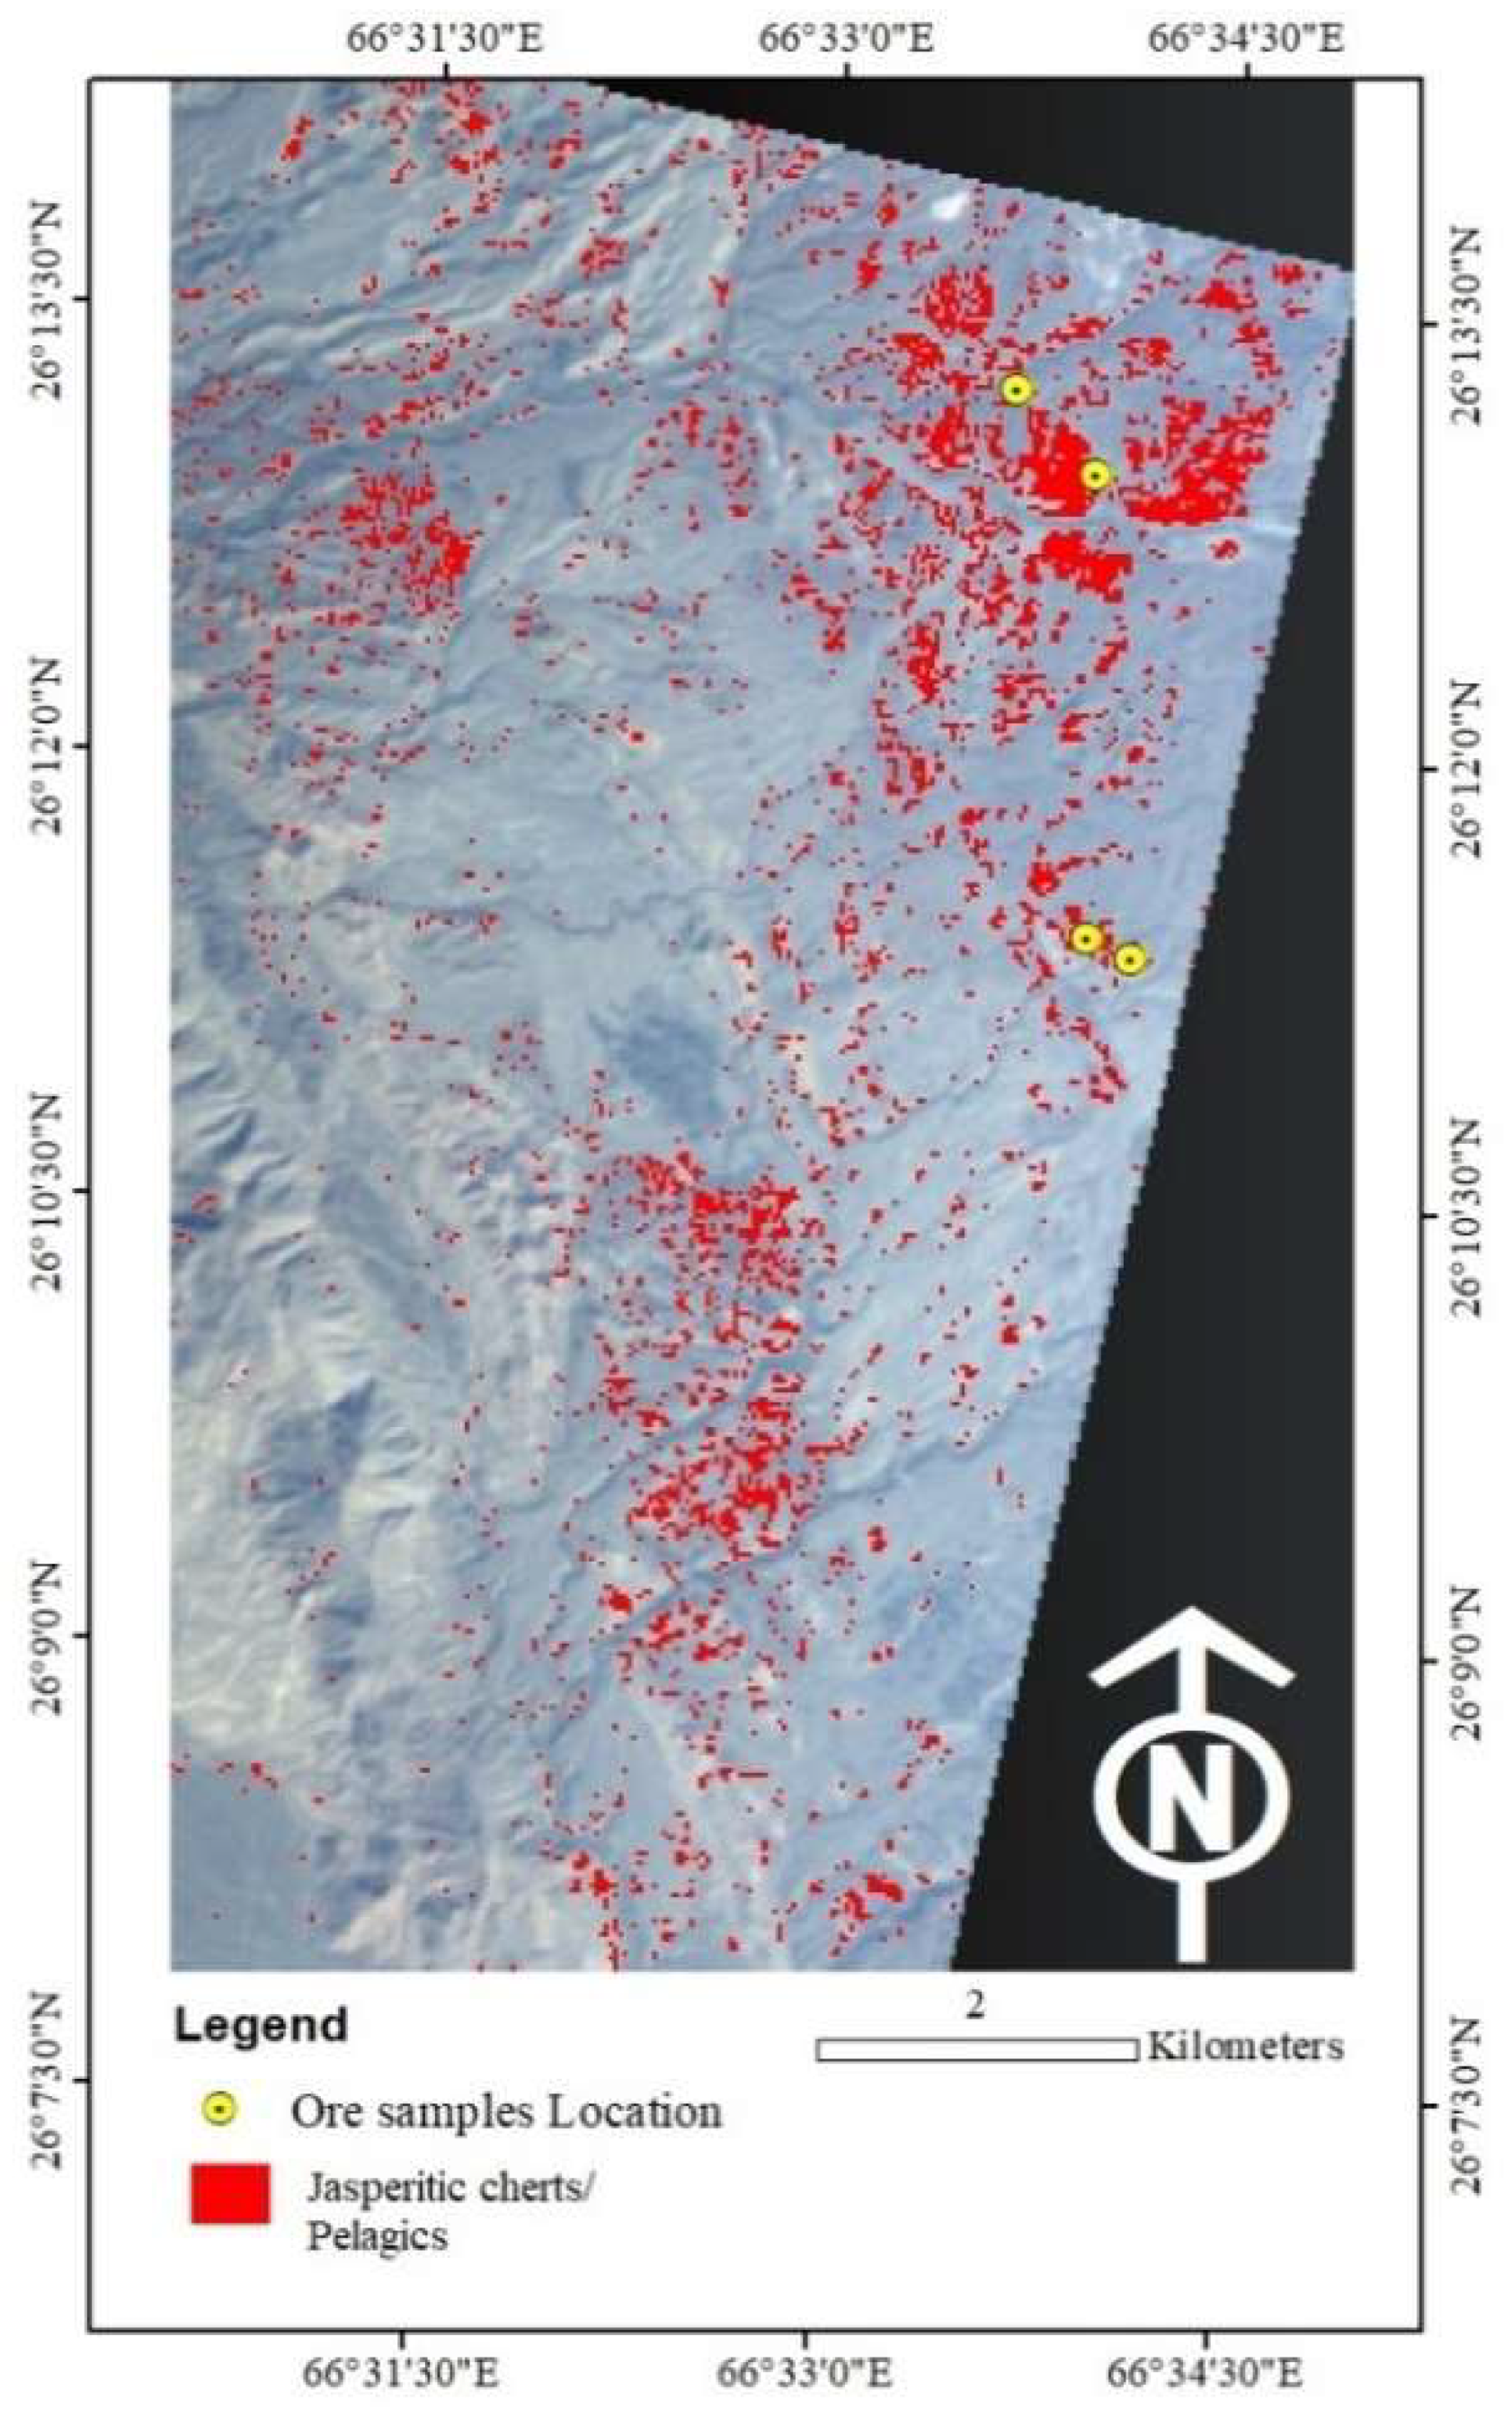
Spectra were identified by HMI and the geological map that was used for image classification of the host rock (jasperitic cherts/pelagic) of manganese. The Spectral Hourglass technique was used on a hyperspectral image to classify the host rocks of manganese minerals. For classification of host rock, the Spectral Angle Mapper (SAM) technique was used (Figure 11), in which a threshold of 0.1 radians was set and the technique was optimized through trials (0.05–0.2) to balance accuracy and reduce false positives, then validated via field and spectral library data. For PPI, 5000 iterations and a 2.5σ threshold above the mean were set to isolate pure pixels while minimizing spectral noise. In MNF, the first 10 components were retained based on eigenvalue analysis.
Field investigations were conducted to validate the lithological interpretations derived from satellite imagery and image processing techniques. In the study area, manganese (Mn) deposits are spatially associated with mafic lavas and jasperitic chert-type pelagic sediments, consistent with the remote sensing-based classification.
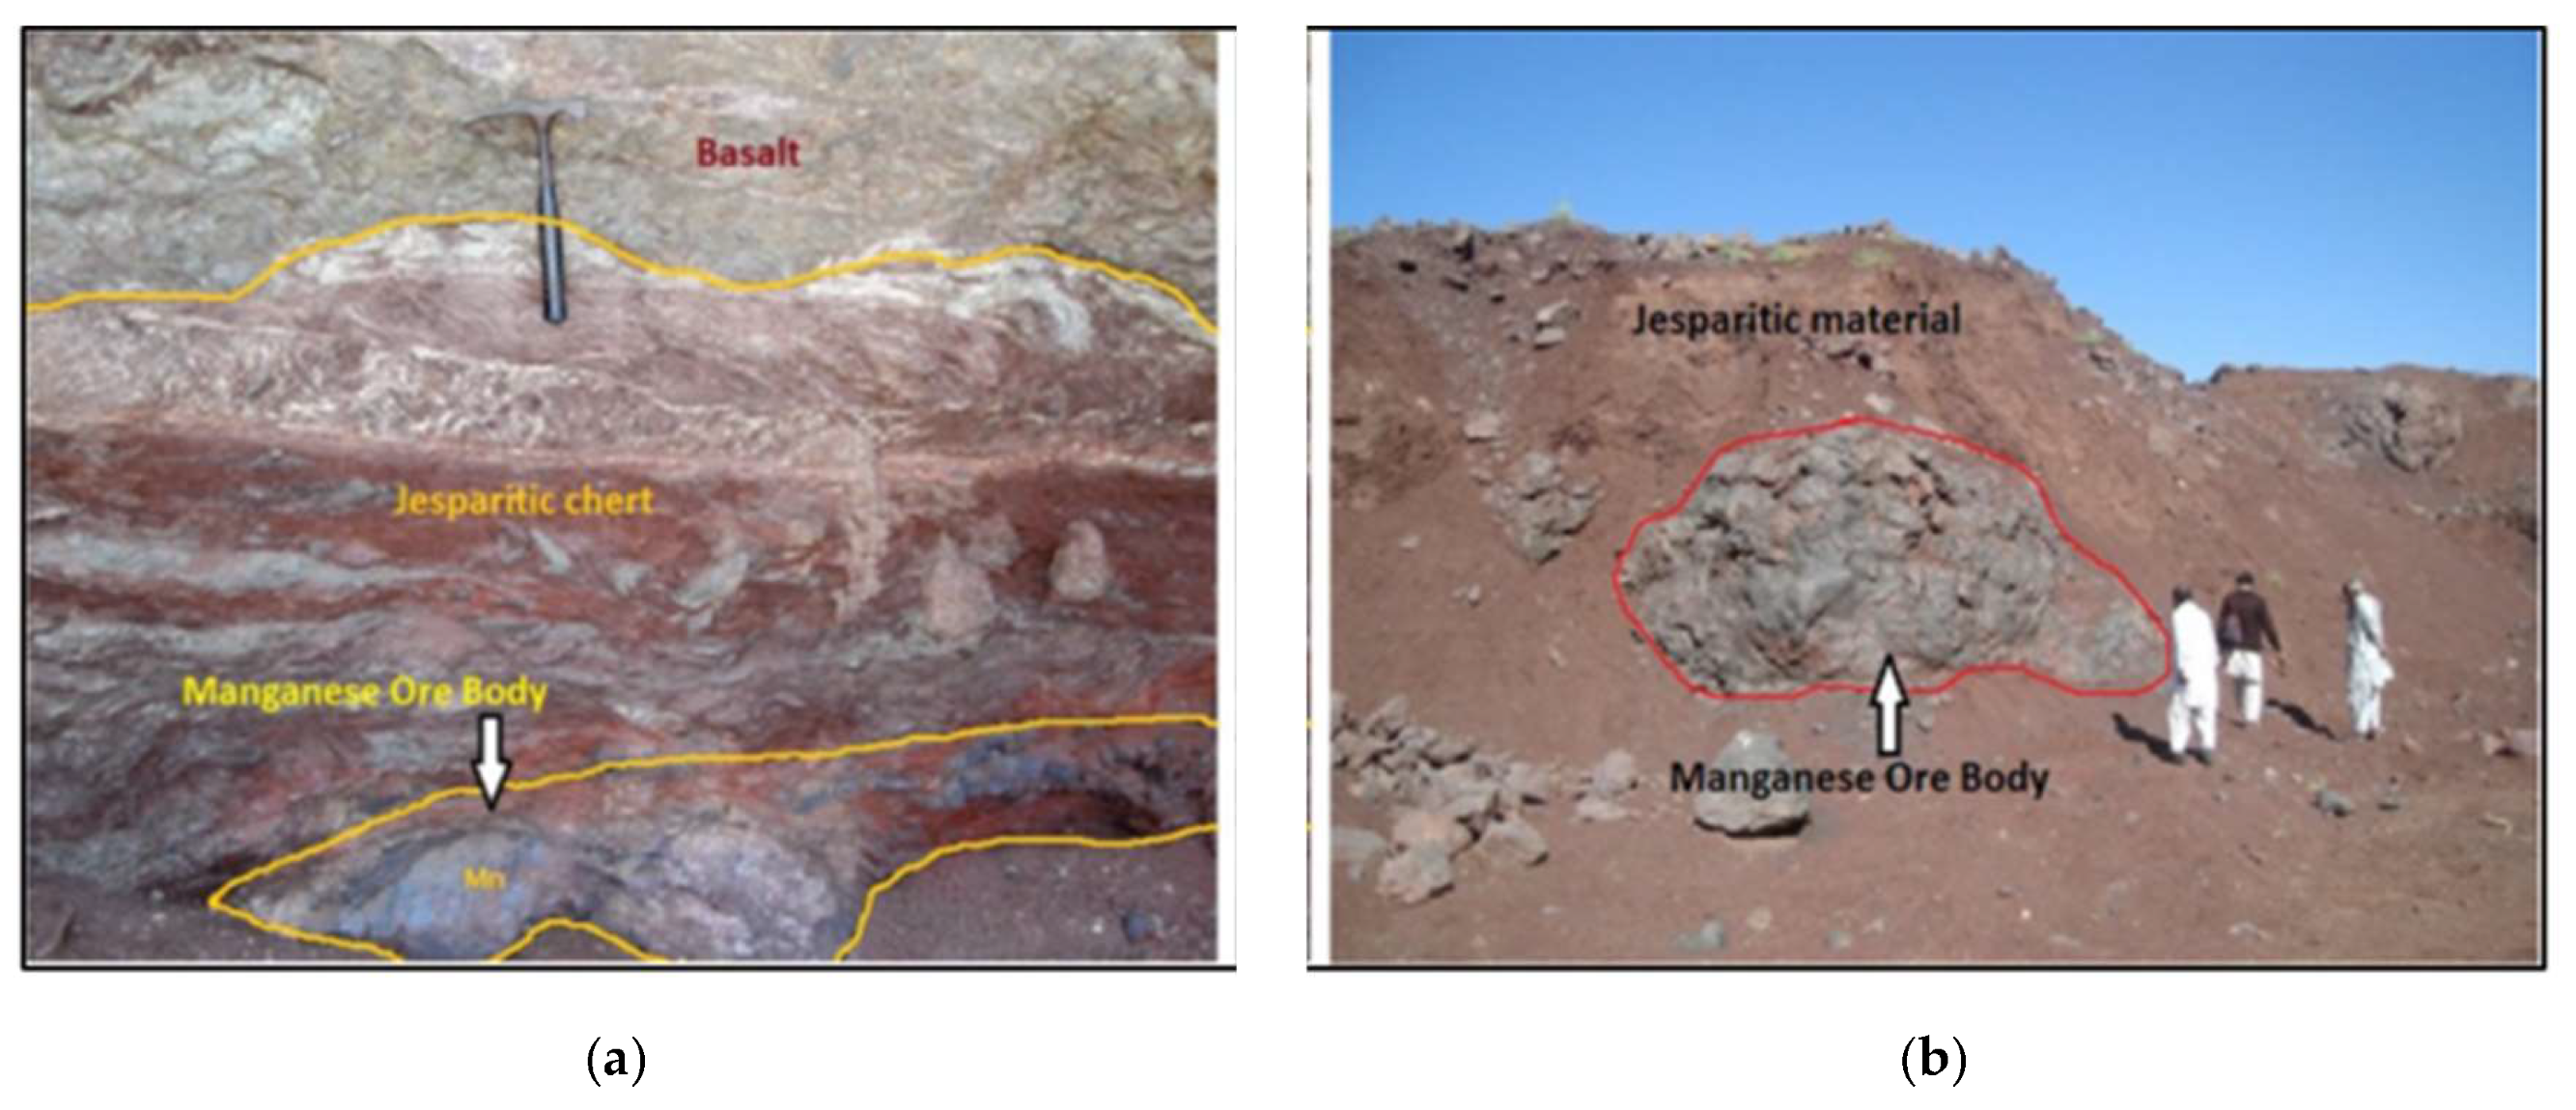
A total of 20 fresh rock samples were collected from accessible and exposed ophiolitic outcrops, representing a variety of lithologies including mafic, ultramafic, and sedimentary units. Particular attention was given to locations exhibiting manganese mineralization. Representative outcrop samples of Mn ore bodies are shown in Figure 12.
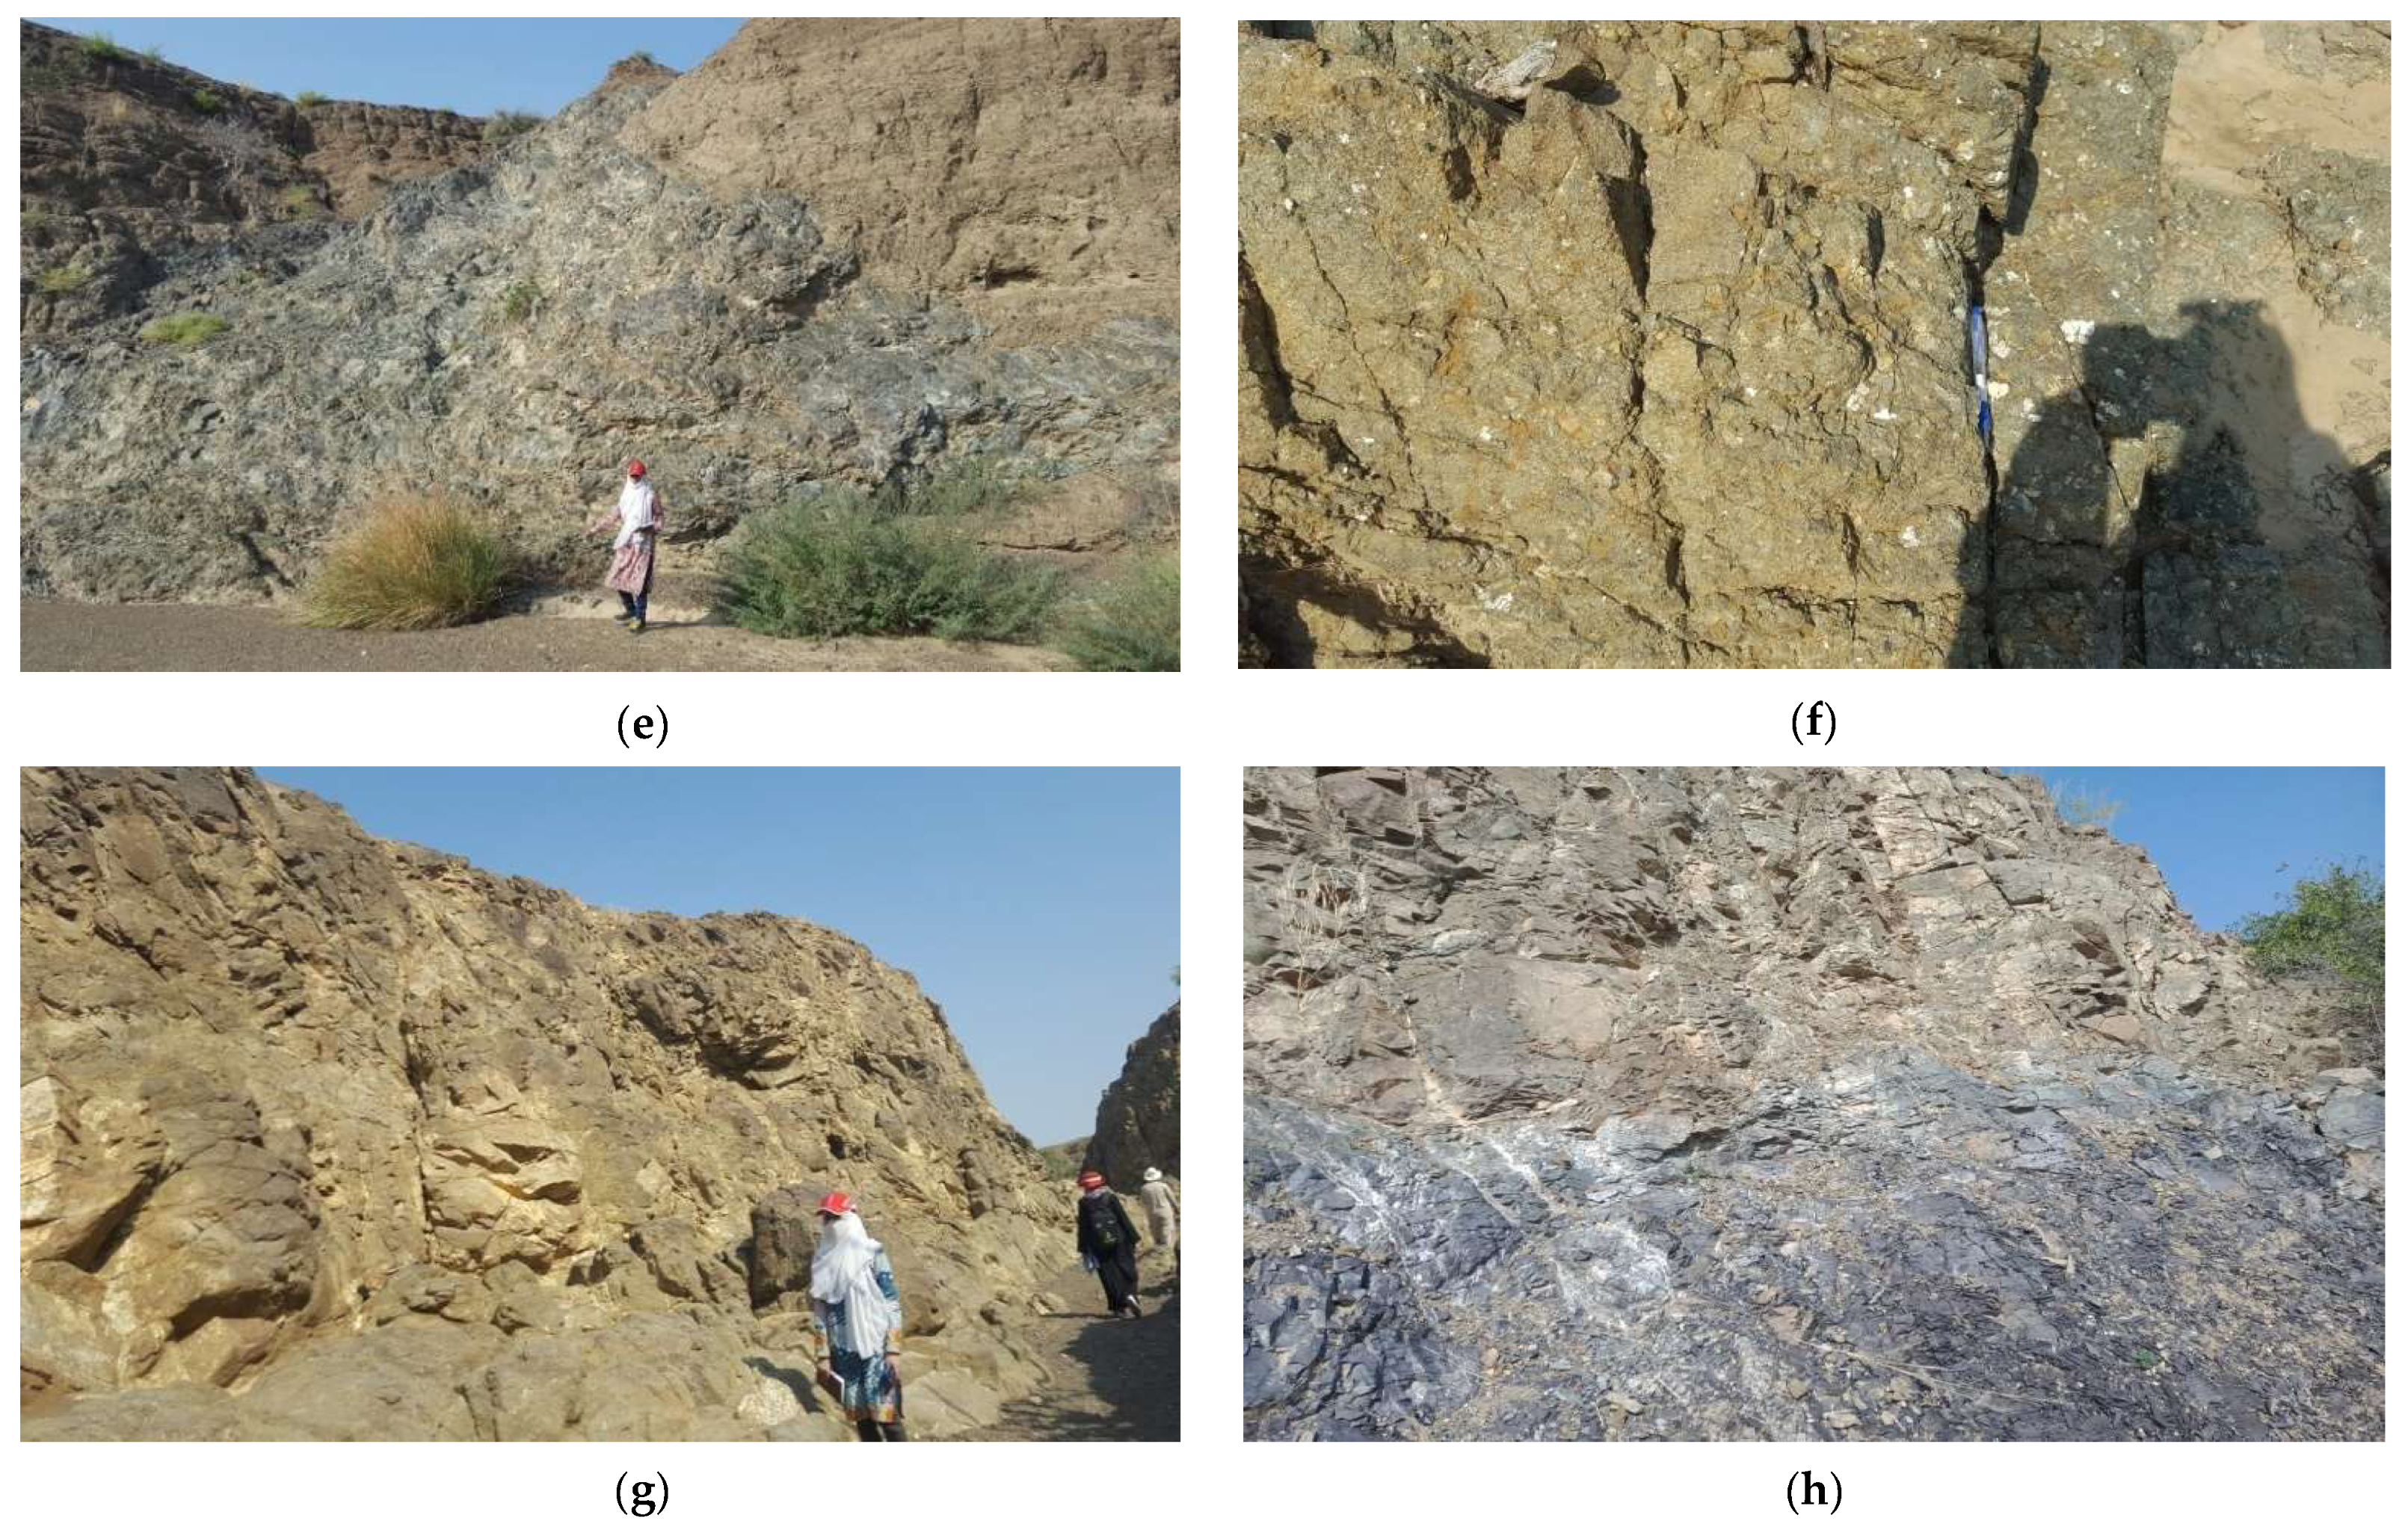
These field-collected samples (Figure 13a–g) were subjected to petrographic analysis in order to corroborate spectral interpretations and refine lithological mapping outputs. The integration of field observations with satellite data provided a robust validation framework, enhancing the accuracy and geological relevance of the remote sensing results.

5. Discussion

This study highlights the strong potential of ASTER and Hyperion satellite datasets for lithological mapping and the detection of chromite-associated manganese mineralization in the ophiolitic complex of Lasbela, Balochistan. ASTER multispectral data, particularly through combinations such as bands 3, 6, 7 and 3, 7, 9 identified through high Optimum Index Factor (OIF) values, enabled clear spectral separation of lithologies, including serpentinized ultramafics, diabase, basalt, and gabbro. Notably, these techniques facilitated the detection of lithological units that may have been underrepresented in earlier geological surveys, suggesting previously unmapped compositional diversity in the study area. PCA further enhanced boundary delineation and helped highlight subtle fault structures, often obscured by the region’s rugged topography.
This methodological framework builds on an established foundation of remote sensing applications in geological mapping. Prior work has demonstrated the efficacy of band ratio techniques [54,68,69,70,71,72,73,74] and false color composites [74] in mapping ophiolitic terrains. Specific band ratios such as 4/7, 4/6, 4/10 [69]; 4/1, 2/3, 4/3 [54]; and 5/7, 5/4, 3/1 [75] have proven successful in distinguishing ultramafic rock types. Composite indices like (2 + 4)/3 and (7 + 9)/8 [56] also offer enhanced discrimination. In the present study, combinations such as (4/1, 4/5, 4/7), (5/3, 5/1, 7/5), and (4/7, 4/1, 4/3) were found to be well suited to the spectral characteristics of the Lasbela Ophiolite.
To support and validate the ASTER-based lithological interpretations, petrographic analysis was performed on representative rock samples, including diabase gabbro, ultramafic units, and pillow basalts. The primary objective was to confirm mineralogical composition and assess the degree of alteration and serpentinization within ultramafic rocks. Thin-section analyses were conducted under polarized light microscopy. In diabase gabbro samples, textures such as ophitic to sub-ophitic intergrowths of pyroxenes and plagioclase were observed, along with accessory opaque minerals including magnetite and ilmenite. The ultramafic samples revealed evidence of serpentinization, including characteristic mesh and bastite textures, suggesting alteration of olivine and orthopyroxene, respectively. Dominant secondary minerals such as antigorite were identified, with occasional relics of primary phases. Pillow basalts were found to be fine-grained and altered, with plagioclase laths and clinopyroxenes variably affected by uralitization. These petrographic observations were consistent with the lithological units interpreted from ASTER-based image processing, particularly in differentiating altered ultramafics from other mafic rocks. The petrographic data thus provided a critical line of validation, aligning with the spectral classifications and confirming the presence and alteration state of the major rock types mapped through remote sensing.
Hyperion’s hyperspectral capabilities, especially when processed using Hyperspectral Material Identification (HMI) tools and SAM classification, proved highly effective in recognizing manganese-bearing minerals. The implementation of advanced image processing techniques, including band combinations and SAM, allowed for effective discrimination of mafic and ultramafic lithologies, identification of structural trends, and detection of manganese-rich zones, particularly those characterized by psilomelane occurrences.
Field validation further confirmed the presence of psilomelane, braunite, and jasperitic chert. The consistent association of jasperitic chert with manganese suggests a genetic link to hydrothermal mineralization, aligning with patterns observed in other ophiolitic environments. From a mineralogical perspective, the observed transformation of braunite to psilomelane supports a hydrothermal paragenetic sequence, indicative of evolving geochemical and thermal conditions. Combining geochemical and spectral data to trace these transformations may enable differentiation between hydrothermal and supergene manganese phases, offering more refined mineral resource assessments.
These results are consistent with multiple regional and international case studies [23,24,25,72,76,77,78,79], reaffirming the utility of ASTER data for mapping lithologies associated with chromite and platinum group element (PGE) mineralization. This underscores the broader applicability of the approach for underexplored ophiolitic zones, such as those in Balochistan.
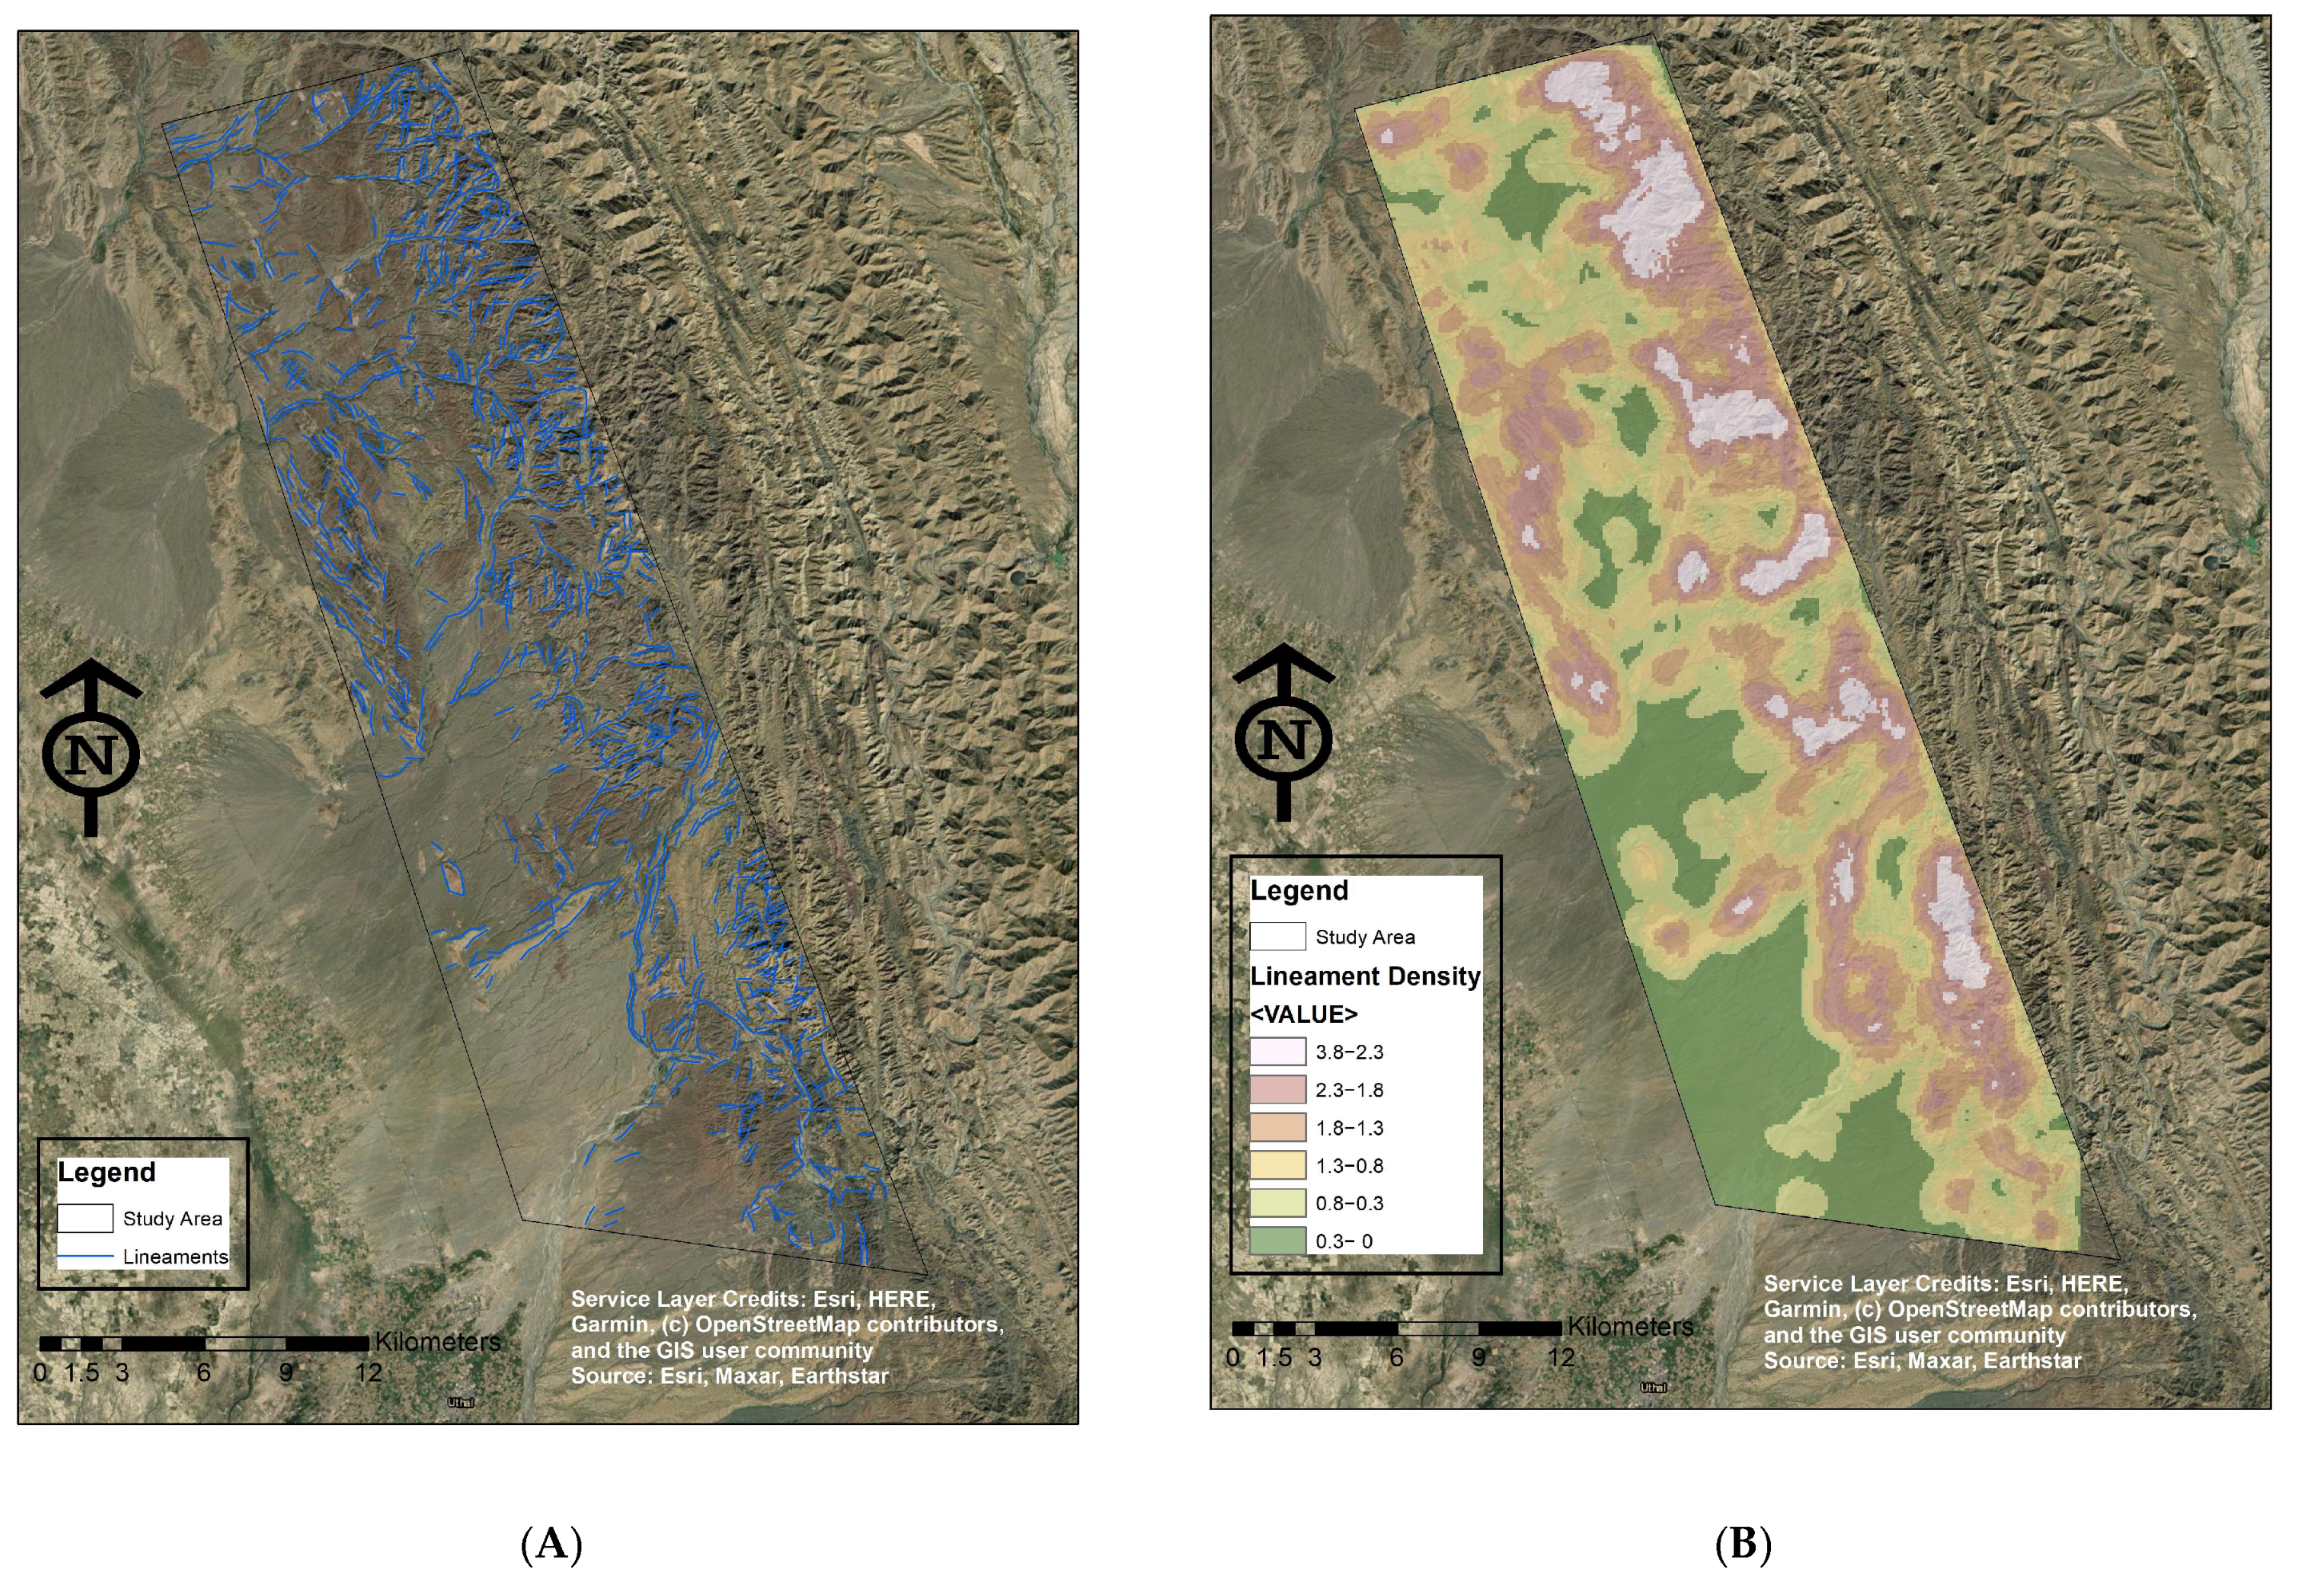
While the integration of remote sensing and field validation has yielded promising results, future enhancements could be achieved by incorporating high-resolution structural data into the analysis. Techniques demonstrated [79,80,81] suggest that Digital Elevation Models (DEMs), such as those from ALOS PALSAR, could be used. The lineament and lineament density maps of the study area are shown in Figure 14. Our method could significantly refine the interpretation of lineaments and structurally controlled mineralization patterns. Given the tectonic complexity of ophiolitic terrains, this enhancement would aid in identifying fault-associated mineral deposits with higher confidence.
Another promising direction involves applying an Analytic Hierarchy Process (AHP)-based mineral potential modeling framework. AHP integrates spectral, lithological, structural, and ground-truth data in a systematic spatial decision-making process. Its successful application in chromite exploration suggests it may also be valuable for manganese mineral targeting in similar geological environments.
As manganese grows in strategic importance, particularly for battery technologies and clean energy applications, understanding its mineralization in the Bela Ophiolite Complex holds both scientific and economic relevance. The integrated remote sensing and ground validation approach presented here offers a robust and cost-effective model for mineral exploration in challenging and geologically diverse terrains.
Overall, the combined use of ASTER and Hyperion data, advanced image processing, and field validation demonstrates a comprehensive framework for lithological and mineral mapping in ophiolitic contexts. While ASTER data provided the regional lithological context due to its spatial resolution, Hyperion data offered valuable mineral-specific insights, especially for manganese-bearing minerals like psilomelane and braunite. Hyperion’s high spectral resolution enabled detection of subtle mineralogical differences that ASTER could not capture, thus providing complementary value. Incorporating high-resolution structural datasets and decision support systems like AHP can further strengthen predictive models and reduce exploration uncertainty. This flexible and scalable methodology holds significant promise for deployment across the broader Tethyan orogenic belt and other underexplored metallogenic provinces worldwide.
6. Conclusions

This study confirms the utility of integrating ASTER and Hyperion satellite imagery with advanced image processing techniques for lithological mapping and mineral exploration in the Bela Ophiolite Complex of Lasbela, Balochistan. The application of ASTER multispectral data using band ratios and SAM enabled effective differentiation of lithological units. Notably, the identification of previously undocumented gabbroic and basaltic formations underscores the potential of ASTER data to enhance geological interpretation in structurally complex ophiolitic terrains. Hyperion hyperspectral imagery, processed through the Spectral Hourglass Workflow and Material Identification tools, proved particularly effective in mapping manganese mineralization. The detection of psilomelane and braunite hosted within jasperitic cherts, validated through field surveys and petrographic analysis, supports a hydrothermal genesis for manganese in the study area. The integrated methodology presented here, combining satellite-based remote sensing with ground truthing, offers a cost-efficient and scalable model for geological investigations in remote or logistically challenging regions. The approach not only improves lithological resolution but also facilitates targeted mineral exploration, particularly for strategic minerals like manganese.
Future research should consider the incorporation of high-resolution structural data, such as Digital Elevation Models (DEMs), to enable lineament and fault-controlled mineralization analysis. Expanding this methodology to include spatial modeling frameworks could further refine exploration strategies. The workflow developed in this study serves as a replicable model for application in other underexplored ophiolitic belts across Pakistan and similar tectonic settings globally.

Author Contributions

Conceptualization, S.K. and Z.K.R.; methodology, S.K.; software, S.K.; validation, S.K., A.F., and A.A.; formal analysis, K.R.; writing—original draft preparation, S.K.; writing—review and editing, A.B.P. and K.R.; visualization, S.K.; supervision, Z.K.R. All authors have read and agreed to the published version of the manuscript.

Funding

This research received no external funding.

Data Availability Statement

Data are contained within the article.

Acknowledgments

We express our profound gratitude to the Geological Survey of Pakistan, Ministry of Energy, Petroleum Division, Karachi, Pakistan, for supporting the study. We are thankful to the Universiti Malaysia Terengganu for providing the facilities for editing the manuscript.

Conflicts of Interest

The authors declare no conflicts of interest.

References

  1. Zaigham, N.A.; Mallick, K.A. Bela ophiolite zone of southern Pakistan: Tectonic setting and associated mineral deposits. GSA Bull. 2000, 112, 478–489. [Google Scholar] [CrossRef]
  2. Hart, M.B.; Batenburg, S.J.; Huber, B.T.; Price, G.D.; Thibault, N.; Wagreich, M.; Walaszczyk, I.P. Introduction to the Cretaceous System: Regional studies. Geol. Soc. Lond. Spec. Publ. 2025, 545, 1–12. [Google Scholar] [CrossRef]
  3. Bender, F. The Geology of Pakistan; Gebrueder Borntraeger: Berlin, Germany, 1980. [Google Scholar]
  4. Kakar, M.I.; Kerr, A.C.; Mahmood, K.; Collins, A.S.; Khan, M.; McDonald, I. Supra-subduction zone tectonic setting of the Muslim Bagh Ophiolite, northwestern Pakistan: Insights from geochemistry and petrology. Lithos 2014, 202, 190–206. [Google Scholar] [CrossRef]
  5. Siddiqui, S.F.; Baloch, N.M. Application of Remote Sensing and GIS in Geological Mapping of Bela Ophiolite, Pakistan. Sindh Univ. Res. J. (Sci. Ser.) 2018, 50, 115–122. [Google Scholar]
  6. Narejo, A.A.; Shar, A.M.; Fatima, N.; Sohail, K. Geochemistry and origin of Mn deposits in the Bela ophiolite complex, Balochistan, Pakistan. J. Pet. Explor. Prod. Technol. 2019, 9, 2543–2554. [Google Scholar] [CrossRef]
  7. Zaidi, S.I.A.; Ahsan, N.; Rehman, S.U. Geochemical attributes of Pliocene Dhok Pathan Formation, Eastern Sulaiman Fold and Thrust Belt, Pakistan: Implications for provenance, paleoenvironmental, and tectonic settings. Arab. J. Geosci. 2021, 14, 2252. [Google Scholar] [CrossRef]
  8. Canada, P.I.O.M. Aeromagnetic Interpretation of Khuzdar Bela Region Balochistan Pakistan; Geological Survey of Pakistan, Ministry of Petroleum and Natural Resources: Quetta, Pakistan; Photosur Inc.: Montreal, QC, Canada, 1981. [Google Scholar]
  9. Rashid, M.U.; Ahmed, W.; Waseem, M.; Zamin, B.; Ahmad, M.; Sabri, M.M.S. Metallic-Mineral Prospecting Using Integrated Geophysical and Geochemical Techniques: A Case Study from the Bela Ophiolitic Complex, Baluchistan, Pakistan. Minerals 2022, 12, 825. [Google Scholar] [CrossRef]
  10. Article, J.; Bashir, E.; Naseem, S.; Kaleem, M.; Khan, Y.; Hamza, S. Study of serpentinized ultramafic rocks of Bela Ophiolite, Balochistan, Pakistan. J. Geogr. Geol. 2012, 4, 79–89. [Google Scholar] [CrossRef]
  11. Furnes, H.; Dilek, Y.; Zhao, G.; Safonova, I.; Santosh, M. Geochemical characterization of ophiolites in the Alpine-Himalayan Orogenic Belt: Magmatically and tectonically diverse evolution of the Mesozoic Neotethyan oceanic crust. Earth-Sci. Rev. 2020, 208, 103258. [Google Scholar] [CrossRef]
  12. Casey, J.F.; Dewey, J.F. Initiation of subduction zones along transform and accreting plate boundaries, triple-junction evolution, and forearc spreading centres—Implications for ophiolitic geology and obduction. Geol. Soc. Spec. Publ. 1984, 13, 269–290. [Google Scholar] [CrossRef]
  13. Qasim, M.; Khan, S.D.; Haider, R.; Rasheed, M.U. Integration of Multispectral and Hyperspectral Remote Sensing Data for Lithological Mapping in Zhob Ophiolite, Western Pakistan. Arab. J. Geosci. 2022, 15, 599. [Google Scholar] [CrossRef]
  14. Jalil, R.; Alard, O.; Schaefer, B.; Ali, L.; Sajid, M.; Khedr, M.Z.; Shah, M.T.; Anjum, M.N. Geochemistry of Waziristan Ophiolite Complex, Pakistan: Implications for Petrogenesis and Tectonic Setting. Minerals 2023, 13, 311. [Google Scholar] [CrossRef]
  15. Yao, F.; Liu, S.; Wang, D.; Geng, X.; Wang, C.; Jiang, N.; Wang, Y. Review on the development of multi- and hyperspectral remote sensing technology for exploration of copper–gold deposits. Ore Geol. Rev. 2023, 162, 105732. [Google Scholar] [CrossRef]
  16. Rani, K. Mineral Exploration Using Remote Sensing. In Remote Sensing for Geophysicists; CRC Press: Boca Raton, FL, USA, 2025; pp. 79–94. [Google Scholar]
  17. Habashi, J.; Mohammady Oskouei, M.; Jamshid Moghadam, H.; Beiranvand Pour, A. Optimizing alteration mineral detection: A fusion of multispectral and hyperspectral remote sensing techniques in the Sar-e-Chah-e Shur, Iran. Remote Sens. Appl. Soc. Environ. 2024, 35, 101249. [Google Scholar] [CrossRef]
  18. Pour, A.B.; Park, Y.; Crispini, L.; Läufer, A.; Kuk Hong, J.; Park, T.Y.S.; Zoheir, B.; Pradhan, B.; Muslim, A.M.; Hossain, M.S.; et al. Mapping listvenite occurrences in the damage zones of Northern Victoria Land, Antarctica using ASTER satellite remote sensing data. Remote Sens. 2019, 11, 1408. [Google Scholar] [CrossRef]
  19. Pour, A.B.; Sekandari, M.; Rahmani, O.; Crispini, L.; Läufer, A.; Park, Y.; Hong, J.K.; Pradhan, B.; Hashim, M.; Hossain, M.S.; et al. Identification of Phyllosilicates in the Antarctic Environment Using ASTER Satellite Data: Case Study from the Mesa Range, Campbell and Priestley Glaciers, Northern Victoria Land. Remote Sens. 2020, 13, 38. [Google Scholar] [CrossRef]
  20. Riaz, K.; Pour, A.B. Advancing Planetary Sustainability Through Lithological Mapping: ASTER Remote Sensing in Antarctica’s Dry Valleys. Planet. Sustain. 2025, 3, 6–19. [Google Scholar] [CrossRef]
  21. Alarifi, S.S.; Abdelkareem, M.; Abdalla, F.; Abdelsadek, I.S.; Gahlan, H.; Al-Saleh, A.M.; Alotaibi, M. Fusion of Multispectral Remote-Sensing Data through GIS-Based Overlay Method for Revealing Potential Areas of Hydrothermal Mineral Resources. Minerals 2022, 12, 1577. [Google Scholar] [CrossRef]
  22. Mohamed Taha, A.M.; Xi, Y.; He, Q.; Hu, A.; Wang, S.; Liu, X. Investigating the Capabilities of Various Multispectral Remote Sensors Data to Map Mineral Prospectivity Based on Random Forest Predictive Model: A Case Study for Gold Deposits in Hamissana Area, NE Sudan. Minerals 2023, 13, 49. [Google Scholar] [CrossRef]
  23. Ahmadi, H.; Hussaini, M.R.; Yousufi, A.; Bekbotayeva, A.; Baisalova, A.; Amralinova, B.; Mataibayeva, I.; Rahmani, A.B.; Pekkan, E.; Sahak, N. Geospatial Insights into Ophiolitic Complexes in the Cimmerian Realm of the Afghan Central Block (Middle Afghanistan). Minerals 2023, 13, 1453. [Google Scholar] [CrossRef]
  24. Yousufi, A.; Ahmadi, H.; Bekbotayeva, A.; Arshamov, Y.; Baisalova, A.; Omarova, G.; Pekkan, E. Integration of Remote Sensing and Field Data in Ophiolite Investigations: A Case Study of Logar Ophiolite Complex, SE Afghanistan. Minerals 2023, 13, 234. [Google Scholar] [CrossRef]
  25. Monisha, M.; Muthukumar, M.; Rajesh, V.J. Analysis of Devanur and Manamedu Ophiolite Complexes in SGT, India: A detailed examination employing remote sensing techniques and Laboratory Spectral Signature investigations. Remote Sens. Appl. Soc. Environ. 2024, 36, 101294. [Google Scholar] [CrossRef]
  26. Singh, S.; Martha, T.R.; Das, I.C.; Sreenivas, K.; Chauhan, P. Comparison of Airborne and Spaceborne Hyperspectral Data for Lithological Discrimination Within the Eastern Dharwar Craton. J. Indian Soc. Remote Sens. 2025, 1–16. [Google Scholar] [CrossRef]
  27. Wang, X.; Liu, J.; Chi, W.; Wang, W.; Ni, Y. Advances in Hyperspectral Image Classification Methods with Small Samples: A Review. Remote Sens. 2023, 15, 3795. [Google Scholar] [CrossRef]
  28. Pour, A.B.; Hashim, M. Evaluation of Earth Observing-1 (EO1) Data for Lithological and Hydrothermal Alteration Mapping: A Case Study from Urumieh-Dokhtar Volcanic Belt, SE Iran. J. Indian Soc. Remote Sens. 2015, 43, 537–549. [Google Scholar] [CrossRef]
  29. Kazmi, A.H.; Rana, R.A. Tectonic Map of Pakistan; Geological Survey of Pakistan: Quetta, Pakistan, 1982. [Google Scholar]
  30. Khan, A. Structural styles and hydrocarbon potential of western Kirthar Fold Belt. In Proceedings of the PAPG/SPE Annual Technical Conference, Islamabad, Pakistan, 22–23 November 2011. [Google Scholar]
  31. Maldonado, F.; Mengal, J.M.; Khan, S.H.; Warwick, P.D. Summary of the stratigraphy and structural elements related to plate convergence of the Quetta-Muslim Bagh-Sibi region, Balochistan, west-central Pakistan. In U.S. Geological Survey Open-File Report; U.S. Geological Survey: Reston, VA, USA, 2011; p. 19. [Google Scholar]
  32. Szeliga, W.; Bilham, R.; Kakar, D.M.; Lodi, S.H. Interseismic strain accumulation along the western boundary of the Indian subcontinent. J. Geophys. Res. Solid Earth 2012, 117, B08404. [Google Scholar] [CrossRef]
  33. Jouanne, F.; Pousse-Beltran, L.; Doin, M.P.; Bascou, P.; Thollard, F.; Ahmed, A. Current tectonic deformation of the Sulaiman range (Pakistan) with InSAR. Geophys. J. Int. 2025, 240, 2060–2075. [Google Scholar] [CrossRef]
  34. Khan, M.E.; Khan, M.J.; Mahmood, K.H.; Kakar, M.I. Geology and petrology of crustal section of Bela Ophiolite, Balochistan, Pakistan. Bahria Univ. Res. J. Earth Sci. 2018, 3. [Google Scholar]
  35. Dini, A.; Rielli, A.; Di Giuseppe, P.; Ruggieri, G.; Boschi, C. The Ophiolite-Hosted Cu-Zn VMS Deposits of Tuscany (Italy). Minerals 2024, 14, 273. [Google Scholar] [CrossRef]
  36. Miki, Y.; Takazawa, E.; Ueki, K.; Kuwatani, T. Variable upper mantle geochemical processes constrained from independent component analysis of the Fizh massif, northern Oman ophiolite. Geochem. Geophys. Geosyst. 2025, 26, e2024GC012134. [Google Scholar] [CrossRef]
  37. Sarwar, G.; Qureshi, M.J.; Zaidi, M.A.; Ahsan, S.N. Geological Map of the Study Area; Geological Survey of Pakistan: Quetta, Pakistan, 1980. [Google Scholar]
  38. Abrams, M. The Advanced Spaceborne Thermal Emission and Reflection Radiometer (ASTER): Data products for the high spatial resolution imager on NASA’s Terra platform. Int. J. Remote Sens. 2000, 21, 847–859. [Google Scholar] [CrossRef]
  39. Fujisada, H.; Ono, A. Observational performance of ASTER instrument on EOS-AM1 spacecraft. Adv. Space Res. 1994, 14, 147–150. [Google Scholar] [CrossRef]
  40. Yamaguchi, Y.; Fujisada, H.; Kahle, A.B.; Tsu, H.; Kato, M.; Watanabe, H.; Sato, I.; Kudoh, M. ASTER Instrument Performance, Operation Status, and Application to Earth Sciences; IEEE: New York, NY, USA, 2001; Volume 3, pp. 1215–1216. [Google Scholar]
  41. Bishop, J.G.; Liu, J.; Mason, P.J. Hyperspectral remote sensing for mineral exploration in Pulang, Yunnan province, China. Int. J. Remote Sens. 2011, 32, 2409–2426. [Google Scholar] [CrossRef]
  42. Attallah, Y.; Zigh, E.; Adda, A. Optimized 3D-2D CNN for automatic mineral classification in hyperspectral images. Rep. Geod. Geoinformatics 2024, 118, 82–91. [Google Scholar] [CrossRef]
  43. Goodenough, D.G.; Dyk, A.; Niemann, K.O.; Pearlman, J.S.; Chen, H.; Han, T.; Murdoch, M.; West, C. Processing Hyperion and ALI for Forest Classification. IEEE Trans. Geosci. Remote Sens. 2003, 41, 1321–1331. [Google Scholar] [CrossRef]
  44. Rani, N.; Mandla, V.R.; Singh, T. Evaluation of Atmospheric Corrections on Hyperspectral Data with Special Reference to Mineral Mapping. Geosci. Front. 2017, 8, 797–808. [Google Scholar] [CrossRef]
  45. Chavez, P.S.; Berlin, G.L.; Sowers, L.B. Statistical method for selecting Landsat MSS ratios. J. Appl. Photogr. Eng. 1982, 8, 23–30. [Google Scholar]
  46. Pournamdari, M.; Hashim, M. Detection of Chromite Bearing Mineralized Zones in Abdasht Ophiolite Complex Using ASTER and ETM+ Remote Sensing Data. Arab. J. Geosci. 2013, 7, 1973–1983. [Google Scholar] [CrossRef]
  47. Hashim, M.; Pournamdary, M.; Pour, A.B. Processing and interpretation of advanced space-borne thermal emission and reflection radiometer (ASTER) data for lithological mapping in ophiolite complex. Int. J. Phys. Sci. 2011, 6, 6410–6421. [Google Scholar] [CrossRef]
  48. Madani, A.; Emam, A.A. SWIR ASTER band ratios for lithological mapping and mineral exploration: A case study from El Hudi area, southeastern desert. Arab. J. Geosci. 2011, 4, 45–52. [Google Scholar] [CrossRef]
  49. Rowan, L.C.; Mars, J.C.; Simpson, C.J. Lithologic Mapping of the Mordor, NT, Australia Ultramafic Complex by Using the Advanced Spaceborne Thermal Emission and Reflection Radiometer (ASTER). Remote Sens. Environ. 2005, 99, 105–126. [Google Scholar] [CrossRef]
  50. Pour, A.B.; Park, Y.; Park, T.Y.S.; Hong, J.K.; Hashim, M.; Woo, J.; Ayoobi, I. Regional Geology Mapping Using Satellite-Based Remote Sensing Approach in Northern Victoria Land, Antarctica. Polar Sci. 2018, 16, 23–46. [Google Scholar] [CrossRef]
  51. Askari, G.; Pour, A.B.; Pradhan, B.; Sarfi, M.; Nazemnejad, F. Band Ratios Matrix Transformation (BRMT): A Sedimentary Lithology Mapping Approach Using ASTER Satellite Sensor. Sensors 2018, 18, 3213. [Google Scholar] [CrossRef] [PubMed]
  52. Abdoulatif, A.; Saley, M.; Mohamed, M. Mapping of Hydrothermal Alteration Minerals Related to Tongue Tonguey (Sirba, Niger) Gold Mineralization Using Landsat 8 OLI Data and Remote Sensing. Asian J. Phys. Chem. Sci. 2025, 13, 1–14. [Google Scholar] [CrossRef]
  53. Okada, K.; Ishii, M. Mineral and lithological mapping using thermal infrared remotely sensed data from ASTER simulator. In Proceedings of the International Geosciences and Remote Sensing Symposium (IGARSS): Better Understanding Earth Environment, Tokyo, Japan, 18–21 August 1993; pp. 126–128. [Google Scholar]
  54. Abdeen, M.; Allison, T.K.; Abdelsalam, M.G.; Stern, R.J. Application of ASTER band-ratio images for geological mapping in arid regions; The Neoproterozoic Allaqi Suture. Egypt. Geol. Soc. Am. 2001, 33, 289. [Google Scholar]
  55. Pour, A.B.; Hashim, M. ASTER, ALI and Hyperion sensors data for lithological mapping and ore minerals exploration. SpringerPlus 2014, 3, 130. [Google Scholar] [CrossRef]
  56. Amer, R.; Kusky, T.; Ghulam, A. Lithological mapping in the Central Eastern Desert of Egypt using ASTER data. J. Afr. Earth Sci. 2010, 56, 75–82. [Google Scholar] [CrossRef]
  57. Çörtük, R.M.; Çelik, Ö.F.; Alkan, A.; Özkan, M.; Özyavaş, A. Distribution of rocks in Pınarbaşı Ophiolite from central Anatolia (Turkey) based on analysis of ASTER and Landsat-8 data. Geol. J. 2020, 55, 6810–6822. [Google Scholar] [CrossRef]
  58. Oppenheimer, C. SABINS, F.F. 1997. Remote Sensing. Principles and Interpretation, 3rd ed. xiii + 494 pp. New York: W. H. Freeman & Co. Geol. Mag. 1998, 135, 143–158. [Google Scholar]
  59. Soliman, N.M.; El-Desoky, H.M.; Heikal, M.A.; Abdel-Rahman, A.M. Using ASTER Images and Field Work Data for Geological Mapping Around Wadi Umm Ashira and Wadi Tilal Al-Qulieb, Northwestern Part of Wadi Allaqi, South Eastern Desert, Egypt. Arab. J. Geosci. 2021, 14, 1826. [Google Scholar] [CrossRef]
  60. El Haous, E.H.; Bouasria, A.; Fekkak, A.; Haissen, F.; Jouhari, A.; Berrada, I. Using long-term bare earth composite image and machine learning in lithological mapping of Adrar Souttouf mafic complex (Oulad Dlim massif, Southern Morocco). Remote Sens. Appl. Soc. Environ. 2025, 38, 101516. [Google Scholar] [CrossRef]
  61. Rashmi, S.; Addamani, S.; Ravikiran, A. Spectral Angle Mapper Algorithm for Remote Sensing Image Classification. Int. J. Innov. Sci. Eng. Technol. (IJISET) 2014, 1, 5481. [Google Scholar]
  62. van der Meer, F.D.; Vazquez-Torres, M.; van Dijk, P.M. Spectral characterization of ophiolite lithologies in the Troodos ophiolite complex of Cyprus and its potential in prospecting for massive sulphide deposits. Int. J. Remote Sens. 1997, 18, 1245–1257. [Google Scholar] [CrossRef]
  63. Kruse, F.A.; Lefkoff, A.B.; Boardman, J.B.; Heidebrecht, H.K.B.; Shapiro, A.T.; Barloon, P.J.; Goetz, A.F.H. The Spectral Image Processing System (SIPS)-interactive visualization and analysis of imaging spectrometer data. Remote Sens. Environ. 1993, 44, 145–163. [Google Scholar] [CrossRef]
  64. Clark, R.N. Spectroscopy of rocks and minerals, and principles of spectroscopy. In Manual of Remote Sensing; Rencz, A.N., Ed.; Wiley and Sons Inc.: New York, NY, USA, 1999; Volume 3, pp. 3–58. [Google Scholar]
  65. Harsanyi, J.C.; Farrand, W.H.; Chang, C.I. Detection of subpixel signatures in hyperspectral image sequences. In Proceedings of the Proceedings of the Annual Meeting of the American Society of Photogrammetry and Remote Sensing, Las Vegas, NV, USA, 25–29 April 1994. [Google Scholar]
  66. Congalton, R.G. A review of assessing the accuracy of classifications of remotely sensed data. Remote Sens. Environ. 1991, 37, 35–46. [Google Scholar] [CrossRef]
  67. Rossiter, D.G. Statistical Methods for Accuracy Assessment of Classified Thematic Maps (Technical Note); International Institute for Geo-information Science & Earth Observation (ITC): Enschede, The Netherlands, 2014. [Google Scholar]
  68. Sultan, M.; Arvidson, R.E.; Sturchio, N.C. Mapping of serpentinites in the Eastern Desert of Egypt by using Landsat thematic mapper data. Geology 1986, 14, 995–999. [Google Scholar] [CrossRef]
  69. Gad, S.; Kusky, T. ASTER Spectral Ratioing for Lithological Mapping in the Arabian-Nubian Shield, the Neoproterozoic Wadi Kid Area, Sinai, Egypt. Gondwana Res. 2007, 11, 326–335. [Google Scholar] [CrossRef]
  70. Kusky, T.M.; Ramadan, T.M. Structural controls on Neoproterozoic mineralization in the South Eastern Desert, Egypt: An integrated field, Landsat TM, and SIR-C/X SAR approach. J. Afr. Earth Sci. 2002, 35, 107–121. [Google Scholar] [CrossRef]
  71. Abdelaziz, R.; Abd El-Rahman, Y.; Wilhelm, S. Landsat-8 data for chromite prospecting in the Logar Massif, Afghanistan. Heliyon 2018, 4, e00542. [Google Scholar] [CrossRef]
  72. Ge, W.; Cheng, Q.; Jing, L.; Armenakis, C.; Ding, H. Lithological discrimination using ASTER and Sentinel-2A in the Shibanjing ophiolite complex of Beishan orogenic in Inner Mongolia, China. Adv. Space Res. 2018, 62, 1702–1716. [Google Scholar] [CrossRef]
  73. Qaoud, N. Utilization of Space-Borne Imagery for Lithologic Mapping: A Case Study from Um Had Area, Central Eastern Desert. Egypt. J. Geogr. Geol. 2014, 6, 113–123. [Google Scholar] [CrossRef]
  74. Yang, W.; Zheng, Y.; Chen, S.; Duan, X.; Zhou, Y.; Xu, X. Chromite-Bearing Peridotite Identification, Based on Spectral Analysis and Machine Learning: A Case Study of the Luobusa Area, Tibet, China. Appl. Sci. 2023, 13, 9325. [Google Scholar] [CrossRef]
  75. Mia, B.; Fujimitsu, Y. Mapping hydrothermal altered mineral deposits using Landsat 7 ETM+ image in and around Kuju volcano, Kyushu, Japan. J. Earth Syst. Sci. 2012, 121, 1049–1058. [Google Scholar] [CrossRef]
  76. Zhang, R.; Zeng, M. Mapping Lithologic Components of Ophiolitic Mélanges Based on ASTER Spectral Analysis: A Case Study from the Bangong-Nujiang Suture Zone (Tibet, China). ISPRS Int. J. Geo-Inf. 2018, 7, 34. [Google Scholar] [CrossRef]
  77. Seleem, T.; Hamimi, Z.; Zaky, K.; Zoheir, B. ASTER Mapping and Geochemical Analysis of Chromitite Bodies in the Abu Dahr Ophiolites, South Eastern Desert Egypt. Arab. J. Geosci. 2020, 13, 731. [Google Scholar] [CrossRef]
  78. Abd El-Raouf, A.; Dogru, F.; Bilici, Ö.; Azab, I.; Tasci, S.; Jiang, L.; Abdelrahman, K.; Fnais, M.; Amer, O. Combining Remote Sensing Data and Geochemical Properties of Ultramafics to Explore Chromite Ore Deposits in East Oltu Erzurum, Turkey. Minerals 2024, 14, 1116. [Google Scholar] [CrossRef]
  79. Nabatian, G.; Songjian, A.; Pour, A.B.; Abdollahi, F.; Habashi, J. Integration of ASTER imagery and field data for chromite exploration in the Eastern Khoy Ophiolite Complex, NW Iran. Earth Sci. Inform. 2025, 18, 245. [Google Scholar] [CrossRef]
  80. El-Desoky, H.; Shebl, A.; El-Awny, H.; El-Rahmany, M.; Soliman, O. Detecting oxides mineralization utilizing remote sensing and comprehensive mineralogical analysis: A case study around Mikbi-Zayatit District, South Eastern Desert, Egypt. Iraqi Geol. J. 2023, 56, 97–130. [Google Scholar] [CrossRef]
  81. Singh, S.; Sarkar, S.K.; Manche, S.; Guha, A.; Vinod Kumar, K. Earth observation approach for targeting stratiform deposit of manganese in central India. Adv. Space Res. 2023, 72, 1094–1108. [Google Scholar] [CrossRef]
Figure 1. Geological map of study area [37].
Mining 05 00053 g001
Figure 2. Workflow of data processing and analysis (prepared by the authors) using ASTER, Hyperion, and field data for ophiolite/lithology mapping.
Mining 05 00053 g002
Figure 3. ASTER RGB 3, 6, 7 OIF high-rank color composite combination.
Mining 05 00053 g003
Figure 4. ASTER band ratio composite (1/4, 4/9, 9/1 in RGB) displaying enhanced lithological contrast for mapping mafic and ultramafic rocks in the Bela Ophiolite. Gabbros appear in red, basalts in yellow-green, and serpentinites in reddish-yellow.
Mining 05 00053 g004
Figure 5. ASTER RGB composite image using Principal Components PC4 (Red), PC3 (Green), and PC1 (Blue). These components were selected for their ability to enhance lithological contrast, particularly for ultramafic and manganese-bearing units. PC2 was excluded due to its low geological discrimination in this area.
Mining 05 00053 g005
Figure 6. Lithological classification map derived using Spectral Angle Mapper (SAM) on ASTER imagery, showing distribution of serpentinized ultramafic rocks, jasperitic cherts, and mafic units in the southern Bela Ophiolite region.
Mining 05 00053 g006
Figure 7. Microphotographs illustrating the ophiolitic lithologies under polarized light. (a) Bastite texture in serpentine. (b) Mesh texture in serpentine. (c) Skeletal grains of magnetite in serpentine. (d) Orthopyroxenes (Opx) in serpentine (XPL). (e) Fine-grained laths of plagioclase, opaque minerals in basalt. (f) Plagioclase laths in gabbro.
Mining 05 00053 g007
Figure 8. Spectral signature matched and identified in HMI for BM26 location.
Mining 05 00053 g008
Figure 9. Spectral signature matched and identified in HMI for BM27 location.
Mining 05 00053 g009
Figure 10. Polished microphotographs illustrating the manganese ore samples captured under reflected light ore microscopy [6] (af), the mineralogical characteristics of manganese ore deposits from Bela ophiolite complex ref [6].
Mining 05 00053 g010
Figure 11. SAM classification of jasperitic chert hosting manganese deposits in study area.
Mining 05 00053 g011
Figure 12. Field photograph of exposed Mn ore bodies. (a) Manganese ore body in a vein form hosted by jasperitic chert. (b) Exposed Mn ore deposits in unconsolidated jasperitic material in the Bela Ophiolite.
Mining 05 00053 g012
Figure 13. Field photographs of the study area. (a) Basalts on right side and pelagic on left side. (b) Ultramafics—serpentinized rocks. (c) Ultramafics–serpentinized rocks. (d) Contact between ultramafic and pillow basalt. (e) Serpentinized ultramafics. (f) Large crystals of pyroxene in ultramafics. (g) Diabase gabbro. (h) Gabbro with pelagic chilled margins.
Mining 05 00053 g013aMining 05 00053 g013b
Figure 14. Structural (A) lineament and (B) lineament density maps prepared from a DEM of the Lasbela Ophiolite Complex.
Mining 05 00053 g014
Table 1. The technical characteristics and wavelengths of ASTER data [39,40].
Sub-SystemBand No.Band NameWavelength (μm)Spatial Resolution (m)
VNIR1VNIR-10.52–0.6015
2VNIR-20.63–0.6915
3NVNIR-3N0.78–0.8615
3BVNIR-3B0.78–0.8615
SWIR4SWIR-11.60–1.7030
5SWIR-22.15–2.1930
6SWIR-32.19–2.2330
7SWIR-42.24–2.2930
8SWIR-52.30–2.3730
9SWIR-62.36–2.4330
TIR10TIR-18.13–8.4890
11TIR-28.48–8.8390
12TIR-38.93–9.2890
13TIR-410.25–10.9590
14TIR-510.95–11.6590
Table 2. Standard deviation of pixel values.
BandBand 1Band 2Band 3Band 4Band 5Band 6Band 7Band 8Band 9
Std. per band:76.5679.4282.5283.3583.5183.4485.3680.1485.07
Table 3. Correlation coefficient of different bands.
Band 1Band 2Band 3Band 4Band 5Band 6Band 7Band 8Band 9
Band 11
Band 20.991
Band 30.960.971
Band 40.920.940.951
Band 50.930.940.940.981
Band 60.920.930.940.980.991
Band 70.90.910.920.970.970.961
Band 80.910.920.930.960.960.950.981
Band 90.920.930.930.980.980.970.980.981
Table 4. OIF index highest ranking.
S. No.BandsOIF
1B3B6B7(89.15)
2B3B7B9(89.15)
3B3B5B7(88.81)
4B2B7B9(88.50)
5B2B6B7(88.48)
Table 5. Seventy-two band ratios of ASTER VNIR and SWIR bands.
Band 1Band 2Band 3Band 4Band 5Band 6Band 7Band 8Band 9
Band 1 1/21/31/41/51/61/71/81/9
Band 22/1 2/32/42/52/62/72/82/9
Band 33/13/2 3/43/53/63/73/83/9
Band 44/14/24/3 4/54/64/74/84/9
Band 55/15/25/35/4 5/65/75/85/9
Band 66/16/26/36/46/5 6/76/86/9
Band 77/17/27/37/47/57/6 7/87/9
Band 88/18/28/38/48/58/68/7 8/9
Band 99/19/29/39/49/59/69/79/8
Table 6. Ranked OIF values of 72 ratio bands combinations.
S. No.BandsOIF
11/44/99/1139.4
21/44/99/3138.71
33/44/97/3138.24
41/44/99/2137.88
Table 7. Cross validation for remote sensing results and field inspection.
Sample No.Remote Sensing ResultsField InspectionPetrographic StudiesGeochemical Analysis
20PB-01BasaltsBasaltsBasalts-
20PB-02BasaltsBasaltsBasalts
20PB-03BasaltsBasaltsBasalts-
20PB-04BasaltsBasaltsBasalts-
20PB-05BasaltsBasaltsBasalts-
20PB-06BasaltsBasaltsBasalts-
20PB-07BasaltsBasaltsBasalts-
20PB-08BasaltsBasaltsBasalts-
20PB-09GabbroBasaltsBasalts-
20GB-01Diabase/GabbroDiabase/GabbroDiabase/Gabbro-
20GB-02Diabase/GabbroDiabase/GabbroDiabase/Gabbro-
20GB-03Diabase/GabbroDiabase/GabbroDiabase/Gabbro-
20GB-04Diabase/GabbroDiabase/GabbroDiabase/Gabbro-
20GB-05Diabase/GabbroDiabase/GabbroDiabase/Gabbro-
20UM-01UltramaficUltramaficSerpentinized Rocks-
20UM-02UltramaficUltramaficSerpentinized Rocks-
20UM-03UltramaficUltramaficSerpentinized Rocks-
20JC-01Jasperitic chertJasperitic chertThin section could not prepared-
BM26 (manganese ore sample)PsilomelaneManganese orePsilomelane-
BM27 (manganese ore sample)PsilomelaneManganese orePsilomelane-
Table 8. Error matrix and kappa coefficient for ASTER lithological maps versus field survey.
Actual\PredictedField Survey
Pelagics/Jaspertic ChertsSerpentinized RocksGabbrosBasalts
Pelagics/Jaspertic Cherts45532
Serpentinized Rocks43862
Gabbros36401
Basalts23441
Overall accuracy = 80%Kappa coefficient = 0.733
Table 9. Hyperspectral Material Identification (HMI) results for manganese ore sample locations showing ACE, likelihood, and correlation values for psilomelane detection using USGS spectral library references.
LocationsSignature NameACELikelihoodFP CorrelationBknd-R CorrelationLibrary Source
BM26Psilomelane HS139.3B [W5R4Nbb_ RREF]1.00001.00000.41300.5073minerals_nicolet_3841.sli
BM27Psilomelane HS139.3B [W5R4Nbb_ RREF]1.00001.00000.08380.7281minerals_nicolet_3841.sli
Table 10. Geochemical composition of manganese ore samples BM26 and BM27, showing major oxide concentrations (wt %) (SiO2, Fe2O3, Al2O3, MnO, etc.) used to validate mineral identification from hyperspectral analysis.
(Major Elements wt. %) ± 10% for Trace Elements
S. No.SiO2Fe2O3Al2O3MgOTiO2MnOCaONa2OK2OP2O5LOITotal
BM2645.0910.079.70.310.2530.840.70.110.210.042.69100.0
BM2748.529.591.790.560.3634.10.940.20.540.274.03100.9
Disclaimer/Publisher’s Note: The statements, opinions and data contained in all publications are solely those of the individual author(s) and contributor(s) and not of MDPI and/or the editor(s). MDPI and/or the editor(s) disclaim responsibility for any injury to people or property resulting from any ideas, methods, instructions or products referred to in the content.