
The Performance Analysis of Pumpable Emulsion Explosives in Narrow-Reef Gold Mines


Abstract
:1. Introduction
2. Emulsion Explosives Use in Narrow-Reef Mines
3. Methods
- The general reef dip was between 21° and 25° in both shafts.
- In Panel 1, the geological conditions were favourable and the horizontal drilling direction was between 70° and 90°, with an average of 10 cm of underbreak.
- In Panel 2, the geological conditions were favourable, and the horizontal drilling direction was between 80° and 90°, with an average of 0 cm of overbreak.
- In Panel 3, the geological conditions were favourable, and the horizontal drilling direction was between 80° and 90°, with an average underbreak of 5 cm.
- In Panel 4, two faults were intersected, and the horizontal drilling direction was between 80° and 90°, with an average overbreak of 12 cm.
- In Panel 5, the hanging wall had partings, and the horizontal drilling direction was between 88° and 90°, with an average overbreak of 21 cm.
- In Panel 6, the hanging wall had partings, and the horizontal drilling direction was close to 90°, with an average overbreak of 33 cm.
- In Panel 6, the hanging wall had partings, and the face had multiple bands of reefs. The horizontal drilling direction was between 86° and 90°, with an average overbreak of 13 cm.
4. Results
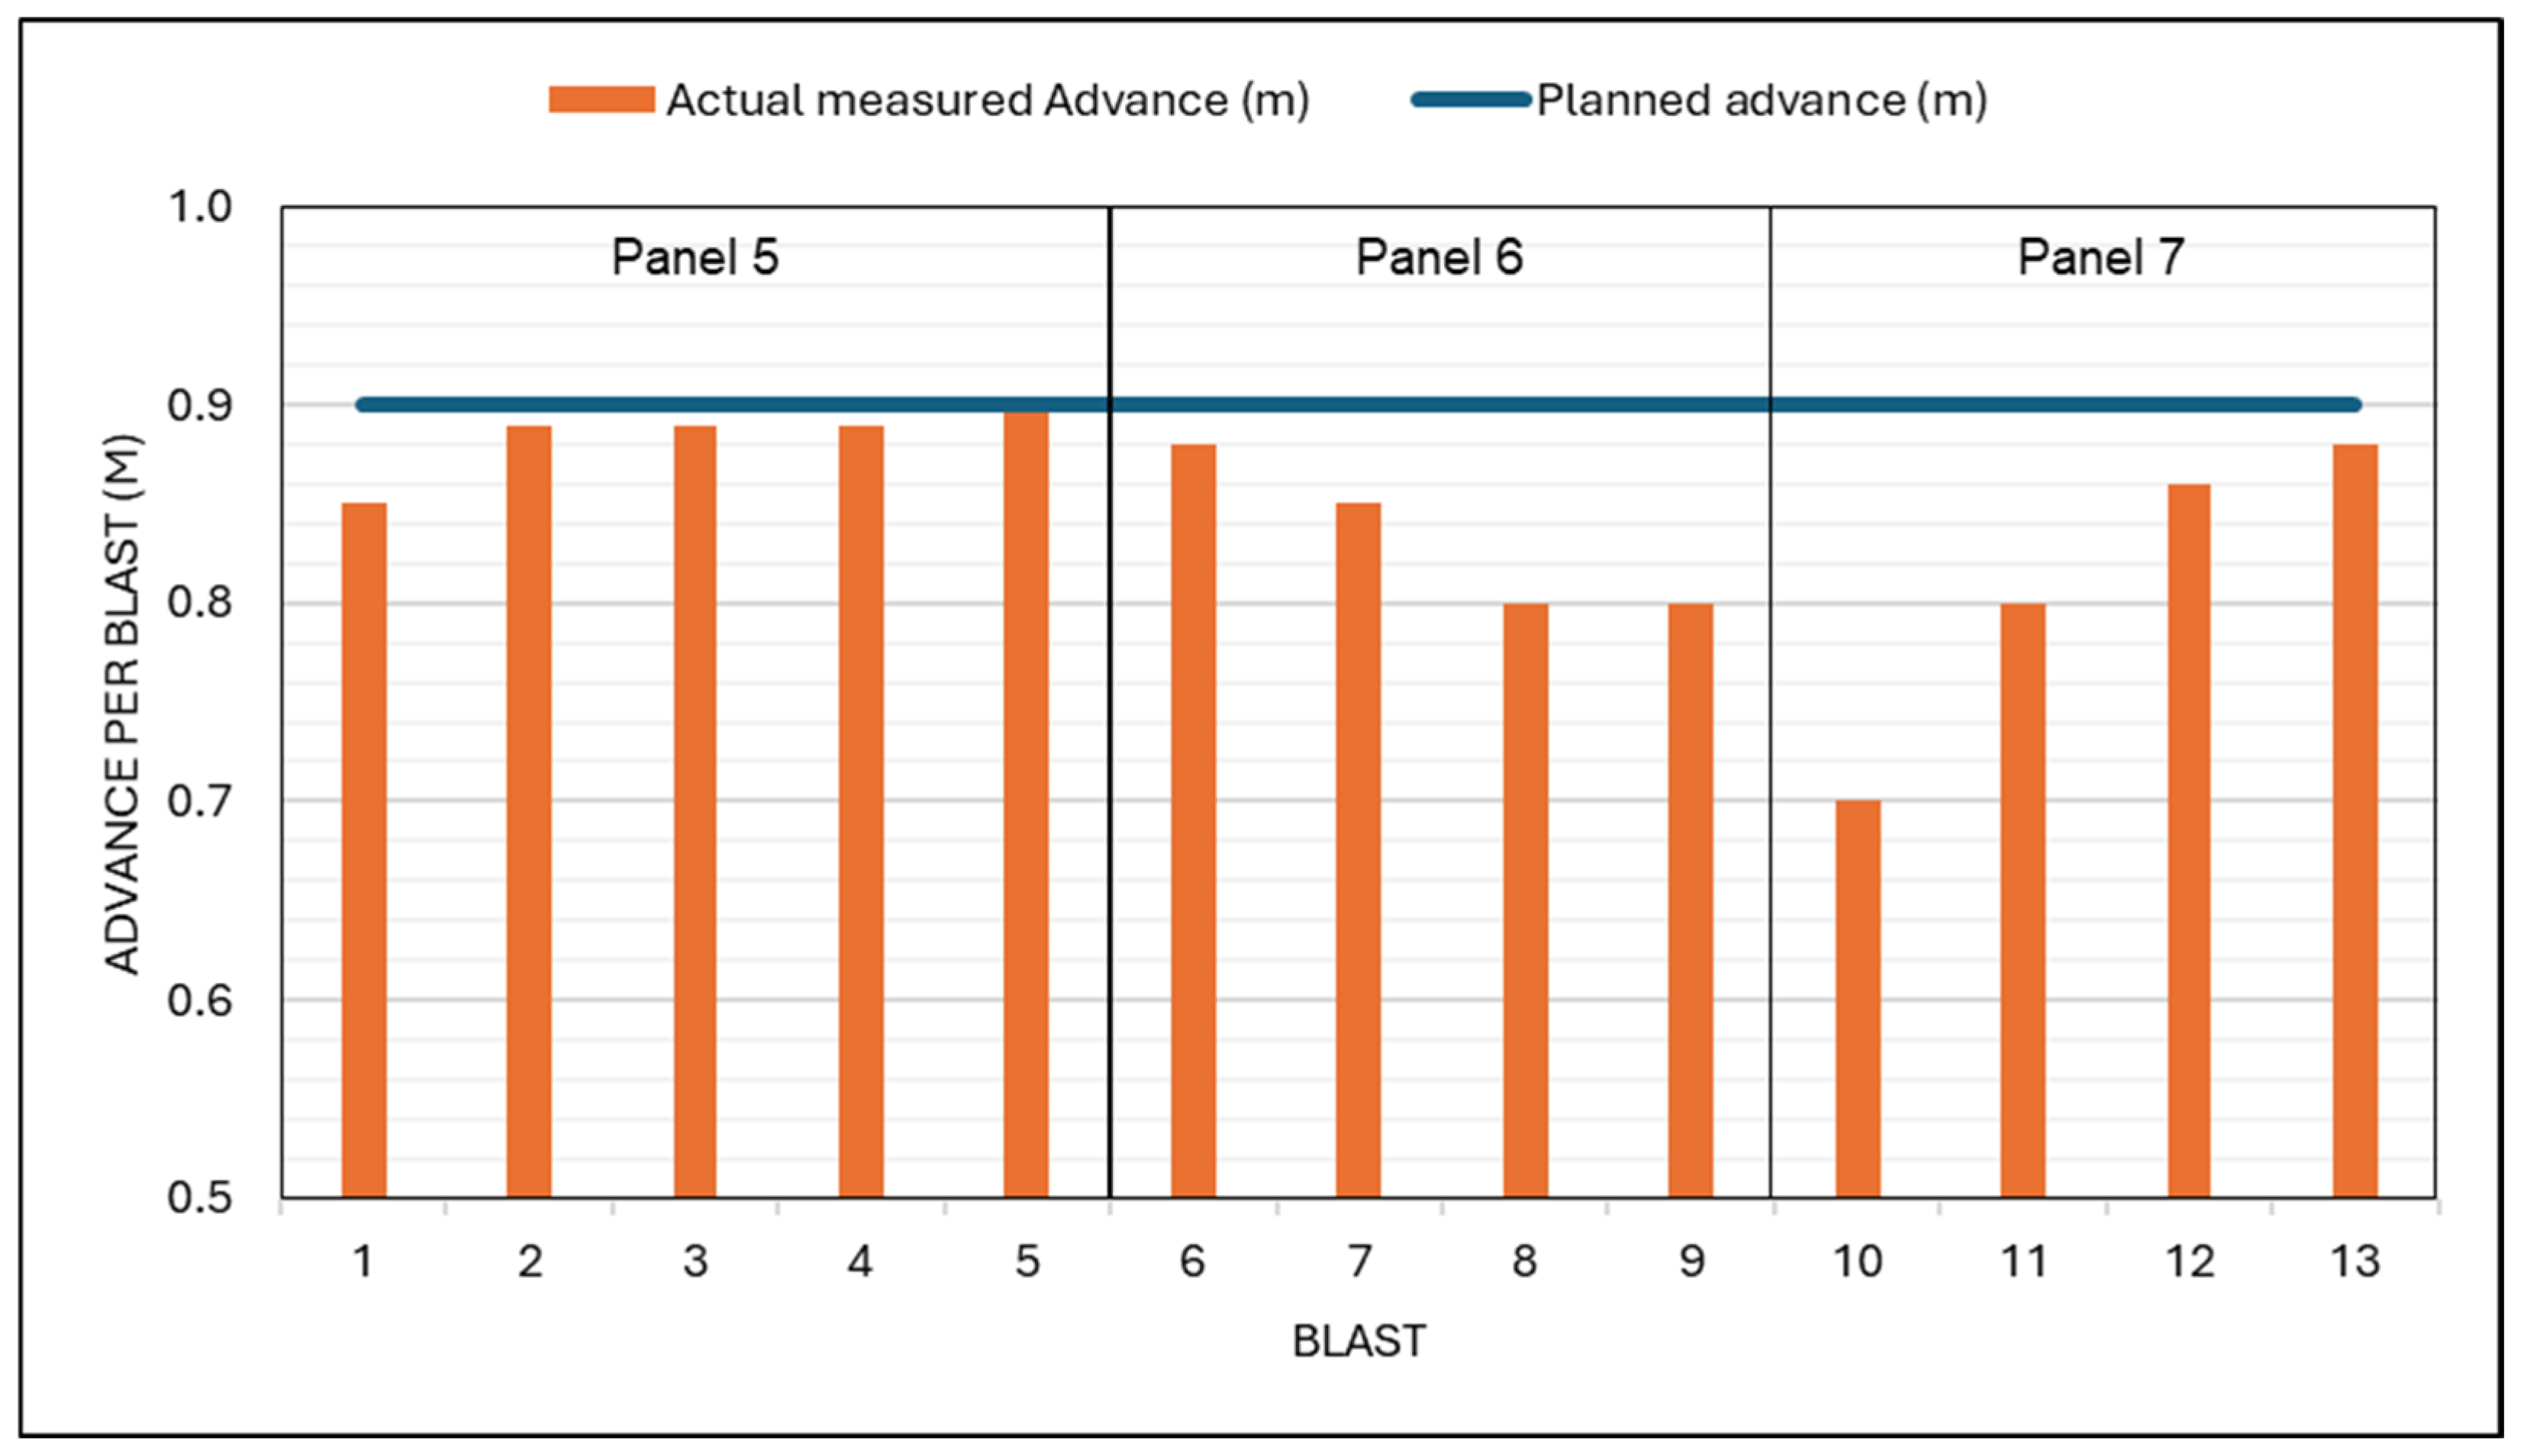
4.1. Face Advance
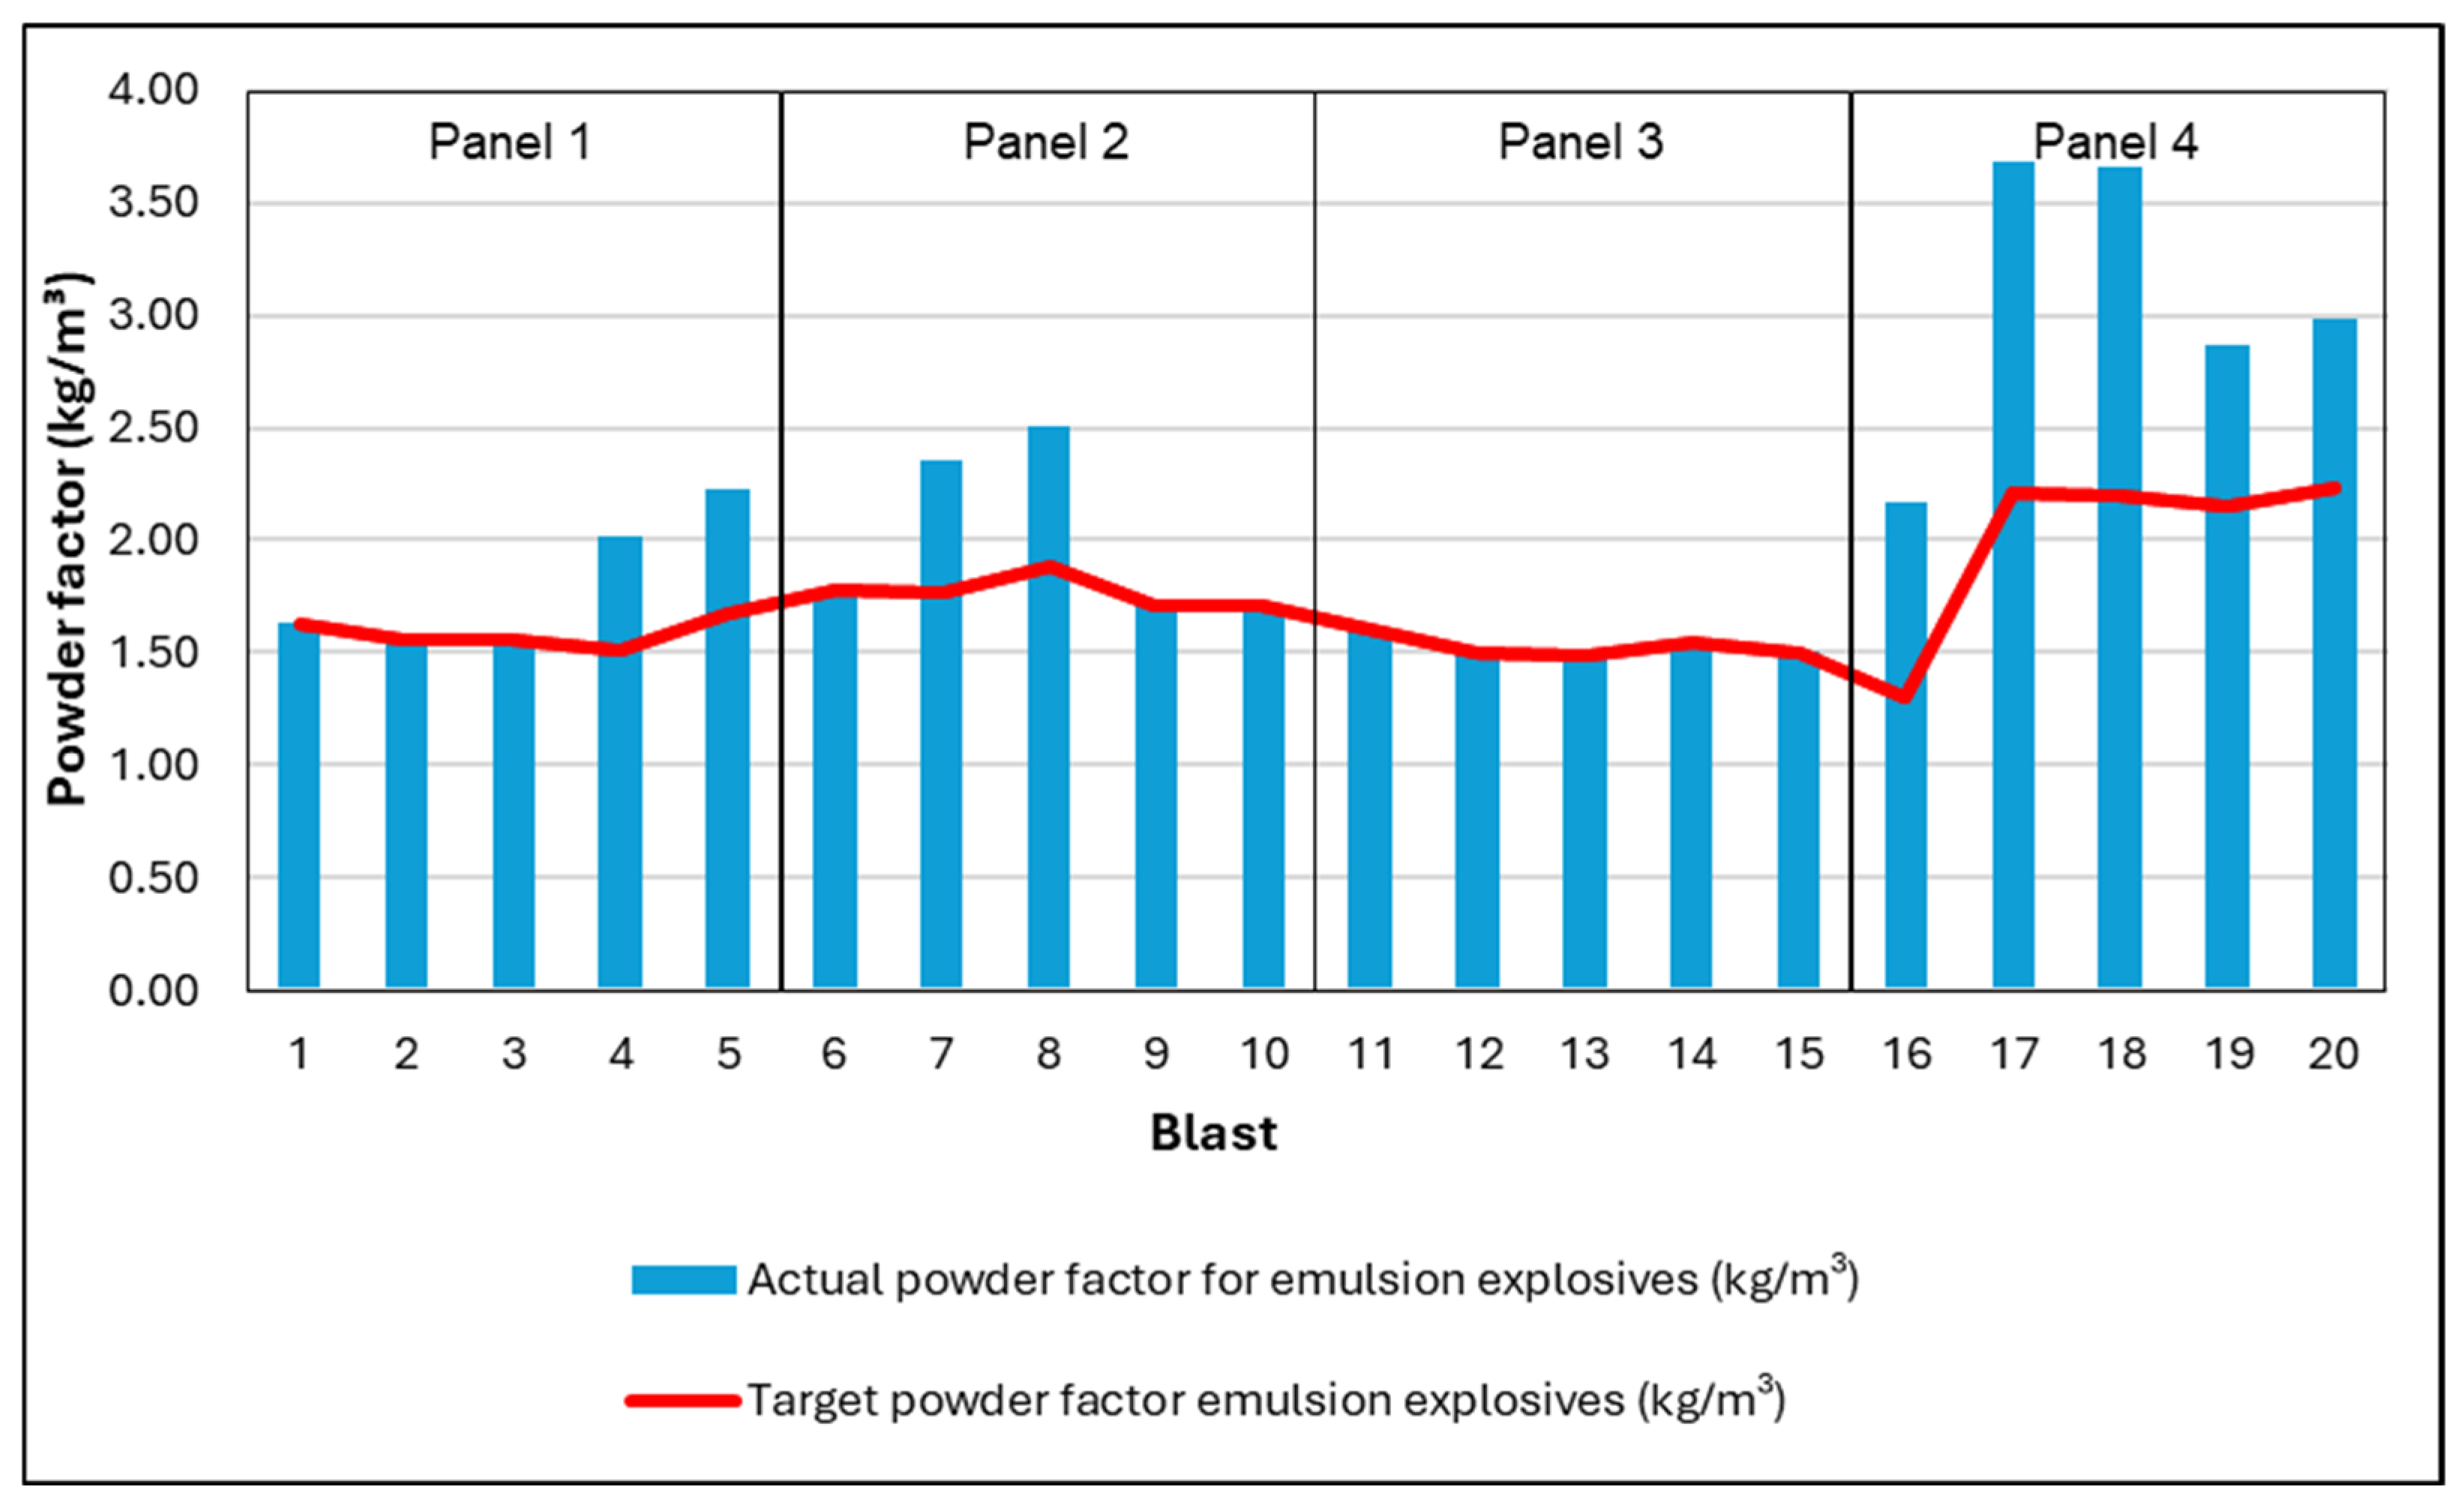
4.2. Powder Factor
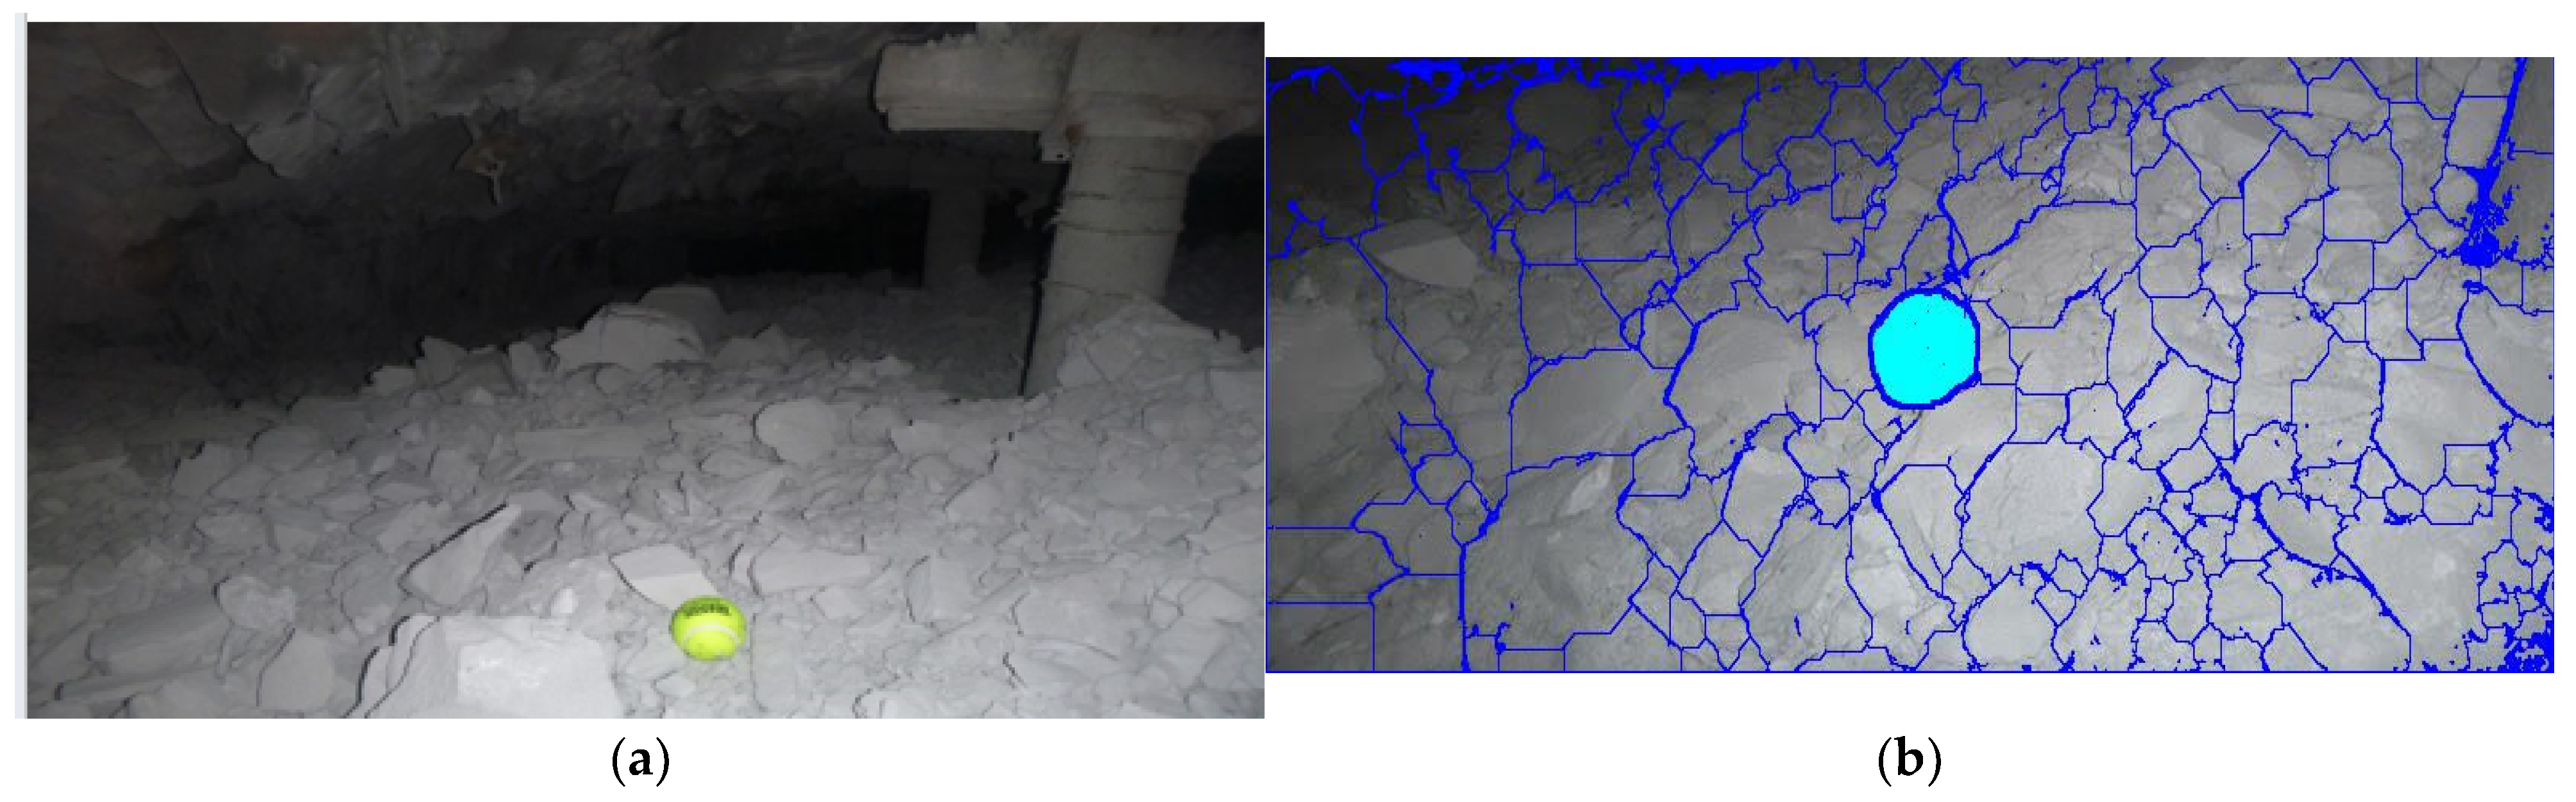
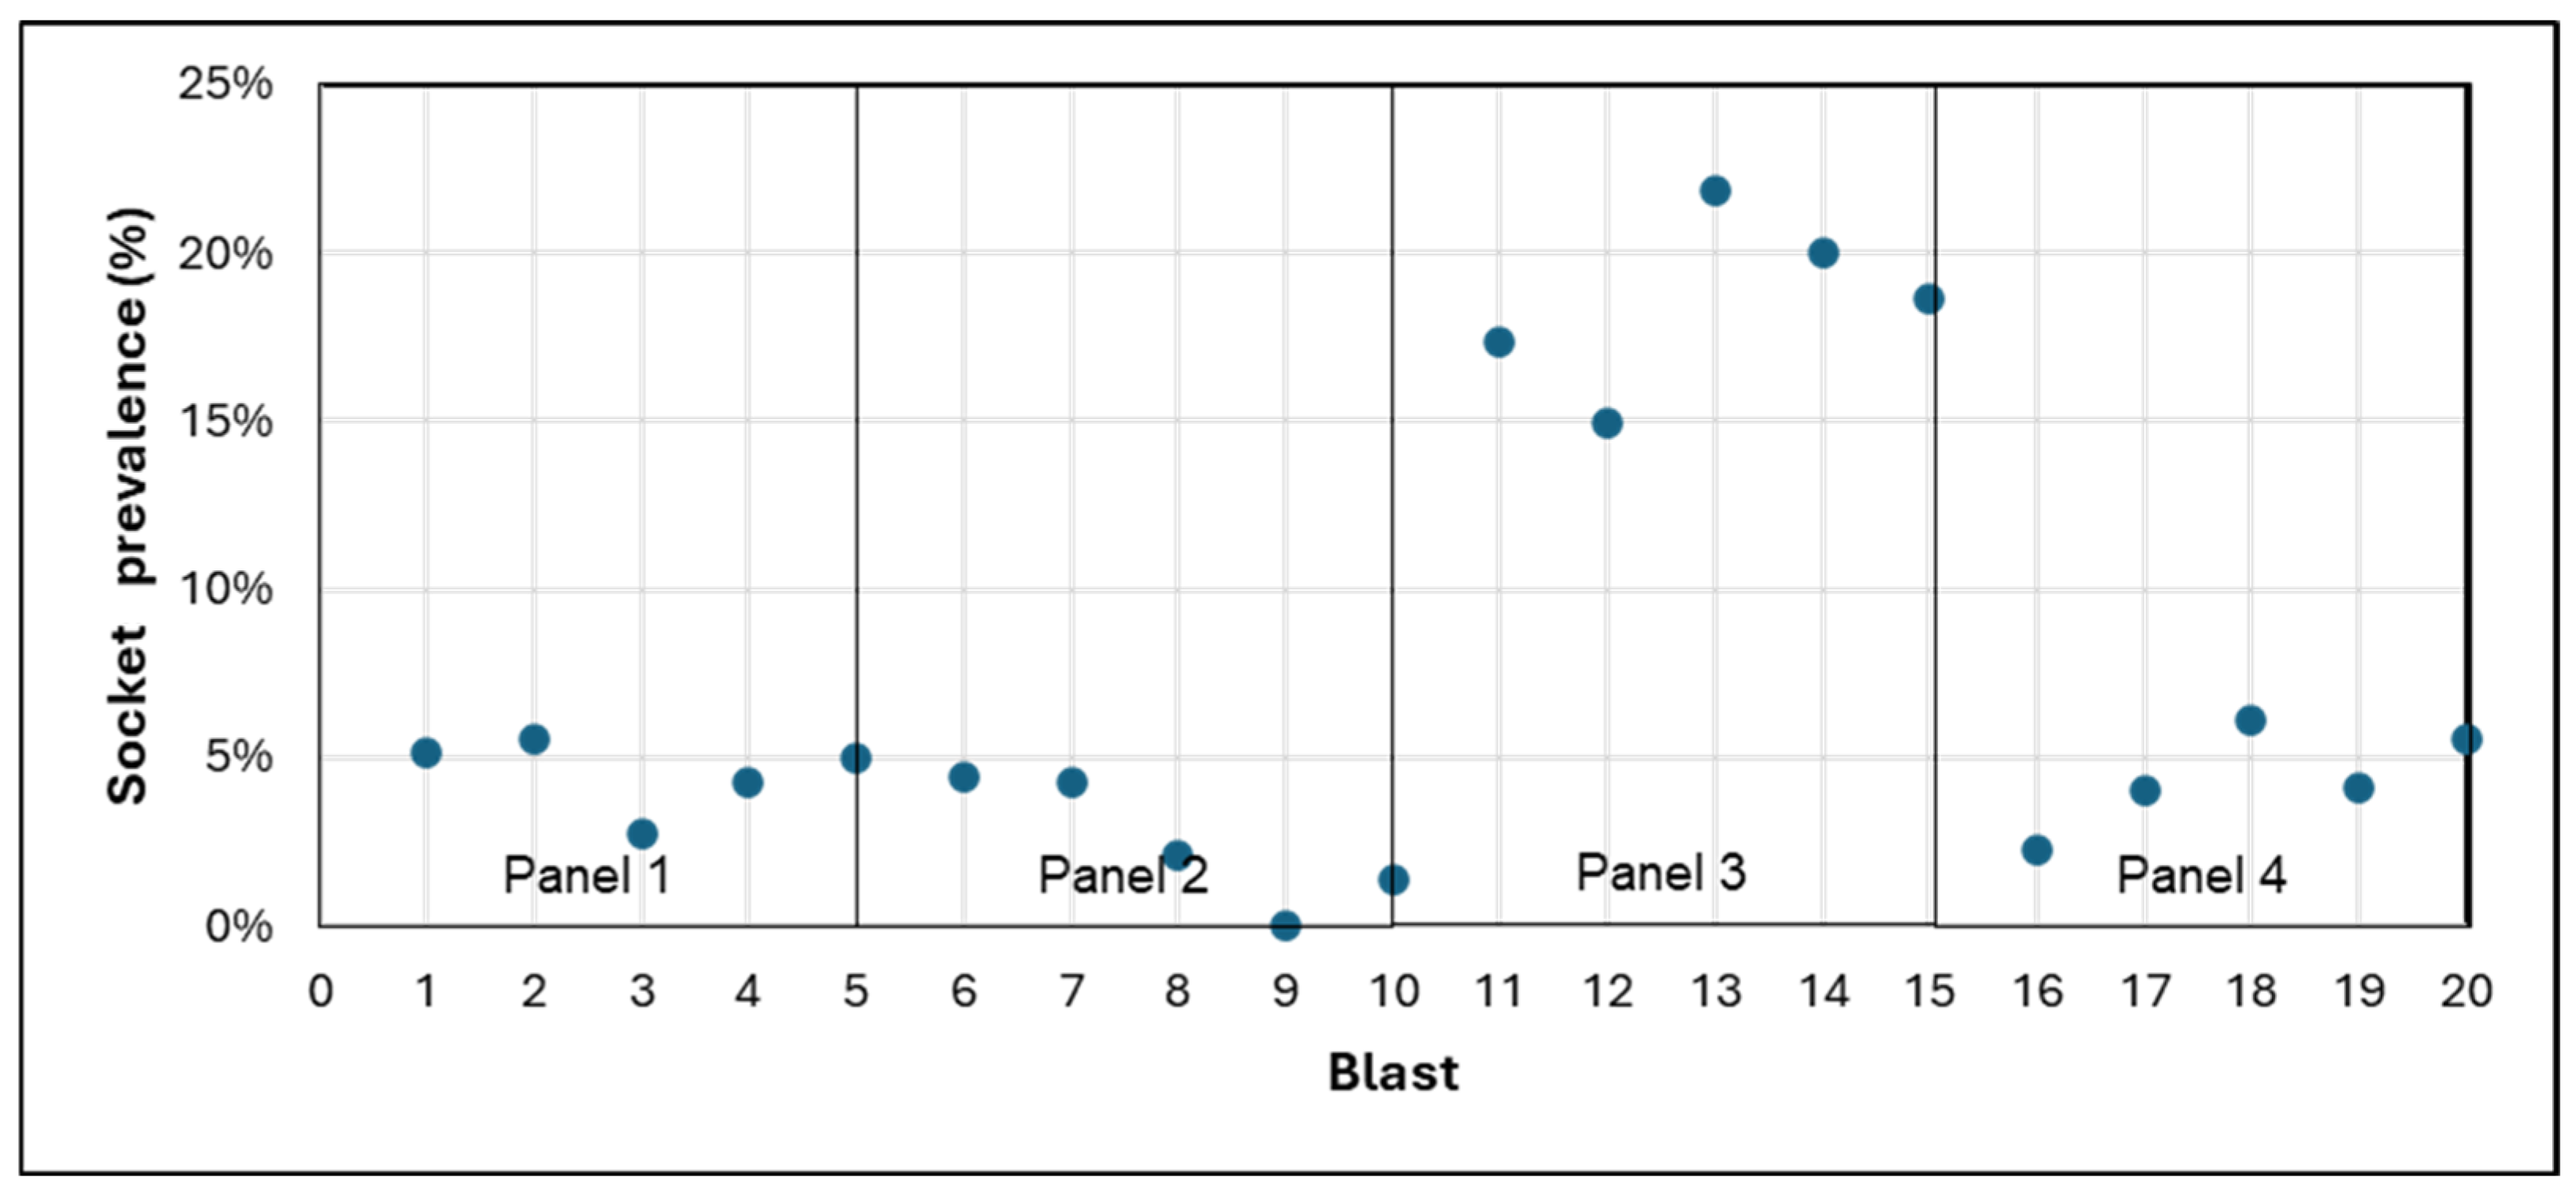
4.3. Fragmentation
5. Discussion
5.1. Face Advance
5.1.1. Face Advance at Shaft A
5.1.2. Face Advance at Shaft B
5.1.3. Overall Analysis of Face Advance
5.2. Powder Factor
5.2.1. Powder Factor at Shaft A
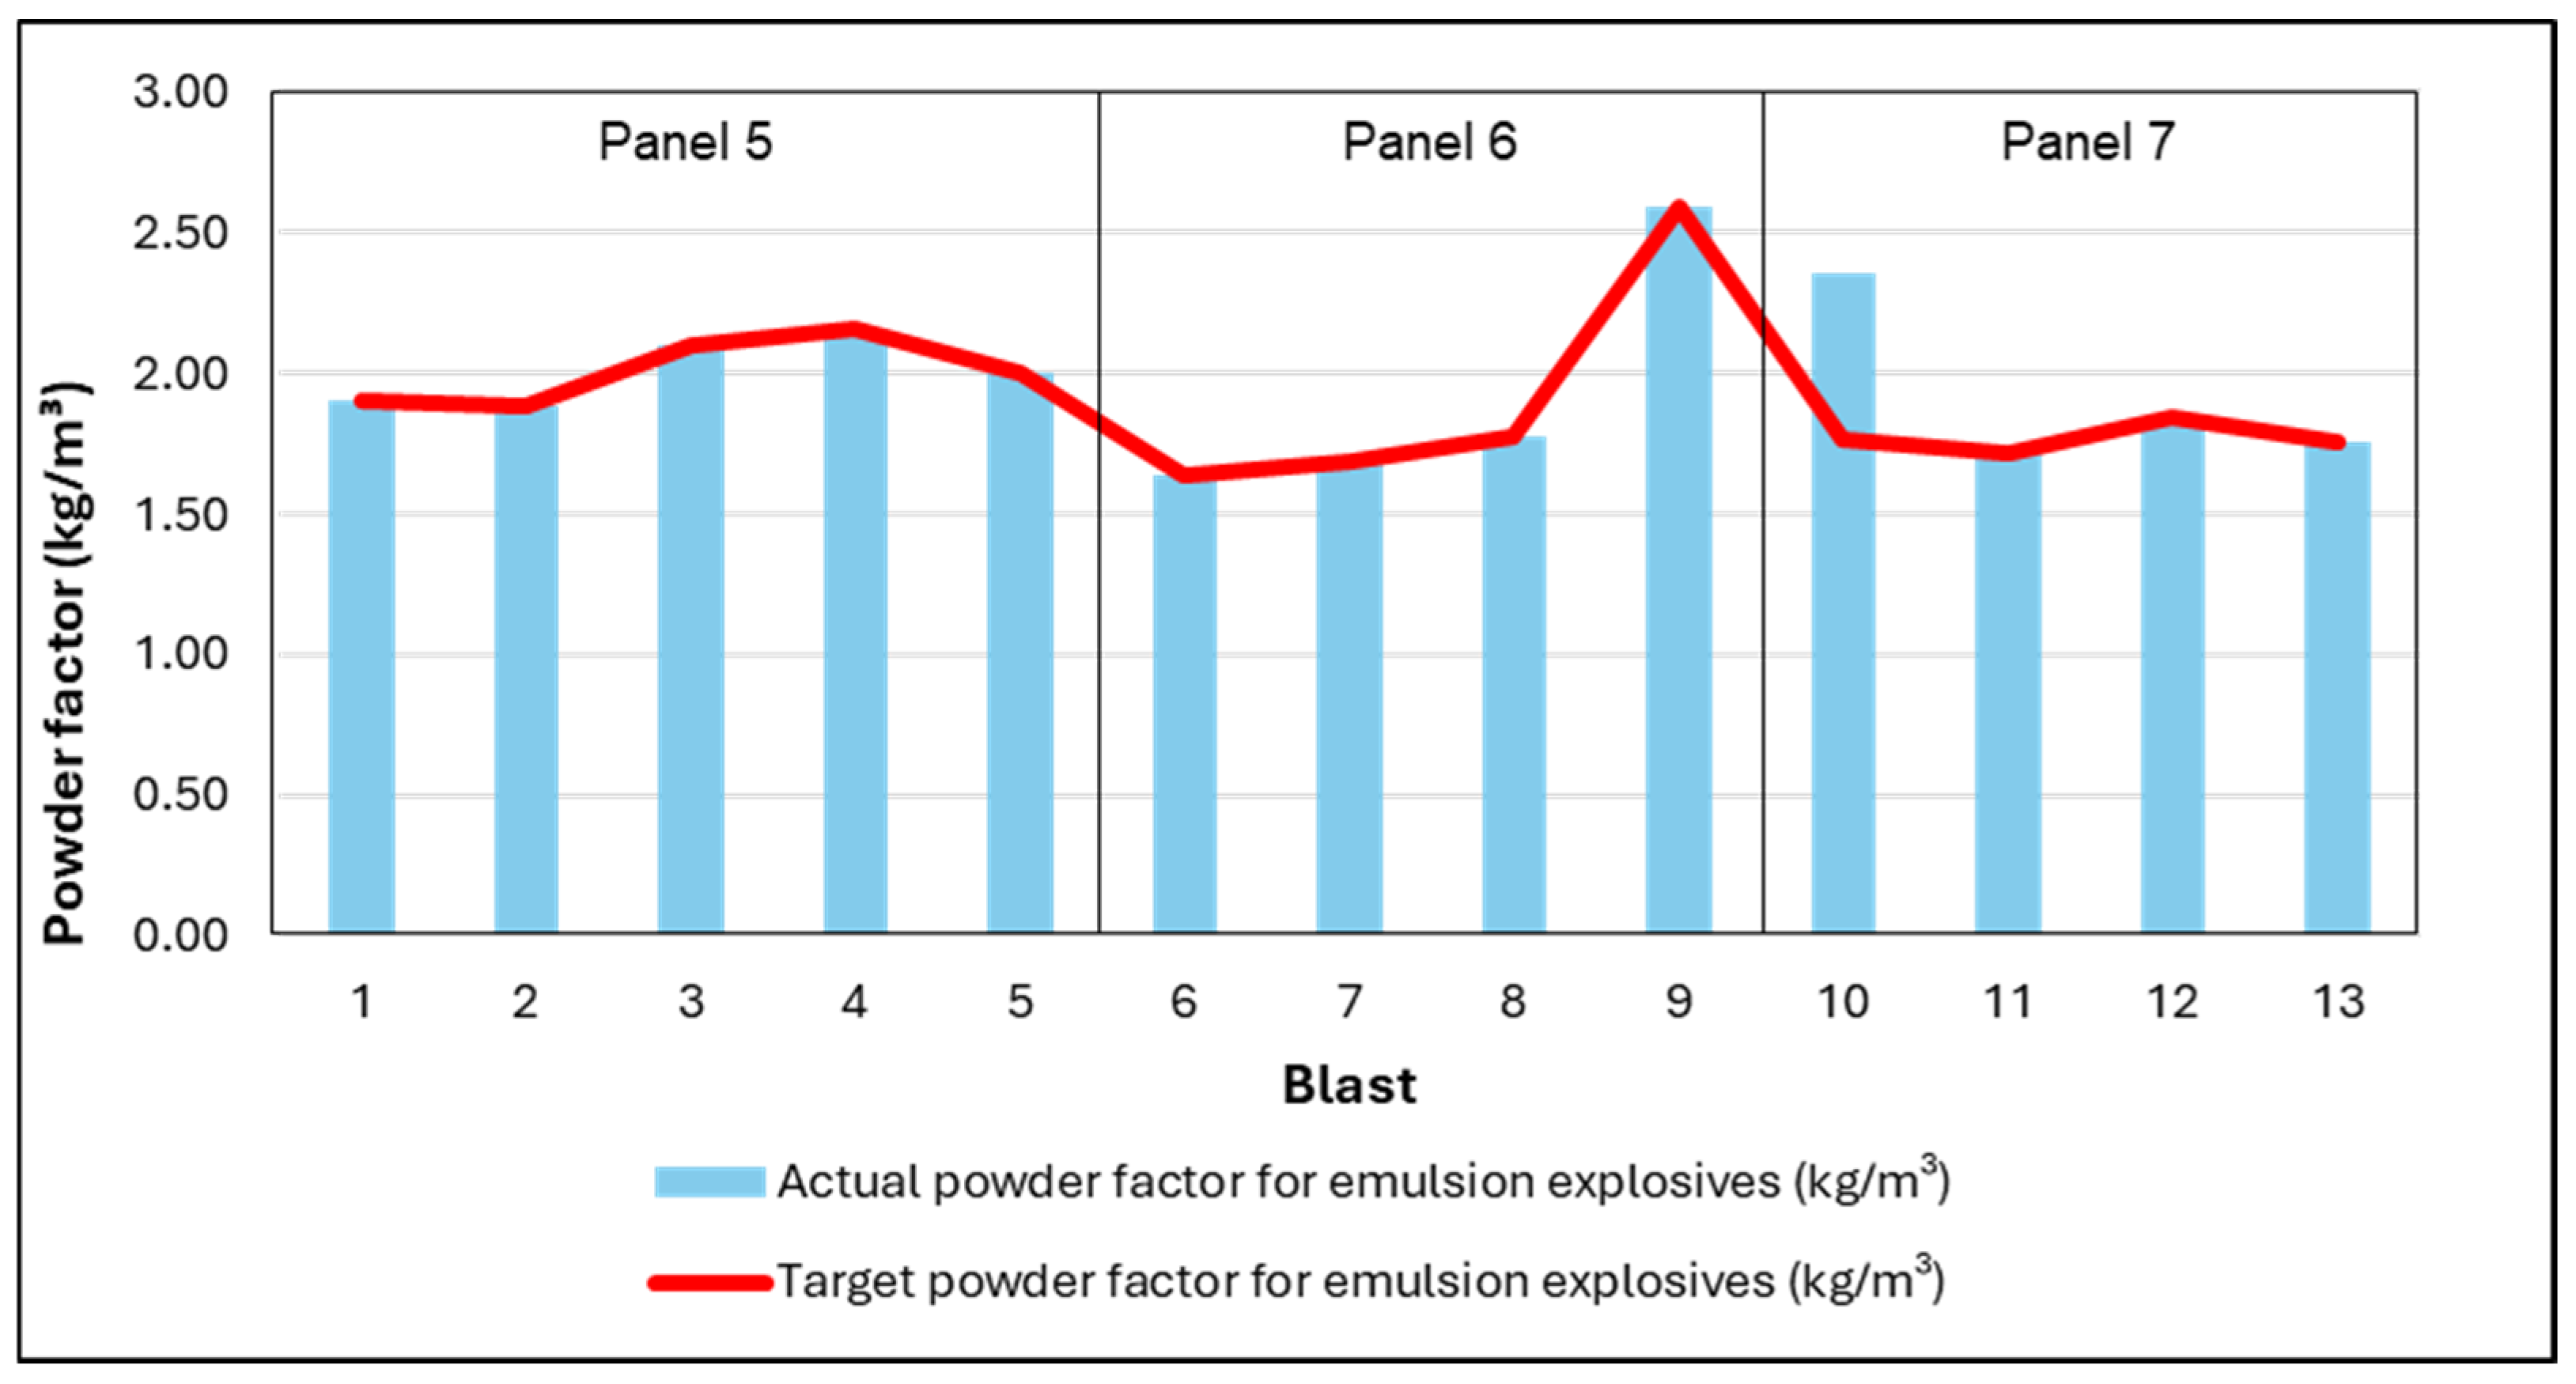
5.2.2. Powder Factor at Shaft B
5.2.3. Overall Analysis of Powder Factor
- A decrease in the mass of the explosives due to two rows of blastholes being drilled instead of the prescribed three rows in some panels, which will result in a low powder factor;
- An increase in the mass of the explosives per blasthole due to the pumping of four or five strokes of explosive instead of the required three strokes by some crews, which will result in a high powder factor;
- An increase in the mass of the explosives per blast due to an increase in the number of holes because of the on-the-face drill pattern adjustment. Because of the nature of the emulsion explosives in relation to cartridge explosives, there is a high likelihood of overcharging and wastage underground. Therefore, charging with emulsion requires training, discipline, and supervision.
5.3. Fragmentation
6. Conclusions
Author Contributions
Funding
Data Availability Statement
Conflicts of Interest
References
- Sellers, E.J. Controlled blasting for enhanced safety in the underground environment. J. S. Afr. Inst. Min. Metall. 2011, 111, 11–17. [Google Scholar]
- Busuyi, A.T. Optimization of drilling and blasting operations in an open pit mine—The SOMAIR experience. J. Min. Sci. 2009, 19, 736–739. [Google Scholar] [CrossRef]
- Rajpot, M.A. The Effect of Fragmentation Specification on Blasting Cost. Master’s Thesis, Queen’s University, Kingston, ON, Canada, March 2009. [Google Scholar]
- White, A.J.A.; Joughin, N.C.; Cook, N.G. Improvements in stope drilling and blasting for deep gold mines. J. S. Afr. Inst. Min. Metall. 1975, 75, 139–150. [Google Scholar]
- Kramarczyk, B.; Suda, K.; Kowalik, P.; Swiatek, K.; Jaszcz, K.; Jarosz, T. Emulsion Explosives: A Tutorial Review and Highlight of Recent Progress. Materials 2022, 15, 4952. [Google Scholar] [CrossRef] [PubMed] [PubMed Central]
- Mertuszka, P.; Cenian, B.; Kramarczyk, B.; Pytel, W. Influence of Explosives Charge Diameter on the Detonation Velocity Based on Emulinit 7L And 8L Bulk Emulsion Explosives. Cent. Eur. J. Energetic Mater. 2018, 15, 351–363. [Google Scholar] [CrossRef] [PubMed]
- Pearton, S.P. The application of pumpable emulsions in narrow-reef stoping. J. S. Afr. Inst. Min. Metall. 2015, 115, 489–497. [Google Scholar]
- Cunningham, C.V.B.; Zaniewski, T.; Kernahan, N. Threshold blasting: The renaissance of explosives in narrow reef mining. J. S. Afr. Inst. Min. Metall. 2002, 102, 25–31. [Google Scholar]
- Brinkmann, J.R. Blast Design Guidelines for Narrow Stopes; Chamber of Mines Research Organisation: Johannesburg, South Africa, 1989. [Google Scholar]
- Singh, S.P.; Abdul, H. Investigation of blast design parameters to optimize fragmentation. In Rock Fragmentation by Blasting, Fragblast 10; Singh, P.K., Sinha, A., Eds.; CRC Press: Boca Raton, FL, USA, 2012; pp. 181–186. [Google Scholar]
- Torrance, A.C.; Scott, A. What is relative about energy? In Proceedings of the 11th International Symposium on Rock Fragmentation by Blasting (FRAGBLAST11), Sydney, NSW, Australia, 24–26 August 2015. [Google Scholar]
- Silva, J.D.; Amaya, J.G.; Basso, F. Development of a predictive model of fragmentation using drilling and blasting data in open pit mining. J. S. Afr. Inst. Min. Metall. 2017, 117, 1089–1094. [Google Scholar] [CrossRef]
- Nong, S. Review of Successes and Failures of Mechanisation Trials on Platinum Mines of the Bushveld Complex. Master’s Thesis, University of the Witwatersrand, Johannesburg, South Africa, 2010. Available online: https://wiredspace.wits.ac.za/server/api/core/bitstreams/403fdf59-e379-4577-af54-6f1130129421/content (accessed on 26 February 2022).
- Chosi, R.L. Quantification of the Benefits of Pumpable Emulsion Explosives in Narrow Reef Gold Mines. Master’s Thesis, University of the Witwatersrand, Johannesburg, South Africa, April 2024. [Google Scholar]
- Djordevic, N. Two component model of blast fragmentation. In Proceedings of the Sixth International Symposium on Rock Fragmentation by Blasting, Johannesburg, South Africa, 8–12 August 1999. [Google Scholar]
- Lawal, A.I. A new modification to the Kuz-Ram model using the fragment size predicted by image analysis. Int. J. Rock Mech. Min. Sci. 2021, 138, 104595. [Google Scholar] [CrossRef]


| Parameter | Emulsion and Sensitiser |
|---|---|
| Drill steel length | 120 cm |
| Effective blasthole length | 90 cm |
| Blasthole diameter | 3.2 cm |
| Planned stemming length | 32 cm |
| Planned burden | 60 cm |
| Expected blast advance (90% of effective blasthole and above) | 80–90 cm |
| Explosives density | 1–1.18 g/cc |
| Initiating system | Shock tube 200/4000 ms |
| Relative weight strength (RWS @100 MPa) | 89 MPa |
| Relative bulk strength (RBS @ 100 MPa) | 127 MPa |
| Velocity of detonation | 4000–5000 m/s |
| Rock factor (conglomerate/quartzite) | 10 |
| Shafts | Panel | Total Number of Blast Observations | Blast No. |
|---|---|---|---|
| A | 1 | 5 | 1 to 5 |
| 2 | 5 | 6 to 10 | |
| 3 | 5 | 11 to 15 | |
| 4 | 5 | 16 to 20 | |
| B | 5 | 5 | 1 to 5 |
| 6 | 4 | 6 to 9 | |
| 7 | 4 | 10 to 13 |
| Shafts | Panel | Average Planned Panel Width (cm) | Average Actual Panel Width (cm) | Average Planned no. of Blastholes Drilled | Average Actual no. of Blastholes Drilled |
|---|---|---|---|---|---|
| A | 1 | 220 | 207 | 68 | 74 |
| 2 | 180 | 179 | 86 | 85 | |
| 3 | 180 | 175 | 82 | 70 | |
| 4 | 180 | 192 | 121 | 135 | |
| B | 5 | 135 | 156 | 103 | 86 |
| 6 | 142 | 175 | 176 | 148 | |
| 7 | 214 | 227 | 122 | 142 |
| Location | Predicted Emulsion X50 (cm) | Emulsion X50 of Split-Desktop Image Analysis (cm) | Emulsion X50 of WipFrag Image Analysis (cm) | Shaft A’s Target X50 Range Post-Blast (cm) |
|---|---|---|---|---|
| Panel 1: Blast 3 | 7.18 | 7.48 | 14.1 | 11.5–13.5 |
| Panel 2: Blast 7 | 6.16 | 5.73 | 13.63 | 11.5–13.5 |
| Panel 3: Blast 15 | 7.55 | 3.58 | 12.84 | 11.5–13.5 |
| Panel 4: Blast 18 | 4.24 | 5.94 | 12.81 | 11.5–13.5 |
| Location | Predicted Emulsion X50 (cm) | Emulsion X50 of Split-Desktop Image Analysis (cm) | Emulsion X50 of WipFrag Image Analysis (cm) | Shaft B’s Target X50 Range Post-Blast (cm) |
|---|---|---|---|---|
| Panel 5: Blast 3 | 5.73 | 5.08 | 11.69 | 11.5–13.5 |
| Panel 6: Blast 6 | 8.48 | 8.49 | 11.31 | 11.5–13.5 |
| Panel 7: Blast 13 | 7.11 | 8.63 | 9.73 | 11.5–13.5 |
Disclaimer/Publisher’s Note: The statements, opinions and data contained in all publications are solely those of the individual author(s) and contributor(s) and not of MDPI and/or the editor(s). MDPI and/or the editor(s) disclaim responsibility for any injury to people or property resulting from any ideas, methods, instructions or products referred to in the content. |
© 2024 by the authors. Licensee MDPI, Basel, Switzerland. This article is an open access article distributed under the terms and conditions of the Creative Commons Attribution (CC BY) license (https://creativecommons.org/licenses/by/4.0/).
Share and Cite
Chosi, R.; Leeuw, P.; Nong, M. The Performance Analysis of Pumpable Emulsion Explosives in Narrow-Reef Gold Mines. Mining 2025, 5, 1. https://doi.org/10.3390/mining5010001
Chosi R, Leeuw P, Nong M. The Performance Analysis of Pumpable Emulsion Explosives in Narrow-Reef Gold Mines. Mining. 2025; 5(1):1. https://doi.org/10.3390/mining5010001
Chicago/Turabian StyleChosi, Ramphele, Paseka Leeuw, and Matsobane Nong. 2025. "The Performance Analysis of Pumpable Emulsion Explosives in Narrow-Reef Gold Mines" Mining 5, no. 1: 1. https://doi.org/10.3390/mining5010001
APA StyleChosi, R., Leeuw, P., & Nong, M. (2025). The Performance Analysis of Pumpable Emulsion Explosives in Narrow-Reef Gold Mines. Mining, 5(1), 1. https://doi.org/10.3390/mining5010001