1. Introduction
Surface mines are one of the lithospheric sources that emit large amounts of suspended particles into the atmosphere [
1]. As a result, the degradation in air quality is a major problem in mining areas. Almost all surface mining operations are accompanied by the formation of particulate matter (PM); these particulates come in a wide range of sizes, and they are emitted into the near-surface air layer [
1,
2,
3,
4]. During mining operations, most rocks and ores require blasting to break them into smaller particles before excavation takes place. Drilling and blasting are fundamental to preparing rocks for excavation in iron ore quarries, some nonferrous metal ore quarries, most quarries that extract building materials, as well as many coal pits.
When mining strong rocks via blasting, blasting operations account for 50% or more of the total amount of PM emitted into the atmosphere [
1,
5]. It should be noted that the intensification of mining, as well as the tendency to improve the economic efficiency of all surface mining operations (particularly drilling and blasting operations), leads to an increase in the total mass of the explosives used. For example, in the quarries of the Kursk magnetic anomaly, large-scale commercial blasting is conducted in order to break ferruginous quartzites. Between 1997 and 1999, the total mass of the one-time use explosives used was in the range of 500–1000 tons; in recent decades, the total mass of the explosives used reached two–three thousand tons per explosion [
6]. In these cases, the formed dust and gas clouds not only pollute the atmosphere surrounding the quarry, but also the atmosphere encompassing the quarry’s vast adjacent territories. The sizes of the particulates comprising the PM range from tens of nanometers to tens of micrometers; they remain in the air for a sufficiently long period of time. The possibility of nanoparticle formation in large-scale blasting is shown in [
7]. According to estimates [
8], the share of high-dispersity particles in commercial blasting can be up to several percent of the mass of broken rock, which is the highest index of all sources of man-made mineral PM. Particles are not only transported to areas within the intraquarry space but also to adjacent territories due to atmospheric processes.
Three stages can be distinguished in the development of the gas–dust cloud, starting from the moment of detonation. The detonation products expand inside the borehole and are ejected outward, together with rock particles. Under the influence of inertial and buoyant forces, the gas and dust mixture rises into the stratified atmosphere, thus forming the cloud itself. In the last stage, the dust cloud moves in accordance with the wind, which may vary in terms of strength and direction, until, ultimately, the cloud collapses.
For various reasons, it is only possible to experimentally study certain aspects of the transfer and deposition of PM. Predicting the atmospheric pollution that will occur in the vicinity of a quarry requires long-term instrumental observations. Unlike instrumental measurements, which make it possible to obtain the parameters of a dust cloud at individual points, numerical calculations indicate how the parameters are distributed across the entire space at any time. With the development of numerical modeling methods, it is possible to study and process the details of the dynamics of PM emissions at a new level. Such an approach makes it possible to not only obtain satisfactory data on specific events, but also to predict the results of the propagation of arbitrary hypothetical emissions.
Despite the fact that the mechanisms involved in dust cloud formation and dust cloud transportation in the atmosphere are well understood, even modeling the individual stages of this process is associated with significant difficulties; this is because there is a lack of knowledge concerning the parameters of these physical processes, and implementing numerical models is complex. This is especially true for simulations of borehole explosions; indeed, numerical calculations for borehole explosions require modeling the equations of continuum mechanics, processing the substance ejected from the explosion funnel into discrete particles (smaller particles and stones), and calculating the rise of these condensed particles, taking into account their interaction with the gas flow. Usually, when modeling the pollution emitted from these explosions, this stage is skipped, thus producing a hypothetical source of particles based on experimental data [
9,
10,
11].
We intend to draw attention to the fact that it is necessary to develop a unified physical and mathematical model that will consistently describe all stages of PM emission into the atmosphere. These stages are as follows: (1) the destruction of the rock, (2) the emergence of a dust and gas cloud, and (3) the transference of the dust cloud into the atmosphere. This model should successfully perform prognostic functions. For cases where explosive charges are placed on the rock’s surface, the numerical model simulating the detonation of an explosive charge, and the formation and rising of a gas and dust cloud, is described in [
12]; however, the mechanical effect of surface explosions is very different from borehole explosions, the latter of which is the most effective method for breaking rock during the mining process. The purpose of this study is to modify the model described in [
10] in order to simulate the initial stage of a borehole explosion.
In
Section 2, we describe the formulation of the problem and the methods used to solve it. In
Section 3, the results from calculating the impact of the high explosive charge detonation, which had a mass of 1000 kg and was placed in a borehole 15 m deep, are presented. The conclusions and discussions concerning approximations, and suggestions for future studies, are presented in the last section.
2. Formulation of the Problem and Methods
For modeling a detonation of high explosive charges in boreholes, we focused on the parameters of commercial blasting that are carried out at the Lebedinsky open pit (Kursk magnetic anomaly). A brief description of commercial blasting at the Lebedinsky open pit can be found in [
5,
6]. In 1996, Lebedinsky GOK became one of Russia’s pioneer producers of emulsion explosives of the type of Tovan based on the technology of ETI, Canada [
6]. For calculations, in this work, we used TNT. This is due to the fact that reliable data on the equation of state for the detonation products were available to us. At the next stage, we are planning to model the actual blasting process. To carry out the commercial blasting in the quarry, the high explosive charge is placed in vertical hole bored in the ferruginous quartzites. Since 2003, rigs with a bit diameter of 295.5–311 mm were used to bore blast holes [
6]. The mass of high explosive charge placed in one borehole is 0.5–1.5 tons. Boreholes are arranged in rows along the ledge of rocks. A group of 3–5 boreholes are detonated simultaneously. The distance between boreholes in a row is approximately 5 m, and distance between rows of boreholes is approximately 8 m.
At this stage of our research, a numerical simulation of the high explosive charge detonation in a separate borehole was carried out in order to develop a methodology of numerical simulation. In addition, the calculations made it possible to estimate the mass of particles and their size distribution in the entire volume. They also enabled us to obtain the distributions of particles of different sizes across space at different points in time. For numerical simulation of a group boreholes detonation, a model will be developed at the next stage. As an initial datum for numerical simulation, a borehole with a depth of 15 m and a diameter of 0.3 m was set.
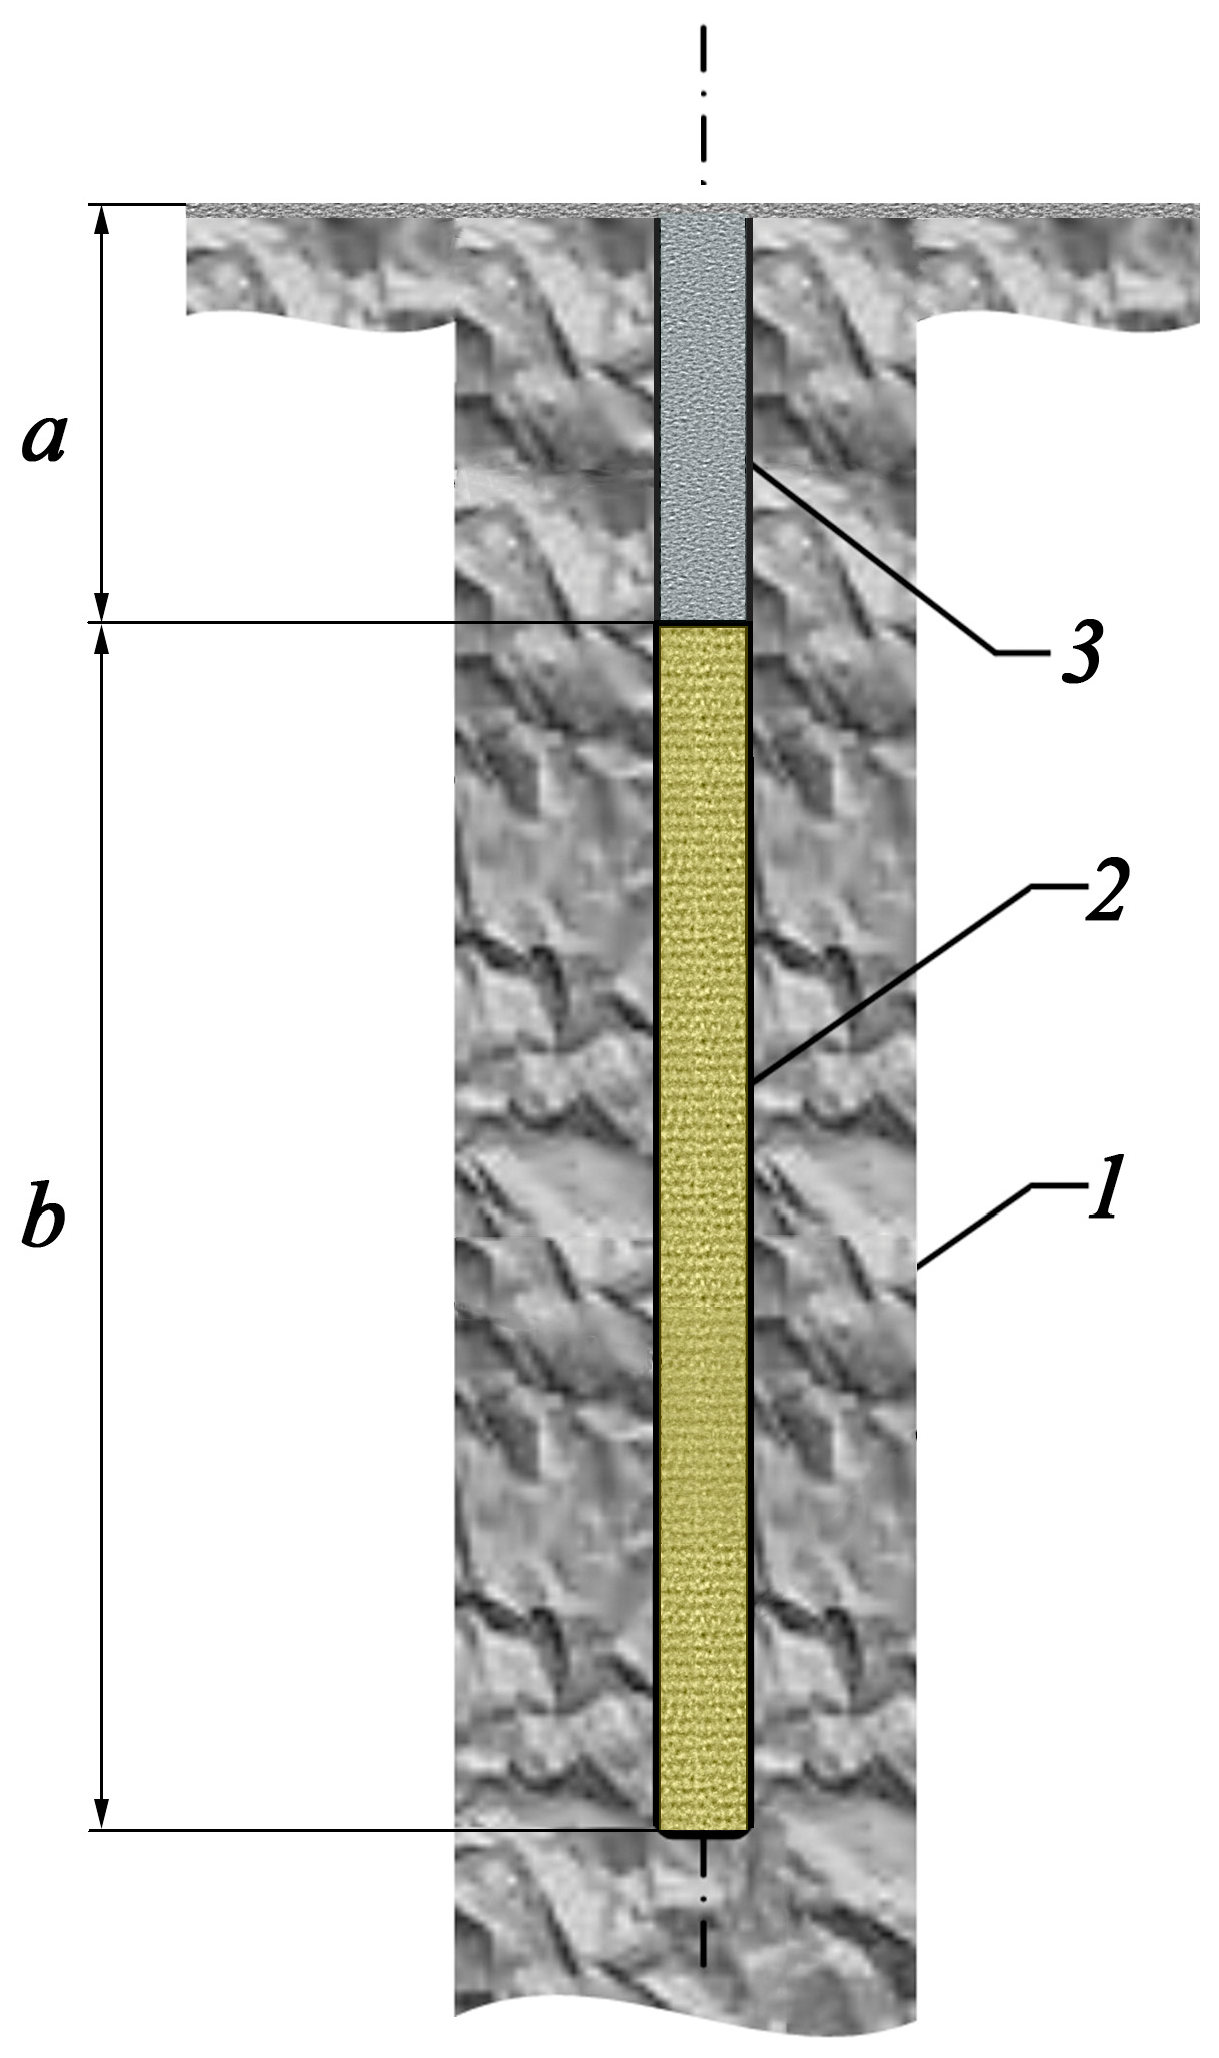
Figure 1 present a schematic emplacement of the high explosive charge in the borehole. The high explosive mass was 1000 kg TNT (Trinitrotoluene equivalent). The TNT density was 1.2·10
3 kg/m
3.
Figure 1 shows that the borehole was stemmed with gravel (smaller particles and stones of ferruginous quartzites). For a specified high explosive mass, the values of parameters
a and
b (
Figure 1) were set equal to 3.5 m and 11.5 m, respectively.
Our research was based on a model that was developed to simulate dust cloud formations for cases where 500 TNT explosions occur on the surface of the rock [
12]. The model was constructed using the SOVA fluid dynamics software package [
13,
14]. The software was capable of simulating complex fluid dynamics processes. For the numerical simulation of a borehole explosion, a complex model [
12] was modernized for using borehole initial conditions. The new model enabled the calculation of complex explosive fluid dynamics processes which had strong discontinuities in their physical parameters. The model accurately described the boundaries between rocks, detonation products, and air. In addition, the model allowed for the possibility of converting the substance ejected from the explosion crater into discrete particles (smaller particles and stones); it is also possible to calculate the motion of these condensed particles and their interaction with the gas flow within the framework of equations for multiphase media motion [
15].
The complete system of equations is as follows:
Here (and in the rest of this paper), the following notation is used: ψ—volume concentration of condensed particles; ρ—density; v and u—velocity components along the r and z axes; p—pressure; T—temperature; —total energy per unit mass; ε—internal (thermal) energy per unit mass; ri—radius of condensed particles; g—gravity acceleration; Cd—drag coefficient; σ—Stefan–Boltzmann constant; ag and es—particle absorption and emissivity; ν—gas kinematic viscosity; cp—heat capacity at constant pressure; Ry and Pr—Reynolds and Prandtl numbers, respectively. The index “i” refers to the particle parameters with radius ri.
When calculating the formation of a funnel, the influence of dry friction on the movement of rocks is taken into account; this is based on a model similar to that described in [
16]. All details of the numerical procedure were described in [
12,
13,
14].
The semi-empirical equation to determine the state of TNT detonation products [
17], tables detailing the thermodynamic properties of air [
18], and the tabular equation to determine the state of quartz were obtained using the ANEOS software package [
19]; these equations and tables were used in the calculations below, and the effect of gravity was taken into account. The distribution of air density and pressure in the atmosphere along the height of the Earth’s equilibrium was set in accordance with the CIRA model (COSPAR International Reference Atmosphere).
The process of propagating the detonation wave was not considered; it was assumed that the initial energy of the detonation products was stagnant at 4.18 kJ/g during the initial moment. The initial density of the rock (including in the upper part of the borehole) was 2.65 g/cm3, the cohesion was 2 × 10⁸ Pa, and the coefficient of internal friction was 0.6.
High pressure in the detonation products caused the propagation of the shock wave in the rock, as well as its deformation and movement. As a result, the borehole diameter increased. After the shock wave reached the surface, the destroyed rock above the borehole began to rise and expand, while its density decreased. Volumes of rock that rose to a height of more than one meter and had a density that was two times less dense than its initial density, turned into discrete particles. The total mass of the particles was equal to the mass of the rock in the considered volume; the size distribution of the particles may be calculated using the power law, as follows:
where
N(
m) is the number of particles with a mass greater than
m. The exponent
b changes from 0.4 to 0.6 for a single fracture, to a value close to unity for multiple fractures [
16]. In these calculations,
b = 0.7. The constant
a is determined by the mass of the considered volume. The maximum particle size was equal to 0.3 m (initial borehole diameter) and the minimum particle size was 3 × 10
−6 m. The movement of the condensed particles, and their interaction with the gas flow, can be described using the framework of equations for multiphase media motion [
15]; a more detailed explanation of this process was described in [
12]. The particle diffusion coefficient was considered equal to 10 (
r0/r) m
2/s, where
r0 = 10
−5 m, and
r is the particle size. This value enabled us to calculate the size of the cloud, which corresponded with the results of real commercial blasting [
20,
21].
3. Results
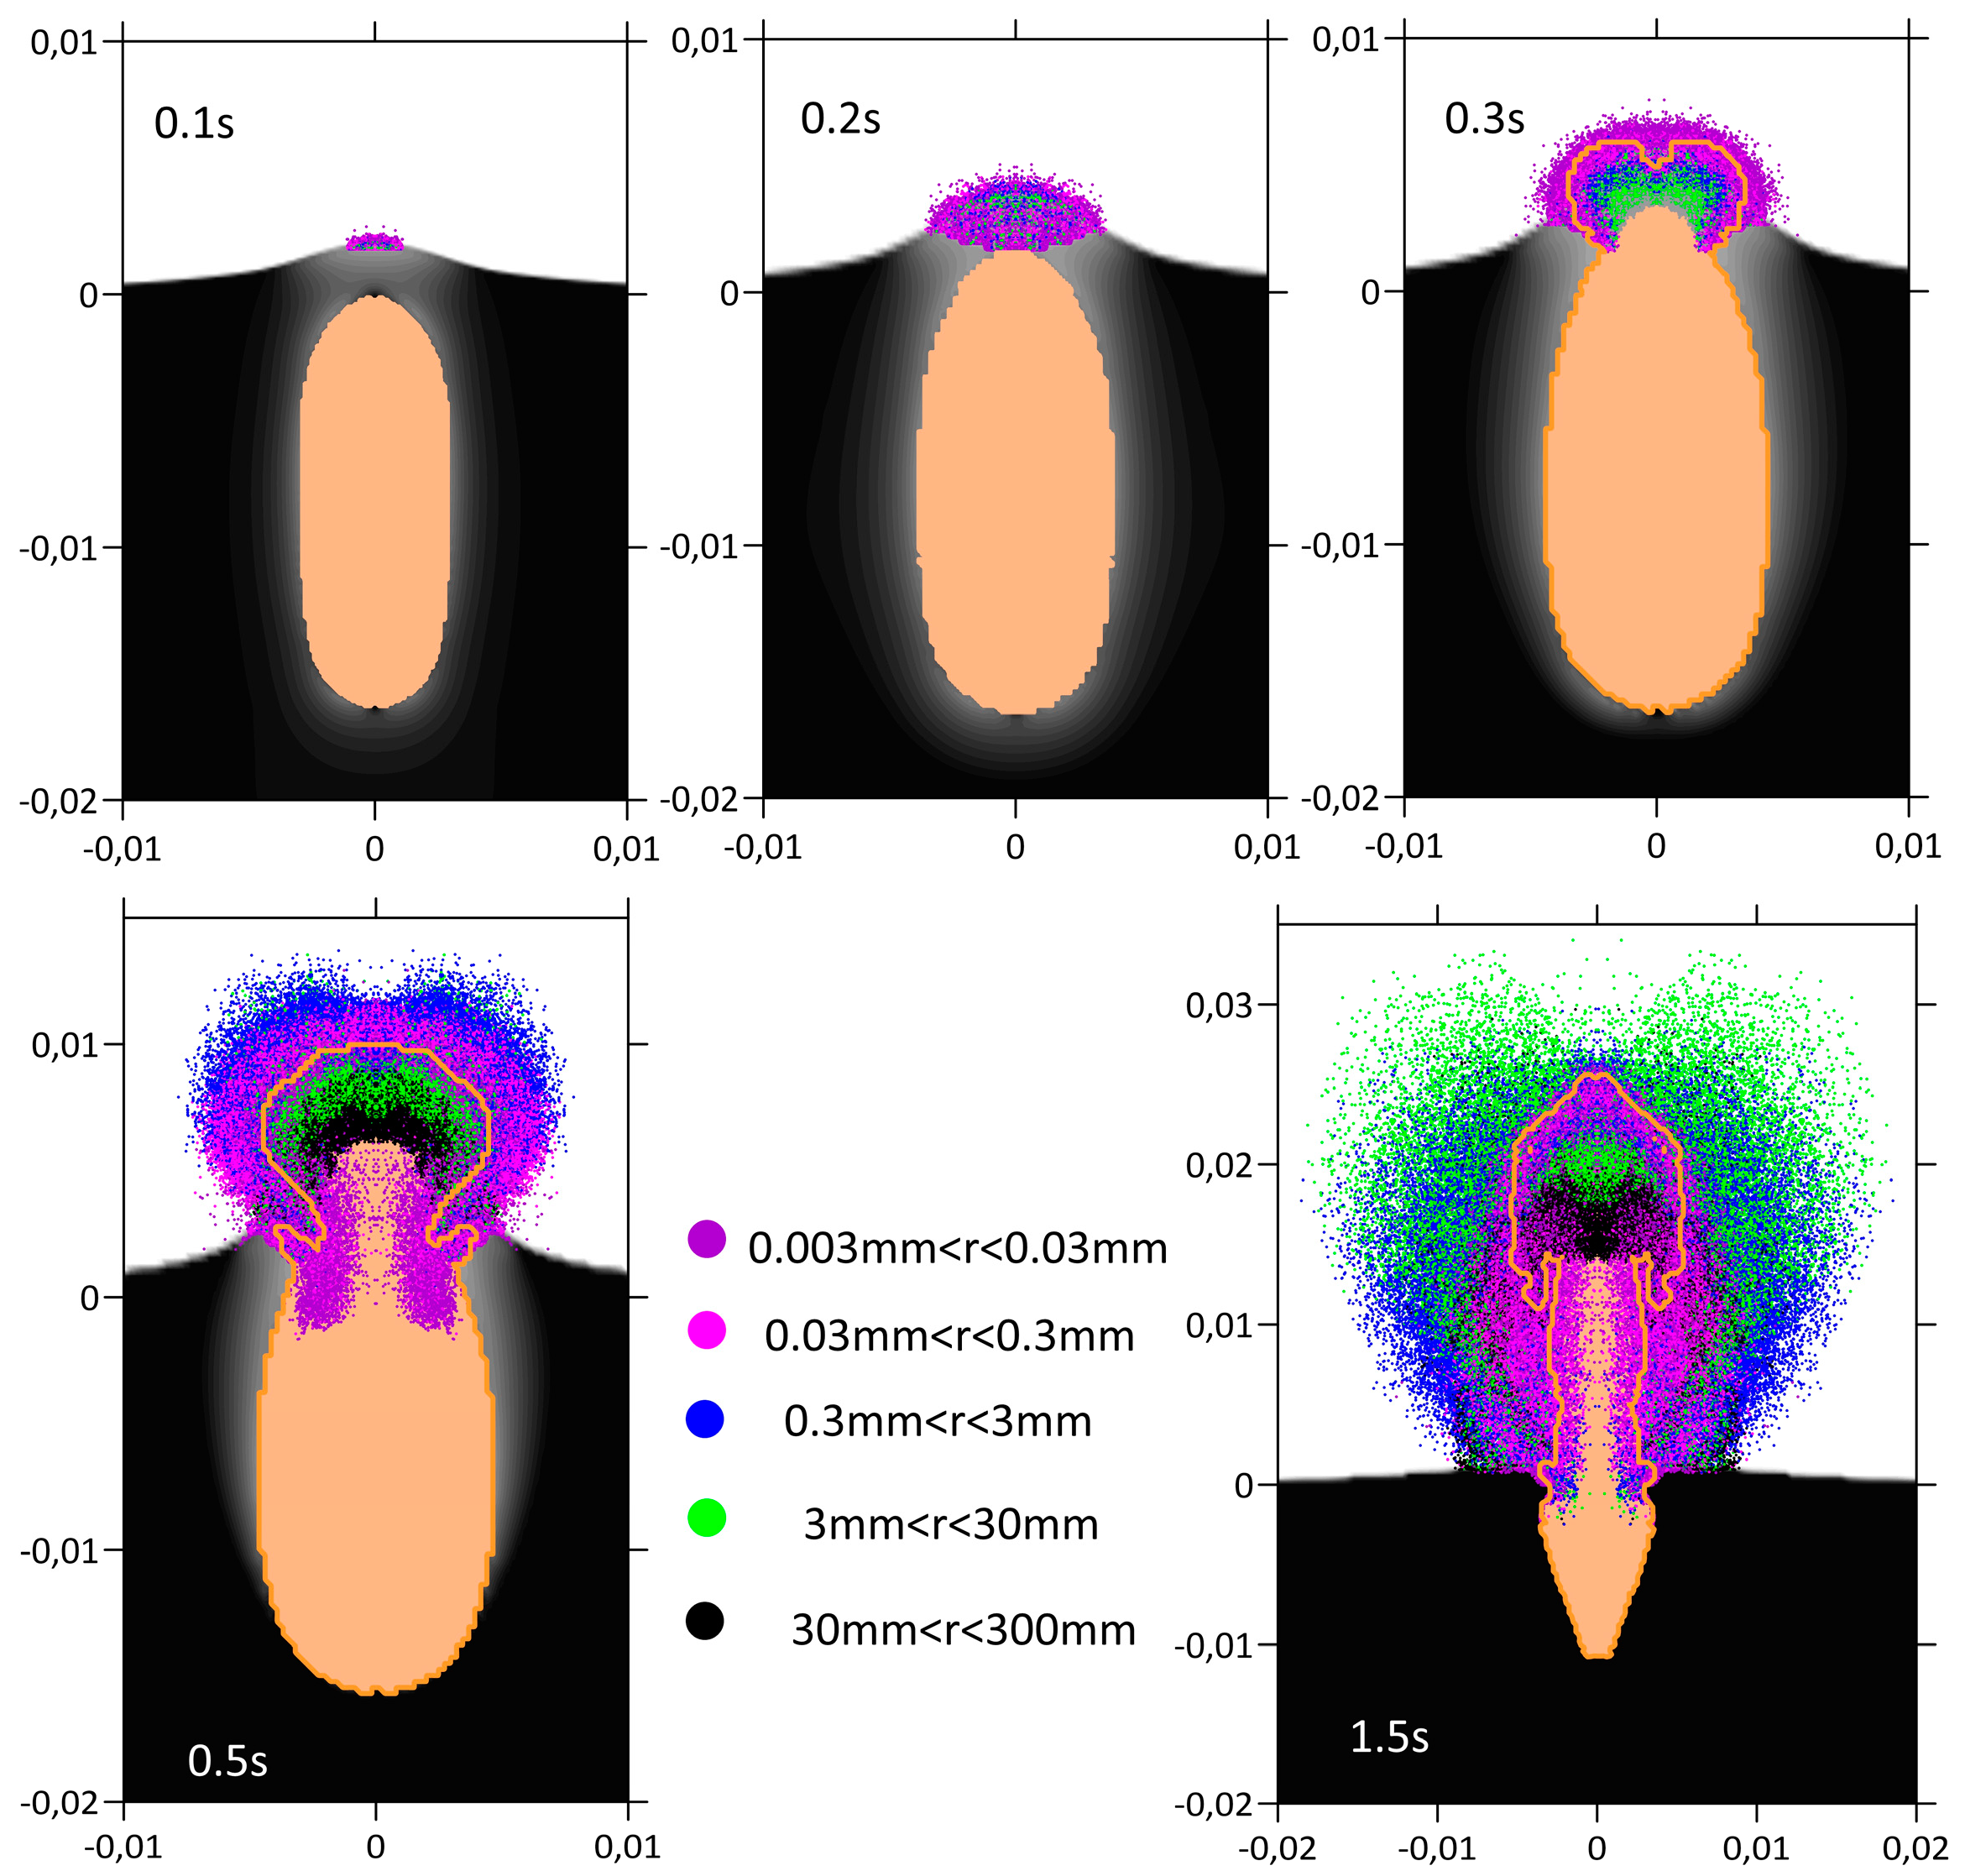
Figure 2 shows the initial stage of borehole explosion. The panels in this figure show the five successive moments of explosion development, from 0.1 s to 1.5 s. As is evident from
Figure 2, the rock decompressed and accelerated in the vertical direction. Decompressed rock which rose to a height of more than a meter turned into a set of particles (fragments of different sizes). The detonation products penetrated the particle cloud and further accelerated the movement of the particles, especially the small particles which were pulled forward; then, the smallest particles decelerated in the air and the heavier particles moved ahead. The largest particles weakly accelerated as a result of the expanding detonation products, and they showed almost no deceleration in the air.
After t = 1.5 s, the detonation products were replaced by air; the air had the same density and the same level of pressure as the detonation products. This occurred because the size of the computational cells grew over time; after t > 1.5 s, the cells reached a size of 20 cm. This did not allow for an accurate description of the mixing of detonation products with air. In addition, at t > 1.5 s, the movement of the rock was not considered; at this point, the rock was considered to be immovable. This made it possible not only to reduce the number of calculations that were performed, but also in addition to significantly increasing the time step, which is determined mainly by the high speed of the soundwave in the ground.
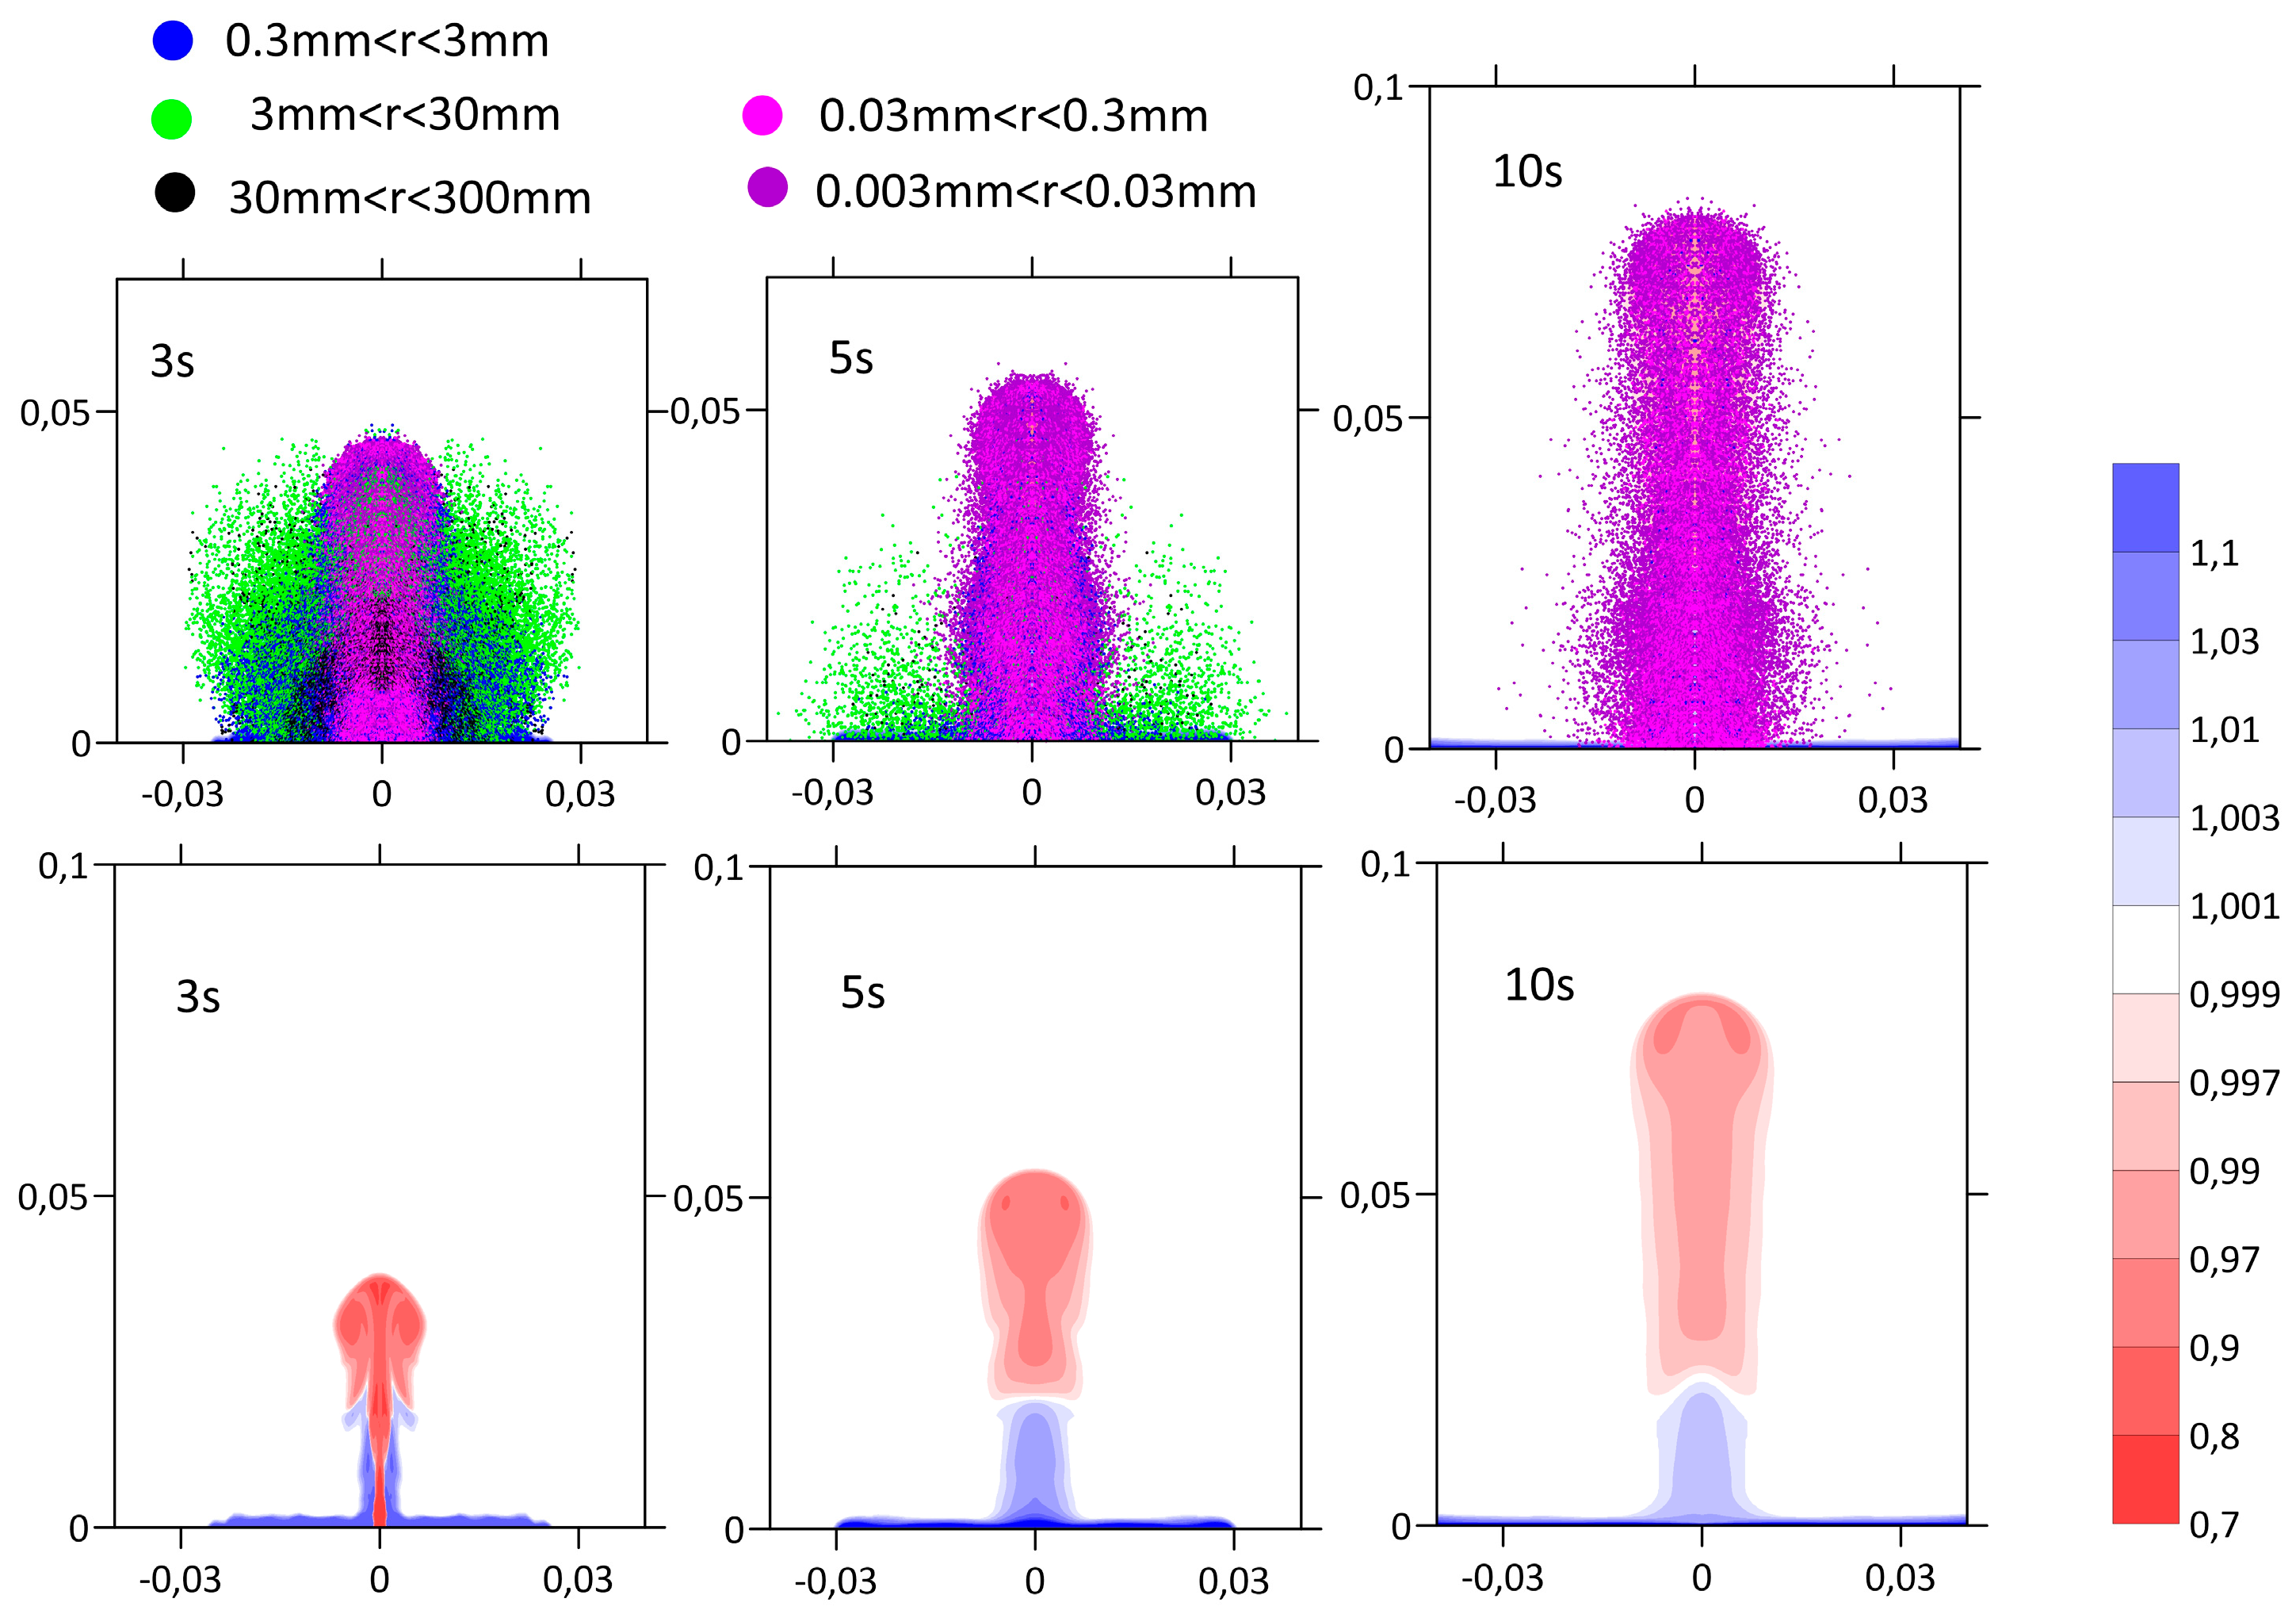
Figure 3 shows the further development of the explosion. After 10 s, most of the large particles (a millimeter in size or greater) settled on the surface. Smaller particles, together with rarefied air (which imitated the detonation products that mix with the surrounding air), rose. During the first 10 s, the rising particles resembled an upward jet; this was juxtaposed with the buoyancy-driven, lighter volume of particles. The initial density of the detonation products (after expansion to atmospheric pressure) was 5–10% less than the density of the surrounding air.
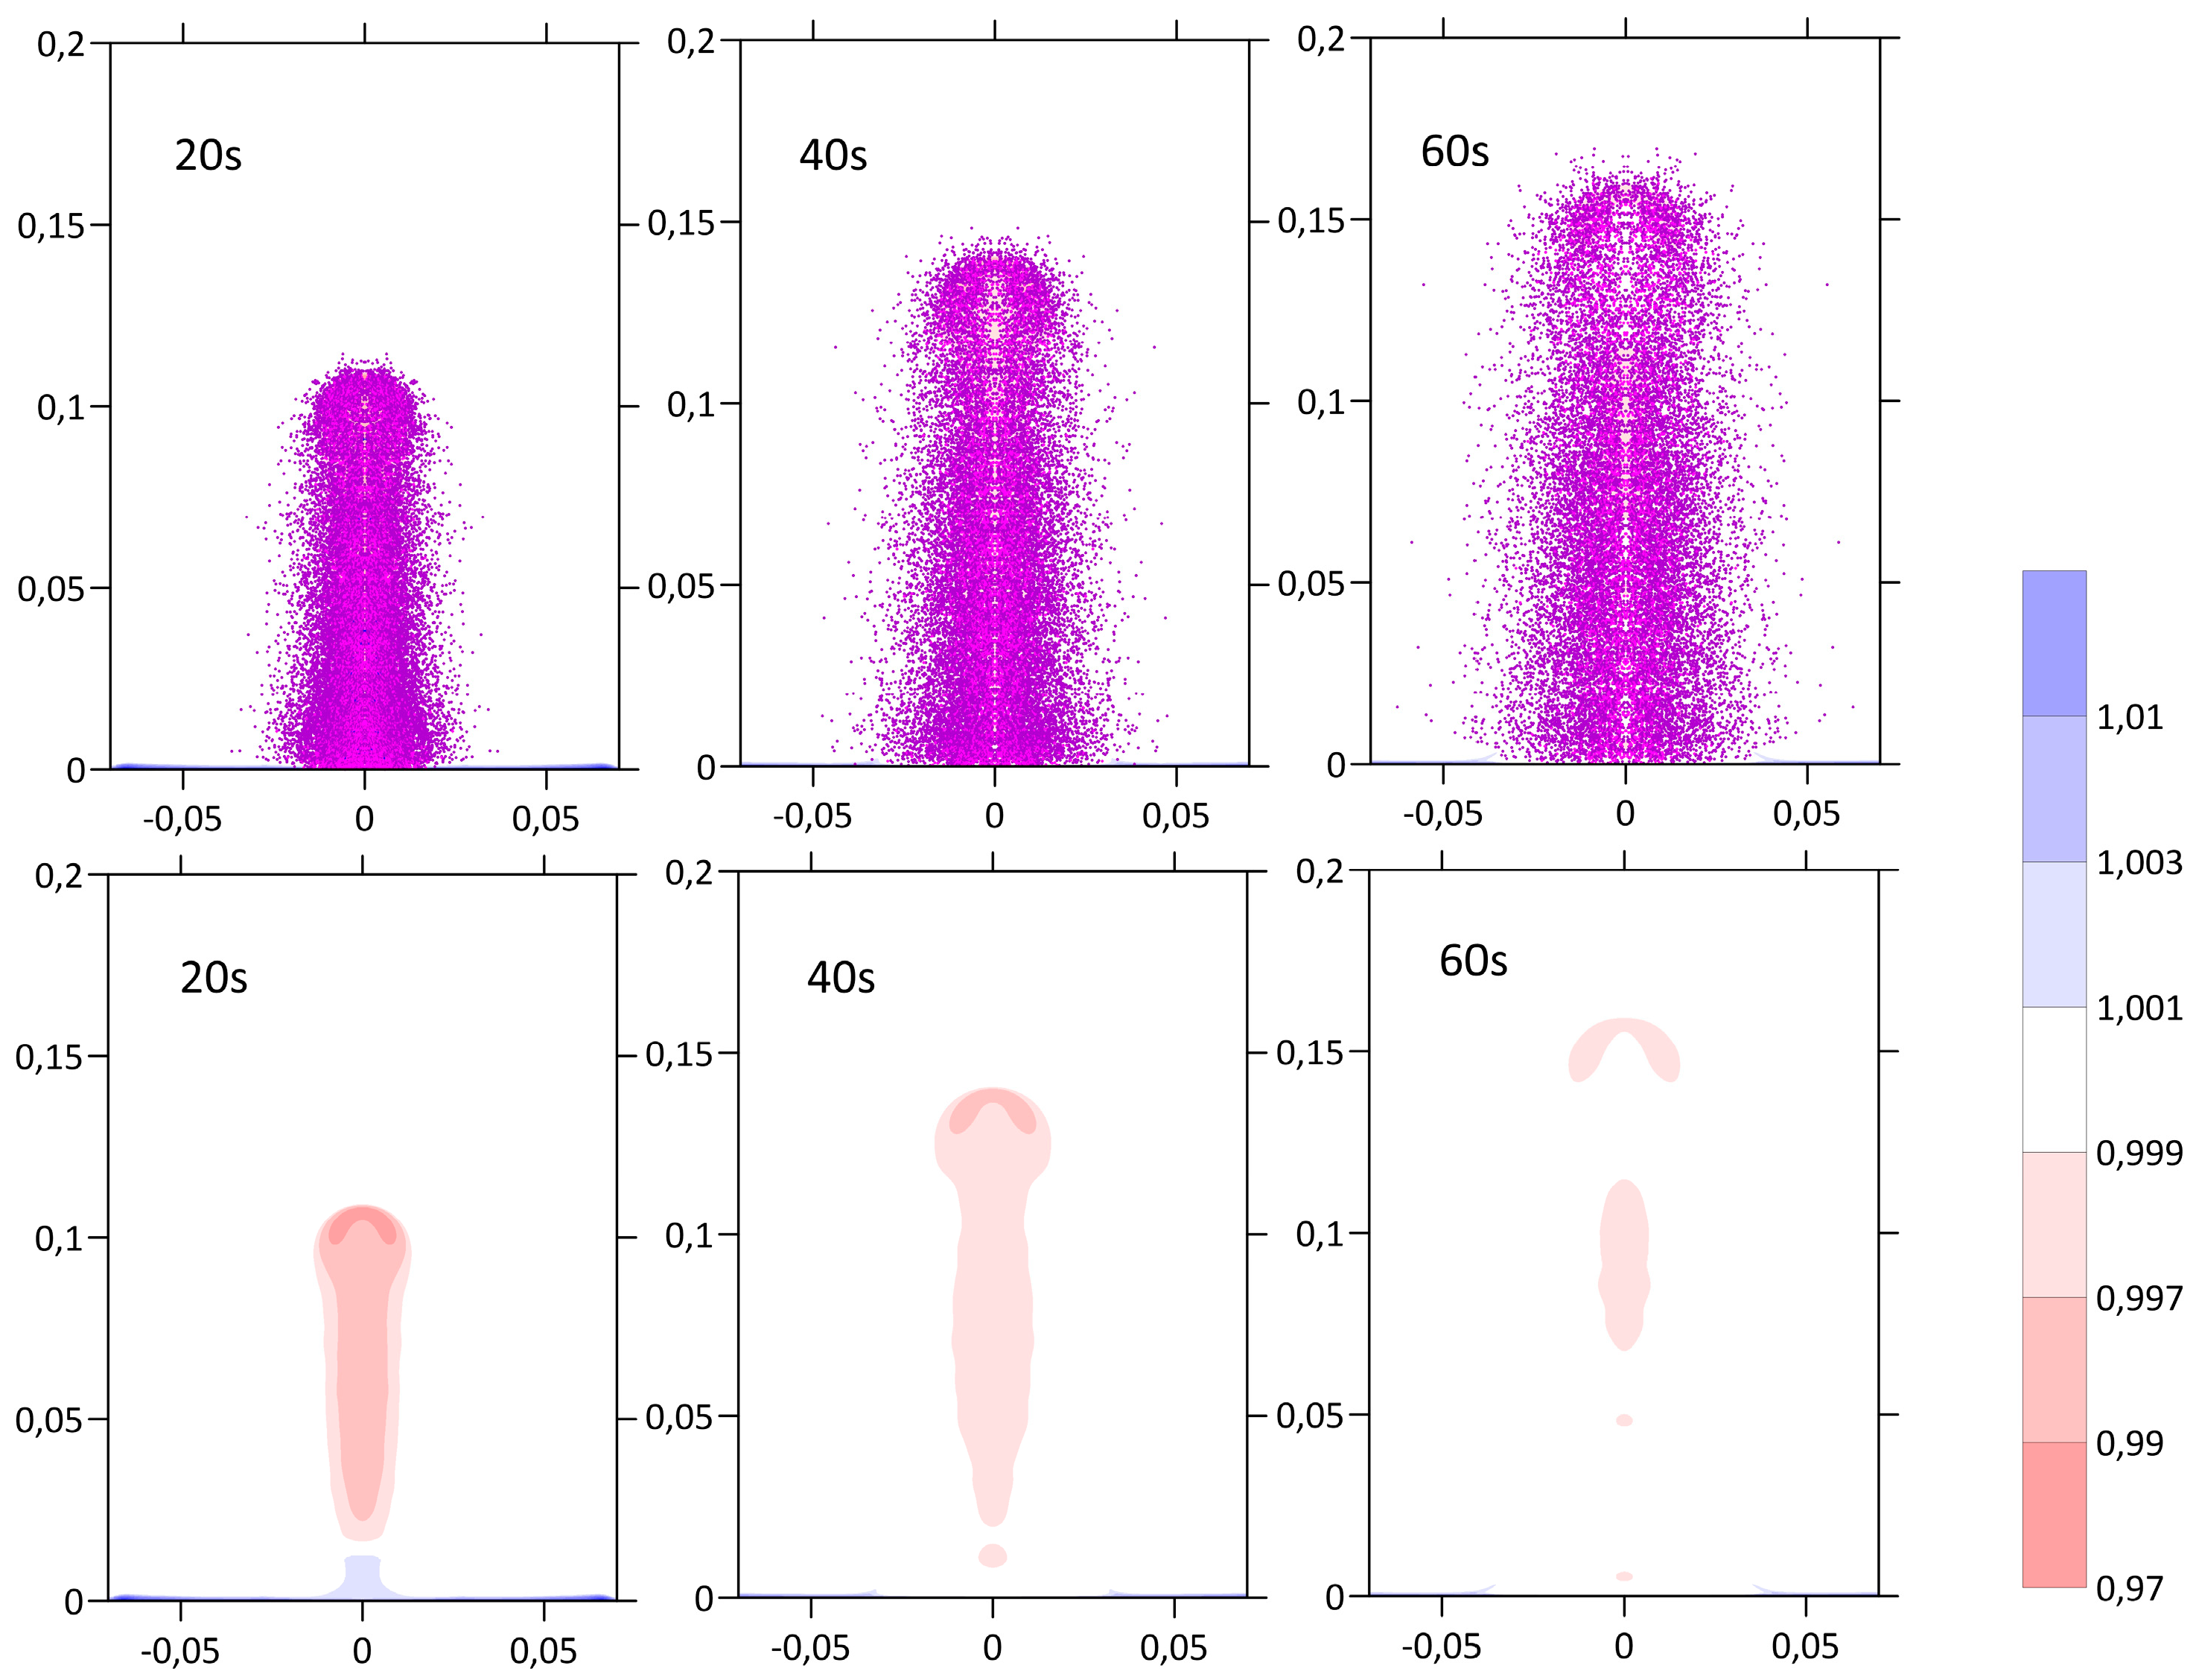
During the entire first minute (see
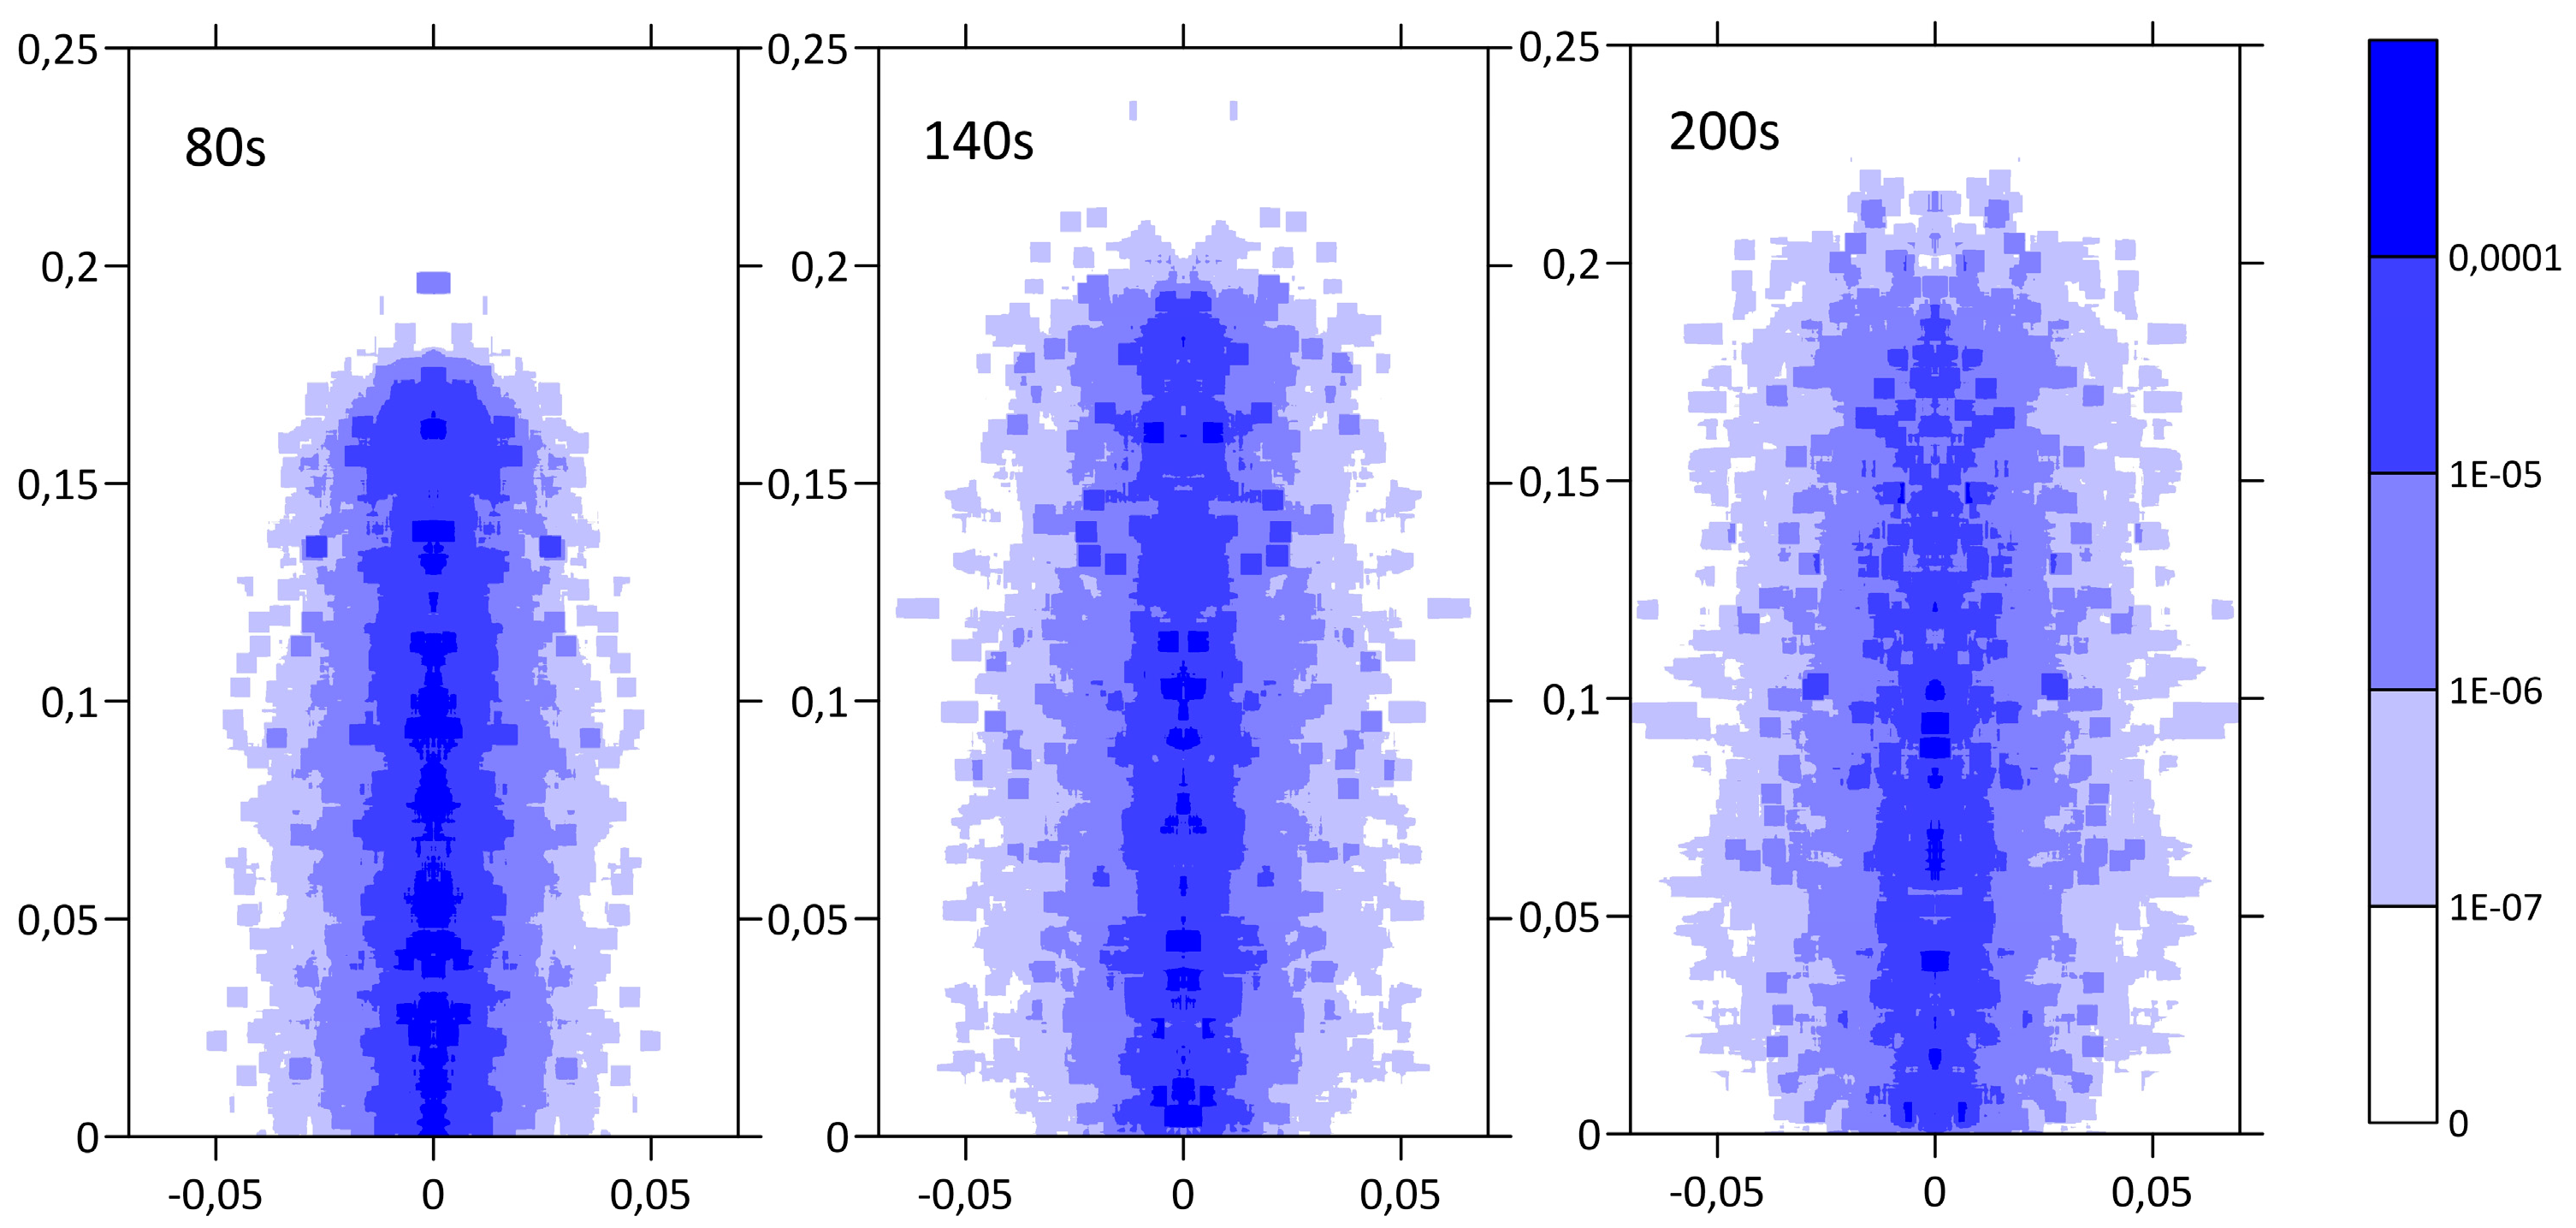
Figure 4), the jet consisting of air, detonation products, and fine (3–300 microns) dust continued to rise to a height of approximately 170 m. The air density at the end of the first minute was compared with the density of the surrounding air. The continued evolution of the cloud was determined mainly by diffusion (see
Figure 5). The bulk density of the dust in this moment was significantly less than the density of the air. In fact, at this stage, the wind and its distribution (in terms of height) played an important role. Moreover, as soon as the explosion occurs, the wind can have a noticeable effect on the formation and evolution of a gas and dust cloud-jet; however, the two-dimensional axis-symmetric model used in this study did not allow us to take this into account, and, thus, we could not study this effect.
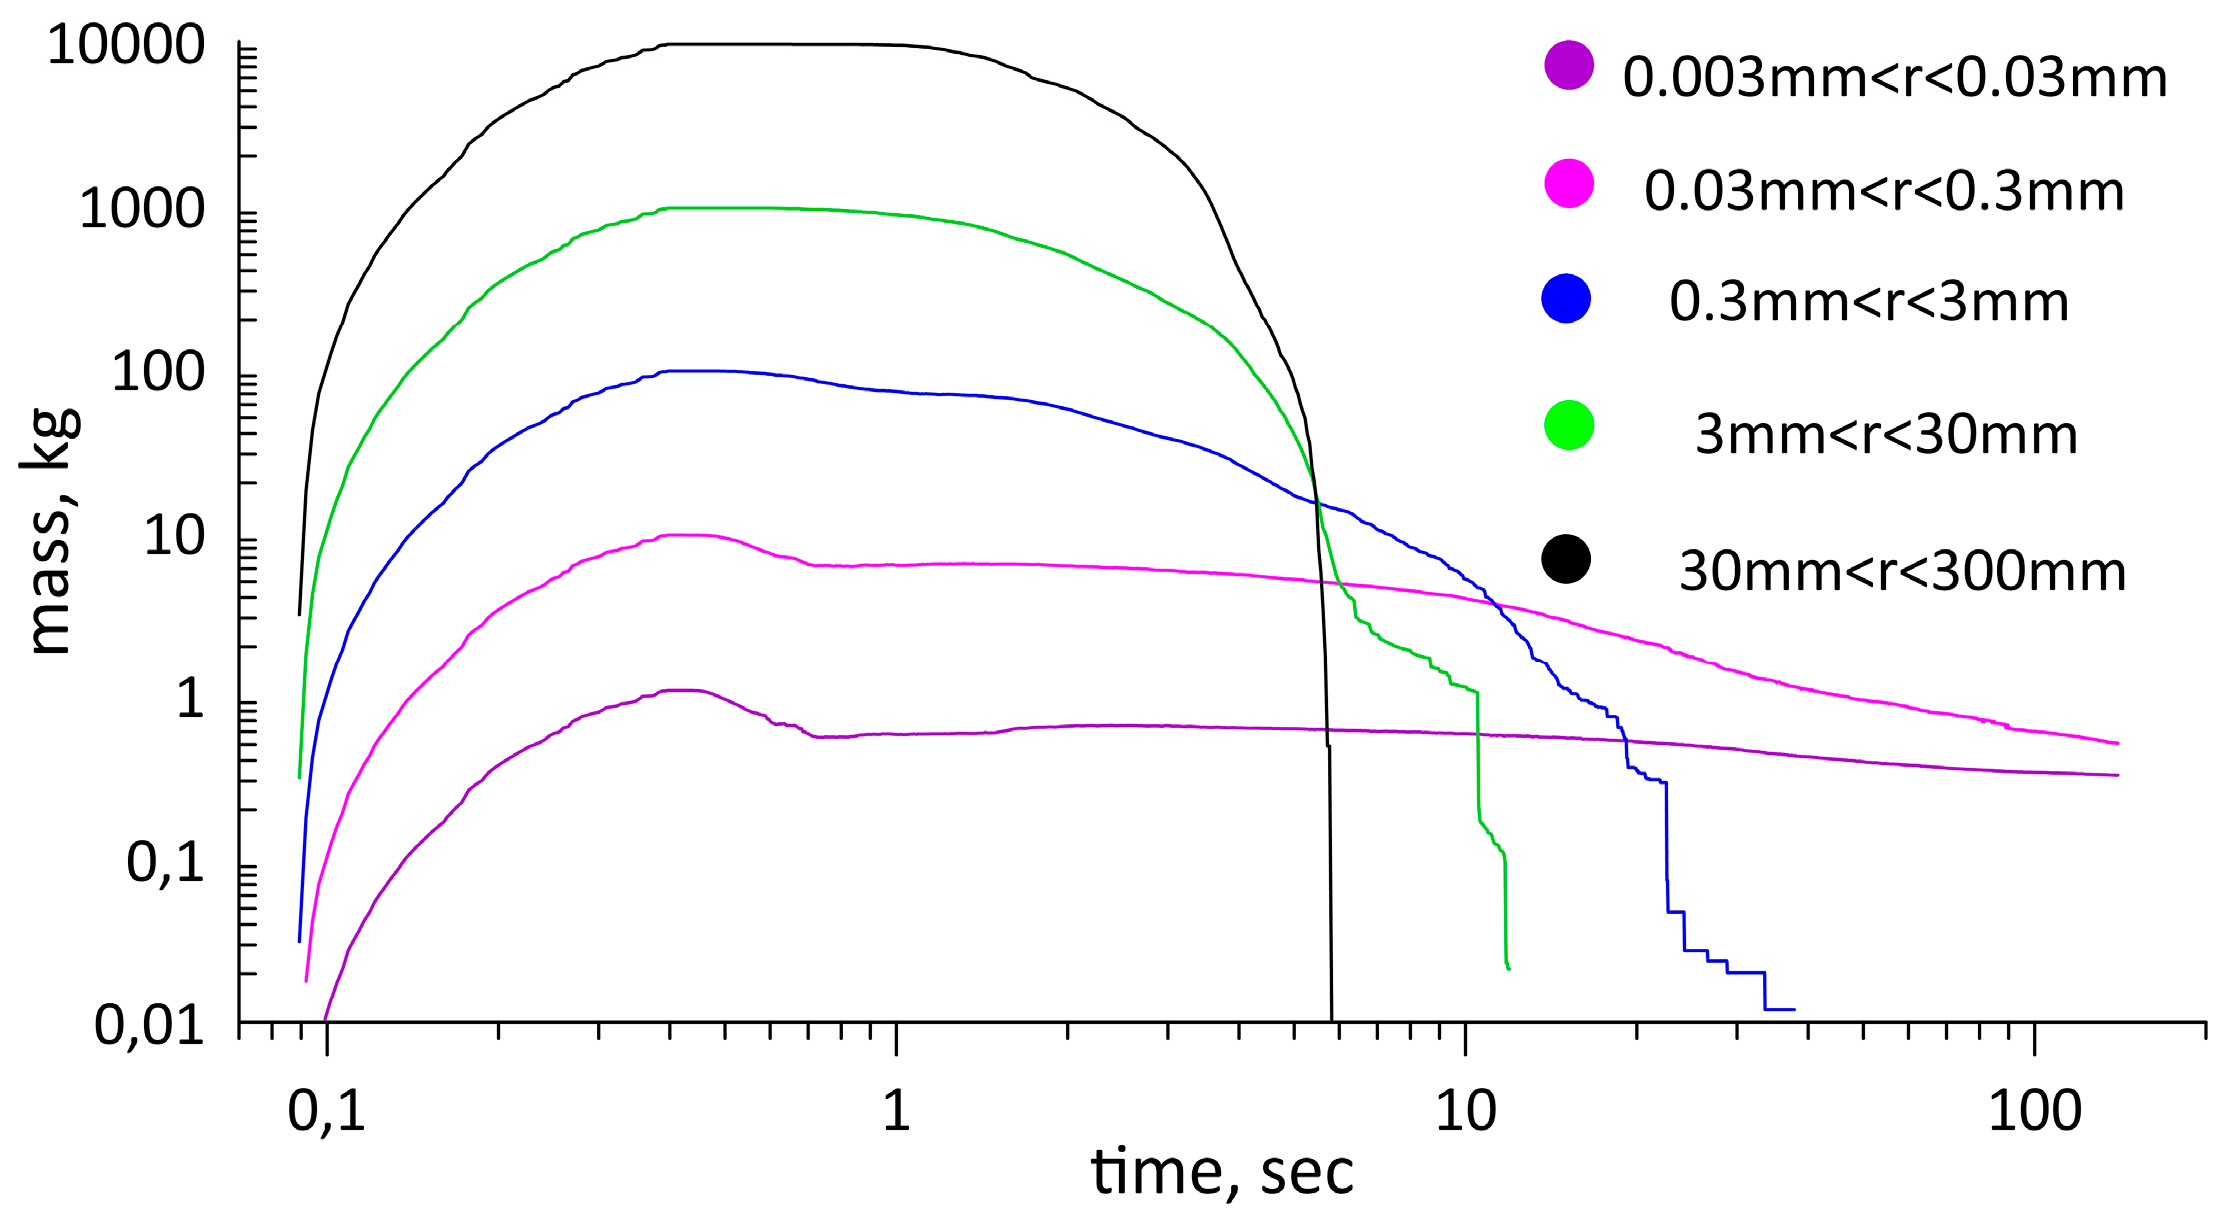
The change over time in terms of dust content (which was composed of differently sized dust particles) in the atmosphere is shown in
Figure 6. The largest fragments, which moved at a speed of 20–30 m/s, fell to the surface in 5–6 s; then, smaller particles were deposited onto the surface. After 30 s, only particles smaller than 300 µm remained in the air: 1.91 kg of particles with a size of 30 µm <
r < 300 µm and 0.49 kg of particles with a size of 3 µm <
r < 30 µm. After 200 s, 0.64 kg and 0.36 kg of each particle size remained, respectively.
4. Discussion
The calculations enabled us to describe the formation and evolution of the gas and dust cloud formed after the detonation of high explosive charges in boreholes. They also enabled us to obtain the distributions of particles of different sizes across space at different points in time; however, the model used relied upon numerous assumptions and simplifications. First, there was some arbitrariness with regard to choosing the particle size distribution, and there was no turbulent mixing. The power law (12) for size distribution was an approximation, in which the constants may depend on the type of rock, the power of the explosive, the method of hole tamping, and so on. The effect of turbulent viscosity on the dynamic flow of gas was not taken into account when performing the calculations (although the viscosity scheme partly models small-scale turbulence); only the turbulent diffusion of particles was taken into account when performing the calculations. The calculations considered an explosion of TNT, for which there was a good equation of state, whereas, for real explosions, cheaper and less powerful explosives are usually used in quarries. Finally, the wind, which can noticeably influence the formation and rise of a gas and dust cloud, was not taken into account. Nevertheless, it should be noted that the difference between our approach and others was that we consistently considered all stages of the explosion from the release of energy in the borehole to the rise of the dust cloud to the maximum height.
The height of the dust cloud may depend on the adopted particle size distribution. The finer the dust particles that are contained in the gas–dust jet, and the more energy that is spent on its acceleration, the lower the initial velocity of the jet, and the greater the density of the dust; thus, the cloud will be shorter. To assess the effect of the mass of fine dust on the height of the cloud, two more calculations were performed; in the second calculation, the mass of the fine dust was significantly greater than in the first, wherein the effect of dust on the gas flow was not taken into account at all. In accordance with the distribution law (12) used in this study, the amount of fine dust was determined by two parameters, namely, the constant b and the size of the maximum particle. If, instead of the maximum particle size of 30 cm, we used 3 cm as the maximum particle size, then, the mass of fine dust will be significantly greater than in the first variant. In calculations that took this into consideration, the height of the gas and dust cloud was 1.5–2 times shorter than in the first variant. In calculations that did not take the influence of dust on gas flow into consideration (or that took a very small mass of fine dust into consideration), the height of the cloud was approximately 10% taller than in the first variant.
Despite these approximations and simplifications, the model correctly and qualitatively described the evolution and rise of a gas and dust cloud-jet. Furthermore, the model enabled the estimation of quantitative characteristics (the mass of particles of different sizes and their spatial distribution at different times); these are impossible or very difficult to determine experimentally.
