Article

Rock Fall Hazard Analysis for In-Pit Operations Potentially Impacting External Sensitive Areas

1
Department of Civil and Environmental Engineering, University of Alberta, Edmonton, AB T6G 2R3, Canada
2
Klohn Crippen Berger, Lima 15074, Peru
3
Compañía de Minas Buenaventura, Lima 15046, Peru
*
Author to whom correspondence should be addressed.
Mining 2021, 1(2), 135-154; https://doi.org/10.3390/mining1020009
Submission received: 22 April 2021 / Revised: 9 June 2021 / Accepted: 11 June 2021 / Published: 23 June 2021

Abstract

:
Controlling rockfall-related risks is a requirement for safe pit operations and primarily mitigated through adequate bench geometry design and implementation. This paper presents a method for rockfall hazard analysis for in-pit operations potentially impacting external sensible areas, adapted from natural rockfall hazard analyses. The method considers the natural susceptibility to rockfalls pre-mining, rockfalls originated from bench failures, and those initiated as flyrock. Rockfall trajectory models are used to estimate the potential for blocks reaching exposed elements. Natural susceptibility to rockfalls and trajectories are used as a baseline on which to evaluate the potential effects of open pit operations on the environment and perceptions of communities in the area. The method is illustrated for an open pit in steep terrain in the Peruvian Andes at a feasibility level of study. The paper illustrates the flexibility for including considerations of pre-mining rockfall impacts on the external elements of interest, and for developing rockfall mitigation strategies that consider rock block velocities, heights, energies and the spatial distribution of trajectories. The results highlight the importance of considering the three-dimensional effects of the terrain on block trajectories, and how such insights allow for increasing the efficiency of resources available for rockfall protection structures.

1. Introduction

Rockfall sources during open pit operations can be ubiquitous and extremely difficult to predict [1]. After blasting and bench cleanup and scaling, further rockfall occurrences can be a symptom of poor design implementation (e.g., poor blasting or scaling practices) or a result of natural weathering and freeze–thaw action [2] at the bench slopes. Controlling rockfall hazards is a requirement for safe pit operations, as these pose risks to personnel and equipment [3,4], and are primarily controlled through bench geometry [1,5,6]. Rockfall catchment effectiveness in sensitive areas (e.g., location of infrastructure or active mining with personnel exposed) is commonly evaluated through 2-dimensional and 3-dimensional rockfall trajectory simulations [3,4,7]. During blasting operations, flyrock risks are controlled through blast designs that optimize fragmentation while minimizing flyrock, and safe evacuation distances for personnel and equipment.
In mountainous areas, open pit operations commonly initiate on steep slopes. Depending on the geometry of the ore body, topography and lease boundaries; rockfalls and flyrock can be contained within the pit boundaries (Figure 1a) or the possibility remains for falling material to exit these boundaries (Figure 1b). In the latter case, elements downslope from operations (e.g., mining components, sites of cultural importance, sensitive environmental areas, land owned by third parties) could be exposed to falling rock.
This paper presents a method for rockfall hazard analysis for in-pit operations potentially impacting external sensible areas. The method considers the natural susceptibility to rockfalls pre-operations, rockfalls originated from bench failures, and rockfalls initiated as flyrock. Rockfall trajectory models are then used to estimate the potential for rockfalls reaching elements of interest. When evaluating all rock hazards to environmentally sensitive areas, the natural susceptibility to rockfalls and their trajectories can be used as a baseline on which to evaluate the effects of open pit operations. The method is then illustrated for an open pit in the Peruvian Andes at a feasibility level of study.

2. Methodology Adapted from Natural Rockfall Analyses to an Open Pit Context

The method in this study was adapted from [8], in which an approach is presented for identifying critical locations for rockfall hazard investigations in large areas based on susceptibility mapping and efficient three-dimensional trajectory modelling. Here, their method was modified to include relevant information in the context of mining, and to include hazards originated as bench failures or flyrock. The general work flow for the method is presented in Figure 2. The method starts leveraging information common to mining operations, including high-resolution digital elevation models (DEM) (1 to 5 m resolution, typically as elevation raster), aerial photography, pit layout (and phases, depending on the level of temporal detail for the analysis), and site investigations (e.g., site reconnaissance for fallen rock blocks, unstable slopes, etc.).
This information is used to develop thematic maps, including the study area within the scope of work, slope inclination values, topographic roughness (named topographic contrast) and soil and vegetation cover. In the case study presented in this paper, Esri’s ArcGIS version 10 (http://www.esri.com, accessed 18 June 2021) was used to develop these thematic maps utilizing an elevation raster with a definition of 2 m × 2 m. These thematic maps are then used to develop a rockfall susceptibility map that defines the rockfall detachment locations (seeders) for the trajectory simulations associated with natural phenomena (pre-mining—before the topography is modified by mining operations). The pit geometry and the layout of the different pit phases define the seeders for the trajectory models associated with bench failures and flyrock. Soil and vegetation cover are used to define the characteristics of energy loss throughout the trajectory. A rockfall hazard assessment for elements outside the pit can then be performed on the basis of these modelled trajectories.
The level of detail of the methodology is flexible, and can consider the extent of the pit or individual phases for feasibility-level studies, or detail pit topography for different pushbacks for more advanced study levels. The following sections describe the steps of the methodology.

2.1. Susceptibility to Naturally Occurring Rockfalls Pre-Mining

Several approaches for rockfall susceptibility mapping have been proposed, including those in [9,10,11,12,13,14]. Most approaches focus on topographic characteristics (e.g., [10,13]), with others highlight the effect of rock mass quality and structure (e.g., [14]). The approach developed here uses topographic characteristics, following [8], and it is suggested that the effect of rock mass quality and structure in rockfall likelihood can be complementary once the critical rockfall sources (those that could reach the elements of interest) are identified. This sequence optimizes the resources available for detailed field investigation for rockfall potential and is consistent with the other methods referenced. The rockfall susceptibility can be calculated following Equation (1) (this study), however the approaches described in the above references can also be adopted. All these have shown to provide adequate susceptibility maps through published calibration.
R o c k   f a l l   s u s c e p t i b i l i t y   ( t o p o g r a p h y ) = W B B + W C C + W D D ,
In Equation (1), B is a ranking between zero and 10 that represents the steepness of the terrain. The criterion for this ranking is presented in Table 1, according to [8].
The value of C is a ranking that represents topographic contrast. Sharp topographical contrast can identify portions of steep slopes where rock block can potentially detach. This can be assessed by comparing highly detailed DEMs against smoothed DEMs (by subtraction), therefore highlighting zones with sudden variations in topographic relief (Figure 3). The criterion for defining the value of C for the calculated topographic contrast is presented in Table 2. It is important to note that this criterion was calibrated to the study area in order to highlight areas of higher contrast within the characteristics of the local topography. In this regard, the criterion needs to be selected through an iterative process that balances potential block detachment dimensions that can be identified and area coverage that permits clear definition of potential detachment blocks. The value of 0.3 m selected through the iterative process indicates that outcropping blocks of 0.3 m equivalent size or larger can be identified.
The Value of D corresponds to a ranking that reflects the soil and vegetation cover. It is understood that rock blocks are more likely to detach from bare rock slopes or slopes with limited soil and vegetation cover. Cover can be identified visually from aerial photographs or through analysis of red, green and blue (RGB) values. D values of 5 and 10 were adopted in [8] for vegetated areas and for non-vegetated areas with limited soil cover, respectively.
WB, WC, and WD are the weights between zero and 1.0 for the values of B, C and D, respectively. The weights are shown in Table 3 after [8], which were developed based in the work by [11,12,13]. These are constant and not specific of the study area.
Validation of the susceptibility map is recommended. This can be done through field observations of the detachment areas (showing clear scars of recently detached blocks), talus slopes, and fresh to slightly weathered blocks. Air photos can also be used to identify active talus deposits and active rockfall paths (path identified due to scarce vegetation).

2.2. Natural Rockfall Frequency

Calculating rockfall frequencies, and more importantly frequency-volume relationships, requires the historic database of rockfall occurrences within the area of interest, particularly the frequency of falling blocks reaching the location of the elements of interest. This is unlikely to be available at greenfield projects. Rockfall frequency–volume relationships can be estimated based on field mapping of blocks and assumptions about the morphology of the site. An example of a case study in [15] adopted window mapping of blocks near the toe of a steep rock wall adjacent to a highway, estimated time since last glaciation, and anecdotal road maintenance records in order to estimate the frequency–volume relationship of rockfalls at their site.
Detailed hazard assessments should consider the potential for falling blocks to reach the elements of interest through field mapping and trajectory modelling, block heights and velocities, and the frequency–volume relationships. Feasibility level assessments are likely to be required at sites with little to no records; in order to identify areas for detailed field investigations. These feasibility studies can make use of air photographs and trajectory models to highlight rockfall detachment areas that can potentially reach the elements of interest [8].

2.3. Location of Rockfall Initiation Points (Seeders)

Rockfall trajectory models require the location of rockfall initiation as input. These locations, also termed ‘seeders’ are defined based on the susceptibility map for natural rockfalls. Rockfall seeders for the trajectory models need to cover all areas where moderate and high susceptibility has been identified through the susceptibility map. This can be done automatically in ArcGIS converting the elevation raster to points with attributes that reflect the susceptibility ranking and eliminating those with lower susceptibility values. When evaluating the trajectories, a higher importance weight can be given to trajectories initiating from highly susceptible locations as opposed to moderate ones. This weighting can be qualitative or quantitative when a count of trajectories reaching the elements of interest is used as one metric for hazard assessment.
The location of seeders for rockfalls originating as bench failures or as flyrock should cover the layout of the pit, or the location of operations that has been selected as a matter of the evaluation. This can be done manually or automatically in ArcGIS by creating a grid of points within the areas to be evaluated. This is a critical step, as it will define the potential hazard locations and falling block heights and energies for protection design. These sources need to be reviewed by the geotechnical group and mine planners such that they reflect the areas of active operations and the requirements of the hazard assessment from a geotechnical perspective.

2.4. Rockfall Trajectory Modelling

Large area analyses need to consider the three-dimensional effects of topography. Additionally, analyses over large areas need to balance an adequate representation of the physics of falling, bouncing, rolling and disaggregating blocks; with modelling efficiency. A number of tools are now available for such analyses, many taking advantage of geographical information systems (GIS) tools. Rockfall trajectory modelling in this study was done using Rockfall Analyst (RA), which is a 3D rockfall trajectory modelling extension for ArcGIS [11,16]. RA follows a lumped mass approach to estimate rockfall trajectories and has a module to account for block shapes. In the lumped mass approach, falling blocks are considered to be non-deformable point masses that follow the equations of motion from a seeder, at a specific elevation from the surface, with an initial horizontal and vertical velocity, and with a horizontal direction defined by the azimuth of the topographic surface (random initial direction of motion can be applied around the azimuth of the terrain).
Energy losses at impact with the surface are modelled by empirical coefficients of restitution (COR) for the velocities after impact [16]. In RA, velocity after impact is calculated by scaling its impact velocity using normal and tangential COR (Rn and Rt, respectively). These coefficients vary for different materials and vegetation covered. Values for Rn have been reported from 0.15 for talus slopes and 0.25 for forested areas, up to 0.6 for bare rock [17,18,19,20]. Rt values ranged from 0.5 for talus slopes and up to 0.85 for bare rock. Rock block rolling is modelled through an equivalent friction angle. Other valid approaches for COR have been proposed and tested in mining environments [3,7].
At a feasibility level, Rn = 0.35 and Rt = 0.75, could be considered as these are consistent with values reported in the literature. These values are the mid-range expected values from calibration studies in the technical literature. Rockfalls originated by natural processes can be modelled with seeders 1 m above the topographic surface, with an initial velocity of 1 m/s, and with an aleatory direction within +/−22.5° from the slope azimuth at the location of the seeder. This is consistent with the approaches in the literature and aim at modelling initial block detachment motion. This is illustrated in Figure 4a. Modelled trajectories culminate when the translational velocity becomes less than 0.1 mm/s.
Rockfall trajectory models originated as flyrock were initiated 0.3 m above the topographic surface. Initial horizontal and vertical velocities were estimated based on an estimated maximum distance for flyrock of 150 m for blocks smaller than 0.3 m in equivalent size (0.1 to 0.25 m), according to the blast design for the case study presented in this paper. It is important to note that blast design defines the statistical distribution of fragments and the maximum fly distance of fragments of a specific dimension. It is understood that larger fragments would be ejected with lower initial velocities, up to sizes where ejection is minimal. This needs to be considered when assessing initial trajectory velocities and the block sizes reaching the elements exposed, as these will define the design energies for rockfall protection. Moreover, it is important to monitor implementation of blast design such that the design assumptions are met during operations. The approach used is presented in Figure 4b, where the angle α with the horizontal is 45° (maximum distance is achieved when wind effects are ignored) and vi was calculated as 38.4 m/s for a horizontal distance of 150 m. The horizontal direction of the initial velocity was set random. Validation of trajectory models is similar to that for the location of seeders. The location of surveyed blocks can provide insight into the spatial distribution of trajectories, including maximum distances. Scars on the surface from recent events can provide insight into the bouncing distances. Bouncing heights are more complicated to calibrate, however impacted trees can provide insights in forested slopes. Validation of trajectories are not possible for flyrock unless observations are available once the project is an operating mine.

2.5. Rockfall Hazard Parameters

Rockfall hazard parameters can include the frequency of trajectories reaching the exposed elements, either qualitative (trajectories reach/do not reach [8]) or quantitative (percentage of all trajectories reaching the elements at risk). For those elements or areas of interest that are reached by modelled trajectories, hazard parameters can include rockfall trajectory height (also known as rockfall height) and rockfall velocity when reaching the element. These can be assessed in terms of average, median or maximum values. Given that typically multiple trajectories would reach the critical elements of interest, trajectory heights and velocities can be evaluated stochastically by plotting their relative frequency. When falling block volumes are considered, velocities can be converted to impact energies following Equation (2).
E = 1 2 ( V × ρ ) × v 2 ,
In Equation (2) E is the kinetic energy at impact, V is the block volume considered, ρ is the rock block density (adopted as 2600 kg/m3 in the case study presented here), and v is the calculated trajectory velocity. When analyzing trajectories initiated as flyrock, care must be exercised to select the representative block volumes that can be ejected with the modelled initial velocities. In this paper, the initial velocity for flyrock was assumed as representative for a characteristic fragment size according to the blast design, and conservatively adopting the 90% percentile volume of the design fragmentation (0.13 m3). Initial velocities are expected to decrease rapidly as block volume increases, and initial conditions for larger volumes are assumed to be those for bench failure (Figure 4a) rather than flyrock. These metrics are input information that can be used to evaluate the rockfall hazards for each element of interest and, additionally, for developing and sizing rockfall protection strategies.

3. Application at an Open Pit in the Peruvian Andes

The method described previously was applied as part of a feasibility level open pit design for a copper mine in steep terrain in the Peruvian Andes (slopes between 45° and 60°, with many near vertical rock cliffs and overhangs). The project is part of the operations of Compañía de Minas Buenaventura, and is located in Apurimac, Peru. The project elevation is between 3900 and 4650 m.a.s.l., with the pit located on the side slope of a mountain. The slope is characterized by multiple rock outcrops, particularly rock cliffs, thin soil cover on the gentler slopes, and scarce vegetation. The rock mass comprises mostly of sequences of sedimentary origin (limestones and sandstones), monzonitic quartz intrusive and breccias associated with the mineralization, with varying degrees of shearing and alteration (from near fresh rock with depth outside the mineralized areas to highly fractured and altered near major faults and contacts). Soil cover corresponds to glacial deposits and talus from natural slope erosional processes. Temperatures range between −1 °C and 23 °C, and annual average precipitation is 831 mm. Precipitation is mostly rain, although snow and hail are also observed, infrequently. Approximately 90% of precipitation occurs between November and March, with January and February surpassing 150 mm of precipitation, each. The projected pit layout is shown in Figure 5. This figure also shows the main waterways in the area. Given the local topography and pit layout, a rockfall hazard analysis was required to evaluate the impact of operations on the main waterways, particularly for the river flowing North-South, located east of the pit. The analysis considered operations during three phases of the projected pit.

3.1. Susceptibility to Naturally Occurring Rockfalls Pre-Mining

Slope angles were calculated for the DEM of the study area (DEM in elevation raster format) using the ArcGIS 3D Analyst toolbox. The calculation had the same resolution as the elevation raster, 2 m × 2 m. The B value was calculated by classifying the slope angles according to Table 1. The slope angles and B values are shown in Figure 6a. Topographic contrast was calculated by subtracting a smoothed elevation raster (average elevations within a 10 m × 10 m area) from the original elevation raster. The calculated contrast and C values are shown in Figure 6b. Given the minimum soil cover in the area and the scarce presence of vegetation, a value of D equal to 10 was adopted (Figure 5). The susceptibility to naturally occurring rockfalls (pre-mining) was calculated following Equation (1) and the weights in Table 3. The mathematical operations were performed using the raster calculator in ArcGIS Spatial Analyst tools. The susceptibility to naturally occurring rockfalls is shown in Figure 6c. Inspection of the susceptibility map shows that steep rock outcrops would be the most susceptible, which is expected based on experience in similar contexts. This was further confirmed through observation of talus materials and larger blocks at the toe and downslope from the calculated higher susceptible areas in Figure 6c.

3.2. Location of Rockfall Initiation Points (Seeders)

The location of seeders for the rockfall trajectory models originated from natural processes were calculated by transforming the susceptibility raster map to points with an attribute that corresponded to the susceptibility values (ArcGIS toolbox). Points were classified according to the susceptibility attribute and those with the lower susceptibility were eliminated (ArcGIS editing capabilities within the attribute tables for shape files). A manual check was performed to verify that high susceptible areas had corresponding seeder locations. The seeders for naturally occurring rockfalls are shown in Figure 7a. Seeders for trajectory models corresponding to the different phases of the pit are shown in Figure 7b–d; and are placed within the corresponding layout for each phase.

3.3. Rockfall Hazard Analysis for the Main Water Ways in the Study Area

3.3.1. Simulated Rockfall Trajectories

Trajectory modelling parameters at the feasibility level were adopted as detailed in the previous section (Rn = 0.35, Rt = 0.75, with seeders 1 m above the topographic surface and an initial velocity of 1 m/s, and with an aleatory direction within +/−22.5° from the slope azimuth at the location of the seeder).
Five trajectories were simulated from each seeder in Figure 7. The number of trajectories per simulation is presented in Table 4. The large number of modelled trajectories were aimed at allowing a stochastic approach when evaluating the hazards in terms of block height and velocity, while at the same time being considered adequate for a feasibility level study. A three-dimensional rendering of the modelled trajectories for pre-mining, naturally originated rockfalls, is shown in Figure 8a. In this figure, the pit area is indicated for reference and approximate scale. Figure 8b shows a plan view of these trajectories and relative to the pit phases. This figure includes scale to serve as reference for both images. In Figure 8b, three sectors are shown along the main water ways, which are later used to assess the rockfall hazards associated with pit operations impacting the water ways.
The simulated trajectories in Figure 8 suggest that rockfall occurrences in the area, originated from natural erosional processes, would reach and enter the main water ways. Given the rugged topography, and based on field observations of blocks in the vicinity of these water ways; it is likely that falling blocks regularly impact these elements. This is an important finding, as it starts setting a baseline for rockfall impacting these elements in the pre-mining conditions. Modelled trajectories reached the water ways with very low heights (rolling) and low velocities, all below 10 m/s. Three-dimensional rendering of the modelled trajectories for the three phases of the pit, as well as the plan views for these trajectories, are shown in Figure 9. These trajectories correspond to initial characteristics associated with blasting operations (flyrock) and those simulated for bench failure (low initial velocities simulating detachment of blocks).
Importantly, these trajectories are characteristic of initial operations at these phases, given that the topography utilized does not include the pit bench configuration. In this regard, the approach estimates the rockfall hazard for the elements of interest outside the pit, during the initial stages of operation, which are the most critical relative to the ease of the fallen blocks to move beyond the pit boundary. Furthermore, the modelled trajectories aid identification of rockfall mitigation strategies that are required before initiating each phase of the pit.
Figure 9b shows that initial operations in the south west section of Phase 1 have the potential to impact the upper reach in Sector 3. This suggests that the area would require some mitigation prior to initiating activities. During the initial stage of Phase 2, all three sectors are impacted. It is interest to note that although sector 1 appears to be impacted ubiquitously, trajectories towards sectors 2 and 3 follow preferential paths. This opens an opportunity to target these preferential paths in order to optimize the efficiency of resource allocation for rockfall mitigation (Figure 9d). Initial operations in Phase 3 show a more ubiquitous impact in Sector 3; however, the impact in Sector 2 is localized and similar to that during Phase 2 (Figure 9f).
These observations highlight the significant topographic effects on rockfall trajectories and the importance of three-dimensional approaches to rockfall trajectory modelling when assessing large areas. It is noted that the most critical sector is Sector 2, as it corresponds to the main river in the area and is the limit of the mining lease. Sectors 1 and 3 are within the mine boundaries. Trajectories are constrained within these three sectors and is unlikely that they will reach other areas outside of the control of mining operations.

3.3.2. Rockfall Heights, Velocities and Energies

The trajectories generated in RA allow extracting the falling block heights and velocities at any location of the trajectory. In this study trajectory height and velocity were extracted when reaching each of the three sectors.
The large number of trajectories modelled allowed for a stochastic approach to analyze these parameters. Figure 10 shows the cumulative relative frequency of heights and velocities for Phase 1 trajectories reaching Sector 3. Figure 11 and Figure 12 show the heights and velocities for trajectories reaching each of the three sectors, for Phase 2 and Phase 3, respectively.
Figure 10, Figure 11 and Figure 12 provide the data to calculate the relative frequency of trajectories exceeding particular heights or velocities. More importantly, these allow criteria to be set in terms of percentage of rockfall capture such that rockfall protection structures can be sized (height). When block volumes are used in combination with the calculated velocities to calculate kinetic energy (e.g., Equation (2)), rockfall protection structures can be sized to withstand the impact energies.
Impact energies can be calculated stochastically using the relative frequency of block velocity and rockfall frequency–volume relationships. [13] presents a methodology that adopts Monte Carlo type simulations on rockfall velocity distributions from trajectory modelling and frequency–volume relationships to calculate the distribution of rockfall kinetic energies following Equation (2). In this study, rockfall mitigation criteria aimed at being consistent with commonly adopted criteria for mining and civil projects (typically between 80% and 98% capture). Moreover, the rockfall activity baseline assessed here for naturally occurring rockfalls suggests that a criterion of 100% capture would be overly conservative.
Following the blast design estimated fragmentation, a rock block volume of 0.13 m3 was used to calculate the kinetic energies. To consider larger volumes detaching, bouncing, and breaking before reaching the sectors; a volume of 1.2 m3 (block of 1.3 m in equivalent diameter) was also used to calculate kinetic energies. This volume was chosen for the feasibility-level study as it represents a typical dimension of the larger blocks that had long falling, bouncing and rolling trajectories, according to the authors’ experience. The velocities used to calculate the kinetic energy for the larger blocks would correspond to those obtained for trajectories originated with low initial velocities (not as fly-rock). These were conservatively assumed for the feasibility-level study as half the trajectory velocity calculated for the 0.13 m3 blocks. Heights and velocities (percentile 95% as shown in Figure 10, Figure 11 and Figure 12) and calculated kinetic energies are presented in Table 5, Table 6 and Table 7, for phases 1, 2 and 3, respectively.
This feasibility level calculation suggests that Sectors 1 and 2 could see blocks with kinetic energies just below 1000 kJ, and Sector 3 just below 1200 kJ. Falling blocks with these energies can be successfully captured with conventional, off-the-shelf flexible barriers. However, the 95-percentile height in Sectors 1 and 2 are over 20 m and 36 m, respectively. These are significantly in excess of conventional rockfall barriers. Reasons for these heights are the presence of steep, high rock cliffs in the area; therefore, the trajectory height calculated corresponds to that of the cliff height immediately downslope, and the known tendency of rockfall trajectory modelling to overestimate trajectory heights, particularly when using the lumped-mass approach. Further analyses at advanced stages of rockfall mitigation design can optimize the location of protection structures according to the areas where trajectories are the closest to ground. Aggregating the trajectory heights in Figure 10, Figure 11, and Figure 12 indicates that 6 m high and 10 m high barriers could capture up to 80% and 85% of trajectories.

3.3.3. Feasibility Rockfall Protection Options

On the basis of the spatial extent of the modelled trajectories, two options for rockfall protection were developed at the feasibility level. Option 1 considers the installation of rockfall catchment structures to capture between 85% and 90% of falling blocks. Installation is required along the main water ways before initiating pit operations (Figure 13a). Heights and minimum energies, as well as proposed structures are shown in Table 8. Option 1 considers the use of 12 m and 6 m high barriers, achieved through a combination of compacted or mechanically stabilized earth embankments and flexible barriers. Minimum energies consider a safety factor of 1.3 over the energies calculated for the 95-percentile.
Option 2 takes advantage of the different spatial distributions of rockfall trajectories originating from each phase of the pit and the steep topography in the upper areas of the water ways in Section 1 and Section 3, which capture and channel potential rockfall trajectories. The layout of the proposed rockfall protection structures is shown in Figure 13b–d. These show the sequence in which each structure needs to be constructed (i.e., before each phase) and the trajectories reaching the water ways for each phase. This approach, however, requires allowing rockfalls to reach the upper areas in the waterways in sectors 1 and 3, in order to optimize resources for rockfall catchment. Heights and minimum energies, as well as proposed structures are shown in Table 9. Option 2 considers the use of 2 m and 12 m high barriers, achieved through a combination of compacted or mechanically stabilized earth embankments and flexible barriers. Minimum energies consider a safety factor of 1.3 over the energies calculated for the 95-percentile
Adoption of Option 1 or Option 2 will depend on the operator’s appetite for rockfall risk associated with the protection requirements for the water ways in the project area, as well as the required resources and challenges associated with installation and maintenance of the protection structures. For illustration purposes, some available strategies to reach the heights and energies required for both options in Table 8 and Table 9 are illustrated (sketches) in Figure 14.

4. Conclusions

Controlling rockfall-related risks is a requirement for safe pit operations. Rockfall hazards in open pit operations are primarily controlled through bench geometry. Rockfall catchment effectiveness in sensitive areas (e.g., location of infrastructure or active mining with personnel exposed) is commonly evaluated through two-dimensional and three-dimensional rockfall trajectory simulations. During blasting operations, flyrock risks are controlled through blast designs that optimize fragmentation while minimizing flyrock, and safe evacuation distances for personnel and equipment.
In mountainous areas, open pit operations can initiate on steep slopes (45° and steeper). Depending on the geometry of the ore body and topography of the area; rockfalls and flyrock can be contained within the pit boundaries or the possibility remains for falling material to exit these boundaries. In the latter case, elements downslope from operations (e.g., mining components, sites of cultural importance, sensitive environmental areas, third-party lands) could be exposed to falling rock. This paper presents a method for rockfall hazard analysis for in-pit operations potentially impacting external sensible areas. The method considers the natural susceptibility to rockfall pre-operations, rockfalls originated from bench failures, and rockfalls initiated as flyrock. Rockfall trajectory models are then used to estimate the potential for rockfalls reaching elements of interest. The natural susceptibility to rockfalls and their trajectories are used as a baseline on which to evaluate the effects of open pit operations. The method is illustrated for an open pit in the Peruvian Andes at a feasibility level of study.
The results of applying the proposed method illustrate the flexibility for including considerations of base-line (pre-mining) rockfall impacts on the external elements of interest, which can drive decision making regarding tolerance to rockfall phenomena. Furthermore, the method allows for developing rockfall mitigation strategies that consider rock block velocities, heights, energies as well as the spatial distribution of trajectories. The latter can be used to identify the more hazardous areas in which to focus rockfall mitigation resources.
The results of implementing the method highlights the importance of considering the three-dimensional effects of the terrain on block trajectories. Topographic features channel these trajectories through preferential paths, which is consistent with field observations in the authors’ experience. As illustrated in Option 2 of the proposed rockfall mitigation strategies, these insights allow for increasing the efficiency of resources available for rockfall protection structures. Leveraging the information on trajectory locations where rockfalls are channelized and where they show lower heights, the dimensions for rockfall protection structures are reduced.
The case study used for illustration was developed to a feasibility level. However, the overall methodology can be adopted at more advanced levels of design. This would require further investigations into rockfall frequency–size relationships, further calibration of the coefficients of energy restitution and how these vary with block volume, and further scenarios of trajectory modelling for stages of pit development. These detailed assessments would inform decision-making about rockfall protection options and enhance their design to increase their effectiveness and efficiency.

Author Contributions

R.M.: conceptualization, methodology, analysis, writing—draft preparation. F.A.: analysis, software, data curation, writing—review and editing. L.G.: supervision, writing—review and editing, project administration. M.E.: supervision, writing—review and editing, project administration. R.F.: validation, writing—review and editing, project administration. J.M.: validation, writing—review and editing, project administration. All authors have read and agreed to the published version of the manuscript.

Funding

This research received no external funding.

Data Availability Statement

Not applicable.

Acknowledgments

The authors would like to acknowledge the contributions from Compañía de Minas Buenaventura, for the valuable reviews and comments to the methodology and analyses, as well as for making available the information necessary for this study; and Klohn Crippen Berger, who helped coordinate the field work and data collection tasks.

Conflicts of Interest

There is no conflict of interest associated with this work or its publication.

References

  1. Brawner, C.O.; Kalejta, J., II. Rock fall in surface mining. CIM Bull. 2002, 95, 69–74. [Google Scholar]
  2. Read, J.; Stacey, P. Guidelines for Open Pit Slope Design; CRC Press/Balkema: Leiden, The Netherlands, 2009; p. 496. [Google Scholar]
  3. Graf, C.C.; Peryoga, T.; McCartney, G.; Rees, T. Verification of Trajec3D for use in rockfall analysis at Newmont Boddington Gold. In Proceedings of the Slope Stability 2013, Brisbane, Australia, 25–27 September 2013; Dight, P.M., Ed.; Australian Centre for Geomechanics: Perth, Australia, 2013; pp. 1231–1242. [Google Scholar]
  4. Thoeni, K.; Lambert, C.; Giacomini, A.; Sloan, S.W.; Carter, J.P. An integrated approach for rockfall analysis with drapery systems. In Proceedings of the Slope Stability 2013, Brisbane, Australia, 25–27 September 2013; Dight, P.M., Ed.; Australian Centre for Geomechanics: Perth, Australia, 2013; pp. 1149–1160. [Google Scholar]
  5. Hustrulid, W.; Kuchta, M.; Martin, R. Open Pit Mine Planning & Design—Volume 1 Fundamentals, 3rd ed.; Taylor & Francis: London, UK, 2013; p. 1004. [Google Scholar]
  6. Ryan, T.M.; Pryor, P.R. Designing catch benches and inter-ramp slopes. In Slope Stability in Surface Mining; Hustrulid, W.A., McCarter, M.K., Van Zyl, D.J.A., Eds.; SME: Littleton, CO, USA, 2001; pp. 27–38. [Google Scholar]
  7. Bosman, J.D.; Kotze, G. Verification of catch berm effectiveness through the application of 3D fall body dynamics. In Proceedings of the Slope Stability 2015, Cape Town, South Africa, 12–14 October 2015; The Southern African Institute of Mining and Metallurgy: Johannesburg, South Africa, 2015; pp. 563–576. [Google Scholar]
  8. Macciotta, R.; Martin, C.D. Preliminary approach for prioritizing resource allocation for rock fall hazard investigations based on susceptibility mapping and efficient three-dimensional trajectory modelling. Bull. Eng. Geol. Environ. 2019, 78, 2803–2815. [Google Scholar] [CrossRef]
  9. Baillifard, F.; Jaboyedoff, M.; Sartori, M. Rockfall hazard mapping along a mountainous road in Switzerland using a GIS-based parameter rating approach. Nat. Hazards Earth Syst. Sci. 2003, 3, 431–438. [Google Scholar] [CrossRef]
  10. Frattini, P.; Crosta, G.; Carrara, A.; Agliardi, F. Assessment of rockfall susceptibility by integrating statistical and physically-based approaches. Geomorphology 2008, 94, 419–437. [Google Scholar] [CrossRef]
  11. Lan, H.; Martin, C.D.; Zhou, C.; Lim, C.H. Rock fall hazard analysis using LiDAR and spatial modeling. Geomorphology 2010, 118, 213–223. [Google Scholar] [CrossRef]
  12. Blais-Stevens, A.; Behnia, P.; Kremer, M.; Page, A.; Kung, R.; Bonham-Carter, G. Landslide susceptibility mapping of the sea to sky transportation corridor, British Columbia, Canada: Comparison of two methods. Bull. Eng. Geol. Environ. 2012, 71, 447–466. [Google Scholar] [CrossRef]
  13. Macciotta, R.; Martin, C.D.; Cruden, D.M. Probabilistic estimation of rockfall height and kinetic energy based on a three-dimensional trajectory model and Monte Carlo simulation. Landslides 2015, 12, 757–772. [Google Scholar] [CrossRef]
  14. Pellicani, R.; Spilotro, G.; Westen, C.J. Rockfall trajectory modeling combined with heuristic analysis for assessing the rockfall hazard along the Maratea SS18 coastal road (Basilicata, southern Italy). Landslides 2016, 13, 985–1003. [Google Scholar] [CrossRef]
  15. Macciotta, R.; Gräpel, C.; Keegan, T.; Duxbury, J.; Skirrow, R. Quantitative risk assessment of rock slope instabilities that threaten a highway near Canmore, Alberta, Canada: Managing risk calculation uncertainty in practice. Can. Geotech. J. 2020, 57, 337–353. [Google Scholar] [CrossRef]
  16. Lan, H.; Martin, C.D.; Lim, C.H. Rock fall analyst: A GIS extension for three-dimensional and spatially distributed rock fall hazard modeling. Comput. Geosci. 2007, 33, 262–279. [Google Scholar] [CrossRef]
  17. Agliardi, F.; Crosta, G.B. High resolution three-dimensional numerical modelling of rock falls. Int. J. Rock Mech. Min. Sci. 2003, 40, 455–471. [Google Scholar] [CrossRef]
  18. Chiessi, V.; D’Orefice, M.; Scarascia Mugnozza, G.; Vitale, V.; Cannese, C. Geological, geomechanical and geostatistical assessment of rockfall hazard in San Quirico Village (Abruzzo, Italy). Geomorphology 2010, 119, 117–161. [Google Scholar] [CrossRef]
  19. Giani, G.P.; Giacomini, A.; Migliazza, M.; Segalini, A. Experimental and theoretical studies to improve rock fall analysis and protection work design. Rock Mech. Rock Eng. 2004, 37, 369–389. [Google Scholar] [CrossRef]
  20. Guzzetti, F.; Reichenbach, P.; Ghigi, S. Rockfall hazard and risk assessment along a transportation corridor in the Nera Valley, Central Italy. Environ. Manag. 2004, 34, 191–208. [Google Scholar] [CrossRef] [PubMed]
Figure 1. Cross section sketches of typical open pit configurations (a) and pit walls on the side of steep slopes (b). Not to scale.
Mining 01 00009 g001
Figure 2. Work flow of the proposed rockfall hazard assessment method.
Mining 01 00009 g002
Figure 3. Illustration of topographic contrast and identification by comparing detailed and smoothed digital elevation models (DEMs).
Mining 01 00009 g003
Figure 4. Initial height and velocities for trajectory models of originated from natural block detachment (a) and as flyrock (b). Not to scale.
Mining 01 00009 g004
Figure 5. Layout of the three phases of the pit and main waterways (a) and aerial view of the same scene (b) (©Google Earth, retrieved in 2020, Image © Maxar Technologies 2014).
Mining 01 00009 g005
Figure 6. Slope (inclination in degrees) and B value (a), topographic contrast an C value (b), and calculated relative susceptibility to naturally occurring rockfalls (pre-mining) (c).
Mining 01 00009 g006
Figure 7. Rockfall trajectory model seeder locations for naturally occurring rockfalls (pre-mining) (a), and phases 1 (b), 2 (c) and 3 (d).
Mining 01 00009 g007
Figure 8. 3-dimensional rendering (a) and plan view (b) of rockfall trajectories for naturally occurring rockfalls (pre-mining).
Mining 01 00009 g008
Figure 9. 3-dimensional rendering (left) and plan view (right) of rockfall trajectories for Phase 1 (a,b), Phase 2 (c,d), and Phase 3 (e,f).
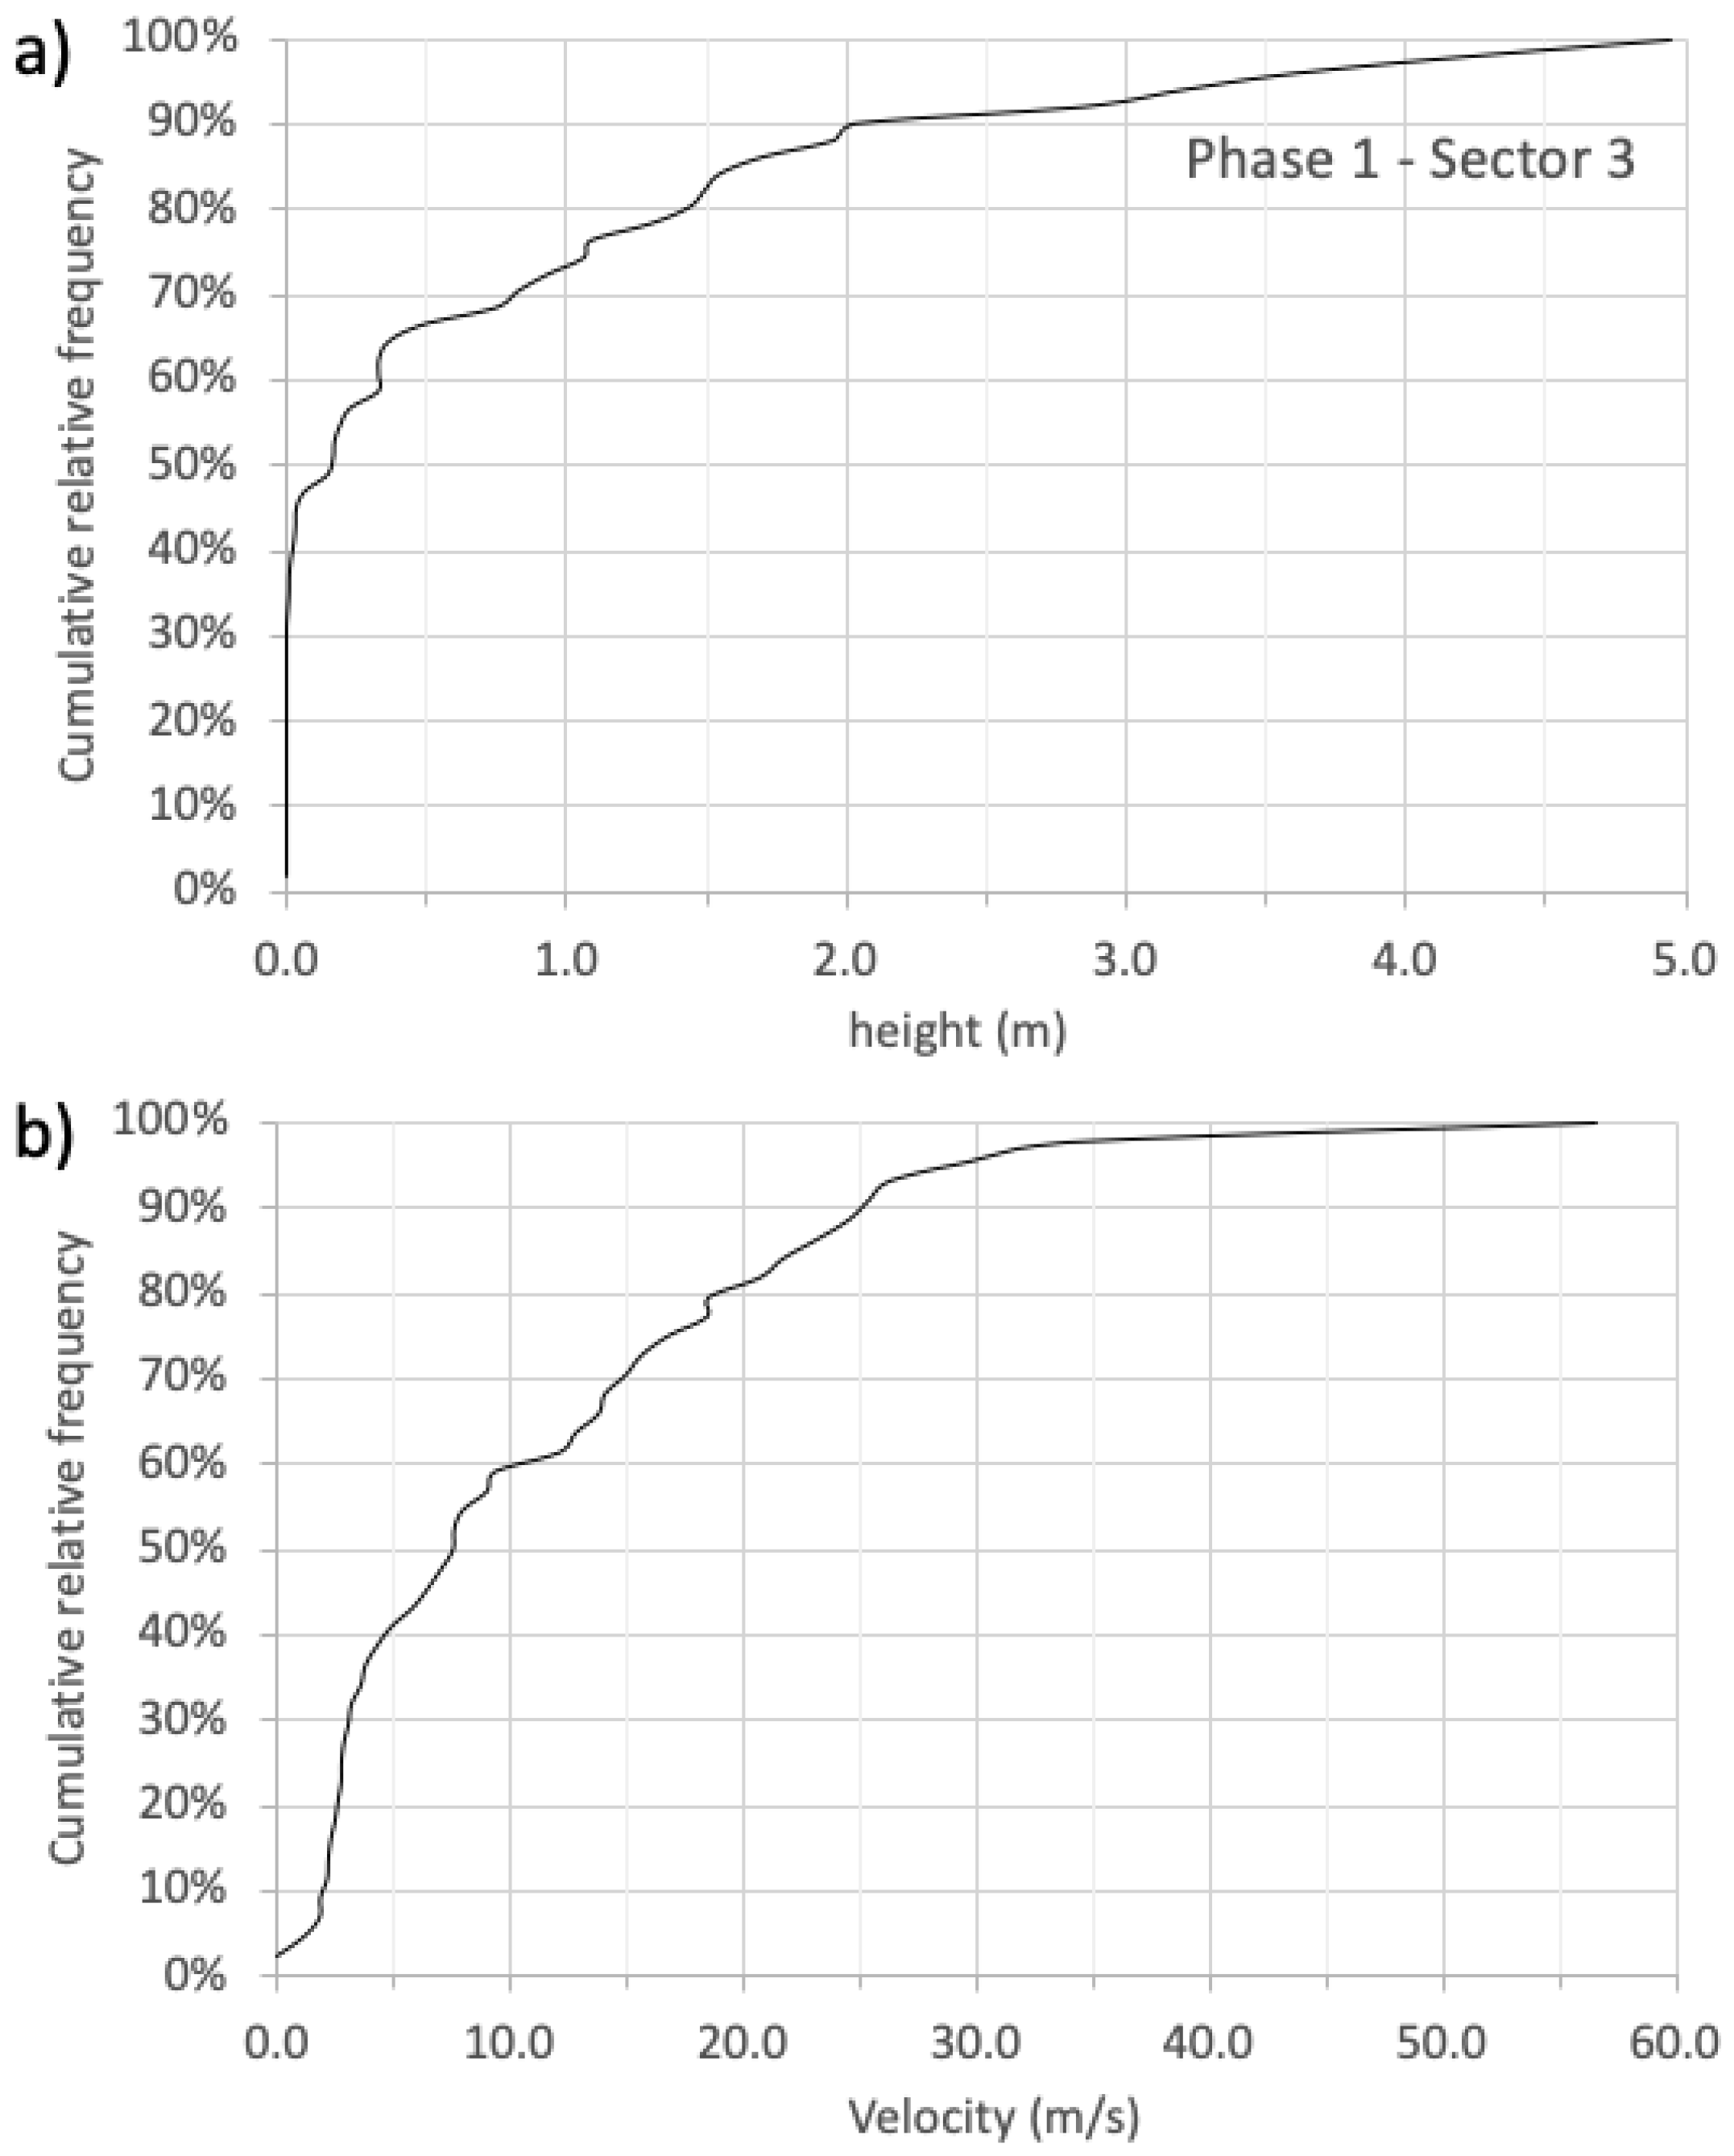
Mining 01 00009 g009
Figure 10. Cumulative relative frequency of heights (a) and velocities (b) for Phase 1 trajectories reaching Sector 3.
Mining 01 00009 g010
Figure 11. Cumulative relative frequency of heights (left) and velocities (right) for Phase 2 trajectories reaching Sector 1 (a,b), Sector 2 (c,d) and Sector 3 (e,f).
Mining 01 00009 g011
Figure 12. Cumulative relative frequency of heights (left) and velocities (right) for Phase 3 trajectories reaching Sector 1 (a,b), Sector 2 (c,d) and Sector 3 (e,f).
Mining 01 00009 g012
Figure 13. Proposed layout of rockfall protection for Option 1 (a) and Option 2. Trajectories reaching the different sectors are plotted for Phases 1 (b) 2 (c) and 3 (d) to illustrate the required sequence of installation.
Mining 01 00009 g013
Figure 14. Sketches of available approaches to achieve the height and energy requirements for Options 1 and 2 in Table 8 and Table 9.
Mining 01 00009 g014
Table 1. Criterion for selecting the value of B in Equation (1).
Slope (°) Value of B
0–300
30–455
45–608
60–9010
Table 2. Criterion for selecting the value of C in Equation (1).
Topographic Contrast (m)Value of C
<−0.30
−0.3 a 0.35
>0.310
Table 3. Weights for the values of B, C, and D in Equation (1).
Value in Equation (1)Weight
WB (value B)0.50
WC (value C)0.25
WD (value D)0.25
Table 4. Trajectories per simulation.
Trajectory ModelNo. Trajectories
Natural (pre-mining)3306
Phase 11310
Phase 21220
Phase 31860
Table 5. Height and velocity (percentile 95%) and kinetic energy—Phase 1.
SectorHeight (m)Velocity (m/s)Energy (kJ) 0.13 m3 BlockVelocity (m/s)Energy (kJ) 0.13 m3 Block
Sector 33.6029.67148.714.84343.3
Table 6. Height and velocity (percentile 95%) and kinetic energy—Phase 2.
SectorHeight (m)Velocity (m/s)Energy (kJ) 0.13 m3 BlockVelocity (m/s)Energy (kJ) 0.13 m3 Block
Sector 110.7448.19392.524.10905.7
Sector 236.2646.4363.923.20839.7
Sector 31.2030.92161.615.46372.9
Table 7. Height and velocity (percentile 95%) and kinetic energy—Phase 3.
SectorHeight (m)Velocity (m/s)Energy (kJ) 0.13 m3 BlockVelocity (m/s)Energy (kJ) 0.13 m3 Block
Sector 121.3749.50414.124.75955.6
Sector 29.3441.15286.220.58660.4
Sector 39.5055.00511.227.51179.8
Table 8. Height and energy requirements for Option 1 rockfall protection.
SectorHeight (m)Maximum Energy (kJ)Option 1
Sector 1121250Flexible barrier over compacted or mechanically stabilized earth embankment
Sector 2121100
Sector 361550Flexible barrier OR compacted or mechanically stabilized earth embankment
Table 9. Height and energy requirements for Option 2 rockfall protection.
SectorHeight (m)Maximum Energy (kJ)Option 2
Sector 12500Flexible barrier
Sector 2121100Flexible barrier over compacted or mechanically stabilized earth embankment
Sector 32500Flexible barrier
Publisher’s Note: MDPI stays neutral with regard to jurisdictional claims in published maps and institutional affiliations.

