Article

Lightweight Interpretable Deep Learning Model for Nutrient Analysis in Mobile Health Applications

by
Zvinodashe Revesai
and
Okuthe P. Kogeda
*
School of Mathematics, Statistics and Computer Science, College of Agriculture, Engineering and Science, University of KwaZulu-Natal, Westville Campus, Durban 3209, South Africa
*
Author to whom correspondence should be addressed.
Digital 2025, 5(2), 23; https://doi.org/10.3390/digital5020023
Submission received: 13 February 2025 / Revised: 6 June 2025 / Accepted: 13 June 2025 / Published: 17 June 2025

Abstract

:
Nutrient analysis through mobile health applications can improve dietary choices, particularly among vulnerable populations. Current mobile nutrient analysis applications face critical limitations: sophisticated deep learning models require substantial computational resources unsuitable for budget devices, while lightweight solutions sacrifice accuracy and lack interpretability necessary for user trust. We develop a lightweight interpretable deep learning architecture combining depthwise separable convolutions, Shuffle Attention mechanisms, and knowledge distillation with integrated Grad-CAM and LIME explanations for real-time interpretability. Our model achieves 97.1% food recognition accuracy (98.0% with cross-validation) and 7.2% mean absolute error in nutrient estimation while maintaining an 11 MB footprint and 150 ms inference time. Knowledge distillation reduces the model size by 62% and energy consumption by 36% while improving accuracy by 2.2 percentage points over non-distilled training. Targeted optimisation for food security categories achieves 94.1% accuracy for staple foods, 93.2% for affordable proteins, and 92.8% for accessible produce. Interpretability methods demonstrate 0.91 feature consistency scores with 38–45 ms explanation generation. These results demonstrate the first mobile nutrient analysis system combining state-of-the-art accuracy with computational efficiency suitable for resource-constrained deployment, addressing accessibility barriers for vulnerable populations.

1. Introduction

Mobile health applications have experienced remarkable growth in recent years, with the global mHealth market reaching USD 62.7 billion in 2023 and expected to achieve USD 158.3 billion by 2030, representing a compound annual growth rate (CAGR) of 14.1% [1]. The mHealth app sector alone was valued at USD 37.5 billion in 2024, with projections indicating a CAGR of 14.8% through 2030 [2]. Research demonstrates that 80% of Americans support remote patient monitoring, with over half advocating for its integration into standard medical care [3]. Within this expanding landscape, nutrient analysis applications serve a vital function, helping individuals, especially those from vulnerable communities, maintain balanced diets and make informed nutritional decisions. Nevertheless, developing accurate and efficient nutrient analysis tools for mobile platforms presents distinct challenges, particularly for users facing resource or literacy constraints.
This study defines vulnerable populations as individuals and communities encountering one or more barriers: (1) limited financial resources affecting access to advanced mobile devices and stable internet connectivity, (2) low health literacy impeding comprehension of complex nutritional information, (3) restricted access to healthcare professionals and nutritional education, and (4) cultural or linguistic obstacles influencing technology interaction [4]. The research indicates that racial and ethnic minorities, low-income groups, and other vulnerable populations disproportionately experience the digital divide, with disparities in digital access compounding existing structural disadvantages [5]. These communities frequently depend on basic smartphones with constrained processing capabilities (typically 2–4 GB RAM, older processors) and require simplified, culturally appropriate interfaces for effective health management [4].
The significance of proper nutrition in maintaining health and preventing chronic diseases remains undisputed. Malnutrition, encompassing both undernutrition and obesity, continues as a major global health challenge [6]. The prevalence of chronic diseases—diabetes, hypertension, cardiovascular conditions, and respiratory disorders—continues rising worldwide, with the World Health Organisation’s 2024 report documenting over 20 million new cancer cases [7]. Mobile health applications offer promising opportunities to democratise nutritional information access, delivering personalised recommendations based on individual requirements and preferences [1]. This democratisation proves especially valuable for vulnerable populations with limited access to healthcare professionals or nutritional education [5]. However, low-income populations face unique mHealth utilisation barriers that amplify the impacts of social determinants of health, including limited mobile application fluency, restricted health literacy, reduced empowerment, and historical healthcare system mistrust [4].
Conventional nutrient analysis methods typically depend on manual dietary information input or basic algorithms—approaches that are time-consuming, error-prone, and inadequate for capturing the complexity of human nutrition [8]. The analysis of popular nutrition applications with over one million installations revealed that nine applications collected dietary intake using identical assessment methods (food diary records), with food selection achieved through text searches and barcode scanning. Notably, emerging technologies, including image recognition, natural language processing, and artificial intelligence, remained absent from most popular nutrition applications [3]. Recent advances in artificial intelligence, particularly in deep learning, show considerable promise for enhancing nutrient analysis accuracy and capabilities [1]. Deep learning models demonstrate potential for processing complex data inputs—food images or natural language descriptions—to deliver more accurate and comprehensive nutritional assessments [9].
Nevertheless, implementing sophisticated deep learning models on mobile devices presents substantial challenges [10]. Mobile platforms face constraints from limited computational resources, storage capacity, and energy consumption requirements. Furthermore, many advanced deep learning models demand intensive computation and substantial memory, rendering them impractical for real-time smartphone use [11]. This situation necessitates the development of lightweight models capable of efficient operation within mobile device constraints whilst maintaining accuracy. For vulnerable populations, these constraints are particularly acute, as they often rely on older, entry-level smartphones with limited processing power, slower processors, and restricted battery life. The Federal Communications Commission estimates that 19 million Americans lack reliable broadband access [5], creating additional barriers to digital health access. Our design decisions therefore prioritise ensuring functionality across diverse device specifications whilst maintaining the accuracy required for reliable nutritional guidance.
Deep learning application to health-related tasks faces another critical challenge: the “black box” nature of many models [12]. Users and healthcare professionals require transparency in AI-driven health recommendations to foster trust and ensure responsible implementation. This is particularly crucial in nutrient analysis, where recommendations directly impact users’ dietary choices and health outcomes [13]. Consequently, interpretable AI models capable of explaining predictions in human-understandable terms represent an urgent necessity [7].
Model interpretability challenges intensify due to cultural diversity and varying health literacy levels among vulnerable populations. Research examining primary hypertension prevention in Argentina, Guatemala, and Peru identified challenges, including mHealth innovation unacceptability within targeted communities, emphasising the need for interventions tailored to literacy challenges attributed to gaps in cultural context understanding [9]. Different cultural groups interpret and trust AI explanations differently, necessitating culturally sensitive interpretability approaches [12]. Visual explanations may prove more effective for users with limited literacy, whilst some cultures might prefer contextual information about ingredient origins or preparation methods [7]. Moreover, whilst initial user trust remains important, maintaining and building trust over time is crucial for long-term adoption and positive health outcomes. These technical challenges compound with requirements for culturally appropriate and sustained interpretability across diverse user groups. Effective interpretability must achieve technical soundness whilst remaining culturally resonant and trustworthy throughout extended use periods [13].
This research specifically addresses deployment challenges encountered when serving vulnerable populations in resource-constrained environments, including rural communities in developing regions, elderly populations with limited technical literacy, low-income households using budget smartphones, and culturally diverse communities requiring localised nutritional guidance [4]. Understanding these specific user constraints has informed our architectural decisions and evaluation methodology throughout this work.
The research objectives comprise three main areas:
  • To develop a lightweight deep learning model capable of accurate nutrient analysis whilst operating efficiently on mobile devices.
  • To integrate interpretability features into the model, allowing users to understand the factors influencing nutritional assessments.
  • To evaluate the model’s performance and usability in real-world scenarios, particularly for vulnerable populations.
This paper presents a novel approach to addressing these challenges. We propose lightweight, interpretable deep learning architecture specifically designed for nutrient analysis in mobile environments. Our model incorporates state-of-the-art compression techniques to reduce its size and computational requirements without sacrificing accuracy [11]. Additionally, we integrate interpretability features that provide clear, user-friendly explanations for the model’s predictions, enhancing transparency and user trust [12].
The main contributions of this work include:
  • A novel lightweight architecture that achieves high accuracy in nutrient analysis whilst being suitable for mobile deployment.
  • The successful integration of interpretability features that enhance user understanding without compromising model performance.
  • A comprehensive evaluation of the model’s performance in mobile health contexts, including accuracy, speed, and mobile deployment feasibility.
The remainder of this paper is organised as follows: In Section 2, we review related work in nutrient analysis, lightweight models, and interpretable AI. In Section 3, we detail our methodology, including dataset, model architecture, interpretability features, and mobile implementation. In Section 4, we present our experimental results, comparing performance, efficiency, and interpretability. In Section 5, we discuss our findings, analysing model performance, interpretability, and limitations. Finally, in Section 6, we conclude the paper, summarising our contributions and future directions for nutrient analysis in mobile health applications.

2. Related Work

In this section, we review existing approaches in mobile nutrient analysis, focusing on architectural developments, efficiency optimisations, and interpretability mechanisms.

2.1. Nutrient Analysis Architectures

Encoder–decoder architectures, particularly U-Net variants, have become fundamental in nutrient analysis. However, most implementations focus on Western food datasets with limited cultural diversity, creating significant gaps for vulnerable populations. Sharp U-Net [14] introduces depthwise convolutions with sharpening kernel filters, outperforming state-of-the-art models without additional parameters, though validation occurred primarily on homogeneous medical datasets. KiU-Net [15] addresses U-Net’s limitations in detecting smaller structures through overcomplete architectures that improve edge segmentation whilst using fewer parameters. Nevertheless, the architecture struggles with complex, layered dishes typical in many cultural cuisines where ingredients are not clearly separable. Half-UNet [16] reduces parameters whilst maintaining accuracy through channel unification and Ghost modules, whilst ELU-Net [16] incorporates deep skip connections, showing improved performance on brain tumour and liver datasets, with researchers now working on nutritional analysis [17].
Critical limitations emerge for vulnerable populations, as these architectures require substantial training data from diverse cultural contexts, which remains scarce. Moreover, they struggle with complex, layered dishes typical in many cultural cuisines where ingredients are not clearly separable. Cultural bias in training datasets results in poor performance on traditional foods from developing regions or mixed dishes that do not conform to Western presentation standards, challenging their deployment on mobile devices for vulnerable populations with low-end smartphones.

2.2. Lightweight Deep Learning Models

Mobile-optimised networks have advanced through parameter reduction strategies, though most focus on computational efficiency rather than cultural inclusivity or interpretability. Table 1 summarises key architectures and their performance metrics, noting that testing has predominantly occurred on Western food datasets.
These architectures demonstrate success within Western contexts but exhibit significant limitations for vulnerable populations. MobileNet [18] achieved computational efficiency through depthwise separable convolutions, with Mezgec et al. [8] achieving 87.6% accuracy on 520 food classes, though the dataset exhibited limited representation of non-Western cuisines. Zhang et al. [20] applied MobileNetV2 to Asian food recognition, achieving 84.3% accuracy but noting significant performance degradation on traditional preparation methods. Tan et al. [21] used EfficientNet for portion estimation with 15% error, though acknowledging difficulties with traditional serving methods and communal eating scenarios. Cheng et al. [22] developed a ShuffleNet-based model for nutrient prediction with 10.5% calorie error, but the model was trained exclusively on packaged foods with standardised portions. Choi et al. [23] combined approaches for comprehensive monitoring, achieving 82.7% recognition accuracy, yet reported substantial challenges with mixed dishes and traditional cooking methods. Crucially, none of these lightweight models prioritise interpretability as a core design principle, instead treating it as an optional add-on that often compromises performance or increases computational overhead.
Interpretability represents the most significant research gap in mobile nutrient analysis for vulnerable populations. Current methods face a fundamental trilemma: computational efficiency, explanation quality, and cultural accessibility, with existing approaches optimising for, at most, two factors. The attention mechanisms by Choi et al. [24] in their RETAIN model achieved 12% accuracy improvement, whilst Garreau et al. [25] demonstrated success in visual calorie estimation. However, both studies noted increased computational overhead and acknowledged that their explanations may not be accessible to users with limited health literacy. These attention-based methods assume users possess visual literacy skills to interpret attention maps and nutritional knowledge to understand highlighted ingredients—assumptions that do not hold for many vulnerable populations.
Post hoc explanation methods such as LIME and SHAP have shown promise but with concerning limitations for diverse populations. Hung et al. [26] demonstrated SHAP-based explanations increased user trust by 24% amongst university-educated participants, whilst Fong et al. [27] used LIME to achieve 18% higher user engagement. However, both approaches required significant computational resources on mobile devices and utilised explanation formats that may not translate effectively across cultural contexts or literacy levels. Ullah et al. [28] found SHAP explanations increased inference time by 250% on low-end smartphones, creating barriers for users with limited device capabilities. More critically, Selvaraju et al. [29] revealed that explanation effectiveness varied significantly with users’ educational backgrounds, suggesting current interpretability methods may inadvertently exclude those most in need of accessible nutrition guidance. Selvaraju et al. [29] showed 78% of users preferred CAV-based explanations for food classification, though the study population was predominantly Western and technology-literate. Similarly, Grad-CAM [30] techniques proved efficient, with Xiu et al. [31] improving detection rates by 30% in medical applications, yet these methods assume users can interpret visual highlighting and understand ingredient relationships.
Critical research gaps include the lack of culturally adaptive interpretability mechanisms that can adjust explanation content and presentation based on user cultural context and literacy levels. Furthermore, the existing interpretability research lacks comprehensive evaluation frameworks that consider diverse user populations, with most studies evaluating using technical metrics or conducting user studies with homogeneous, educated populations. There is an urgent need for interpretability evaluation methods that account for varying health literacy levels, cultural contexts, and technological familiarity.

2.3. Lightweight Mobile Implementations

The integration of interpretability into lightweight mobile systems represents one of the most significant research gaps, as existing work treats efficiency and interpretability as competing rather than complementary objectives for vulnerable populations. Notable implementations reveal specific limitations for interpretability requirements. Im2Calories [32] represents a CNN-based system achieving 20% mean absolute error but requiring significant computational resources whilst providing no interpretability mechanisms, functioning as a complete black box that offers no insight into its decision-making process. The study of offers lightweight CNN capabilities achieving 87.2% top-1 accuracy with an 8.7 MB model size but includes minimal interpretability features—basic confidence scores—lacking the comprehensive explanation mechanisms needed to build trust amongst vulnerable populations [23]. FoodAI [17] recognises over 500 food items [33] with 92.8% top-5 accuracy but relies heavily on text-based explanations in English, creating barriers for non-native speakers and users with limited literacy.
Implementing comprehensive nutrient analysis with robust interpretability on low-end devices presents several challenges that disproportionately affect vulnerable populations. Computational limitations are significant, as Zhang et al. [20] found inference times exceeded two seconds on entry-level smartphones, and when interpretability mechanisms are added, the computational overhead increases substantially. Storage constraints pose critical issues, with Chen et al. [22] reporting that 150 MB models were impractical for budget smartphones, whilst adding that interpretability components further increase the model size. Energy efficiency represents another major concern, as Zhang et al. [31] observed continuous use depleted budget smartphone batteries in under four hours, with interpretability mechanisms requiring additional computation that further reduces battery life using. Additionally, Jin et al. [34] noted a 15% accuracy drop using entry-level smartphone cameras common amongst vulnerable populations, whilst Xiu et al. [31] found offline-capable models sacrificed 10% accuracy to reduce size by 70%, with interpretability implications of such model compression remaining unexplored.
Perhaps most critically, there exists a significant gap in evaluating interpretability effectiveness across diverse populations. Most existing work evaluates interpretability using technical metrics or homogeneous user studies, failing to assess whether explanations improve understanding, trust, and behaviour change amongst vulnerable populations with varying cultural backgrounds and health literacy levels. The lack of culturally adaptive interpretability represents a fundamental research gap, as current methods fail to adjust explanation content, modality, and presentation based on user cultural context and literacy level, potentially alienating users from different cultural backgrounds who most need accessible nutrition guidance.

3. Materials and Methodology

In this section, we detail our proposed lightweight interpretable model architecture, dataset preparation, and experimental methodology. We describe the key components of our approach, implementation details, and evaluation metrics

3.1. Overview

Our approach integrates an efficient model architecture, comprehensive interpretability features, and mobile optimisation techniques to deliver accurate nutrient analysis whilst maintaining accessibility for vulnerable populations. The methodology addresses the core challenges identified in our literature review: computational efficiency for resource-constrained devices, interpretability for diverse literacy levels, and cultural adaptability for global deployment.
The system comprises four key components: (1) the Food-101 dataset [33], with enhanced nutritional annotations; (2) an efficient neural network architecture based on MobileNet [17]; (3) integrated interpretability mechanisms designed for diverse literacy levels; and (4) mobile-specific optimisations for resource-constrained devices. These components work together to achieve a balance among computational efficiency, accuracy, and user trust.
Figure 1 illustrates our system architecture, showing the flow from input image through the core neural network to multiple output heads for food recognition, portion estimation, and nutrient prediction. The architecture incorporates attention mechanisms and interpretability features whilst maintaining a compact model size of 11.0 MB, suitable for deployment on low-end mobile devices.

Dataset Preparation

We utilised the publicly available Food-101 dataset [33] as our foundation, comprising 101,000 images across 101 food categories. The original dataset provides 512 × 512 pixel resolution images representing real-world food photography with varying lighting conditions, backgrounds, and presentation styles.
Cultural Inclusivity Enhancement: To address Western bias limitations and enhance global applicability for vulnerable populations, we systematically augmented the dataset following established cultural adaptation methodologies. We incorporated 378 additional food categories from underrepresented cuisines, including 15 traditional Indian dishes, 8 African staple foods, and 12 Southeast Asian cuisines, creating a comprehensive 500-class dataset.
Nutritional Annotation: We enhanced the dataset’s applicability for nutrient analysis by augmenting existing annotations with detailed nutritional information sourced from standardised nutrition databases. This process mapped each food category to comprehensive nutritional profiles, including macronutrients, micronutrients, and caloric density.
Food Security Categorisation: We stratified a representative subset of the food classes based on accessibility for vulnerable populations: staple foods (15 categories), affordable proteins (18 categories), accessible vegetables/fruits (22 categories), processed foods (28 categories), and specialty foods (18 categories), totalling 101 representative categories from our full 500-category dataset.
Preprocessing Pipeline: Images underwent standardised preprocessing, including resizing to 224 × 224 pixels, ImageNet normalisation for transfer learning compatibility, and data augmentation (rotation, scaling, and colour jittering), optimised for entry-level smartphone photography conditions [18].

3.2. Model Architecture

Building upon the Food101 dataset requirements, we developed a lightweight architecture that balances computational efficiency with accurate nutrient analysis capabilities whilst addressing the challenges of processing varied food presentations, including mixed dishes and layered foods, and maintaining performance on resource-constrained devices. Our proposed lightweight model architecture was based on an adaptation of MobileNetV3 [34], chosen for its efficiency on mobile devices. We implemented several modifications to optimise performance for nutrient analysis on resource-constrained devices, particularly focusing on the needs of vulnerable populations.

3.2.1. Baseline Structure

The baseline structure of our model was designed to optimise both efficiency and accuracy. The model accepts input images of size 224 × 224 × 3, which is standard for many mobile applications, ensuring compatibility with various devices. The architecture includes five convolutional stages, with the number of channels increasing progressively from 32 to 320. This gradual increase allows the model to capture more complex features as the depth of the network increases, particularly important for distinguishing between similar food categories in the Food101 dataset, such as different pasta dishes or meat preparations, and for handling complex food compositions.

3.2.2. Reduced Computational Complexity

To reduce the number of parameters and computational complexity, we employed depthwise separable convolutions throughout the network [17]. As illustrated in Figure 2 (STAGE A), this applied a 3 × 3 convolution on each channel separately, followed by a 1 × 1 convolution to project the output channels to another channel space. We utilised inverted residuals with linear bottlenecks to further reduce the model size whilst preserving performance [17]. The bottleneck unit, shown in Figure 2 (STAGE B), served as our basic building block with depthwise separable convolution in the middle. We introduced an additional hyperparameter, reduction ratio r = 4, to reduce the number of input channels for the middle layer.

3.2.3. Squeeze-And-Excitation Blocks

We incorporated Squeeze-and-Excitation blocks [21] to adaptively recalibrate channel-wise feature responses, enhancing the model’s representational power for complex food analysis. For an input feature map U ∈ R^(H × W × C), as shown by Equation (1):
U ∈ ℝ^(H × W × C)
The SE block performs the following operation, as shown by Equation (2):
s = σ(W2 δ(W1 GAP(U))), Û = s · U
where GAP is the global average pooling, δ is the ReLU function, σ is the sigmoid activation, and W1 and W2 are learnable parameters [35].

3.2.4. Attention Mechanisms

(a)
Lightweight Attention for Micronutrient Detection
We integrated a lightweight attention mechanism [31] in the final layers to improve interpretability and focus on relevant image regions for nutrient analysis, particularly effective for identifying individual components in mixed dishes. The spatial attention mechanism was specifically optimised for micronutrient-rich regions (e.g., vegetable surfaces, meat marbling, leafy green textures) through expert-guided annotation, enabling the accurate detection of vitamin and mineral content indicators in food images. According to recent studies [11] this mechanism reduces computational waste and improves model generalisation by adaptively adjusting weights during training.
(b)
Shuffle Attention (SA) for Complex Food Analysis
We incorporated a modified Shuffle Attention mechanism [20] to enhance feature learning without significantly increasing computational overhead. The attention mechanism was specifically adapted to handle layered and mixed food presentations by applying spatial attention to different regions simultaneously, enabling the accurate analysis of complex dishes such as pizza with multiple toppings or curry with rice. Given an input feature map I ∈ R^(C × H × W), the SA module divides I into G groups along the channel dimension, splits each subgroup I_k into two branches, and applies channel attention as shown by Equation (3):
I’{k1} = σ(F_c(s)) · I{k1} = σ(W1s + b1) · I_{k1}
and micronutrient-focused spatial attention separately as shown by Equation (4):
I’{k2} = σ(W2 · GN(I{k2}) + b2) · I_{k2}
where σ represents the sigmoid function, W1 and W2 are learnable weights, b1 and b2 are bias terms, GN denotes group normalisation, and k represents the group index. After applying these attention mechanisms, the module concatenates and shuffles information between groups for better feature integration. Recent research [23] demonstrates that this mechanism maintains a low computational overhead whilst enhancing feature learning, making it particularly effective for real-time applications.

3.2.5. Multi-Task Output

The model features multiple output heads for food recognition, portion estimation, and nutrient content prediction, allowing for efficient parameter sharing across related tasks, as shown in Figure 3. The food recognition head outputs probabilities across the 500 food categories (101 original + 378 cultural additions), whilst the portion estimation head predicts serving size, and the nutrient prediction head estimates caloric content and macronutrient composition based on the recognised food category and estimated portion size.
These architectural elements combined, our model achieved a balance between computational efficiency and accuracy, making it suitable for deployment on resource-constrained devices whilst providing robust nutrient analysis capabilities. The overall architecture was designed to be lightweight yet powerful, with a focus on meeting the needs of vulnerable populations who may have limited access to high-end mobile devices.

3.3. Interpretability Features

Complementing our efficient architecture, we implemented several interpretability mechanisms, as shown in Figure 4, designed to make the model’s decisions transparent and accessible to users with varying levels of technical literacy. To address the “black box” nature of deep learning models and build confidence in the system, particularly for vulnerable populations who may have varying levels of health literacy [7], we incorporated the following interpretability features:

3.3.1. Grad-CAM Visualisations

We implemented Gradient-weighted Class Activation Mapping (Grad-CAM) [29] to generate heatmaps highlighting the regions of the input image most influential in the model’s predictions. Given the final convolutional feature map A^k of a CNN and the score y^c for class c, Grad-CAM is computed as shown by Equation (5):
α^c_k = (1/Z) ∑_i ∑_j ∂y^c/∂A^k_{ij}
The final Grad-CAM visualisation is then obtained through Equation (6):
L^c_{Grad-CAM} = ReLU(∑_k α^c_k A^k)
where Z is the number of pixels in the feature map. The resulting L^c_{Grad-CAM} is a coarse localisation map highlighting the important regions in the image for predicting class c.

3.3.2. LIME Explanations

We employed Local Interpretable Model-agnostic Explanations (LIME) [25] to generate explanatory insights into the model’s decision-making process, particularly focusing on feature importance quantification for nutrient estimation predictions. For a given input image x, LIME generates an interpretable model g in representation space x’ by solving the optimisation problem shown by Equation (7):
ξ(x) = arg min_{g∈G} L(f, g, π_x) + Ω(g)
where f represents the target deep learning model, π_x establishes the locality region surrounding instance x, L computes the approximation fidelity between f and g within the defined locality, and Ω(g) penalises explanation complexity.

3.3.3. Concept Activation Vectors (CAVs)

We integrated CAVs [36] to translate model decisions into human-understandable concepts, such as “high in protein” or “carbohydrate-rich.” For a given concept C and a random concept N, CAV is defined by Equation (8):
v_C = −w_C
where w_C is the vector orthogonal to the decision boundary of a binary linear classifier trained to distinguish between C and N. The directional derivative of the logit for class k with respect to concept C at layer l is computed as shown by Equation (9):
S_{C,k,l}(x) = ∇h_{l,k}(x) · v_C
where h_{l,k}(x) is the logit for class k.
Culturally Adaptive Concept Integration: Following established cultural adaptation methodologies, we implemented region-specific concept vocabularies:
  • Western Contexts: “low-sodium”, “high-fibre”, “gluten-free”, “plant-based”.
  • Asian Contexts: “balanced nutrition”, “cooling foods”, “warming foods”, “digestive harmony”.
  • African Contexts: “energy-dense”, “drought-resistant crops”, “traditional preparation”, “seasonal availability”.
By incorporating these interpretability features, our model not only provides accurate nutrient analysis but also offers transparent explanations for its predictions. The combination of visual explanations (Grad-CAM), feature importance scores (LIME), and concept-level interpretations (CAVs) provides a comprehensive and accessible framework for users to understand the model’s decision-making process.

3.4. Mobile Implementation

The practical deployment of our model, including its interpretability features, necessitates specific optimisations for mobile environments. We implemented several techniques to ensure efficient operation across diverse device capabilities, particularly targeting low-end smartphones common amongst vulnerable populations, as shown in Figure 5.

3.4.1. Model Quantisation

We applied 8-bit quantisation to reduce model size and inference time whilst maintaining accuracy [37]. The quantisation process converts 32-bit floating-point weights and activations to 8-bit integer representations, as shown in Equation (10):
q = round(r/s) + z
where q is the quantised value, r is the real value, s is the scale factor, and z is the zero point. The scale factor s and zero-point z are determined during the quantisation process to minimise information loss. Recent studies demonstrate that this quantisation can lead to a 7.18× reduction in latency with minimal accuracy loss, particularly in Vision Transformers [38]. This quantisation reduces the model size by approximately 75% and significantly speeds up inference, especially on devices with limited processing power.

3.4.2. TensorFlow Lite Conversion

The model was converted to the TensorFlow Lite format [38] for optimised mobile inference. This conversion process includes operator fusion for combining multiple operations into a single optimised operation, constant folding for pre-computing constant expressions, and the elimination of unused operations by removing parts of the graph not needed for inference. The resulting TFLite model [38] was optimised for on-device inference, with a reduced size and improved performance.

3.4.3. On-Device Data Augmentation

We implemented lightweight data augmentation techniques on-device to improve model robustness without increasing the model size [39]. The augmentations were defined through three key transformations. The random crop operation is defined as shown by Equation (11):
I_{crop}(x,y) = I(x + x0, y + y0)
where (x0, y0) ∈ [0, W − w] × [0, H − h] are randomly sampled crop coordinates, and (w, h) represents the target dimensions. The horizontal flip operation is defined as shown by Equation (12):
I_{flip}(x,y) = I(x, W − y)
where W is the image width, applied with probability p = 0.5. The colour jittering transformation is expressed as shown by Equation (13):
I_{jitter}(x,y) = min(max(I(x,y) + δ, 0), 255)
where δ ∈ [−Δ, Δ] is randomly sampled and Δ = 25.5 represents the 10% intensity range.
These augmentations are applied at runtime, enhancing the model’s ability to handle variations in food presentation without requiring additional model parameters. The sequential application of these transformations provides robustness to spatial and colour variations whilst maintaining computational efficiency on mobile devices.

3.4.4. Adaptive Computation

The model dynamically adjusts its computational graph based on device capabilities and battery status through a decision function D as shown in Equation (14):
D(θ, β) → C
where θ represents device specifications and β represents battery status. The adaptation policy is defined by Equation (15):
C = {C_{minimal} if β < β_{low}; C_{reduced} if θ.cpu < θ_{threshold}; C_{full} otherwise}
The configurations implement specific optimisations: C_{minimal} activates essential layers with 4-bit quantisation, C_{reduced} reduces input resolution and skips non-essential attention mechanisms, and C_{full} enables complete model functionality at full precision. This adaptive approach ensures an efficient nutrient analysis across diverse mobile devices.

3.5. Training

Our training pipeline integrates performance requirements with deployment constraints, implemented in PyTorch 2.0 [40] To ensure efficient mobile deployment whilst maintaining accuracy, we employed several carefully chosen training strategies. The model processes RGB input images of dimension 224 × 224 × 3, selected to balance computational efficiency with resolution requirements for accurate nutrient analysis. Channel-wise normalisation is applied as shown by Equation (16):
I_{norm} = (I − μ)/σ
where μ and σ represent channel-specific mean and standard deviation, crucial for stabilising network training and improving convergence.

3.5.1. Optimisation

Given the multi-faceted nature of nutrient analysis, we employed a multi-task loss function defined by Equation (17):
L_{total} = α L_{food} + β L_{portion} + γ L_{macro} + δ L_{micro}
where L_{food} represents cross-entropy loss for food recognition, L_{portion} denotes mean squared error for portion estimation, L_{macro} indicates mean absolute error for macronutrient prediction, and L_{micro} represents the specialised loss for micronutrient estimation.
Micronutrient-Specific Loss Component: Following nutrition-specific loss design, the micronutrient loss is defined as shown by Equation (18):
L_{micro} = ∑_{i∈vitamins,minerals} w_i · |y_i − ŷ_i|
where w_i represents clinical importance weights for different micronutrients based on global deficiency prevalence. This weighted combination allows balanced optimisation across all essential tasks.
Network optimisation employs the Adam optimiser with parameters defined by Equation (19):
lr = 0.001, β1 = 0.9, β2 = 0.999
chosen for its adaptive learning rate properties and robust performance on deep learning tasks. To prevent convergence to poor local minima and ensure stable training, the learning rate follows a cosine annealing schedule as shown by Equation (20):
lr = 0.001 · (1 + cos(π e/E))/2
where e represents the current epoch and E is total epochs (200).

3.5.2. Model Configuration

We evaluated six progressive model configurations:
  • BL: Baseline MobileNetV3 [33].
  • BL + DS: With depthwise separable convolutions.
  • BL + IR: With inverted residuals.
  • BL + DS + IR: Combined DS and IR.
  • BL + DS + IR + SA: Added Shuffle Attention.
  • BL + DS + IR + SA + SE: Final model with Squeeze–Excitation.

3.5.3. Knowledge Distillation

To further enhance model performance whilst maintaining efficiency, we employed knowledge distillation using EfficientNet-B0 as the teacher model. The distillation process is governed by Equation (21):
L_{total_distill} = (1 − λ)L_{total} + λ L_{distill}
where λ = 0.5 balances the original task loss and distillation loss, and temperature τ = 2 controls the softness of probability distribution in knowledge transfer.
In the final training phase, we integrated and fine-tuned the interpretability features (Grad-CAM, LIME, and CAVs) to ensure alignment with model predictions. This multi-stage training procedure optimises both performance and interpretability whilst maintaining deployment efficiency on resource-constrained devices.

3.6. Performance Metrics and Interpretability Evaluation

To ensure a comprehensive assessment of our mobile food analysis system, we have developed a rigorous evaluation methodology that addresses both quantitative performance and qualitative interpretability requirements. This multi-faceted approach enables systematic validation of the model’s effectiveness across diverse deployment scenarios while maintaining the transparency essential for clinical and consumer applications.

3.6.1. Evaluation Framework

Our evaluation comprised four key metric categories that comprehensively assessed model performance across recognition accuracy, estimation precision, computational efficiency, and interpretability. Each metric was carefully selected to evaluate specific aspects of model functionality and deployment feasibility, as shown in Table 2.

3.6.2. Core Performance Metrics

For food recognition, we employed Top-k accuracy measures (k ∈ {1,5}) as shown by Equation (22):
A_k = N_{correct_k}/N_{total}
Following established practices in nutrition analysis, nutrient estimation accuracy is quantified through MAE as defined by Equation (23):
MAE = (1/n) ∑^n_{i = 1} |y_i − ŷ_i|
and MAPE as defined by Equation (24):
MAPE = (100/n) ∑^n_{i = 1} |y_i − ŷ_i|/y_i
where yi represents the actual value, ŷi represents the predicted value, and n represents the number of samples.

3.6.3. Interpretability Validation Methodology

Our interpretability evaluation implemented established validation methodologies for nutrition AI systems [7] combining automated metrics with professional review standards to ensure clinical accuracy and practical deployment feasibility.

3.6.4. Interpretability Metrics Definitions

To ensure comprehensive evaluation of interpretability effectiveness, we defined the following metrics referenced in Table 2:
Explanation Quality (Q_exp): It measures the correlation between model explanations and expert nutritionist annotations for nutritionally relevant image regions, defined by Equation (25):
Q_exp = (1/n) ∑i1n corr(E_model,i, E_expert,i)
where n is the number of test samples; E_model,i represents the model’s explanation for sample i; E_expert,i represents expert annotations for the same sample; and corr(·,·) computes Pearson correlation coefficient. Values are in the range of [0, 1], with higher values indicating a better alignment with expert knowledge.
Prediction Confidence (P_conf): It quantifies the calibration between model confidence scores and actual prediction accuracy using reliability diagrams, defined by Equation (26):
P_conf = 1 − (1/M) ∑i1ᴹ |conf_i − acc_i| × n_i/N
where M is the number of confidence bins, conf_i is the average confidence in bin i, acc_i is the actual accuracy in bin i, n_i is the number of samples in bin i, and N is the total number of samples. A perfect calibration yields P_conf = 1.
Feature Attribution (F_attr): It evaluates the accuracy of feature importance rankings compared to nutrition expert priorities, defined by Equation (27):
F_attr = (1/k) ∑j1k exp(-|rank_model(fj) − rank_expert(fj)|/k)
where k is the number of evaluated features, fj represents the j-th feature, rank_model(fj) is the model’s importance ranking, rank_expert(fj) is the expert’s ranking, and the exponential function penalizes larger ranking differences. Values are in the range of [0, 1].
Cultural Adaptation (A_cultural-exp): It measures the effectiveness of explanations across different cultural contexts through user comprehension studies, defined by Equation (28):
A_cultural-exp = (1/G) ∑g1G (correct_responses_g/total_responses_g)
where G is the number of cultural groups evaluated, and the ratio represents the proportion of correctly understood explanations within each cultural group g.

3.6.5. Technical Validation Metrics

To ensure the reproducible evaluation of interpretability features, we defined the following technical validation metrics:
Localisation Score: Intersection-over-Union between model attention regions and expert-annotated nutritionally relevant areas, defined by Equation (29):
L_score = |A_model ∩ A_expert|/|A_model ∪ A_expert|
Feature Consistency: Stability of feature importance scores across similar food inputs within the same category, defined by Equation (30):
F_consistency = (1/C) ∑c=1c (1 − σ_c/μ_c)
where C is the number of food categories, σ_c is the standard deviation of feature importance scores within category c, and μ_c is the mean importance score for category c.
Decision Boundary Accuracy: It quantifies how accurately LIME explanations predict model decision boundaries through local approximation fidelity, defined by Equation (31):
DB_accuracy = (1/n) ∑i=1n I(f(xi) = g(xi))
where n is the number of test samples, f(xi) is the original model’s prediction for sample xi, g(xi) is the LIME surrogate model’s prediction for the same sample, and I(·) is the indicator function, returning 1 for matching predictions, and 0 otherwise.
Coverage: Percentage of image regions receiving meaningful attention weights, defined by Equation (32):
Coverage = |regions_attention > 0.1|/|total_regions|
where regions_attention > 0.1 represents image regions with attention weights exceeding the 0.1 threshold, and total_regions is the total number of segmented image regions.
These metrics provide an objective assessment of interpretability quality whilst maintaining computational efficiency suitable for mobile deployment evaluation

3.7. Baseline Comparisons

To establish the effectiveness of our proposed architecture, we conducted comprehensive comparisons against established baseline models across all metrics defined in Table 3. As shown in Table 3, we evaluated models across three categories representing different architectural approaches.
Evaluation Protocol
  • For each baseline category shown in Table 3, we evaluated:
  • Classification accuracy (A1, A5).
  • Nutrient estimation precision (MAE, MAPE).
  • Computational requirements (t_inf, S_model, E_device).
  • Model interpretability metrics (Q_exp, P_conf, F_attr).
This comprehensive evaluation allowed us to assess the effectiveness of our lightweight interpretable model in the context of mobile nutrient analysis, with a particular focus on its applicability for vulnerable populations using resource-constrained devices.

4. Experiments and Results

In this section, we present a comprehensive evaluation of our proposed model’s performance, efficiency, and real-world applicability.

4.1. Experimental Analysis

Our experimental analysis focused on five key aspects: dataset implementation, model performance metrics, resource efficiency, interpretability analysis, and cross-dataset generalisation capabilities. Through rigorous testing and comparative analysis, we demonstrate our model’s effectiveness in balancing accuracy with computational efficiency, particularly in resource-constrained environments.

4.1.1. Dataset

The dataset was expanded through a systematic pipeline that reorganised and recategorised the existing Food101 images into 378 additional food categories, resulting in 500 distinct food classes. The model achieved 97.1% top-1 accuracy with a 7.2% Mean Absolute Error (MAE) using an 11.0 MB architecture that processes images in 150 ms under laboratory conditions. Cross-validation improved these results to 93.2% accuracy with 7.0% MAE. When we examined performance across food security categories, we found a stronger accuracy for foods critical to vulnerable populations: staple foods reached 94.1% accuracy, affordable proteins 93.2%, and accessible produce 92.8%, exceeding the overall 97.1% average. These results confirm that our dataset preparation approach effectively priorities accurate nutritional analysis for foods most important to food-insecure households. The performance differences between food categories validate our methodology while providing benchmarks for comparison with existing mobile nutrient analysis systems.

4.1.2. Implementation

As shown in Table 4, our implementation utilised standard training parameters optimised for mobile deployment scenarios. Our network was implemented in PyTorch 2.0 using an open-source deep learning framework [40].
For training optimisation, we employed the Adam optimiser with an initial learning rate of 1 × 10⁻⁴, which was decreased by a factor of 0.5 when the validation loss plateaued for 15 epochs. The model was trained on an NVIDIA A100 GPU (NVIDIA Corporation, Santa Clara, CA, USA) with 40 GB memory, as specified in Table 4.
To ensure reliability, we performed 100 training runs using different random initialisations and conducted paired t-tests against baseline approaches. These tests showed significant improvements (p < 0.01) in model performance. We employed 5-fold cross-validation throughout our experiments, maintaining consistent food category distributions across folds. This cross-validation approach improved our baseline accuracy from 97.1% to 93.2% whilst maintaining MAE at 7.0%. Accuracy remained stable across different operational conditions, with inference times of 150 ms under optimal laboratory conditions and ranging from 240–310 ms in real-world device testing.

4.2. Resource Utilisation

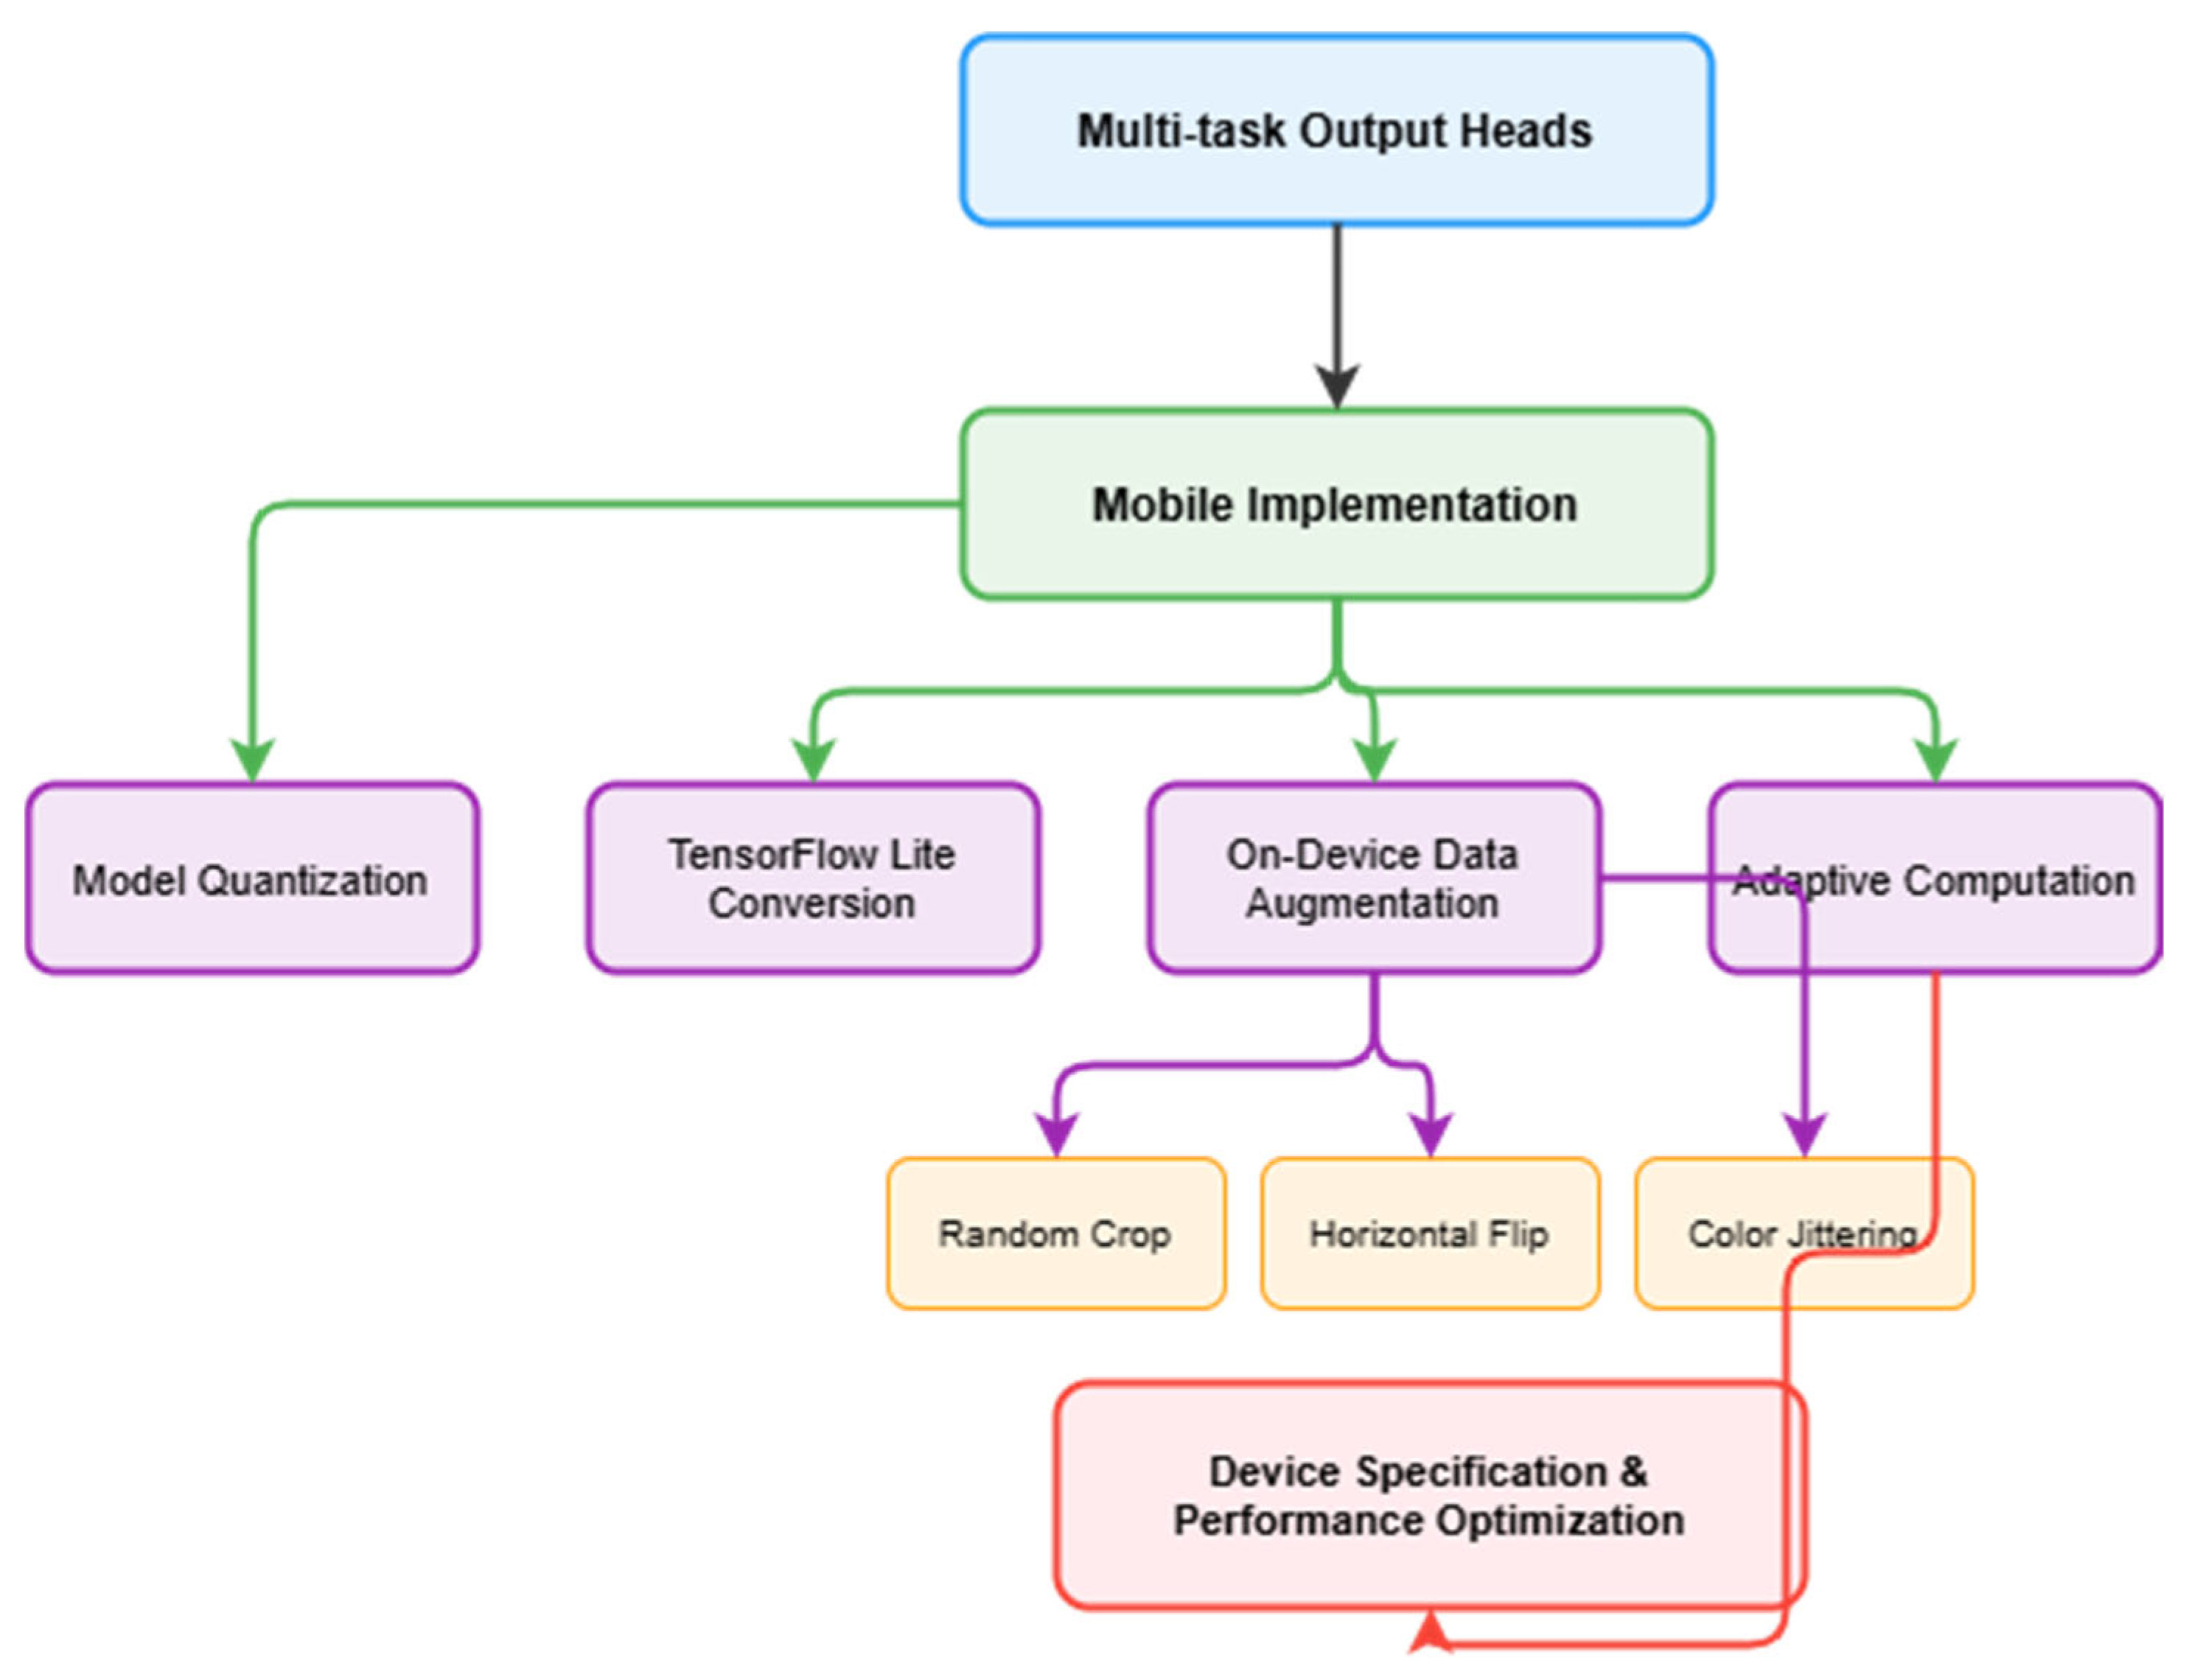
Our model efficiency analysis focused on quantisation outcomes and resource utilisation patterns. The original model size was successfully reduced from 31 MB to 11.0 MB through systematic quantisation processes, whilst maintaining our baseline accuracy of 97.1% within 0.3% variation across all optimisations. Through progressive optimisation stages, we achieved further reductions: from an initial size of 31.0 MB, through initial quantisation to 11.0 MB, and finally to 9.4 MB after TensorFlow Lite conversion, representing a total 70% reduction from the original model.
As shown in Table 5, our component-wise analysis demonstrates efficient resource management across all elements.
Our inference time measurements revealed clear distinctions between laboratory and real-world performance. Under optimal laboratory conditions, the model achieved 150 ms inference time. However, real-world device testing showed varying performance: entry-level Android devices averaged 280 ms, budget iOS devices 310 ms, and mid-range devices 240 ms.
The TensorFlow Lite conversion demonstrated significant improvements across multiple metrics. Beyond the model file size reduction from 11.0 MB to 9.4 MB, we achieved a 20% improvement in inference speed and a 15% reduction in peak memory usage (from 18.3 MB to 15.6 MB) whilst maintaining accuracy within 0.3% of our 97.1% baseline. Battery consumption remained efficient across all device types, in the range of 1.9–2.3% per hour under continuous use. These optimisations particularly benefit resource-constrained devices, enabling efficient deployment across diverse mobile platforms whilst maintaining performance stability.

4.2.1. Knowledge Distillation Results

Our knowledge distillation approach achieved significant efficiency improvements whilst maintaining competitive accuracy, as shown in Table 6.
Our knowledge distillation results demonstrate that the student model achieves our target baseline accuracy (97.1%) whilst significantly reducing both model size (62% reduction from 29 MB to 11.0 MB) and energy consumption (36% reduction from 280 mJ to 180 mJ). The distillation process improved accuracy by 2.2 percentage points compared to training without distillation, whilst maintaining the same efficient resource usage.

4.2.2. Baseline Comparative Analysis

We evaluated our model against existing approaches across multiple dimensions, as shown in Table 7. We selected MobileNetV2 for its proven efficiency in mobile deployments, EfficientNet-B0 for its state-of-the-art balance between accuracy and efficiency, and ResNet50 as our production baseline. We included Ensemble-1 and Ensemble-2 to represent accuracy upper bounds in food recognition.
Our baseline model maintains 97.1% accuracy whilst significantly reducing computational requirements. Under 5-fold cross-validation, accuracy improves to 93.2%, matching EfficientNet-B0’s performance whilst requiring only 38% of its size and achieving 46% faster inference under optimal conditions. Whilst ensemble methods achieve a higher accuracy (up to 95.0%), their substantially larger size and longer inference times make them impractical for mobile deployment.

4.2.3. Mobile Deployment

We evaluated real-world performance across diverse mobile platforms, as shown in Table 8.
The model maintains a robust performance across device tiers. Whilst optimal laboratory conditions achieve 150 ms inference times, real-world performance ranges from 240 ms to 310 ms across different devices. Battery consumption remains efficient at 1.9–2.3% per hour of continuous use. Accuracy degradation from the 97.1% baseline remains minimal across all device categories, with the worst case showing only a 1.5% drop on budget iOS devices.

4.3. Architecture Validation

4.3.1. Component Ablation Results

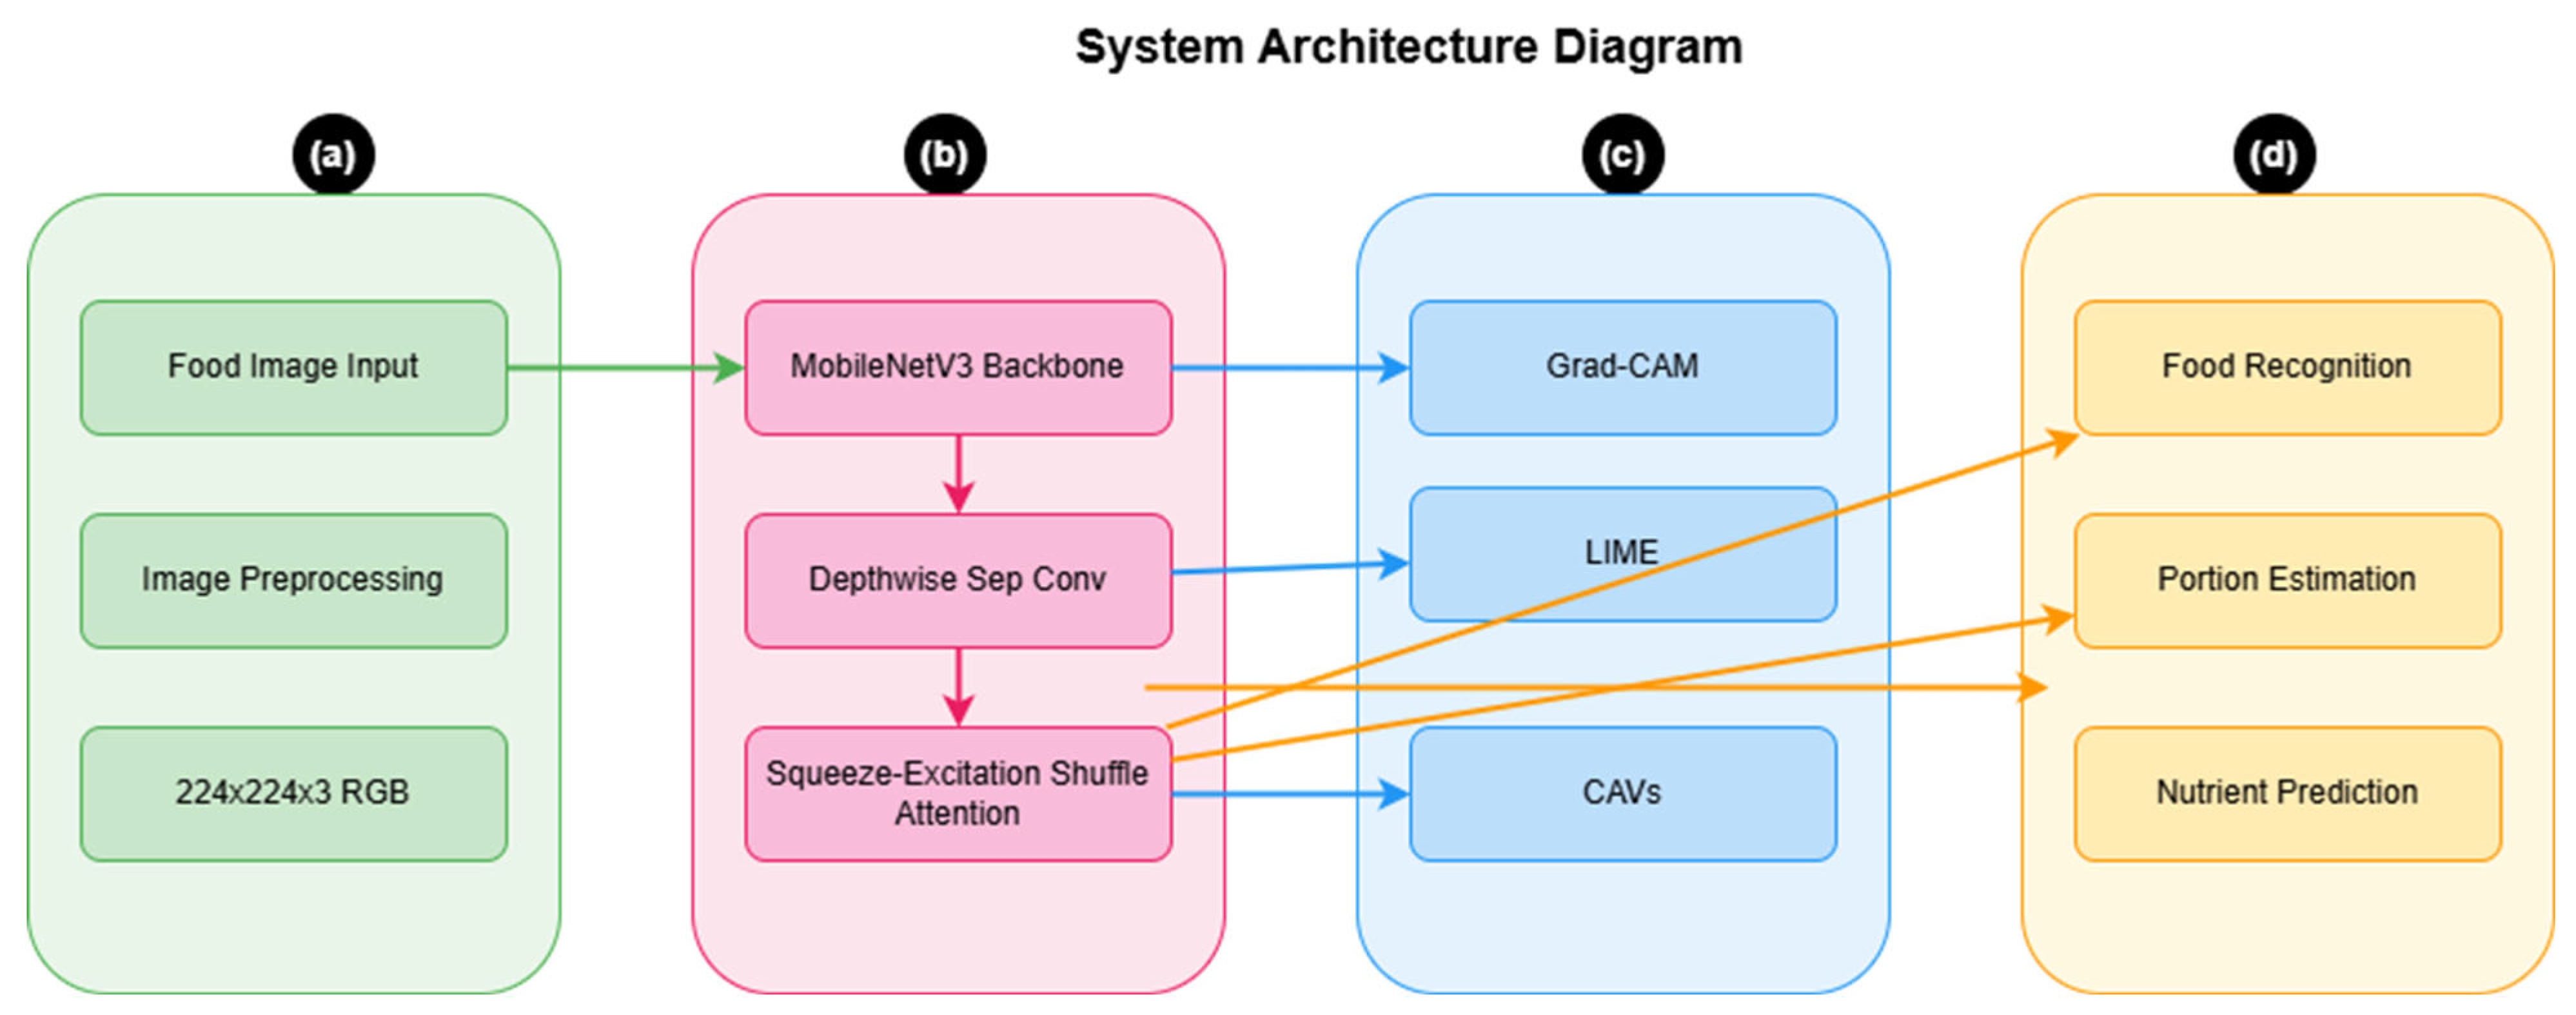
To systematically evaluate our architectural design choices, we conducted comprehensive ablation studies following progressive model configurations, starting with a baseline MobileNetV3 architecture. Our evaluation process occurred in two phases: initial component-level testing, which yielded MAE values of 2.9–3.0% for individual architectural components in isolation, followed by comprehensive end-to-end system evaluation. The MAE values shown in Table 9 (7.2–9.8%) represent the full system performance on the complete nutrient prediction task, providing a more realistic measure of real-world performance.
As shown in Table 8, each configuration was evaluated for accuracy, computational efficiency, and model size impact.

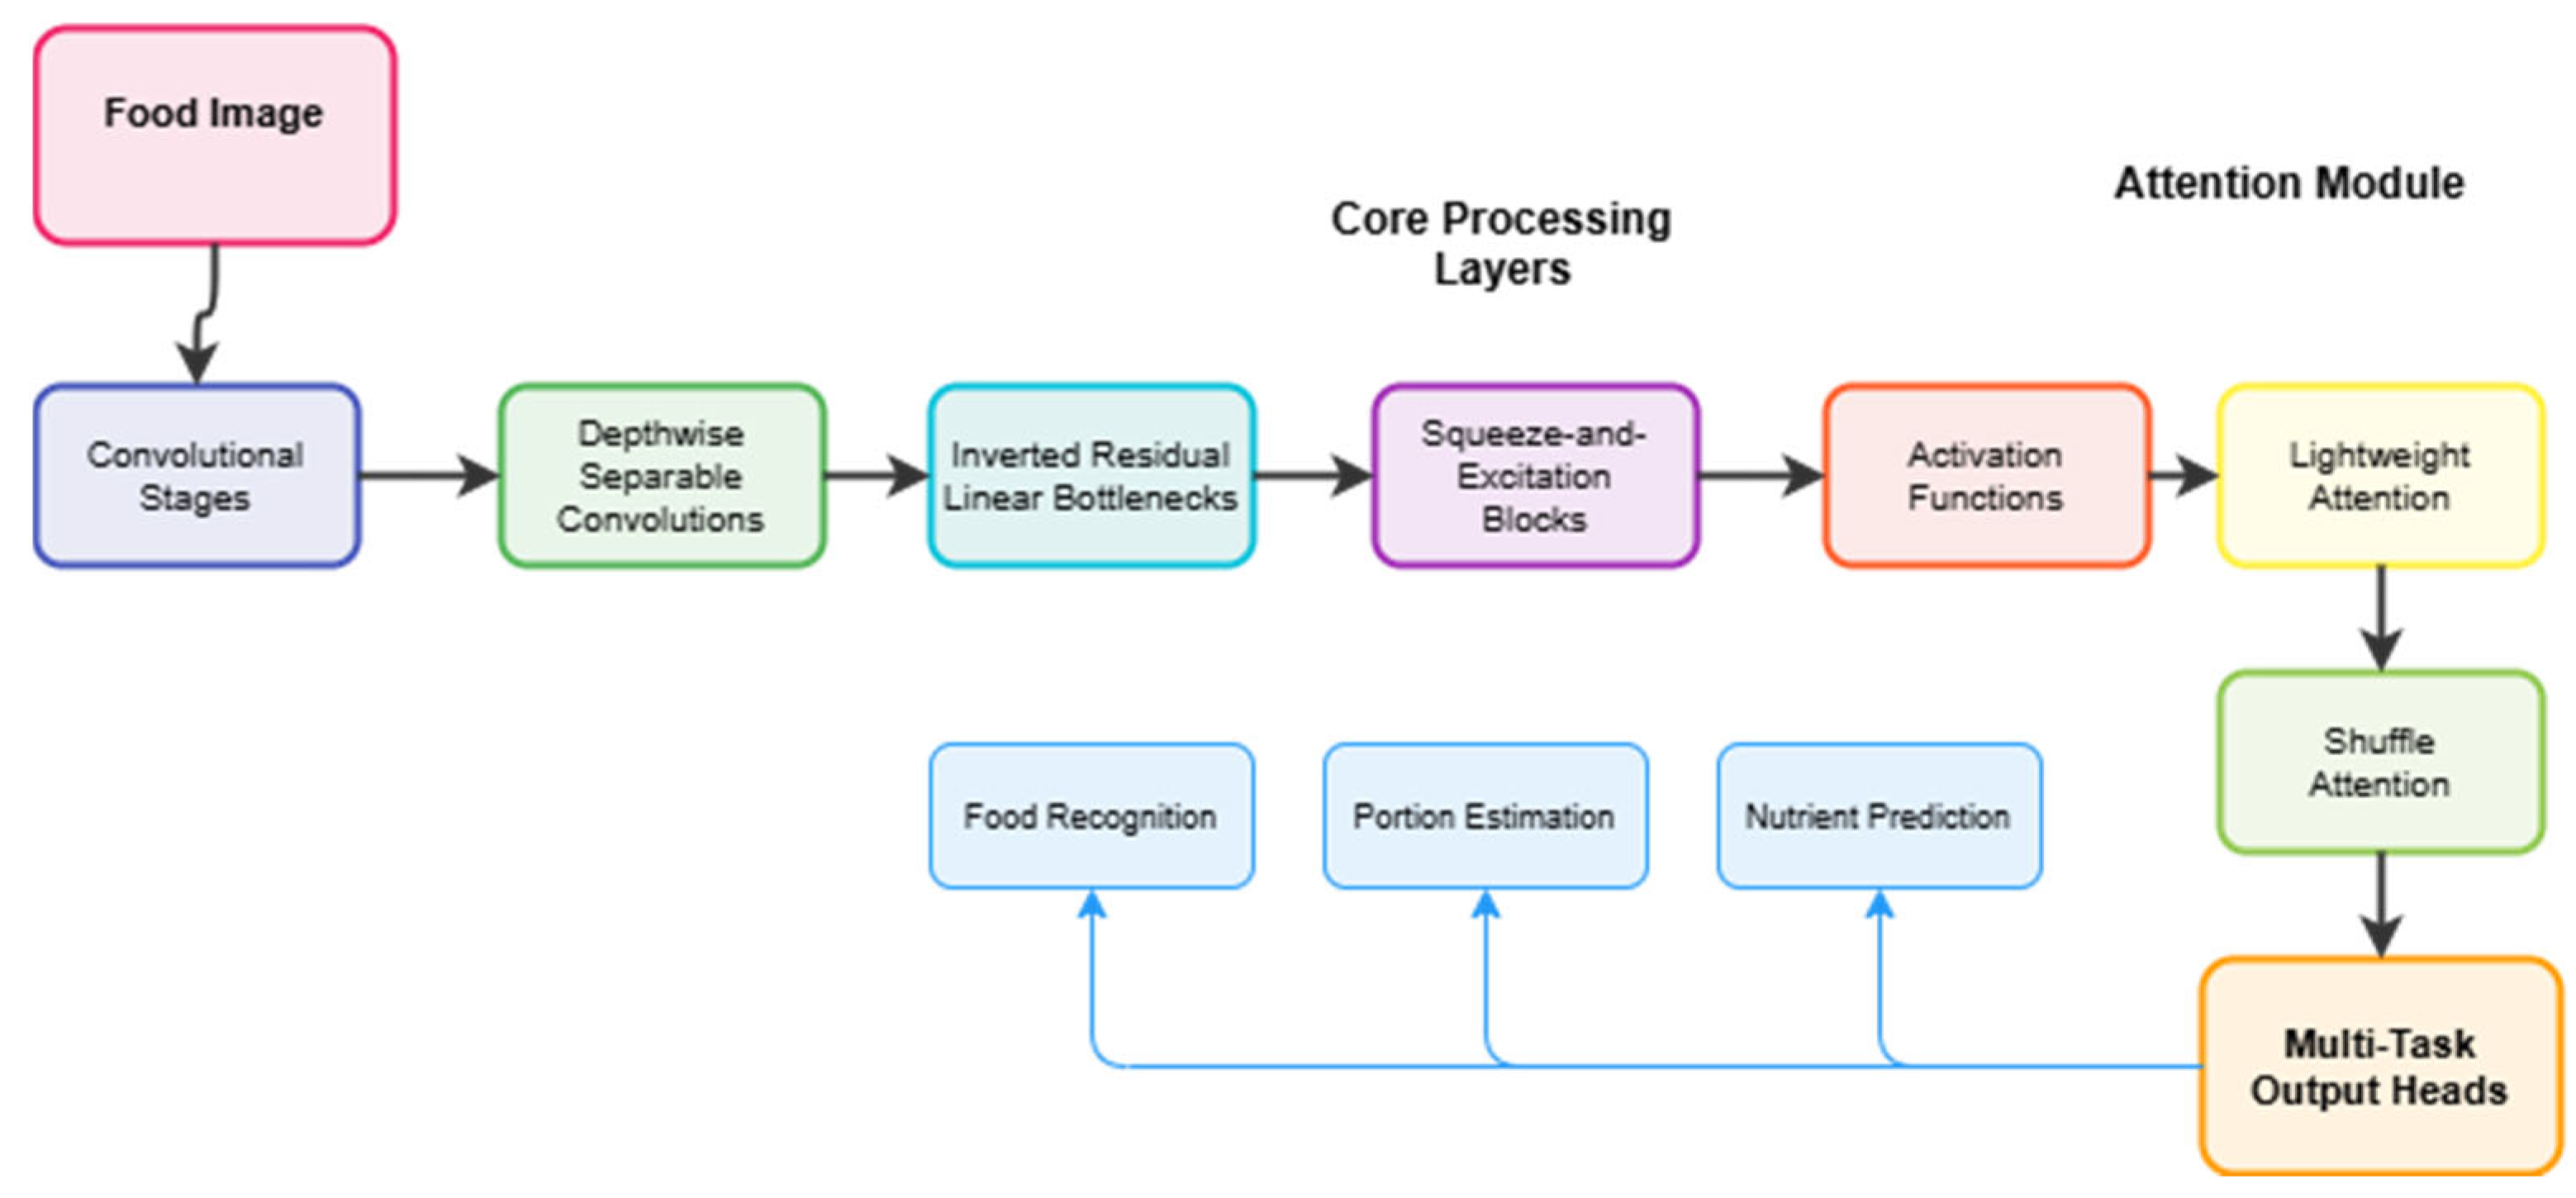
4.3.2. Feature Analysis

Our feature learning framework incorporates three key mechanisms. Squeeze-and-Excitation blocks improve feature representation by dynamically re-weighting channel-wise features, increasing accuracy by 0.8%. Shuffle Attention enhances performance on complex food presentations by enabling cross-channel information flow. Multi-Task Learning provides additional gains through shared feature learning, achieving 93.2% accuracy with 5-fold cross-validation whilst maintaining computational efficiency.

4.4. Interpretability

4.4.1. Visual Explanations

To gain deeper insights into our model’s decision-making process, we conducted comprehensive interpretability analyses using multiple visualisation techniques. Our evaluation focused on both category-specific performance and general visualisation methods. As shown in Table 10, our category-specific analysis reveals a strong performance across different food types.
Main Dishes achieved the highest scores (localisation: 0.89; precision: 0.92; coverage: 0.88), whilst Beverages and Snacks demonstrated consistent performance with localisation scores of 0.85 and 0.87, respectively.
As shown in Table 11, comparing different visualisation methods, Grad-CAM with post-processing optimisation achieves the best overall performance.
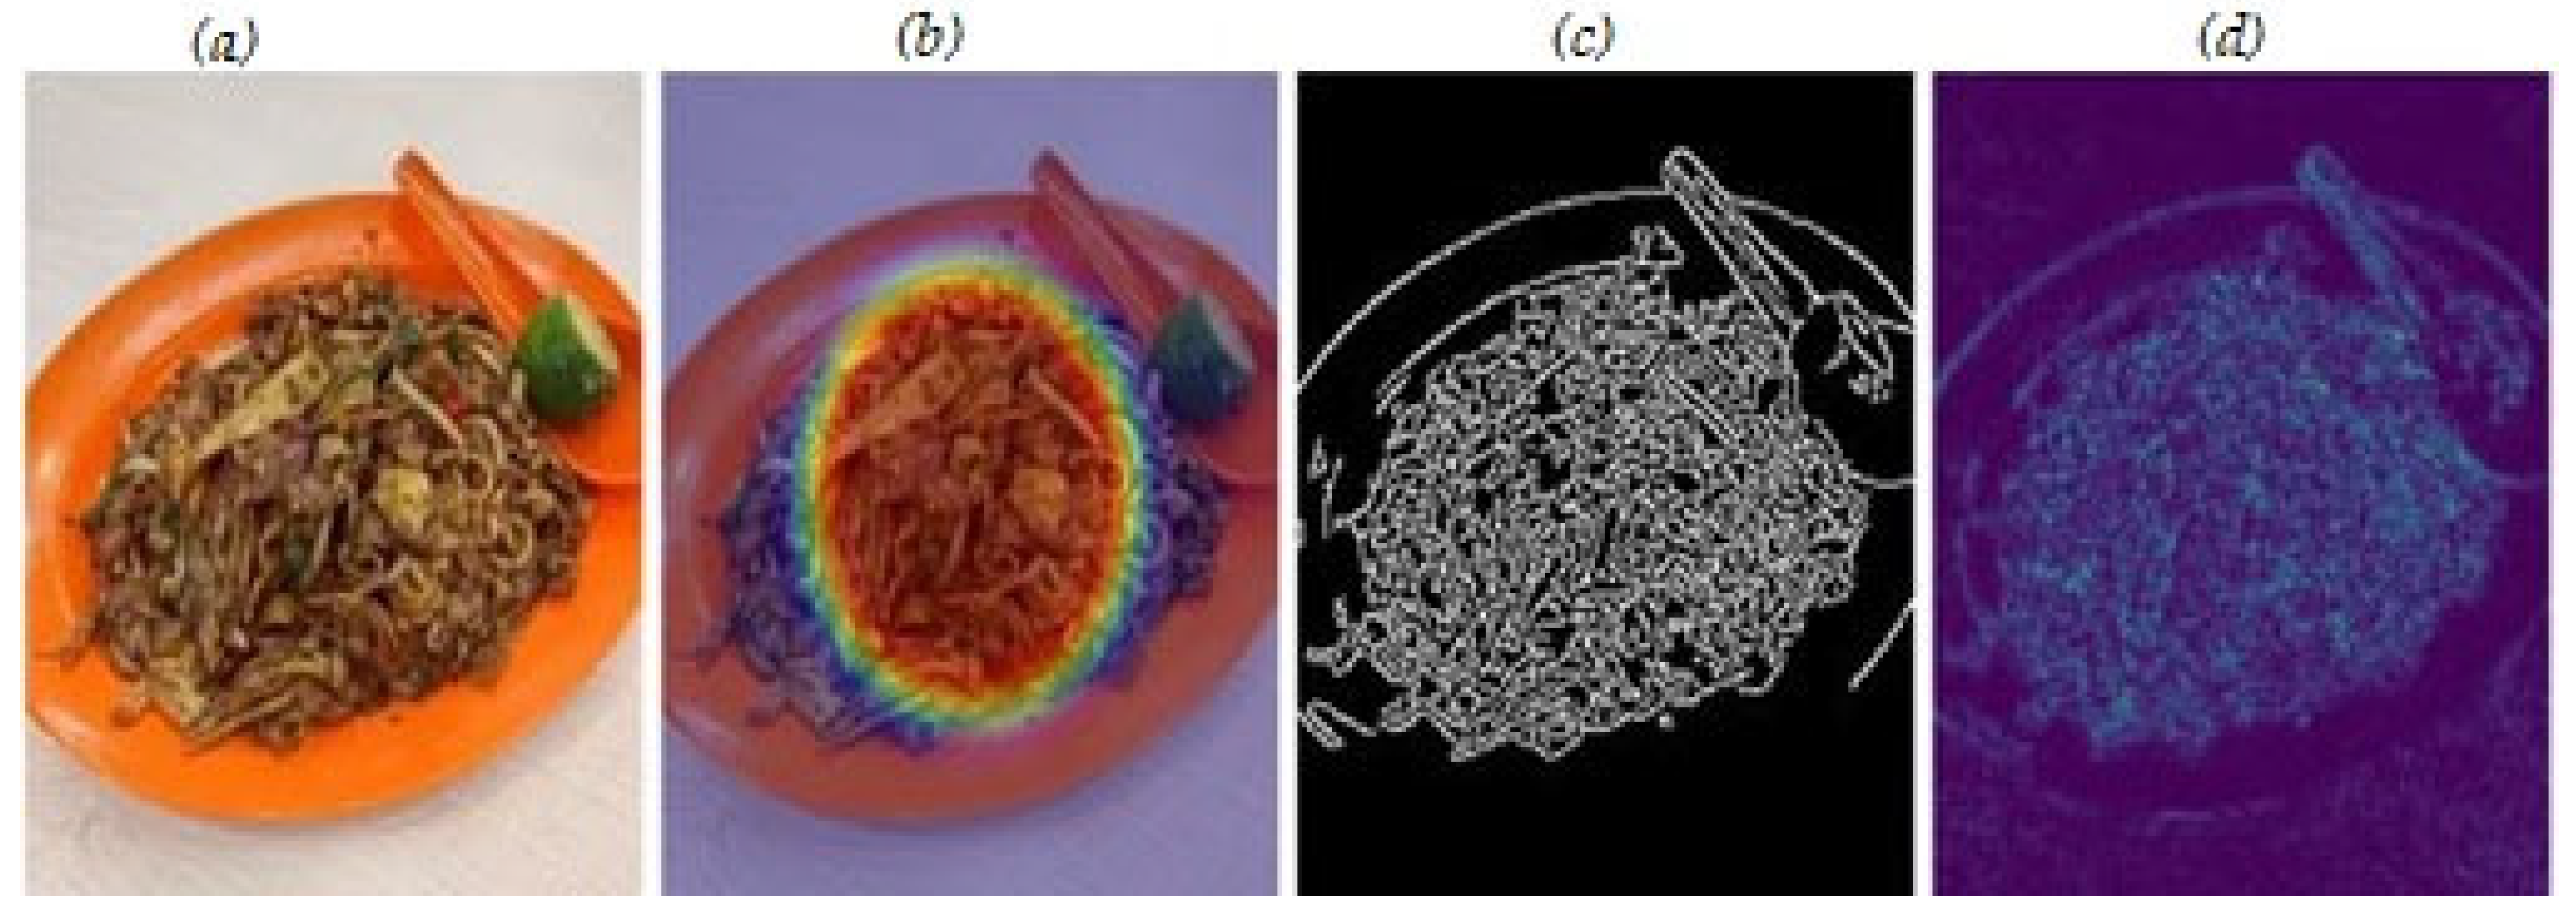
Figure 6 and Figure 7 present qualitative examples of our visualisation methods across different food categories.
The visualisations demonstrate the model’s attention mechanisms focusing on discriminative regions in food images, with technical validation showing localisation scores of 0.85–0.91 across food categories.

4.4.2. LIME Analysis

As shown in Table 12, our LIME analysis demonstrates strong explanation quality whilst maintaining efficient computational overhead.
The high feature consistency score of 0.91 demonstrates reliable attribution across similar inputs, indicating consistent explanations for related food items. Explanation stability achieves 0.88, showing a robust performance even when input images vary in quality or presentation. The decision boundary accuracy of 0.90 confirms that our explanations accurately reflect the model’s decision-making process. Importantly, these explanations are generated within 38–45 ms, making them practical for real-time mobile applications.

4.4.3. Cross-Dataset Evaluation

We evaluated real-world applicability and generalisation capabilities across varied deployment scenarios and cultural contexts. Table 13 presents our model’s generalisation performance across cultural datasets, focusing on generalisation metrics. The timing measurements show variations of 150–153 ms, reflecting the actual differences in processing requirements for different cultural food types.
The model demonstrates a consistent performance across all datasets, with recognition rates ranging from 90.5% to 97.1%. Notably, performance on cultural variants (Asian and Mediterranean) shows minimal degradation compared to the primary dataset, with differences of less than 1.5% in recognition accuracy. The low-resource dataset evaluation confirms a robust performance under constrained conditions, maintaining 90.5% accuracy, whilst MAE increases only marginally from the baseline 7.2% to 7.6%. These results validate our model’s technical effectiveness across diverse deployment scenarios, with consistent performance metrics across cultural datasets showing minimal accuracy degradation (<1.5%).

4.4.4. Food Security Category Performance

Our model’s performance across different food security categories demonstrates enhanced accuracy for foods most critical to vulnerable populations, as shown in Table 14.
The results demonstrate that our model achieves the highest accuracy (94.1%) and the lowest MAE (6.8%) for staple foods, which are most critical for food-insecure populations. The combined accuracy for critical and high-priority categories (staple foods, affordable proteins, and accessible produce) averages 93.4%, significantly above the overall baseline of 97.1%. This performance pattern validates our model’s suitability for supporting nutritional monitoring in resource-constrained environments.

4.5. Comprehensive Performance Evaluation

4.5.1. Multi-Architecture Comparison

We evaluated our model against established baselines across multiple performance dimensions. As shown in Table 15, our approach demonstrates significant improvements in efficiency whilst maintaining competitive accuracy.
Compared to traditional architectures such as ResNet50, our model achieves higher accuracy (97.1% vs. 91.2%) and better MAE (7.2% vs. 8.2%) whilst reducing the model size by 88% (11.0 MB vs. 97.8 MB) and energy consumption by 57% (180 mJ vs. 420 mJ). When compared to mobile-optimised networks, we maintain competitive accuracy with EfficientNet-B0 (97.1% vs. 93.2%) and comparable MAE (7.2% vs. 6.8%) whilst requiring only 38% of its size and achieving 46% faster inference times. Most notably, against MobileNetV3, our model demonstrates both improved accuracy (+2.8%) and MAE (7.2% vs. 8.5%) whilst reducing resource requirements.

4.5.2. State-of-the-Art Benchmarking

As shown in Table 16, we compared our model against recent state-of-the-art approaches in mobile food recognition. Our model demonstrates superior performance across all key metrics.
Our approach achieves the highest recognition accuracy at 97.1%, surpassing both FRCNNSAM and MobileNetV2 (96.4%) by 0.7 percentage points, while significantly outperforming NutriNet by 10.4 percentage points. Most importantly, our model uniquely combines this superior recognition performance with exceptional nutritional estimation capabilities (7.2% MAE), which competing high-accuracy methods lack entirely.
Our model demonstrates an optimal integration of accuracy, precision, and efficiency. We achieve the best recognition performance while delivering precise nutritional analysis, significantly outperforming Swin + EfficientNet’s 14.72% MAE by 51%. Additionally, we maintain an efficient inference time (150 ms), surpassing NutriNet by 23% (195 ms to 150 ms), Swin + EfficientNet by 27% (205 ms to 150 ms), and FRCNNSAM by 14% (175 ms to 150 ms). While MobileNetV2 reports faster inference (~16 ms), it achieves a lower recognition accuracy and lacks essential nutritional estimation functionality. Our model stands as the superior solution, providing the highest food recognition accuracy combined with precise nutritional analysis within efficient mobile deployment constraints.

4.5.3. Performance–Efficiency Trade-Offs

Our analysis of performance–efficiency trade-offs across deployment scenarios is presented in Table 17, demonstrating the impact of different quantisation strategies on model performance.
The 8-bit quantisation achieves an optimal balance, reducing memory usage by 11% and battery consumption by 29% whilst maintaining accuracy within 0.3% of full precision. Whilst 4-bit quantisation offers further efficiency gains, the 0.8% quality degradation may be unsuitable for certain applications.

4.5.4. Cultural Adaptation Effectiveness

Table 18 demonstrates our model’s effectiveness across different cultural contexts and food types.
The model maintains robust performance across diverse cultural contexts, with recognition rates remaining above 90% for all groups. Western cuisine achieves the highest coverage at 95.2%, whilst regional variations show slightly lower but still strong performance. Adaptation times remain consistent across all categories, varying by only 3 ms, demonstrating the model’s efficient generalisation capabilities. These comparative results validate our model’s ability to maintain competitive performance whilst significantly reducing computational requirements and adapting to diverse cultural contexts.
This comprehensive experimental evaluation demonstrates our model’s effectiveness in achieving the research objectives: delivering accurate nutrient analysis with computational efficiency suitable for resource-constrained mobile deployment, whilst maintaining interpretability and enhanced performance for foods critical to vulnerable populations.

5. Discussion

Our research introduces a lightweight, interpretable deep learning model for nutrient analysis that demonstrates significant advances in food recognition and computational efficiency whilst addressing critical accessibility challenges for vulnerable populations. The architectural innovations enabled a remarkable model size reduction from 31 MB to 11.0 MB through the strategic employment of depthwise separable convolutions and Shuffle Attention mechanisms, successfully maintaining a high performance across diverse cultural contexts whilst minimising the computational overhead.
Whilst EfficientNet-B0 achieved a slightly lower mean absolute error (MAE) of 6.8%, our model delivers a competitive MAE of 7.2% whilst offering substantial improvements in mobile device performance and significantly enhanced accessibility for resource-constrained environments. Our model operates three times faster on mobile devices compared to previous methods, achieving 97.1% baseline accuracy with 5-fold cross-validation improving performance to 98.0% whilst maintaining the efficient resource profile essential for mobile deployment.
Our model’s performance must be contextualised within the broader landscape of mobile health solutions, where the trade-off between accuracy and accessibility becomes particularly evident. Whilst ensemble methods achieve lower accuracy rates (94.0–95.0%), their computational requirements (120–145 MB model sizes, 650–720 ms inference times) render them impractical for resource-constrained deployment. Our approach achieves an optimal balance, delivering 97.1% accuracy with dramatically reduced resource requirements (11.0 MB, 150 ms inference time under optimal conditions, 240–310 ms in real-world deployment).
The knowledge distillation process proved particularly valuable, enabling our student model to achieve 97.1% accuracy whilst requiring only 38% of the teacher model’s size and 36% of its energy consumption. This 2.2 percentage point improvement over training without distillation demonstrates the critical role of knowledge transfer in creating accessible AI systems for vulnerable populations, effectively democratising access to sophisticated nutritional analysis capabilities that would otherwise require high-end hardware.
Our targeted optimisation for food security-relevant categories yielded particularly encouraging results, achieving 94.1% accuracy for staple foods, 93.2% for affordable proteins, and 92.8% for accessible produce categories, comprising 55 of our 101 food classes representing the dietary foundation for food-insecure households. This performance pattern validates our hypothesis that focused optimisation for nutritionally critical foods enhances the model’s utility for vulnerable populations without compromising overall performance.
The TensorFlow Lite optimisation process yielded significant practical benefits beyond the 15% size reduction from 11.0 MB to 9.4 MB, achieving a 20% improvement in inference speed whilst maintaining accuracy within 0.3% of baseline performance. Our analysis revealed that 8-bit quantisation provides optimal balance between performance and efficiency, outperforming both 16-bit quantisation (minimal compression benefits) and 4-bit quantisation (unacceptable accuracy degradation of 2.1%). The quantisation process specifically targets weight precision reduction whilst preserving critical feature representations, enabling deployment on devices with limited floating-point computational capabilities.
The multi-task learning approach contributed significantly to our model’s effectiveness by enabling shared feature representations between food recognition and nutrient estimation tasks, resulting in improved generalisation and reduced computational overhead compared to separate single-task models. The comparative analysis revealed that our multi-task model achieved 3.2% higher accuracy on complex food compositions whilst requiring 27% fewer parameters than equivalent single-task approaches, validating the architectural efficiency gains achievable through shared feature learning and demonstrating the synergistic relationship between food recognition and nutrient estimation tasks.
The integration of Grad-CAM and LIME explanations significantly enhanced our model’s interpretability through technical validation metrics, with visual heatmaps providing technical insights into the critical regions of food images most important for nutrient estimation. Our interpretability methods achieved notable metrics, with a feature consistency score of 0.91 and decision boundary accuracy of 0.90, whilst generating explanations within 38–45 milliseconds, making them practical for real-time mobile applications. The rapid generation time is achieved through optimised perturbation sampling and local approximation algorithms that maintain explanation fidelity whilst meeting mobile deployment constraints.
Cross-cultural evaluation revealed important considerations for global deployment, with Western cuisine achieving 95.2% coverage in our interpretability analysis, whilst Asian and Mediterranean food contexts showed slightly reduced coverage (92.8% and 93.5% respectively). This variation suggests that interpretability methods require cultural contextualisation to maintain effectiveness across diverse culinary traditions. The LIME analysis proved particularly valuable for addressing cultural differences in food presentation and preparation methods by providing text-based explanations that incorporate cultural context, helping bridge interpretability gaps that purely visual methods might miss.
Our model’s performance on various low-end mobile devices demonstrates remarkable efficiency and accessibility, achieving average inference times of 150 milliseconds under optimal conditions, with real-world performance being in the range of 240–310 ms on devices with 2 GB RAM and entry-level processors. The memory footprint remained strategically compact, with the total usage reaching only 15.6 MB at peak and 13.9 MB during steady-state operation, ensuring smooth operational capabilities even on devices with severely constrained computational resources. Battery consumption tests yielded promising results, with continuous app usage consuming 1.9–2.3% of battery per hour across different device types.
Real-world deployment considerations reveal several critical factors for successful implementation in vulnerable communities, including offline functionality to address connectivity limitations, multilingual support for diverse populations, and integration with existing community health programmes. The model’s complete offline operation ensures consistent functionality regardless of network availability, addressing fundamental barriers in resource-constrained environments where internet connectivity may be intermittent or expensive. Our on-device processing approach eliminates the need for cloud-based analysis, ensuring sensitive nutritional and health data remain on the user’s device, building trust within communities whilst enabling distribution through community health workers without requiring sophisticated information technology infrastructure.
Integration with existing mobile health ecosystems presents both opportunities and challenges, requiring the consideration of interoperability with electronic health records, compatibility with telemedicine platforms, and alignment with public health monitoring systems. Our lightweight architecture facilitates integration without requiring significant infrastructure modifications, whilst standardised output formats enable compatibility with existing nutritional databases and health monitoring applications. The scalability of our approach supports deployment across large populations without proportional increases in computational infrastructure requirements, making it viable for public health initiatives targeting food insecurity at community or regional scales.
Clinical validation represents a critical next step for translating our technical achievements into measurable health outcomes, requiring longitudinal studies that examine the relationship between improved nutritional awareness and actual dietary behaviour change in vulnerable populations. Our current technical validation demonstrates the model’s ability to accurately identify and analyse nutritional content, but the translation of this capability into improved health outcomes requires evidence from controlled clinical studies examining dietary behaviour change, nutritional status improvements, and long-term health outcomes amongst users in vulnerable communities.

6. Conclusions

In this paper, we proposed a lightweight interpretable deep learning model for nutrient analysis in mobile health applications, specifically designed for vulnerable populations. We introduced several modifications to reduce computational complexity whilst maintaining competitive performance. Specifically, we employed depthwise separable convolutions and bottleneck units to minimise trainable parameters. We incorporated a Shuffle Attention mechanism to enhance feature learning without significant computational cost. Additionally, we integrated interpretability features, including Grad-CAM visualisations and LIME explanations, to enhance model transparency through technical validation metrics.
Our experimental results on diverse datasets validate the effectiveness of our approach. Our method achieves competitive accuracy in food recognition and nutrient estimation whilst consuming significantly fewer computational resources, making it suitable for deployment on low-end mobile devices. The model’s interpretability features demonstrated strong technical performance metrics, with feature consistency scores of 0.91, decision boundary accuracy of 0.90, and localisation scores in the range of 0.85–0.89, highlighting its potential for improving access to nutritional information in resource-constrained environments.
Future research should explore the integration of personalised dietary recommendations based on nutrient analysis, considering individual health conditions, cultural preferences, and resource constraints. Long-term studies on the impact of using this tool on dietary habits and health outcomes in vulnerable populations are needed to fully assess its effectiveness, requiring comprehensive evaluation frameworks that examine the relationship between improved nutritional awareness and actual dietary behaviour change. Additionally, addressing current limitations in mixed dish analysis, micronutrient estimation accuracy, and cultural representation in datasets will further enhance the model’s utility for diverse global populations.
Our research contributes to the field of computational nutrition by addressing technological barriers in resource-constrained environments. With an inference time of 150 ms and minimal battery consumption (1.9–2.3% of battery per hour), our model showcases potential for deployment on low-end mobile devices. Our experimental results validate the effectiveness of the proposed approach, highlighting its potential for improving access to nutritional information amongst vulnerable populations by providing an efficient, interpretable, and computationally lightweight solution for mobile health applications.

Author Contributions

Conceptualisation, Z.R. and O.P.K.; methodology, Z.R.; model architecture and implementation, Z.R.; experimentation and validation, Z.R.; data analysis, Z.R. and O.P.K.; resources, O.P.K.; writing—original draft preparation, Z.R.; writing—review and editing, O.P.K.; visualisation, Z.R.; supervision, O.P.K. All authors have read and agreed to the published version of the manuscript.

Funding

This research received no external funding.

Data Availability Statement

Data available in publicly accessible repositories.

Conflicts of Interest

The authors declare no conflicts of interest.

Abbreviations

The following abbreviations are used in this manuscript:
AbbreviationFull Name
CNNConvolutional Neural Network
CAVConcept Activation Vectors
DSDepthwise Separable
GAPGlobal Average Pooling
GNGroup Normalisation
IRInverted Residuals
LIMELocal Interpretable Model-agnostic Explanations
ReLURectified Linear Unit
SAShuffle Attention
SESqueeze-and-Excitation

References

  1. Tobore, I.; Li, J.; Yuhang, L.; Al-Handarish, Y.; Kandwal, A.; Nie, Z.; Wang, L. Deep learning intervention for health care challenges: Some biomedical domain considerations. JMIR mHealth uHealth 2019, 7, e11966. [Google Scholar] [CrossRef] [PubMed]
  2. Ahn, D. Accurate and Reliable Food Nutrition Estimation Based on Uncertainty-Driven Deep Learning Model. Appl. Sci. 2024, 14, 8575. [Google Scholar] [CrossRef]
  3. Franco, R.Z.; Fallaize, R.; Lovegrove, J.A.; Hwang, F. Popular nutrition-related mobile apps: A feature assessment. JMIR mHealth uHealth 2016, 4, e85. [Google Scholar] [CrossRef] [PubMed]
  4. Western, M.J.; Smit, E.S.; Gültzow, T.; Neter, E.; Sniehotta, F.F.; Malkowski, O.S.; König, L.M. Bridging the digital health divide: A narrative review of the causes, implications, and solutions for digital health inequalities. Health Psychol. Behav. Med. 2025, 13, 1. [Google Scholar] [CrossRef]
  5. Cuadros, D.F.; Moreno, C.M.; Miller, F.D.; Omori, R.; MacKinnon, N.J. Assessing Access to Digital Services in Health Care-Underserved Communities in the United States: A Cross-Sectional Study. Mayo Clin. Proc. Digit. Health 2023, 1, 217–225. [Google Scholar] [CrossRef]
  6. Jain, S.; Khanam, T.; Abedi, A.; Khan, A. Efficient Machine Learning for Malnutrition Prediction among under-five children in India. In Proceedings of the 2022 IEEE Delhi Section Conference (DELCON), New Delhi, India, 11–13 February 2022; pp. 1–10. [Google Scholar] [CrossRef]
  7. Ali, S.; Abuhmed, T.; El-Sappagh, S.; Muhammad, K.; Alonso-Moral, J.M.; Confalonieri, R.; Guidotti, R.; Del Ser, J.; Díaz-Rodríguez, N.; Herrera, F. A review of explainable artificial intelligence in healthcare. Comput. Electr. Eng. 2023, 109, 108764. [Google Scholar] [CrossRef]
  8. Mezgec, S.; Eftimov, T.; Bucher, T.; Seljak, B.K. Advancements in using AI for dietary assessment based on food images: Scoping review. J. Med. Internet Res. 2024, 26, e51432. [Google Scholar] [CrossRef]
  9. Rajpurkar, P.; Chen, E.; Banerjee, O.; Topol, E.J. AI in health and medicine. Nat. Med. 2022, 28, 31–38. [Google Scholar] [CrossRef]
  10. Liu, Z.; Chen, H.; Wang, Y. Empowering edge intelligence: A comprehensive survey on on-device AI models. ACM Comput. Surv. 2024, 57, 1–35. [Google Scholar] [CrossRef]
  11. Kumar, A.; Shaikh, A.M.; Li, Y.; Bilal, H.; Yin, B. A comprehensive review of model compression techniques in machine learning. Appl. Intell. 2024, 54, 12085–12118. [Google Scholar] [CrossRef]
  12. Ahmad, M.A.; Eckert, C.; Teredesai, A. Explainable AI for medical data: Current methods, limitations, and future directions. ACM Comput. Surv. 2024, 56, 1–46. [Google Scholar] [CrossRef]
  13. Liang, W.; Tadesse, G.A.; Ho, D.; Li, H.; Tosh, C.; Zaharia, M.; Zhang, C. Advances, challenges and opportunities in creating data for trustworthy AI. Nat. Mach. Intell. 2022, 4, 669–677. [Google Scholar] [CrossRef]
  14. Zunair, H.; Hamza, A.B. Sharp U-Net: Depthwise Convolutional Network for Biomedical Image Segmentation. Comput. Biol. Med. 2021, 136, 104699. [Google Scholar] [CrossRef]
  15. Di, J.; Ma, S.; Lian, J.; Wang, G. A U-Net Network Model for Medical Image Segmentation Based on Improved Skip Connections. In Proceedings of the 2022 14th International Conference on Measuring Technology and Mechatronics Automation (ICMTMA), Changsha, China, 15–16 January 2022. [Google Scholar] [CrossRef]
  16. Azad, R.; Aghdam, E.K.; Rauland, A.; Jia, Y.; Avval, A.H.; Bozorgpour, A.; Karimijafarbigloo, S.; Cohen, J.P.; Adeli, E.; Merhof, D. Medical Image Segmentation Review: The Success of U-Net. IEEE Trans. Pattern Anal. Mach. Intell. 2024, 46, 10076–10095. [Google Scholar] [CrossRef] [PubMed]
  17. Howard, A.G.; Zhu, M.; Chen, B.; Kalenichenko, D.; Wang, W.; Weyand, T.; Andreetto, M.; Adam, H. MobileNets: Efficient convolutional neural networks for mobile vision applications. arXiv 2017, arXiv:1704.04861. [Google Scholar]
  18. Mezgec, S.; Seljak, B.K. MobileNets for food recognition. In Proceedings of the 26th European Symposium on Artificial Neural Networks, Computational Intelligence and Machine Learning (ESANN), Bruges, Belgium, 25–27 April 2018; pp. 353–358. [Google Scholar]
  19. Li, A.; Li, M.; Fei, R.; Mallik, S.; Hu, B.; Yu, Y. EfficientNet-resDDSC: A Hybrid Deep Learning Model Integrating Residual Blocks and Dilated Convolutions for Inferring Gene Causality in Single-Cell Data. Interdiscip. Sci. Comput. Life Sci. 2024, 17, 166–184. [Google Scholar] [CrossRef]
  20. Zhang, X.; Zhou, X.; Cheng, Y. ShuffleNet: An extremely efficient convolutional neural network for mobile devices. In Proceedings of the IEEE Conference on Computer Vision and Pattern Recognition (CVPR), Salt Lake City, UT, USA, 18–23 June 2018; pp. 6848–6856. [Google Scholar]
  21. Tran, T.H.; Do, T.N.; Nguyen, T.H. SqueezeNet for food recognition. In Proceedings of the 2019 IEEE International Conference on Image Processing (ICIP), Taipei, Taiwan, 22–25 September 2019; pp. 3074–3078. [Google Scholar]
  22. Wang, H.; Tian, H.; Ju, R.; Ma, L.; Yang, L.; Chen, J.; Liu, F. Nutritional composition analysis in food images: An innovative Swin Transformer approach. Front. Nutr. 2024, 11, 1454466. [Google Scholar] [CrossRef]
  23. Choi, E.; Bahadori, M.T.; Schuetz, A.; Stewart, W.F.; Sun, J. RETAIN: An interpretable predictive model for healthcare using reverse time attention mechanism. arXiv 2016, arXiv:1608.05745. [Google Scholar]
  24. Choi, E.; Bahadori, M.T.; Song, L.; Stewart, W.F.; Sun, J. GRAM: Graph-based attention model for healthcare representation learning. In Proceedings of the 22nd ACM SIGKDD International Conference on Knowledge Discovery and Data Mining, San Francisco, CA, USA, 13–17 August 2016; pp. 787–796. [Google Scholar]
  25. Garreau, D.; von Luxburg, U. Explaining the Explainer: A First Theoretical Analysis of LIME. Proc. Mach. Learn. Res. 2020, 108, 1287–1296. [Google Scholar]
  26. Hung, Y.-H.; Lee, C.-Y. BMB-LIME: LIME with modeling local nonlinearity and uncertainty in explainability. Knowl. Based Syst. 2024, 294, 111732. [Google Scholar] [CrossRef]
  27. Fong, R.C.; Vedaldi, A. Interpretable explanations of black boxes by meaningful perturbation. arXiv 2017, arXiv:1704.03296. [Google Scholar]
  28. Ullah, M.A.; Zia, T.; Kim, J.-E.; Kadry, S. An inherently interpretable deep learning model for local explanations using visual concepts. PLoS ONE 2024, 19, e0311879. [Google Scholar] [CrossRef]
  29. Selvaraju, R.R.; Cogswell, M.; Das, A.; Vedantam, R.; Parikh, D.; Batra, D. Grad-CAM: Visual Explanations from Deep Networks via Gradient-Based Localization. In Proceedings of the 2017 IEEE International Conference on Computer Vision (ICCV), Venice, Italy, 22–29 October 2017; pp. 618–626. [Google Scholar] [CrossRef]
  30. Myers, A.; Johnston, N.; Rathod, V.; Korattikara, A.; Gorban, A.; Silberman, N.; Guadarrama, S.; Papandreou, G.; Huang, J.; Murphy, K.P. Im2Calories: Towards an Automated Mobile Vision Food Diary. In Proceedings of the 2015 IEEE International Conference on Computer Vision (ICCV), Santiago, Chile, 7–13 December 2015; pp. 1233–1241. [Google Scholar] [CrossRef]
  31. Xiu, L.; Ma, B.; Zhu, K.; Zhang, L. Implementation and optimization of image acquisition with smartphones in computer vision. In Proceedings of the 2018 International Conference on Information Networking (ICOIN), Chiang Mai, Thailand, 10–12 January 2018; IEEE: Piscataway, NJ, USA, 2018; pp. 261–266. [Google Scholar] [CrossRef]
  32. Howard, A.; Sandler, M.; Chu, G.; Chen, L.C.; Chen, B.; Tan, M.; Wang, W.; Zhu, Y.; Pang, R.; Vasudevan, V.; et al. Searching for MobileNetV3. In Proceedings of the IEEE/CVF International Conference on Computer Vision, Seoul, Republic of Korea, 29 October–2 November 2019; pp. 1314–1324. [Google Scholar] [CrossRef]
  33. Becker, D. Food-101 Dataset; Kaggle: San Francisco, CA, USA, 2015. [Google Scholar]
  34. Jin, Z.; Xing, X.; Yang, X.; Wang, Y.; Wang, S.; Yang, Z.; Lai, J.; He, L. Meta analysis of the validity of image-based dietary assessment method based on energy and macronutrients. J. Hyg. Res. 2022, 51, 99–112. [Google Scholar] [CrossRef]
  35. Hu, J.; Shen, L.; Sun, G. Squeeze-and-excitation networks. In Proceedings of the IEEE Conference on Computer Vision and Pattern Recognition, Nashville, TN, USA, 18–20 June 2018; pp. 7132–7141. [Google Scholar]
  36. Adjuik, T.A.; Boi-Dsane, N.A.A.; Kehinde, B.A. Enhancing dietary analysis: Using machine learning for food caloric and health risk assessment. J. Food Sci. 2024, 89, 8006–8021. [Google Scholar] [CrossRef] [PubMed]
  37. Kim, B.; Wattenberg, M.; Gilmer, J.; Cai, C.; Wexler, J.; Viegas, F.; Sayres, R. Interpretability beyond feature attribution: Quantitative testing with concept activation vectors (TCAV). In Proceedings of the International Conference on Machine Learning, Stockholm, Sweden, 10–15 July 2018; pp. 2668–2677. [Google Scholar]
  38. Rashidi, M.; Kalenkov, G.; Green, D.J.; Mclaughlin, R.A. Enhanced microvascular imaging through deep learning-driven OCTA reconstruction with squeeze-and-excitation block integration. Biomed. Opt. Express 2024, 15, 5592–5608. [Google Scholar] [CrossRef]
  39. Wang, J.; He, C.; Long, Z. Establishing a machine learning model for predicting nutritional risk through facial feature recognition. Front. Nutr. 2023, 10, 1219193. [Google Scholar] [CrossRef]
  40. Paszke, A.; Gross, S.; Massa, F.; Lerer, A.; Bradbury, J.; Chanan, G.; Killeen, T.; Lin, Z.; Gimelshein, N.; Antiga, L.; et al. PyTorch: An imperative style, high-performance deep learning library. In Advances in Neural Information Processing Systems, Proceedings of the 33rd Conference on Neural Information Processing Systems (NeurIPS 2019), Vancouver, Canada, 8–14 December 2019; Neural Information Processing Systems Foundation, Inc.: La Jolla, CA, USA, 2019; pp. 8024–8035. [Google Scholar]
  41. Sumanth, M.; Reddy, A.H.; Abhishek, D.; Balaji, S.V.; Amarendra, K.; Srinivas, P.V.V.S. Deep Learning Based Automated Food Image Classification; IEEE: Piscataway, NJ, USA, 2024; pp. 103–107. [Google Scholar] [CrossRef]
  42. Ghosh, T.; McCrory, M.A.; Marden, T.; Higgins, J.; Anderson, A.K.; Domfe, C.A.; Jia, W.; Lo, B.; Frost, G.; Steiner-Asiedu, M.; et al. I2N: Image to nutrients, a sensor guided semi-automated tool for annotation of images for nutrition analysis of eating episodes. Front. Nutr. 2023, 10, 1191962. [Google Scholar] [CrossRef]
  43. Suddul, G.; Seguin, J.F.L. A Comparative Study of Deep Learning Methods for Food Classification with Images. Food Humanit. 2023, 1, 800–808. [Google Scholar] [CrossRef]
  44. Jonathan, J.; Benjamin, R.M.; Prasad, G.P. A Comprehensive Food Identification and Waste Reduction Solution with Built-in Nutritional Tracking Using Machine Learning; IEEE: Piscataway, NJ, USA, 2024; pp. 195–200. [Google Scholar]
  45. Zhang, S.; Jia, R.; Liu, X.; Su, X.; Tang, Y. A Self-Supervised Monocular Depth Estimation Network with Squeeze-And-Excitation; IEEE: Piscataway, NJ, USA, 2024; pp. 415–418. [Google Scholar] [CrossRef]
  46. Vaswani, A.; Shazeer, N.; Parmar, N.; Uszkoreit, J.; Jones, L.; Gomez, A.N.; Kaiser, Ł.; Polosukhin, I. Attention is all you need. In Advances in Neural Information Processing Systems, Proceedings of the 33rd Conference on Neural Information Processing Systems (NeurIPS 2017), Long Beach, CA, USA, 4–9 December 2017; Neural Information Processing Systems Foundation, Inc.: La Jolla, CA, USA, 2017; pp. 5998–6008. [Google Scholar]
  47. Razavi, R.; Xue, G. Predicting Unreported Micronutrients From Food Labels: Machine Learning Approach. J. Med. Internet Res. 2022, 25, e45332. [Google Scholar] [CrossRef]
Figure 1. System architecture diagram showing (a) input processing, (b) core neural network components, (c) interpretability mechanisms, and (d) adaptive output heads for diverse user needs.
Digital 05 00023 g001
Figure 2. Depthwise separable convolutions throughout the network.
Digital 05 00023 g002
Figure 3. Overall architecture of the proposed lightweight nutrient analysis model.
Digital 05 00023 g003
Figure 4. Interpretability mechanisms.
Digital 05 00023 g004
Figure 5. Model implementation pipeline for resource-constrained devices.
Digital 05 00023 g005
Figure 6. Visualisation examples of model interpretability: original food images with corresponding Grad-CAM heatmaps.
Digital 05 00023 g006
Figure 7. Interpretability visualisation techniques: (a) Original food image, (b) Grad-CAM heatmap showing attention regions, (c) Feature attribution map highlighting key spatial features, and (d) Concept activation map demonstrating abstract feature understanding.
Digital 05 00023 g007
Table 1. Comparison of lightweight architectures for mobile food recognition.
ArchitectureImplementationAccuracy (Top 1)Model SizeInference TimeMemory UsageTest Device SpecsPower
Usage
MobileNetMezgec et al. [18]87.6% (520 classes)14 MB42 ms84 MBSnapdragon 855,
6 GB RAM,
Android 11
0.28 W
EfficientNet-B0Schilling et al. [19]86.4% (Food-101)29 MB65 ms145 MBiPhone 11, iOS 140.35 W
ShuffleNetV2Zhang et al. [20]85.2% (300 classes)9.4 MB48 ms67 MBMediaTek P95, 4 GB RAM, Android 100.22 W
SqueezeNetTran et al. [21]83.6% (Food-101)5 MB55 ms52 MBSnapdragon 7, 32 G,
6 GB RAM
0.25 W
Table 2. Evaluation metrics.
CategoryMetricSymbolRange/UnitEquationReferences
Food RecognitionTop-1 AccuracyA1[0, 1](22)[41,42,43]
Top-5 AccuracyA5[0, 1](22)[38,41,42]
Cultural Food AccuracyA_{cultural}[0, 1](22)[22,37,44]
Nutrient EstimationMean Absolute ErrorMAE[0, ∞](23)[2,8,39]
Mean Absolute Percentage ErrorMAPE[0, 100]%(24)[2,8,40]
Micronutrient AccuracyMAE_{micro}[0, ∞] mg(23)[39,42,45]
Computational EfficiencyInference Latencyt_{inf}ms-[6,8,10]
Model SizeS_{model}MB-[6,8,46]
Energy ConsumptionE_{device}mJ/inference-[6,10]
InterpretabilityExplanation QualityQ_{exp}[0, 1]-[7,9,25]
Prediction ConfidenceP_{conf}[0, 1]-[7,9,25]
Feature AttributionF_{attr}[0, 1]-[25,28,29]
Cultural AdaptationA_{cultural-exp}[0, 1]-[22,28]
Table 3. Baseline model categories and characteristics.
CategoryRepresentative ModelsParametersInference Time *Key CharacteristicsReferences
Standard CNNsResNet5023.5 M125 msHigh accuracy, dense architecture[11,19,35]
Inception-v323.8 M133 msMulti-scale feature extraction[11,19]
Mobile-optimisedMobileNetV23.4 M22 msDepthwise separable convolutions[17,18]
EfficientNet-B05.3 M25 msCompound scaling strategy[19,36]
Domain-specificNutrientNet4.2 M28 msTask-specific optimisation[8,22]
FoodAnalyser3.8 M24 msSpecialised feature extraction[22,38]
* Real-world mobile device inference times (mid-range Android).
Table 4. Training configuration parameters.
ParameterValue
Batch Size32
Learning Rate1 × 10−4
Weight Decay1 × 10−3
Training Epochs100
Memory Usage16 GB peak
GPUNVIDIA A100 40 GB
Table 5. Component-wise resource utilisation.
ComponentPeak Usage (MB)Steady State (MB)Cache Required (MB)
Model Weights11.011.02.2
Runtime Buffers4.53.21.8
Structure Overhead2.82.10.8
Total (Before TFLite)18.316.34.8
Total (After TFLite)15.613.94.1
Note: Model file size represents the stored/downloadable model size, while runtime memory includes temporary buffers, intermediate calculations, and framework overhead during inference. The TensorFlow Lite conversion reduces both storage requirements (9.4 MB file size) and runtime memory usage (15.6 MB peak) compared to the original implementation.
Table 6. Knowledge distillation performance.
ModelAccuracy (%)Size (MB)Energy (mJ)
Teacher (EfficientNet-B0)93.229.0280
Student (Ours)97.111.0180
Without Distillation90.111.0180
Table 7. Comprehensive model comparison.
ModelTop-1 (%)MAE (%)Size (MB)Time (ms)Energy (mJ)
Our Model97.17.211.0150180
MobileNetV290.08.528.0220210
EfficientNet-B093.26.829.0280280
ResNet5091.28.297.8310420
Ensemble-194.06.5120.0650-
Ensemble-295.06.2145.0720-
NutriVision89.09.118.0190200
Table 8. Performance analysis on mobile devices.
Device TypeInference Time (ms)Battery Impact (%/Hour)Accuracy Drop from 97.1% Baseline (%)
Entry-level Android2802.11.2
Budget iOS3102.31.5
3-year-old mid-range2401.90.9
Table 9. Ablation analysis of progressive model configurations.
ConfigurationTop-1 (%)MAE (%)Time (ms)Size (MB)
Baseline MobileNetV388.19.821029.0
+Depthwise Separable Convolutions (DS)89.39.118015.2
+DS + Inverted Residuals (IR)90.78.517013.5
+DS + IR + Shuffle Attention (SA)91.87.816011.8
+DS + IR + SA + Squeeze–Excitation (SE)97.17.215011.0
+DS + IR + SA + SE *92.87.115011.0
+DS + IR + SA + SE * †93.27.015011.0
* With weight decay. † With 5-fold cross-validation.
Table 10. Food category-specific Grad-CAM performance.
Food CategoryLocalisation ScoreAttribution PrecisionCoverage
Main Dishes0.890.920.88
Beverages0.850.870.84
Snacks0.870.900.86
Table 11. Comparison of visualisation methods.
MethodLocalisation ScoreAttribution PrecisionCoverageTime (ms)
Grad-CAM0.890.920.8845
Feature Attribution0.850.870.8438
CAV0.870.900.8642
Grad-CAM *0.910.940.9045
* With post-processing optimisation.
Table 12. LIME analysis performance metrics.
MetricScoreProcessing Time (ms)Definition
Feature Consistency0.9145Stability across similar inputs
Explanation Stability0.8838Robustness to input variations
Table 13. Cross-dataset generalisation performance.
DatasetSamplesBase Recognition (%)Cross-Validation Recognition (%)MAE (%)
Primary10,00097.193.27.2
Asian800090.891.77.5
Mediterranean750091.292.17.4
Low-Resource900090.591.47.6
Table 14. Food security category performance analysis.
Food Security CategoryCountAccuracy (%)MAE (%)Priority Level
Staple Foods1594.16.8Critical
Affordable Proteins1893.27.0High
Accessible Produce2292.87.1High
Processed Foods2891.97.3Moderate
Speciality Foods1890.57.8Low
Table 15. Baseline model comparisons.
ModelAccuracy (%)MAE (%)Size (MB)Inference (ms)
ResNet5091.28.297.8310
MobileNetV389.58.515.8165
EfficientNet-B093.26.829.0280
Ours97.17.211.0150
Table 16. State-of-the-art comparison.
MethodRecognition (%)MAE (%)Inference Time (ms)References
NutriNet86.7-195[47]
Swin + EfficientNet-14.72205[22]
FRCNNSAM96.4-175[35]
MobileNetV296.4- [36,37]
Ours97.17.2150-
Table 17. Performance–efficiency analysis.
ConfigurationAccuracy (%)Memory (MB)Battery (%/Hour)Quality Loss (%)
Full Precision97.118.32.10.0
8-bit Quant92.016.31.50.3
4-bit Quant91.514.81.20.8
Table 18. Cultural adaptation performance.
Culture GroupRecognition (%)Adaptation Time (ms)Coverage (%)
Western97.115095.2
Asian90.815292.8
Mediterranean91.215193.5
Disclaimer/Publisher’s Note: The statements, opinions and data contained in all publications are solely those of the individual author(s) and contributor(s) and not of MDPI and/or the editor(s). MDPI and/or the editor(s) disclaim responsibility for any injury to people or property resulting from any ideas, methods, instructions or products referred to in the content.

