Article

Battery Current Estimation and Prediction During Charging with Ant Colony Optimization Algorithm

by
Selamat Muslimin
1,
Ekawati Prihatini
1,
Nyayu Latifah Husni
1,
Tresna Dewi
1,
Mukhidin Wartam Bin Umar
2,
Auvi Crisanta Ana Bela
1,
Sri Utami Handayani
3 and
Wahyu Caesarendra
4,5,*
1
Department of Electrical Engineering, Sriwijaya State Polytechnic, Palembang 30139, Indonesia
2
Faculty of Integrated Technologies, Universiti Brunei Darussalam, Jalan Tungku Link, Gadong BE1410, Brunei
3
Mechanical Design Engineering, Vocational School, Diponegoro University, Semarang 50275, Indonesia
4
Department of Mechanical Engineering, Faculty of Engineering and Science, Curtin University Malaysia, Lot 13149, Block 5 Kuala Baram Land District, CDT 250, Miri 98009, Sarawak, Malaysia
5
Faculty of Mechanical Engineering, Opole University of Technology, 76 Prószkowska Street, 45-758 Opole, Poland
*
Author to whom correspondence should be addressed.
Submission received: 29 October 2024 / Revised: 14 December 2024 / Accepted: 24 February 2025 / Published: 27 February 2025

Abstract

:
This paper presents an application of the Ant Colony Optimization (ACO) algorithm combined with the Logistic Regression (LR) method in the lead acid battery charging process. The ACO algorithm is used to obtain the best current pattern in the battery charging system to produce a smart charging system with a fast and safe charging current for the battery. The best current pattern is conducted gradually and repeatedly to obtain termination in the form of the best current pattern according to the ACO algorithm. The results of the algorithm design produce a current pattern consisting of 10 A, 5 A, 3 A, 2 A, and 0 A. The charging system with this algorithm can charge all types of lead acid batteries. In this research, the capacity of battery 1’s State of Charge (SOC) is 56%, battery 2’s SOC is 62%, and battery 3’s SOC is 80%. When recharging the battery’s full condition to a SOC of 100%, the length of time for charging battery 1 for 12.73 min, battery 2 takes 15.73 min, and battery 3 takes 29.11 min. Smart charging with the ACO can charge the battery safely without current fluctuations compared to charging without an algorithm such that the amount of charging current used is not dangerous for the battery. In addition, data analysis is carried out to determine the value of accuracy in estimating SOC charging using supervised learning linear regression. The results of the data analysis with linear regression show that the battery’s SOC estimation has good accuracy, with an RMSE value of 0.32 and an MAE of 0.27.

1. Introduction

The lead acid battery is one of the battery types that has been used in various applications [1,2], such as electric vehicles, energy storage systems, and electronic equipment. One of the main challenges in using lead acid batteries is the lack of accuracy in obtaining accurate current estimates during the charging process (before and after charging) [3]. Charging is the process of recharging the electrical energy stored in the battery [4,5,6,7]. The process is conducted by connecting the battery or device to an external power source, such as a charger. Therefore, energy can flow into the battery and increase the capacity or charge rate. Smart charging is an approach or technology used to manage and optimize battery charging intelligence [8,9,10]. A charging device can be said to be smart charging if it has features like ease of battery monitoring [8,11], State of Charge (SOC) estimation, battery life-cycle, fast charging, etc. By using smart charging technology and concepts, the battery charging process can be performed more efficiently.
This paper presents the use of the Ant Colony Optimization (ACO) algorithm [12,13,14] combined with the Logistic Regression (LR) method for battery smart charging applications. The ACO algorithm is a metaheuristic used to solve difficult optimization problem [15]. The ACO algorithm was inspired by the behavior of native ants that use pheromone traces as a communication medium in ant colonies. In the ACO algorithm, pheromone traces are used as distributed numerical information as an indirect medium of communication between simple agents called artificial ants. In the context of battery charging, the ACO algorithm can be used to optimize the results of current estimation with the aim of obtaining more accurate results.
In addition to the ACO algorithm, ML methods [16,17,18] are also applied to study patterns to optimally estimate battery current. The ML method has the ability to learn without being explicitly programmed. The program utilizes data to build models and make decisions based on the models that have been built. According to the learning perspective, the ML methods can be divided into two types, i.e., supervised learning and unsupervised learning. Supervised learning is linguistically directed or supervised, which means that a computer or machine will learn training data that contain labels. When carrying out the learning process, the system will be given data or desired results or examples of cases to be solved by the system. In contrast to supervised learning, unsupervised learning is a learning process that is carried out without instructions, so the system will work alone to find patterns in the data [19,20,21].

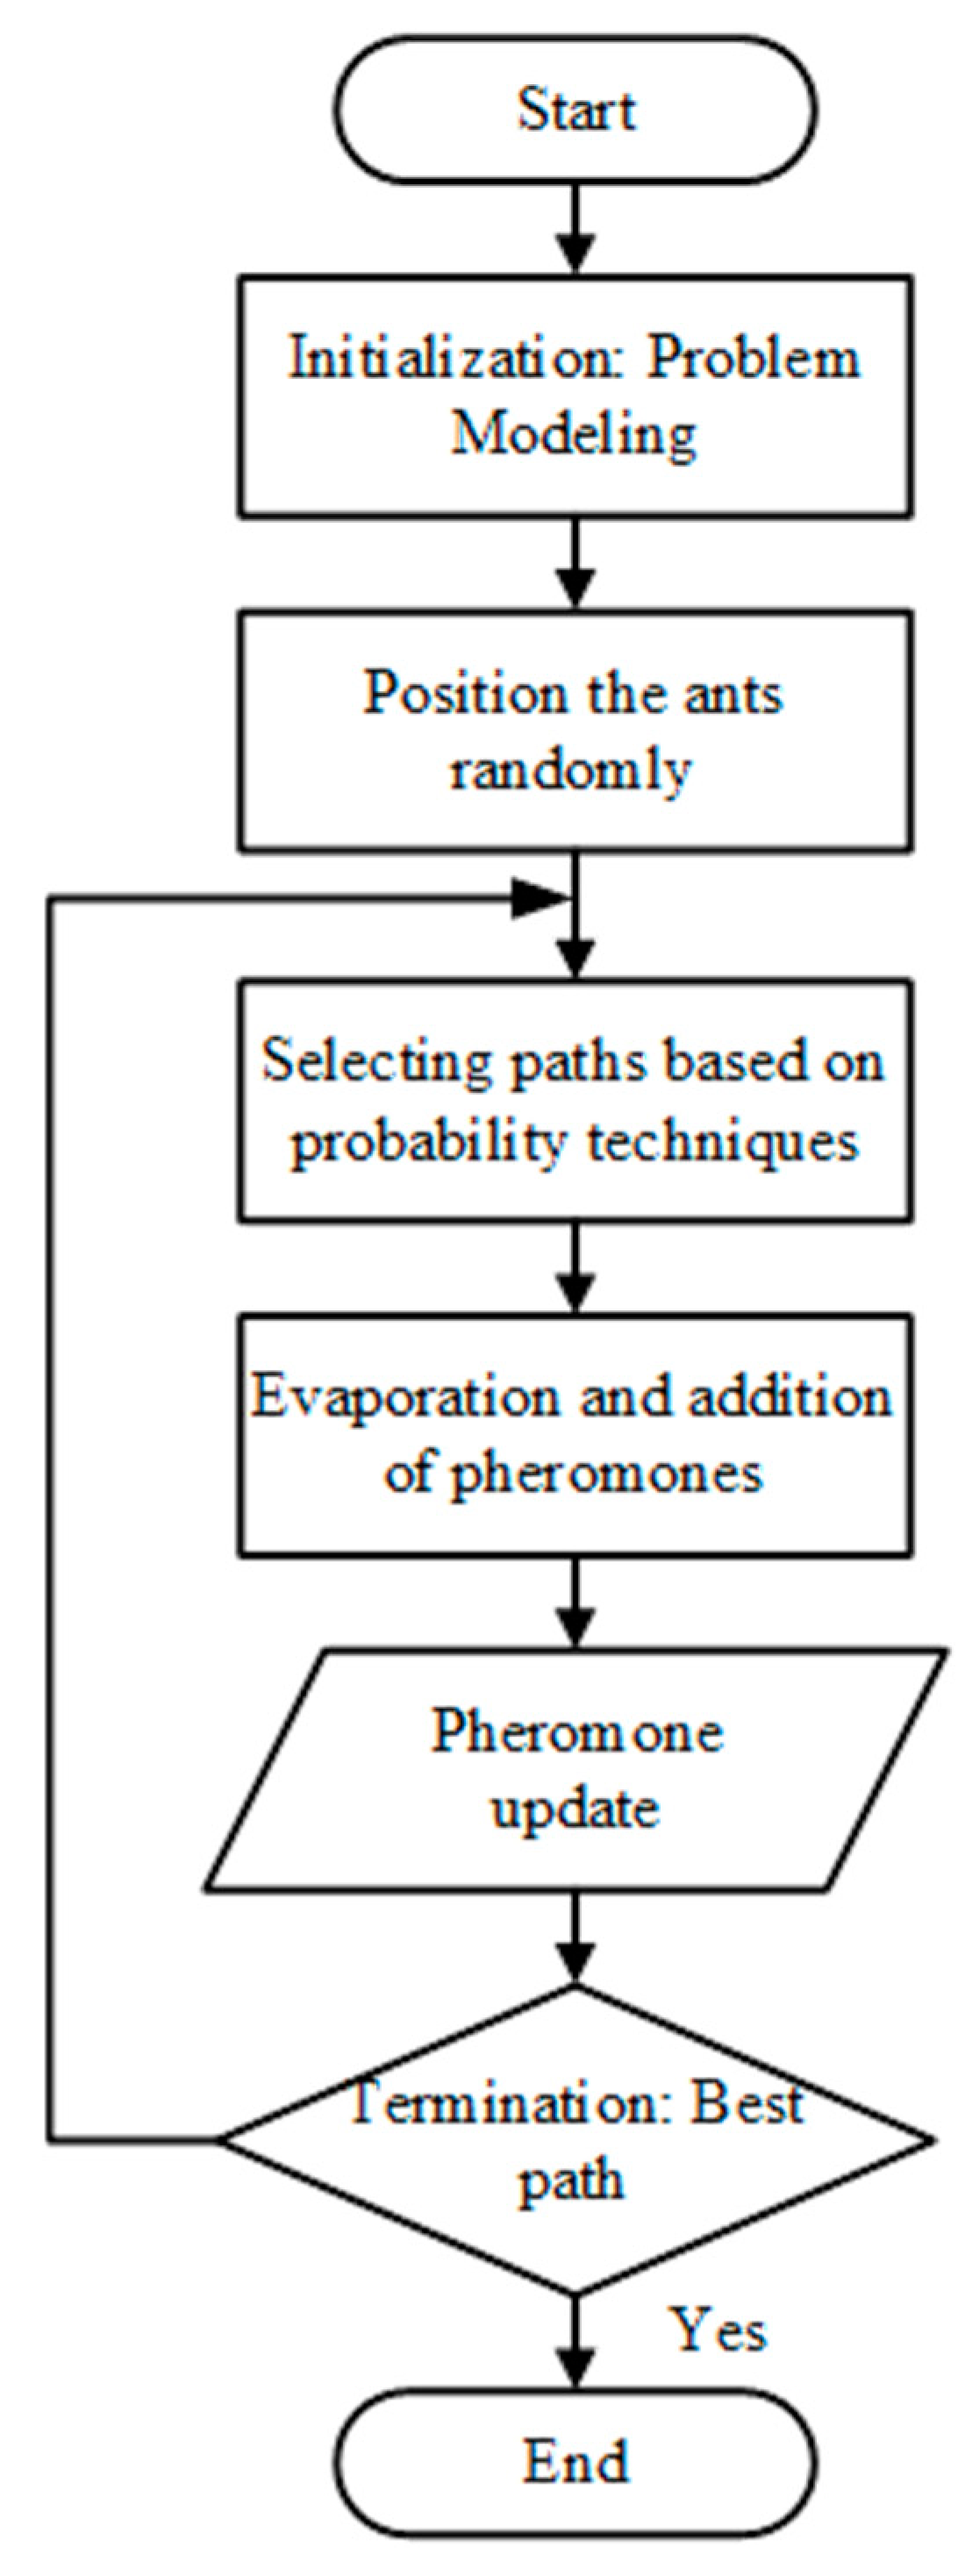
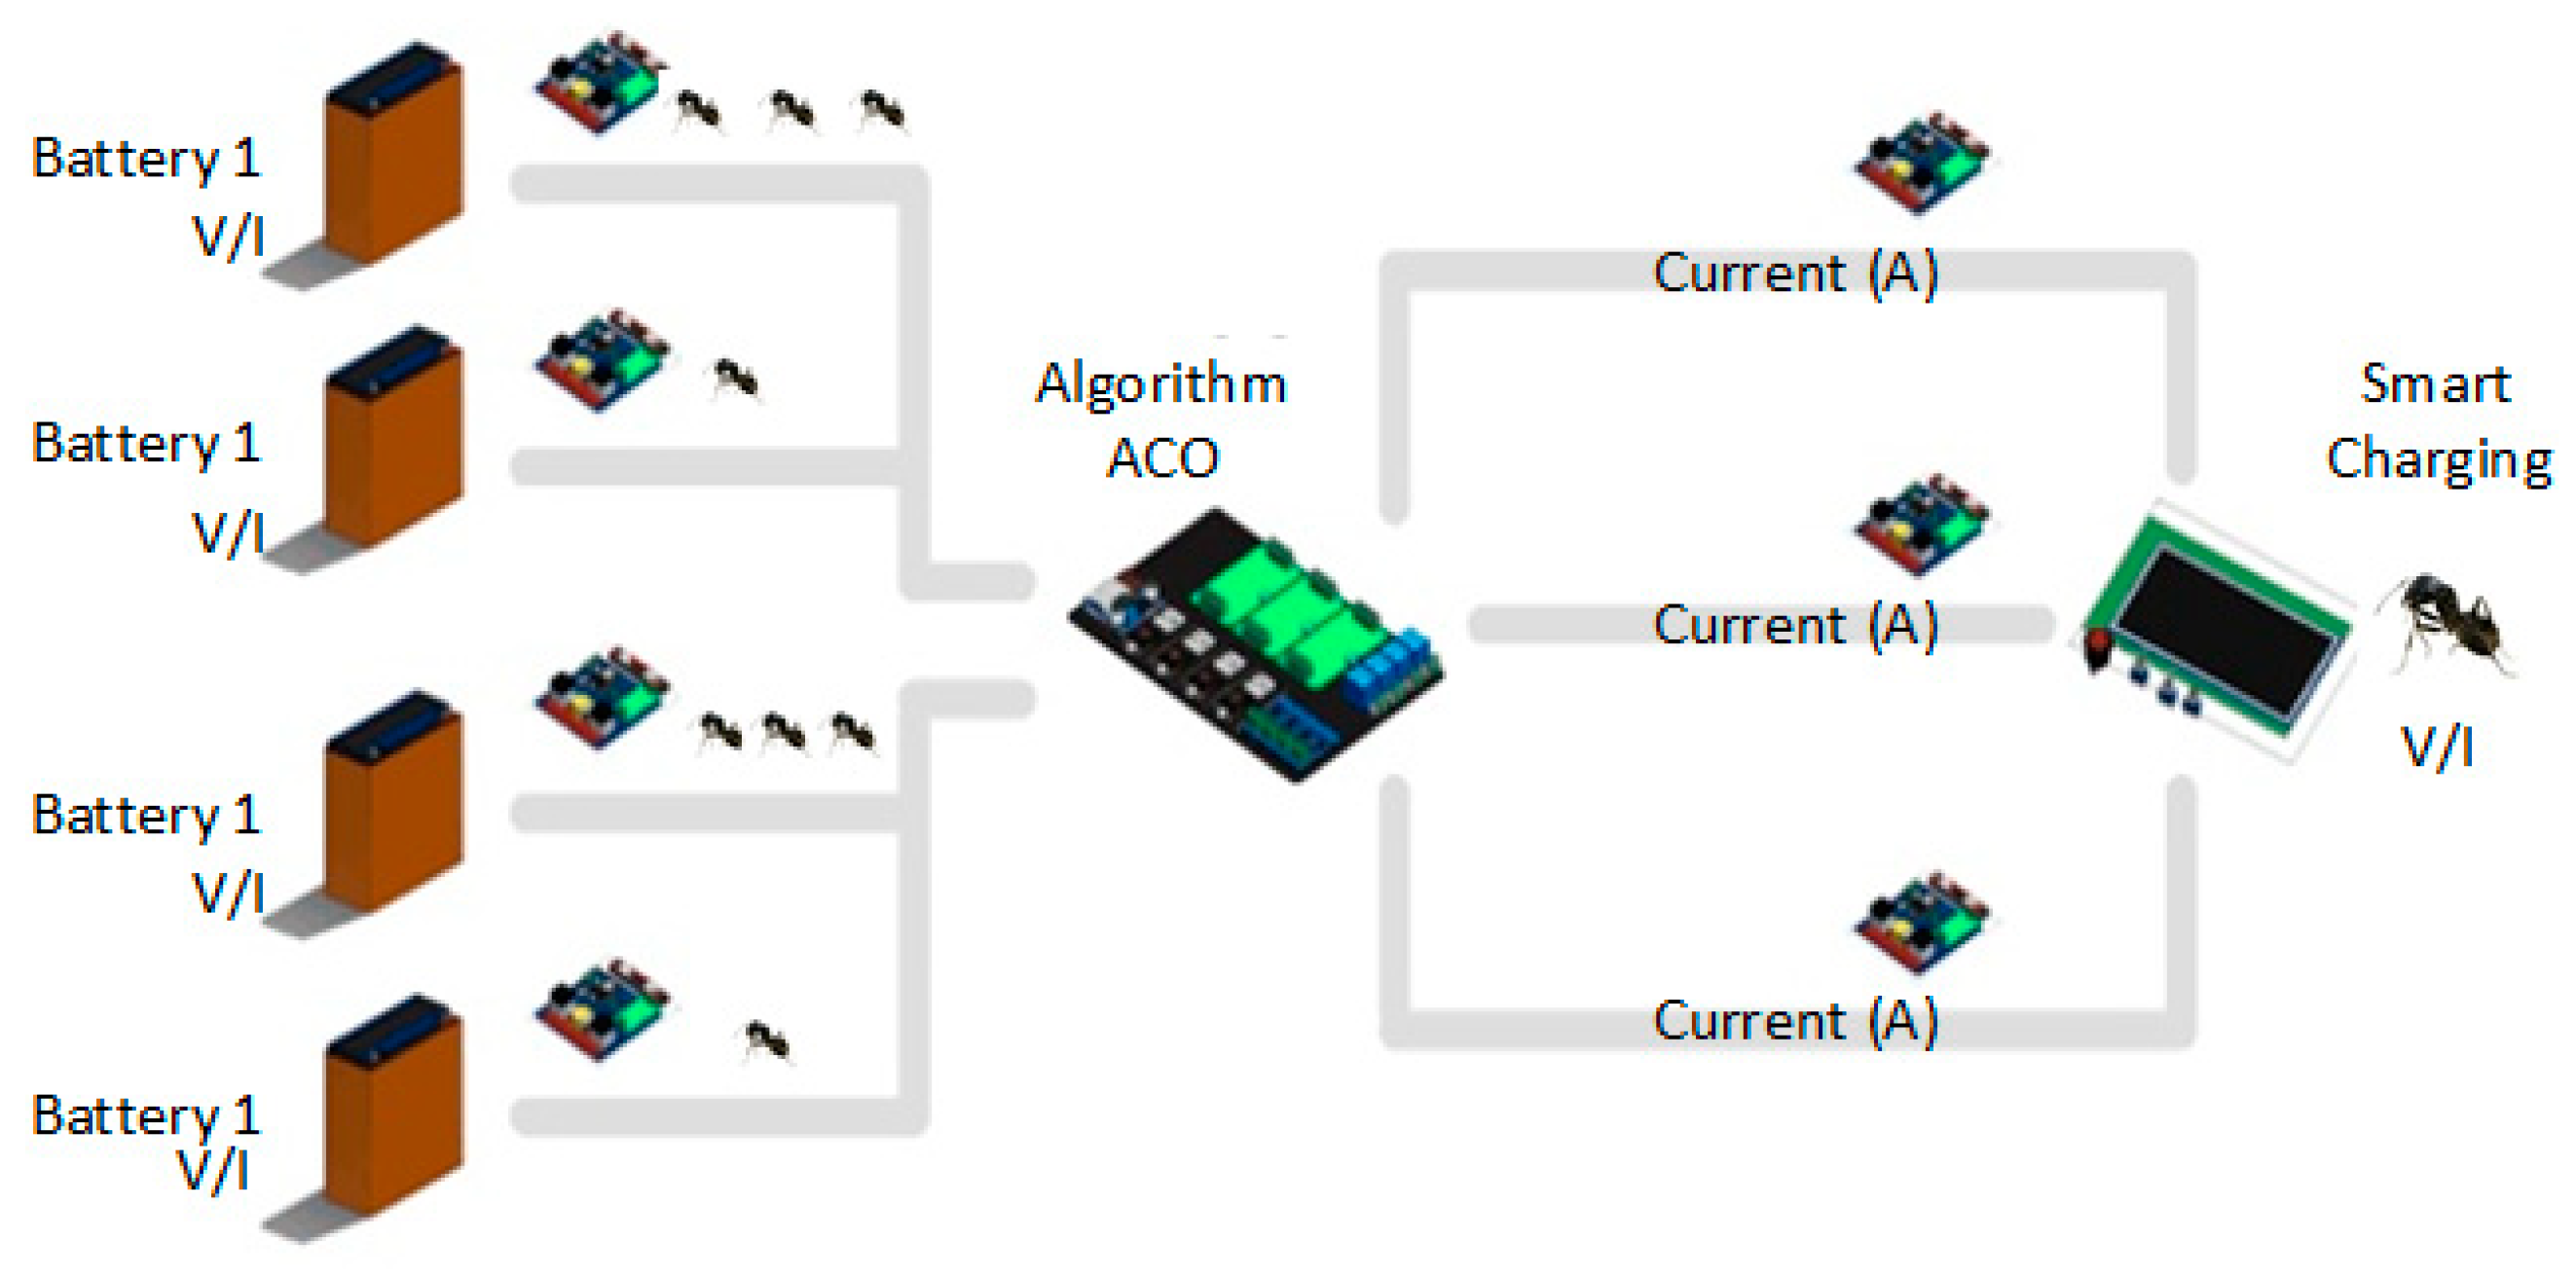
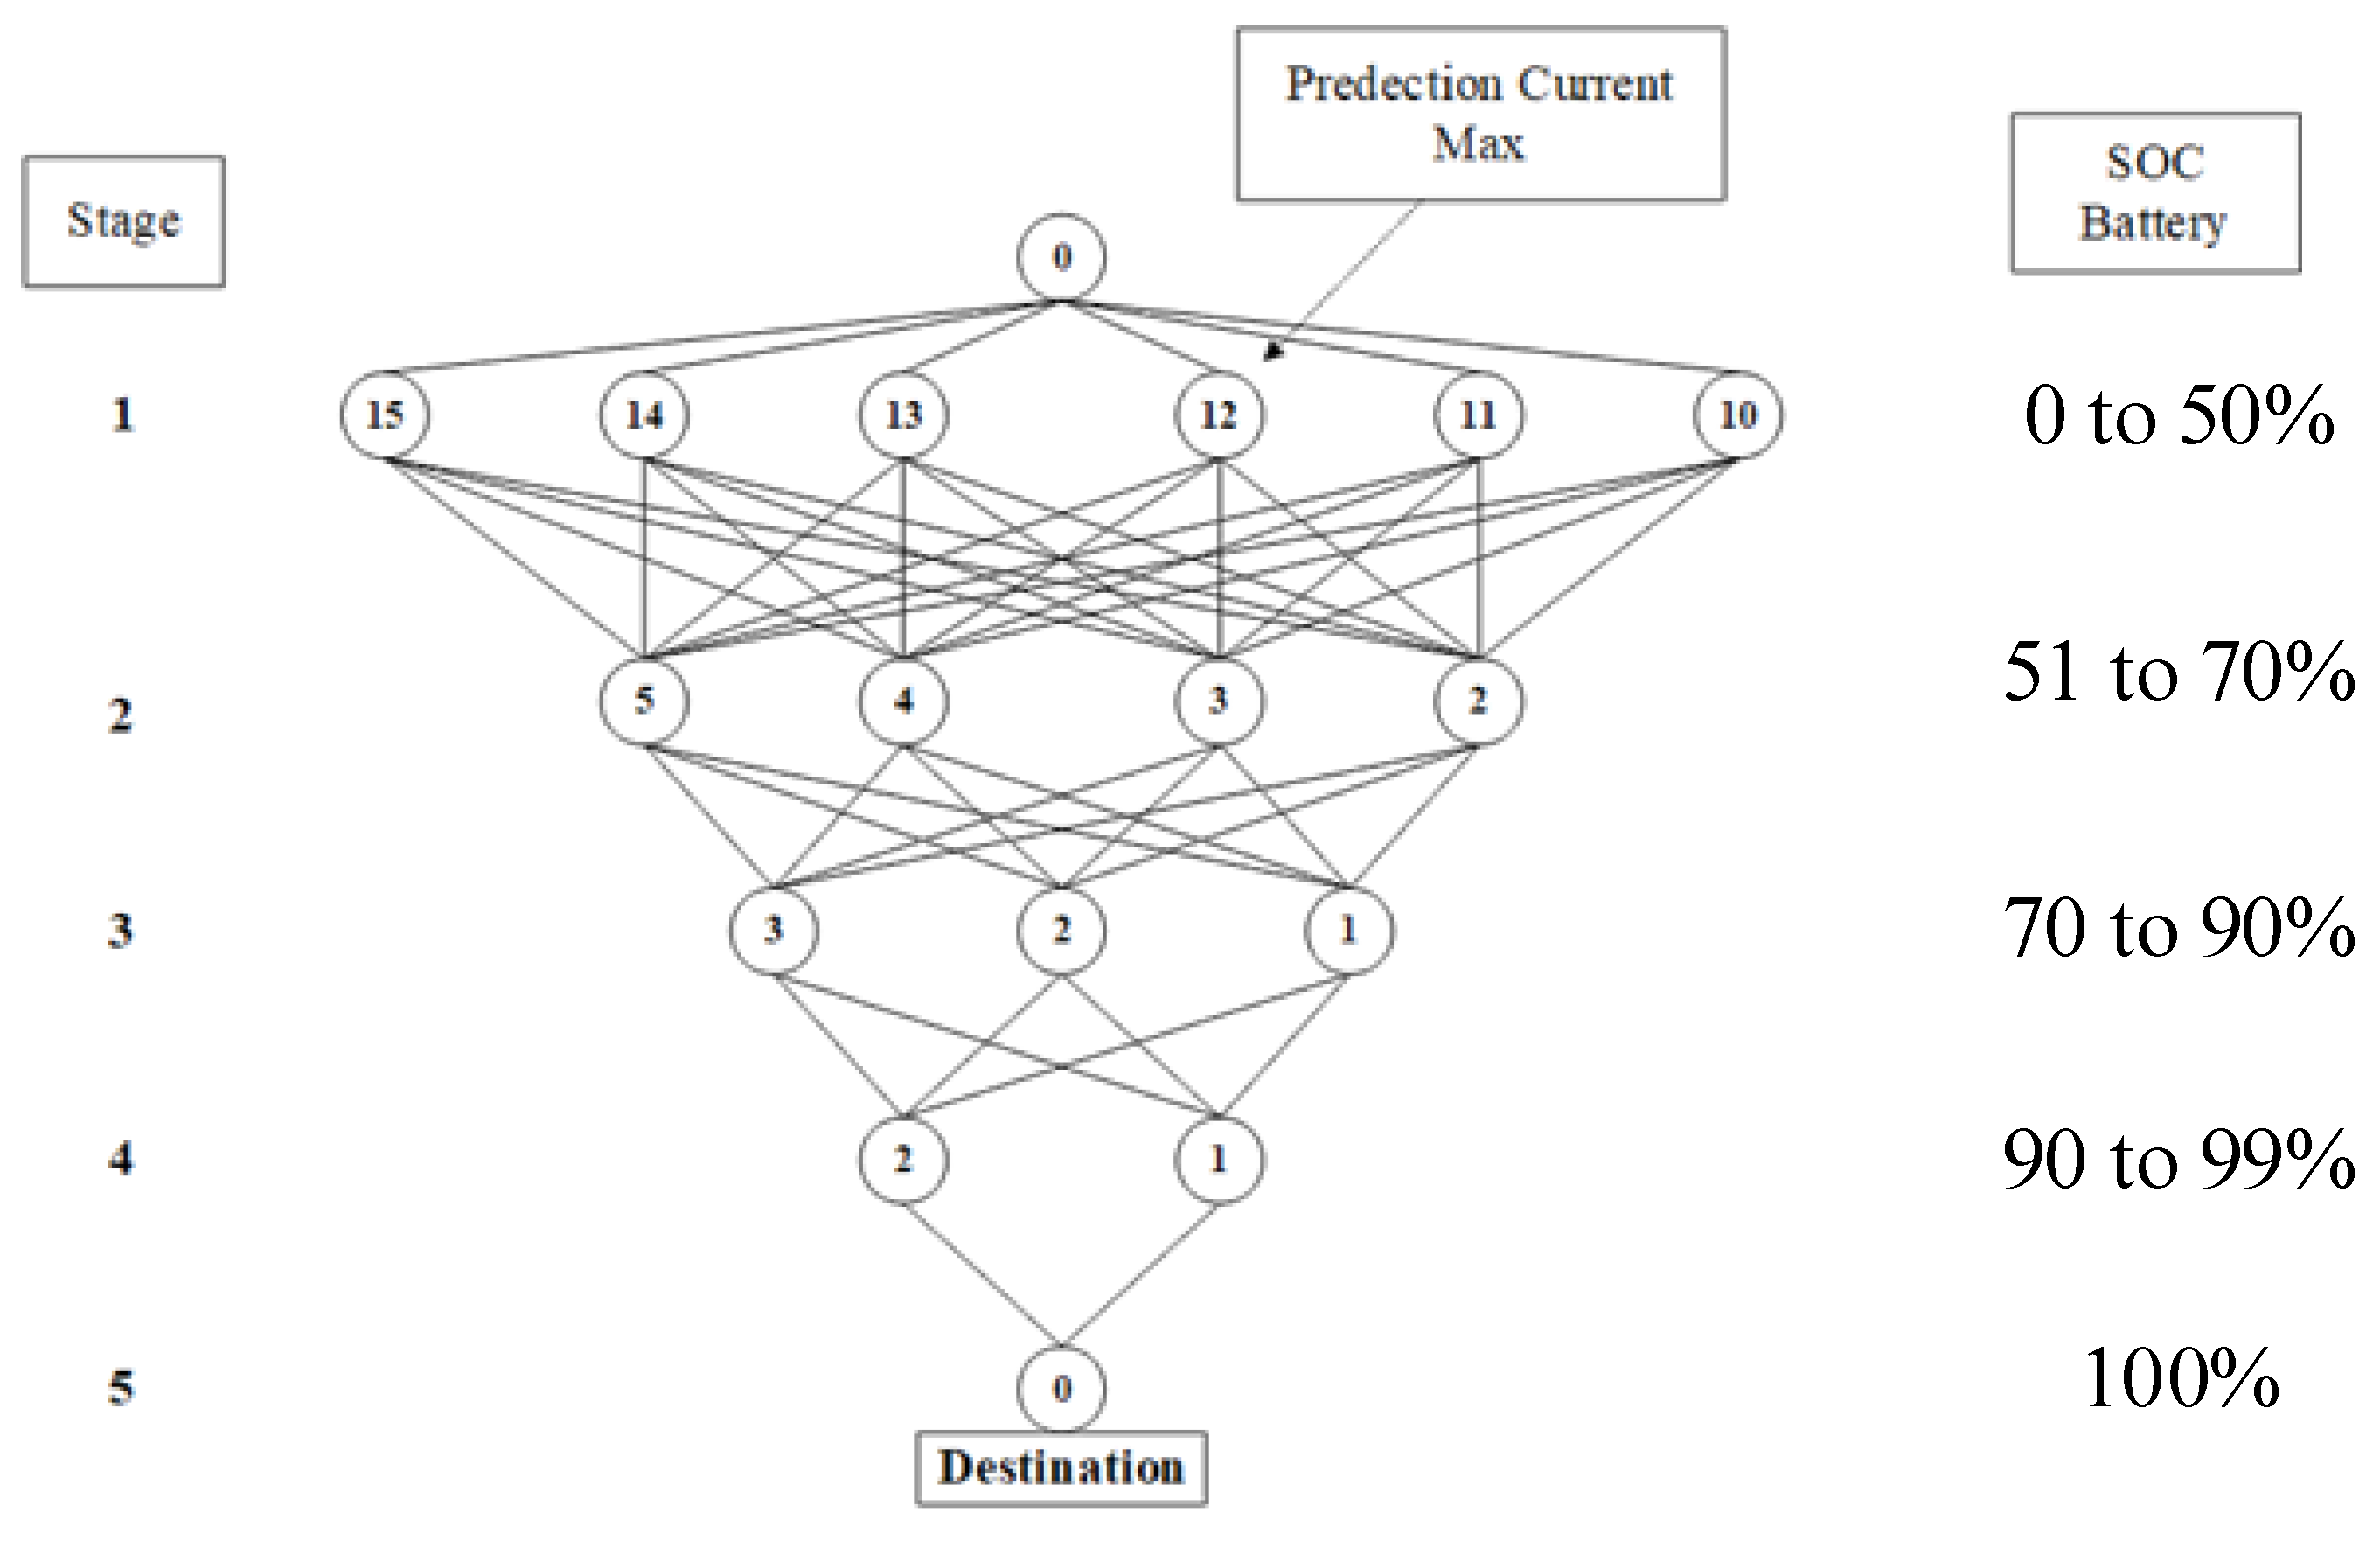
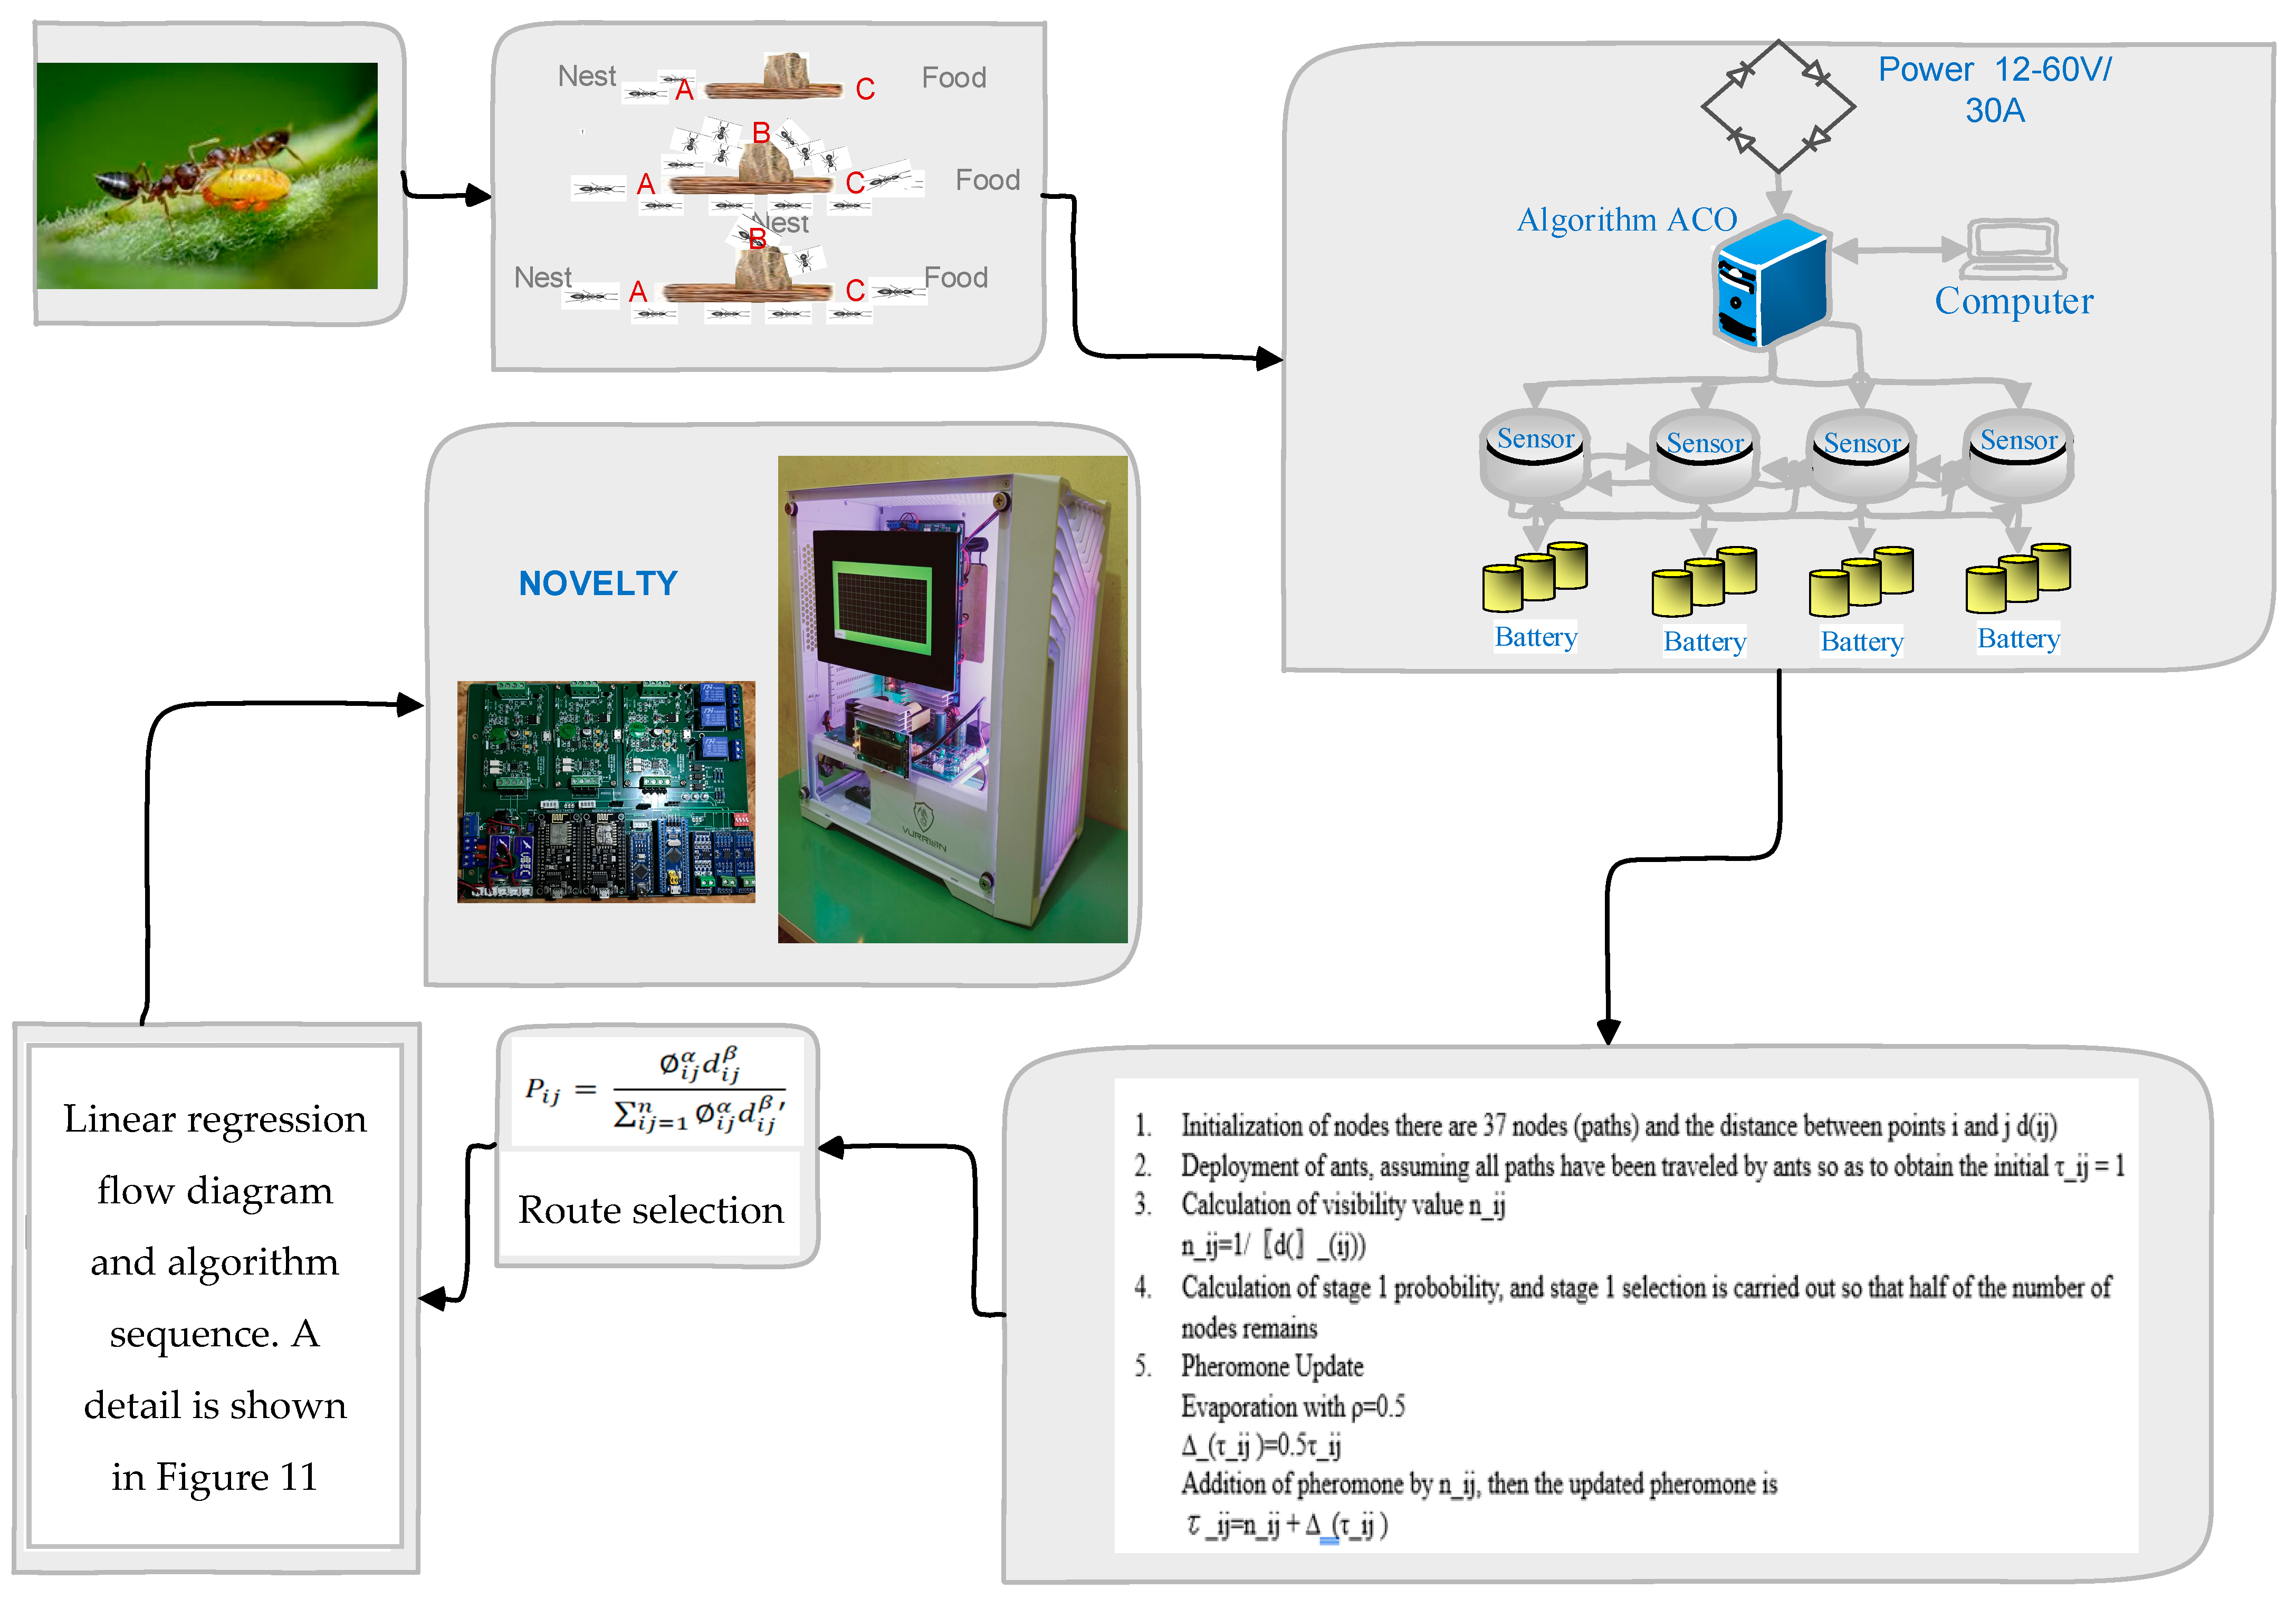
2. ACO Algorithm Stages

According to [22], stages of solving problems based on the Ant Colony algorithm consist of four steps. The first step is the initialization of the problem model, the second step is path selection, the third is evaporation and addition of pheromones, and the last stage is pheromone update. This step is carried out repeatedly until last best path termination is obtained.

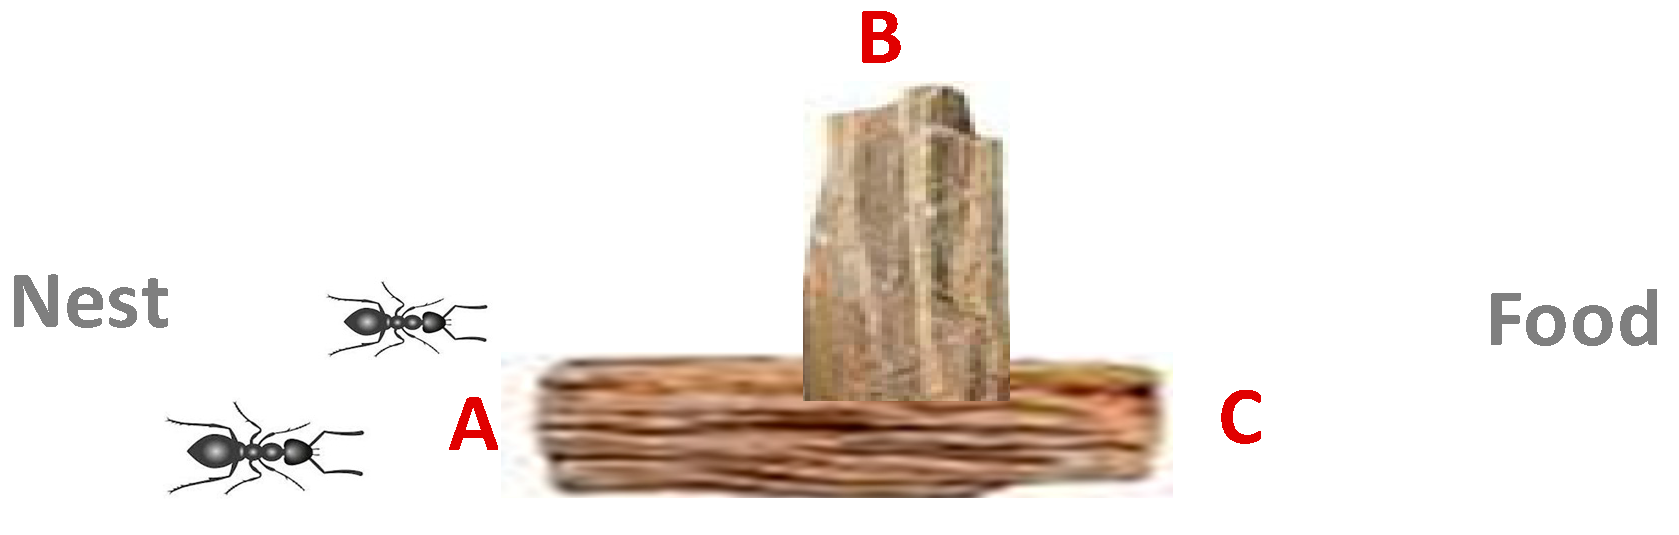
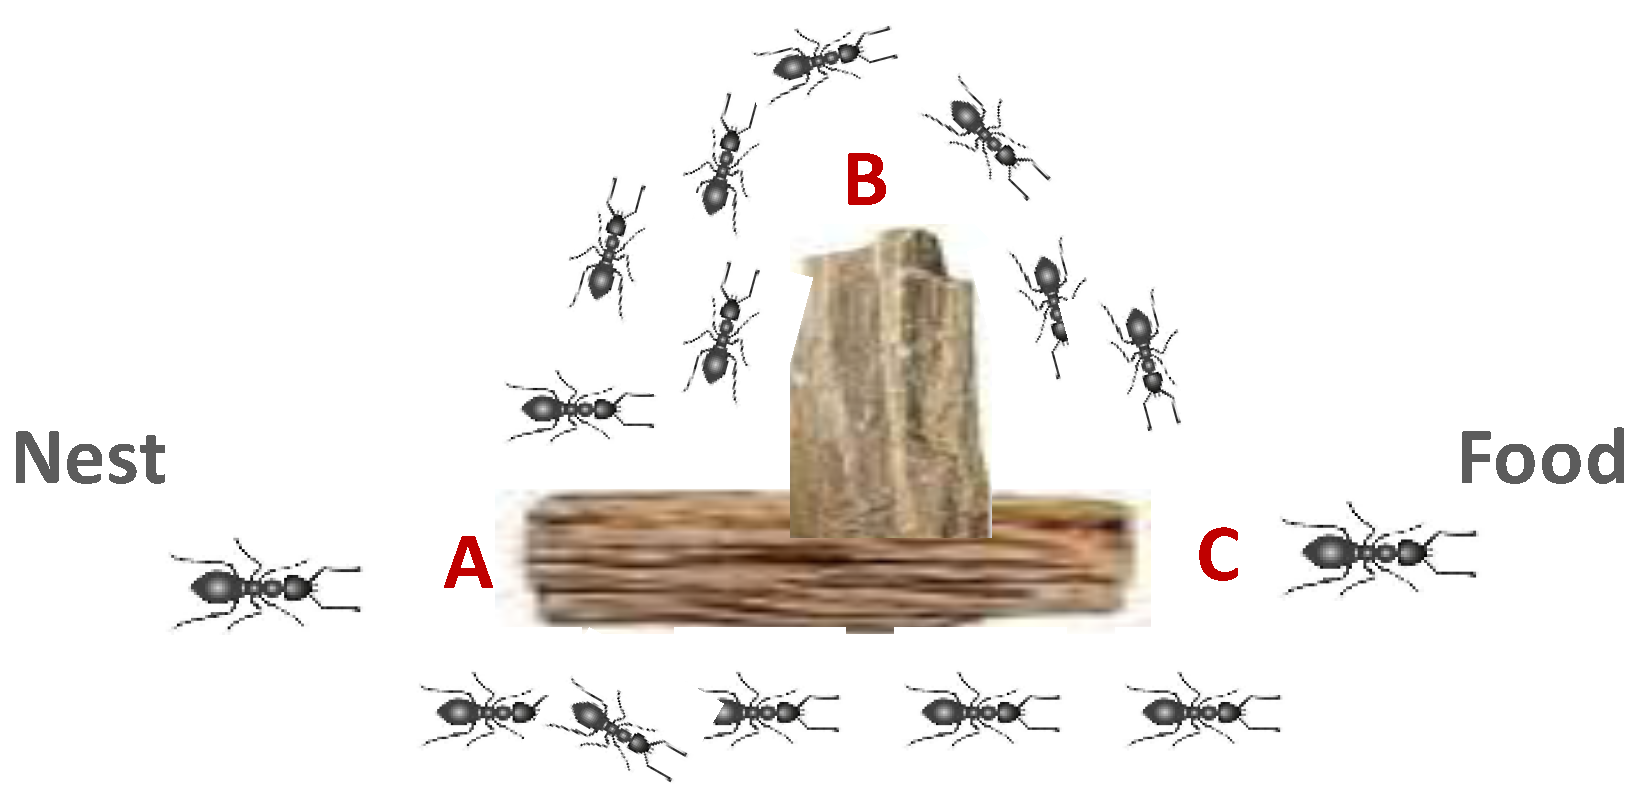
2.1. Initialization and Ant Spread
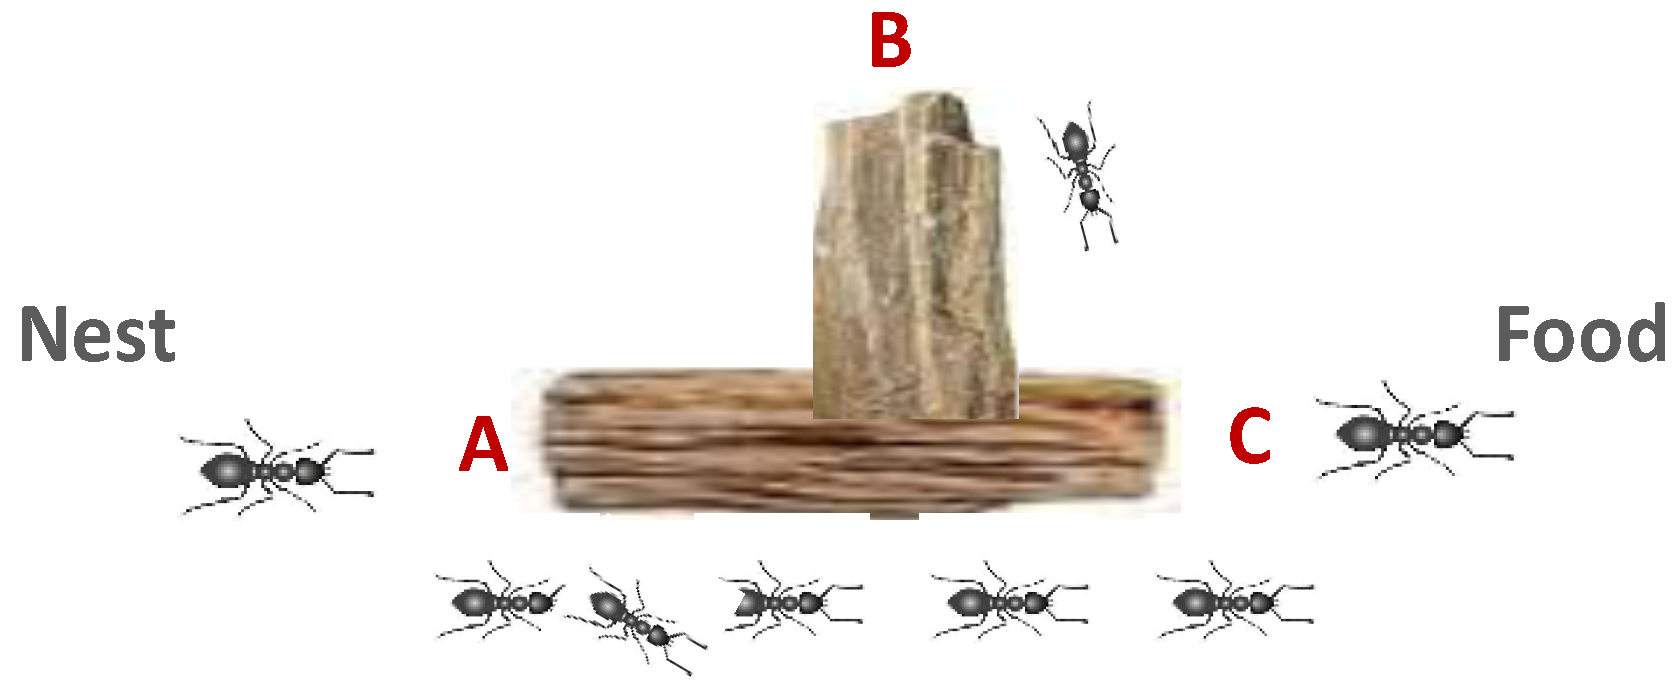
The initialization stage [22] is the earliest stage in solving problems using the Ant Colony algorithm. This stage also includes problem representation, which represents the problem to be solved in the form of ant path mapping, such as algorithm parameters, ant paths, the number of ants, the number of iterations, initial pheromone levels, and other relevant parameters. The initialization stage is illustrated in Figure 1. Initialization is the stage of preparation of all points and paths that can be passed by ants (i, j). The path must have a distance between point i and point j (Lij). The distance can be the length of the path (m) or the time used to determine the path, assuming each ant has the same speed.
As part of the initialization stage, ant spread, as illustrated in Figure 2, was conducted to provide alternative paths to ants to achieve the goal (food). A number of ants m is dispersed to analyze each path from point i to point j, leaving an initial pheromone to be used for other ants.

2.2. Path Selection

Ants can detect pheromone levels in branching pathways, and ants tend to choose pathways with high pheromone levels. The process of selecting such paths is based on probability factors. The probability formula of such a path selection factor is
P i j = ( τ i j α ) η i j β Σ ( τ i j α ) ( η i j β )
Information:
P i j = chances of selection of path i, j;
τij = number of pheromones in the i, j pathway;
ηij = desirability path i, j (usually 1/Lij);
Lij = line (path) distance i, j;
α = influence control parameter τij;
β = influence control parameter ηij.
The process of selecting paths using this probability technique will be carried out repeatedly until the best path termination of the problem model to be solved is found. The process of repeated path selection is also followed by the process of adding and evaporating pheromones.

2.3. Pheromone Addition and Evaporation

Over time, pheromones in each pathway will decrease due to the evaporation of pheromones. The evaporation process will reduce the pheromone levels in the pathway. The amount of pheromone evaporation can be formulated through Equation (2):
Δ τ i j ( a ) = 1 ρ τ i j   a
where ρ is the evaporation parameter of the pheromone set. After evaporation of pheromones is carried out throughout the pathway, on the path chosen by the pheromone ants, a number τ k is added to the selected path. Ants will add pheromones to the amount of pheromones they carry, which is the opposite length of the path they pass.
τ k = 1 L   i j

2.4. Pheromone Update

Pheromone level update is a stage used to select and choose the best path based on the new pheromone level that has evaporated and been added so that the pheromone level in the path can be represented in Equation (4).
τ i j ( a + 1 ) = Δ τ i j ( a ) + τ k
The path search process with the Ant Colony algorithm is complete if best path termination is obtained, which is the path that has the highest pheromone level and the choice of other ants to pass through, such that other paths will be ignored, as illustrated in Figure 3.

3. Lead Acid Batteries

Lead acid batteries are rechargeable batteries consisting of lead acid galvanic cells, namely, lead peroxide (PbO2), lead sponge (Pb), and diluted sulfuric acid (H2SO4) [23]. The working principle of discharging a lead acid battery is that the active material on the electrode will react with the electrolyte and produce lead (II) sulfate (PbSO4) and water. In the charging process, lead (II) sulfate returns to lead (II) oxide at the positive electrode and lead at the negative electrode [17].

4. Root Mean Squared Error (RMSE)

The Root Mean Squared Error (RMSE) is the square root of the mean square of all errors. The RMSE is one of the most commonly used evaluation metrics in statistics, data science, and machine learning to measure the degree to which prediction and estimation models are close to their true values. The RMSE measures the difference between the values predicted by the system and the actual values in calculations or datasheets. More specifically, the RMSE calculates the root mean of the square of the difference between the predicted values and the true values. The lower the RMSE value, the better the prediction model fits the data [17]. In this paper, the RMSE is used to measure the error of the estimated battery SOC with the actual battery SOC. The RMSE range allowed in battery SOC estimation may vary depending on the application and the level of accuracy required. However, the closer the RMSE value is to zero, the better the performance of the SOC estimation model. In the mathematical formula, the RMSE is defined as
1 n   x   i = 1 n ( X Y ) 2
where n is the total number of data, X is the actual value, and Y is the estimated (predicted) value.

5. Mean Absolute Error (MAE)
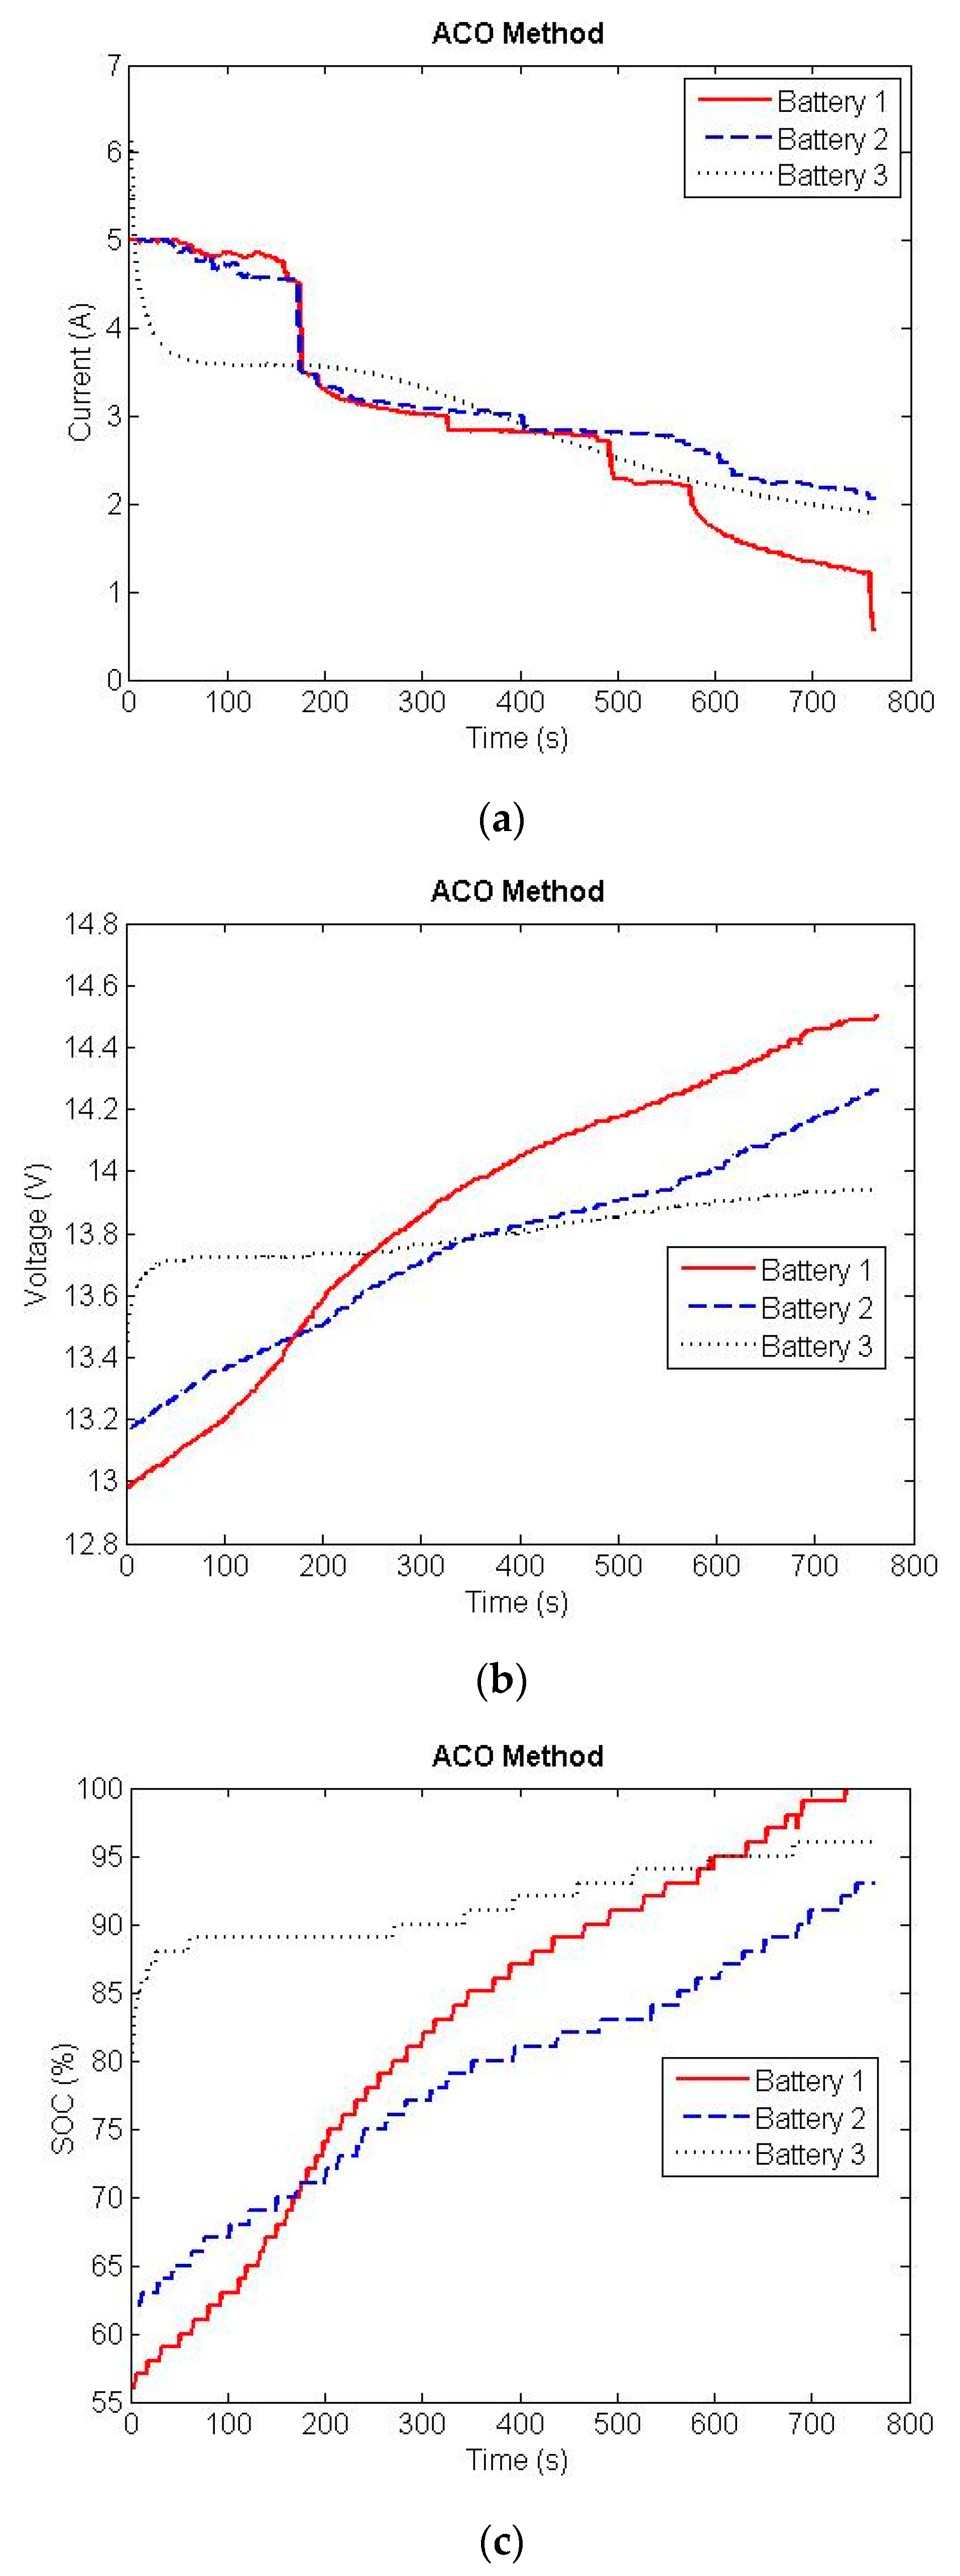
The Mean Absolute Error (MAE) is one of the metrics used in statistics and machine learning to measure the error or deviation between the predicted (estimated) value and the true value. The MAE score is measured as the average of the absolute error values. The absolute is a mathematical function that makes a number positive or, as it is more commonly referred to, absolute. The difference between the expected value and the predicted value can be positive or negative, but both positive and negative values will be positive when calculating the MAE [17].

6. Results

The ACO algorithm flowchart shown in Figure 4 begins with the initialization of all paths that can be traversed by ants to get to food; the path is a variant of the amount of battery charging current SOC in a range from 0 to 100% and the time required to charge with the current value. M ants will be randomly positioned at each point of different current magnitudes to obtain the initial pheromone level of each path. The pheromone level will be updated through evaporation and the addition of pheromones, which will then be eliminated using the probability method so that only paths that have a high pheromone level will be selected by ants as current variants.
The results of data analysis with linear regression show that the battery SOC estimation has good accuracy, with an RMSE value of 0.32 and an MAE of 0.27. The ACO algorithm in this smart charging system aims to find the right battery charging current pattern for each battery, resulting in fast and safe charging for the battery. The charging pattern is the amount of current required to achieve the goal of 100% SOC. The following are the stages of designing the ACO algorithm. (1) The initialization stage begins by modeling the problem in the ACO algorithm. A system diagram of charging control of the ACO algorithm is presented in Figure 5.
The ACO algorithm model is in the form of paths with variable flow rates. This modeling is divided into five stages, as presented in Table 1, where each stage has several possible flow variables that will be analyzed with the ACO algorithm to obtain a safe and fast charging flow pattern. The architecture of the ACO algorithm for five stages of modeling is presented in Figure 6.
In addition to problem modeling, the initialization stage includes determining the distance (Lij) between nodes i (destination points) and the Lij calculation formula, among others:
L i j = 30 i + i j
In the algorithm design, m (50) ants are deployed to determine the choice of each path to perform the probability analysis. The process of selecting paths with probability techniques is carried out repeatedly, followed by evaporation and the addition of pheromones to update the pheromone value of each path, with the following conditions:
  • Influence control parameter for τ i j , α = 1 ;
  • Influence control parameter for η i j , β = 1 ;
  • Pheromone vaporization parameter, ρ = 0.5 .
Based on the concept of finding the best path using the Ant Colony Optimization (ACO) algorithm, the selected path results and details are presented in Table 2, Table 3 and Table 4.
The remaining pheromone is the initial pheromone minus—the pheromone that evaporates, and the pheromone that evaporates is half of the previous pheromone, so the remaining pheromone is 1 − 0.5 = 0.5.
The pheromone added is a pheromone produced by ants that have passed through the path = 1/total distance because the number of paths is only four and there is no other branching, so the pheromone added = 1/distance or = nij.
τi,j is the remaining pheromone plus the pheromones added.
P i , j =   ( τ i j α ) η i j β Σ ( τ i j α ) ( η i j β )
Pi,j Line 15 A = 0.5/(0.5 + 0.274) = 0.646.
Pi,j Line 10 A = 0.274/(0.5 + 0.274) = 0.354.
We eliminate paths that have a chance rate of less than 1: total paths or 1:2 = 0.5, and then the path chosen by the ants is identified as the fastest path, with a current of 15 A.
A schematic diagram of the ACO algorithm with the infrastructure used for charging is presented in Figure 7.

7. Discussion

7.1. ACO Prediction

The charging algorithm of the ACO algorithm for the battery charging process was programmed and displayed on Google Colab and tested to obtain the RMSE and MAE values of the charging system on the Google Colab platform.
The data collection process is conducted by connecting the battery to the charging system. In the experiment, three batteries with different State of Charge (SOC) levels are utilized to ensure the compatibility of the charging current and the battery’s specifications. Battery charging information is presented in Table 5, and the ACO prediction results are shown in Figure 8. Figure 8 illustrates the function of the ACO algorithm as a regulator when selecting the appropriate current and fast-charging method to enhance the efficiency of each battery. The prediction comparison of the ACO algorithm with the CC-CV method is presented in Figure 9 and Figure 10.

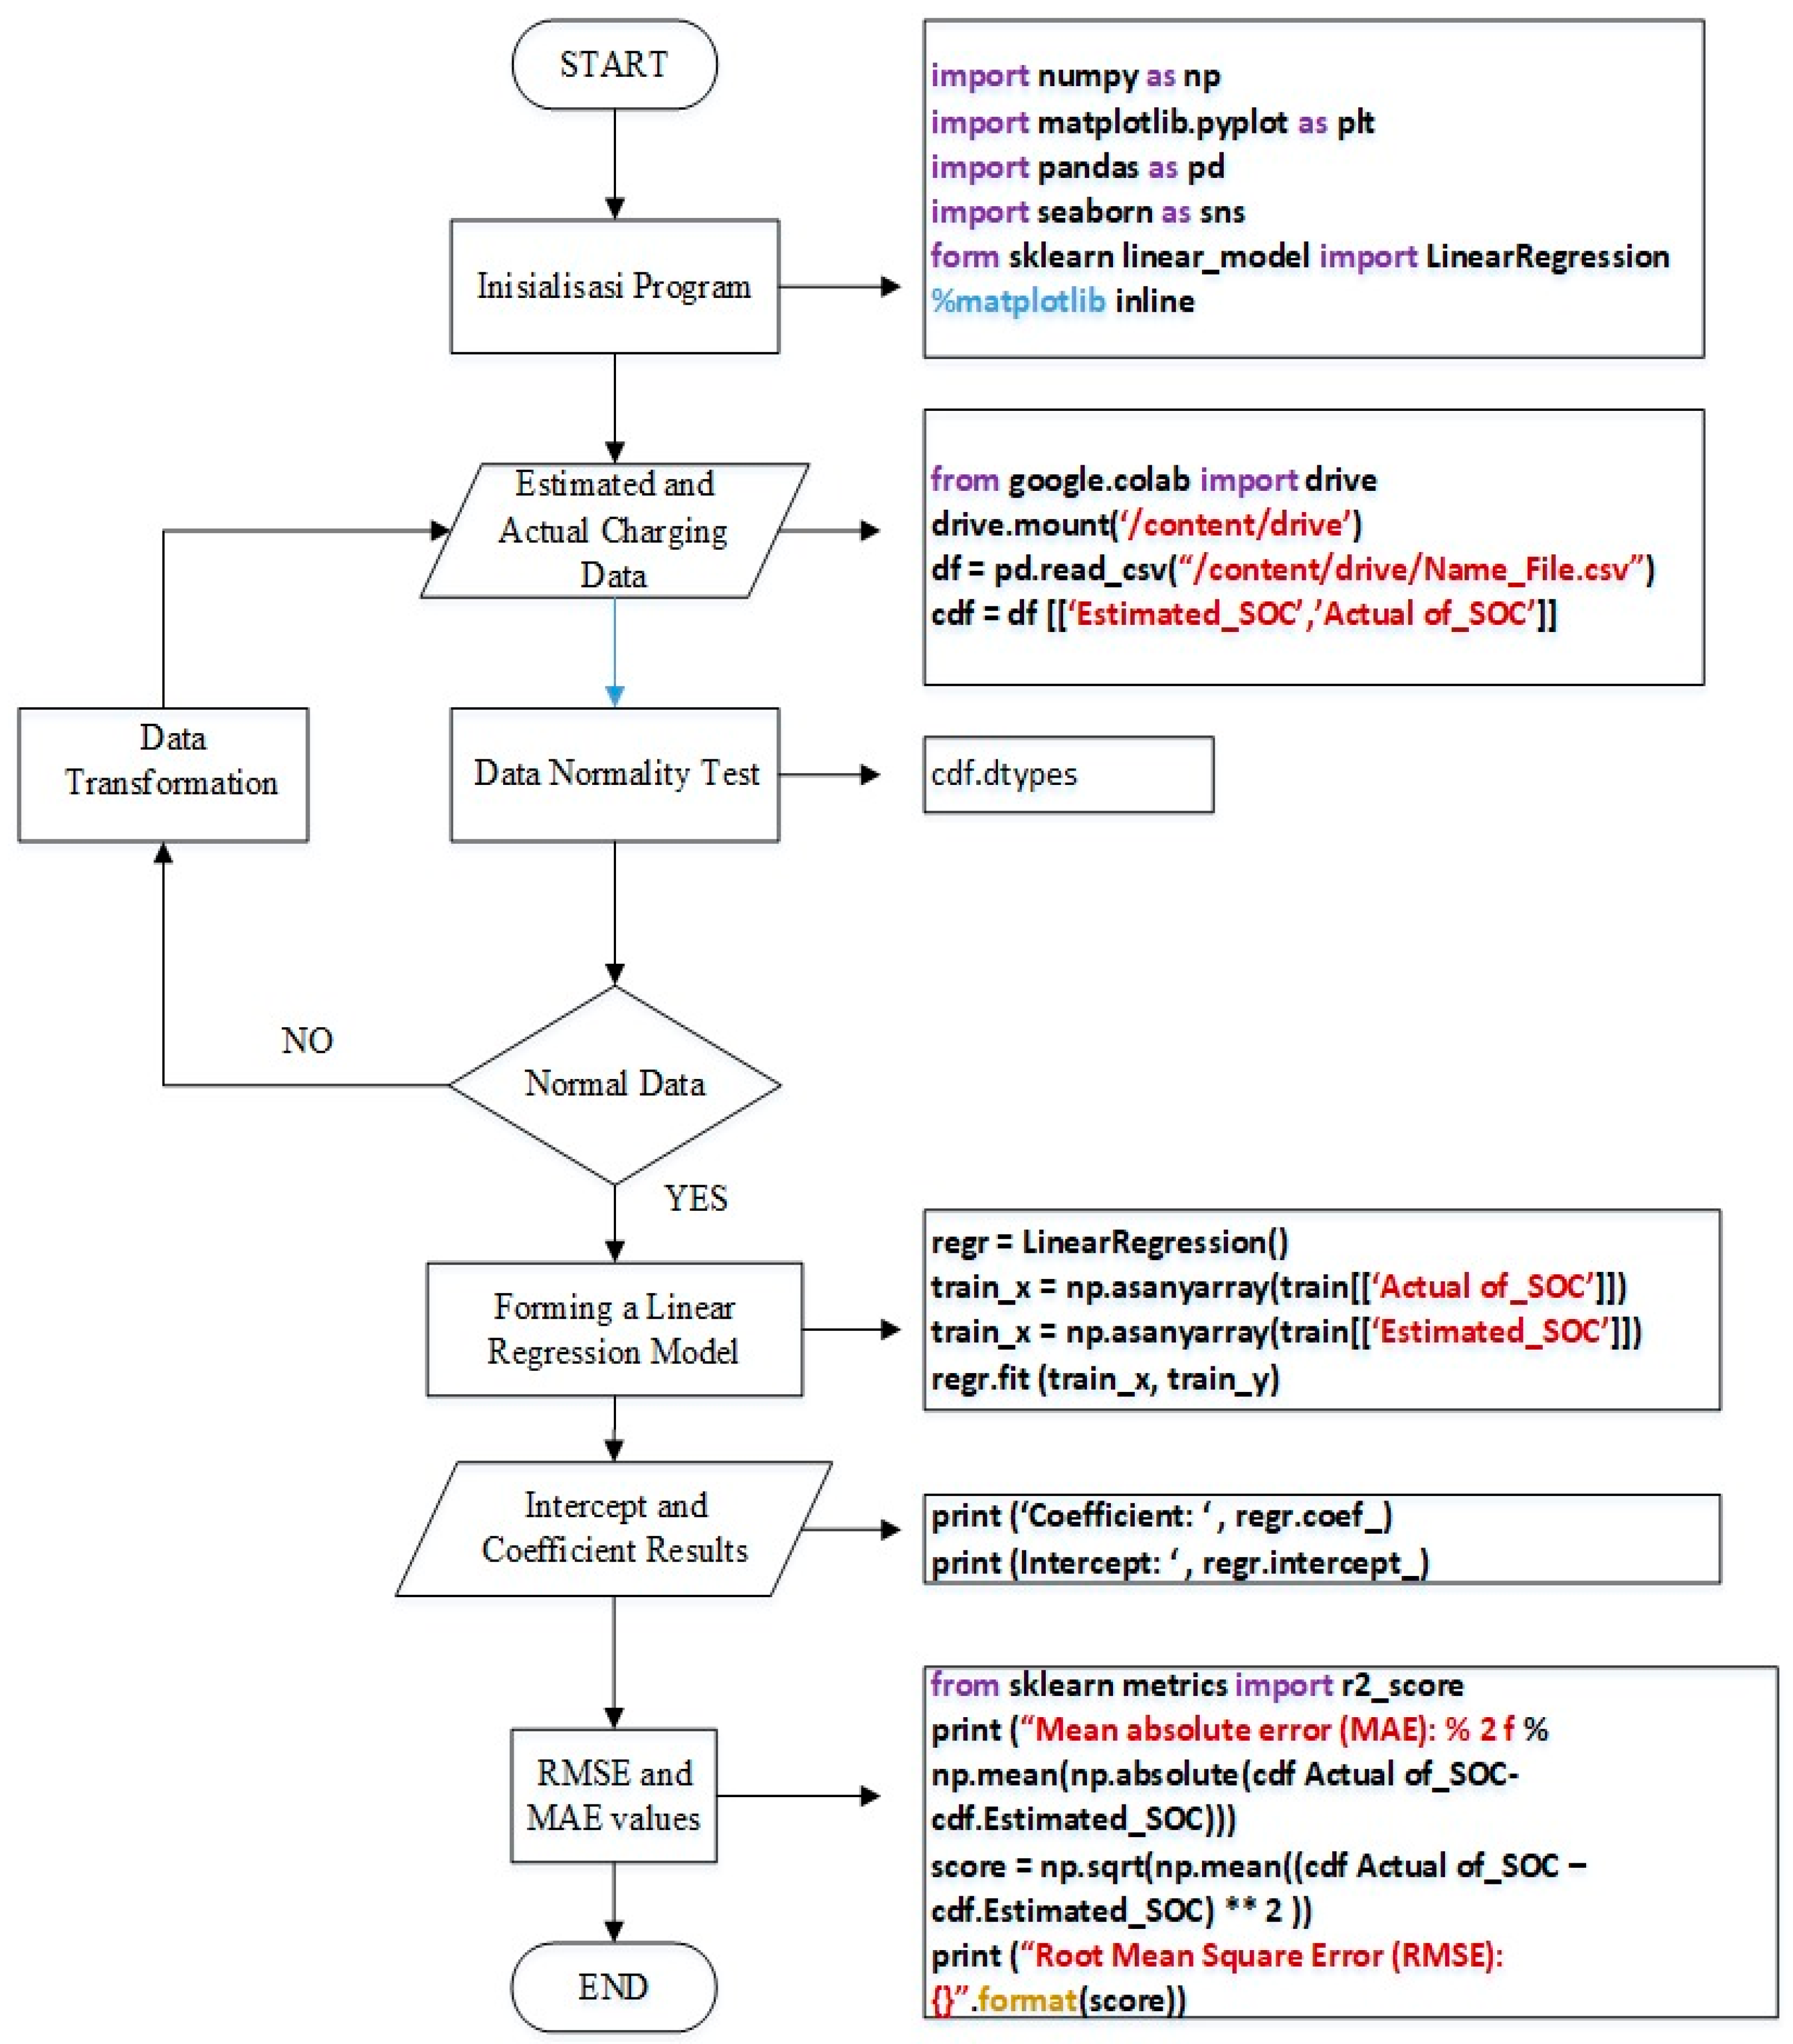
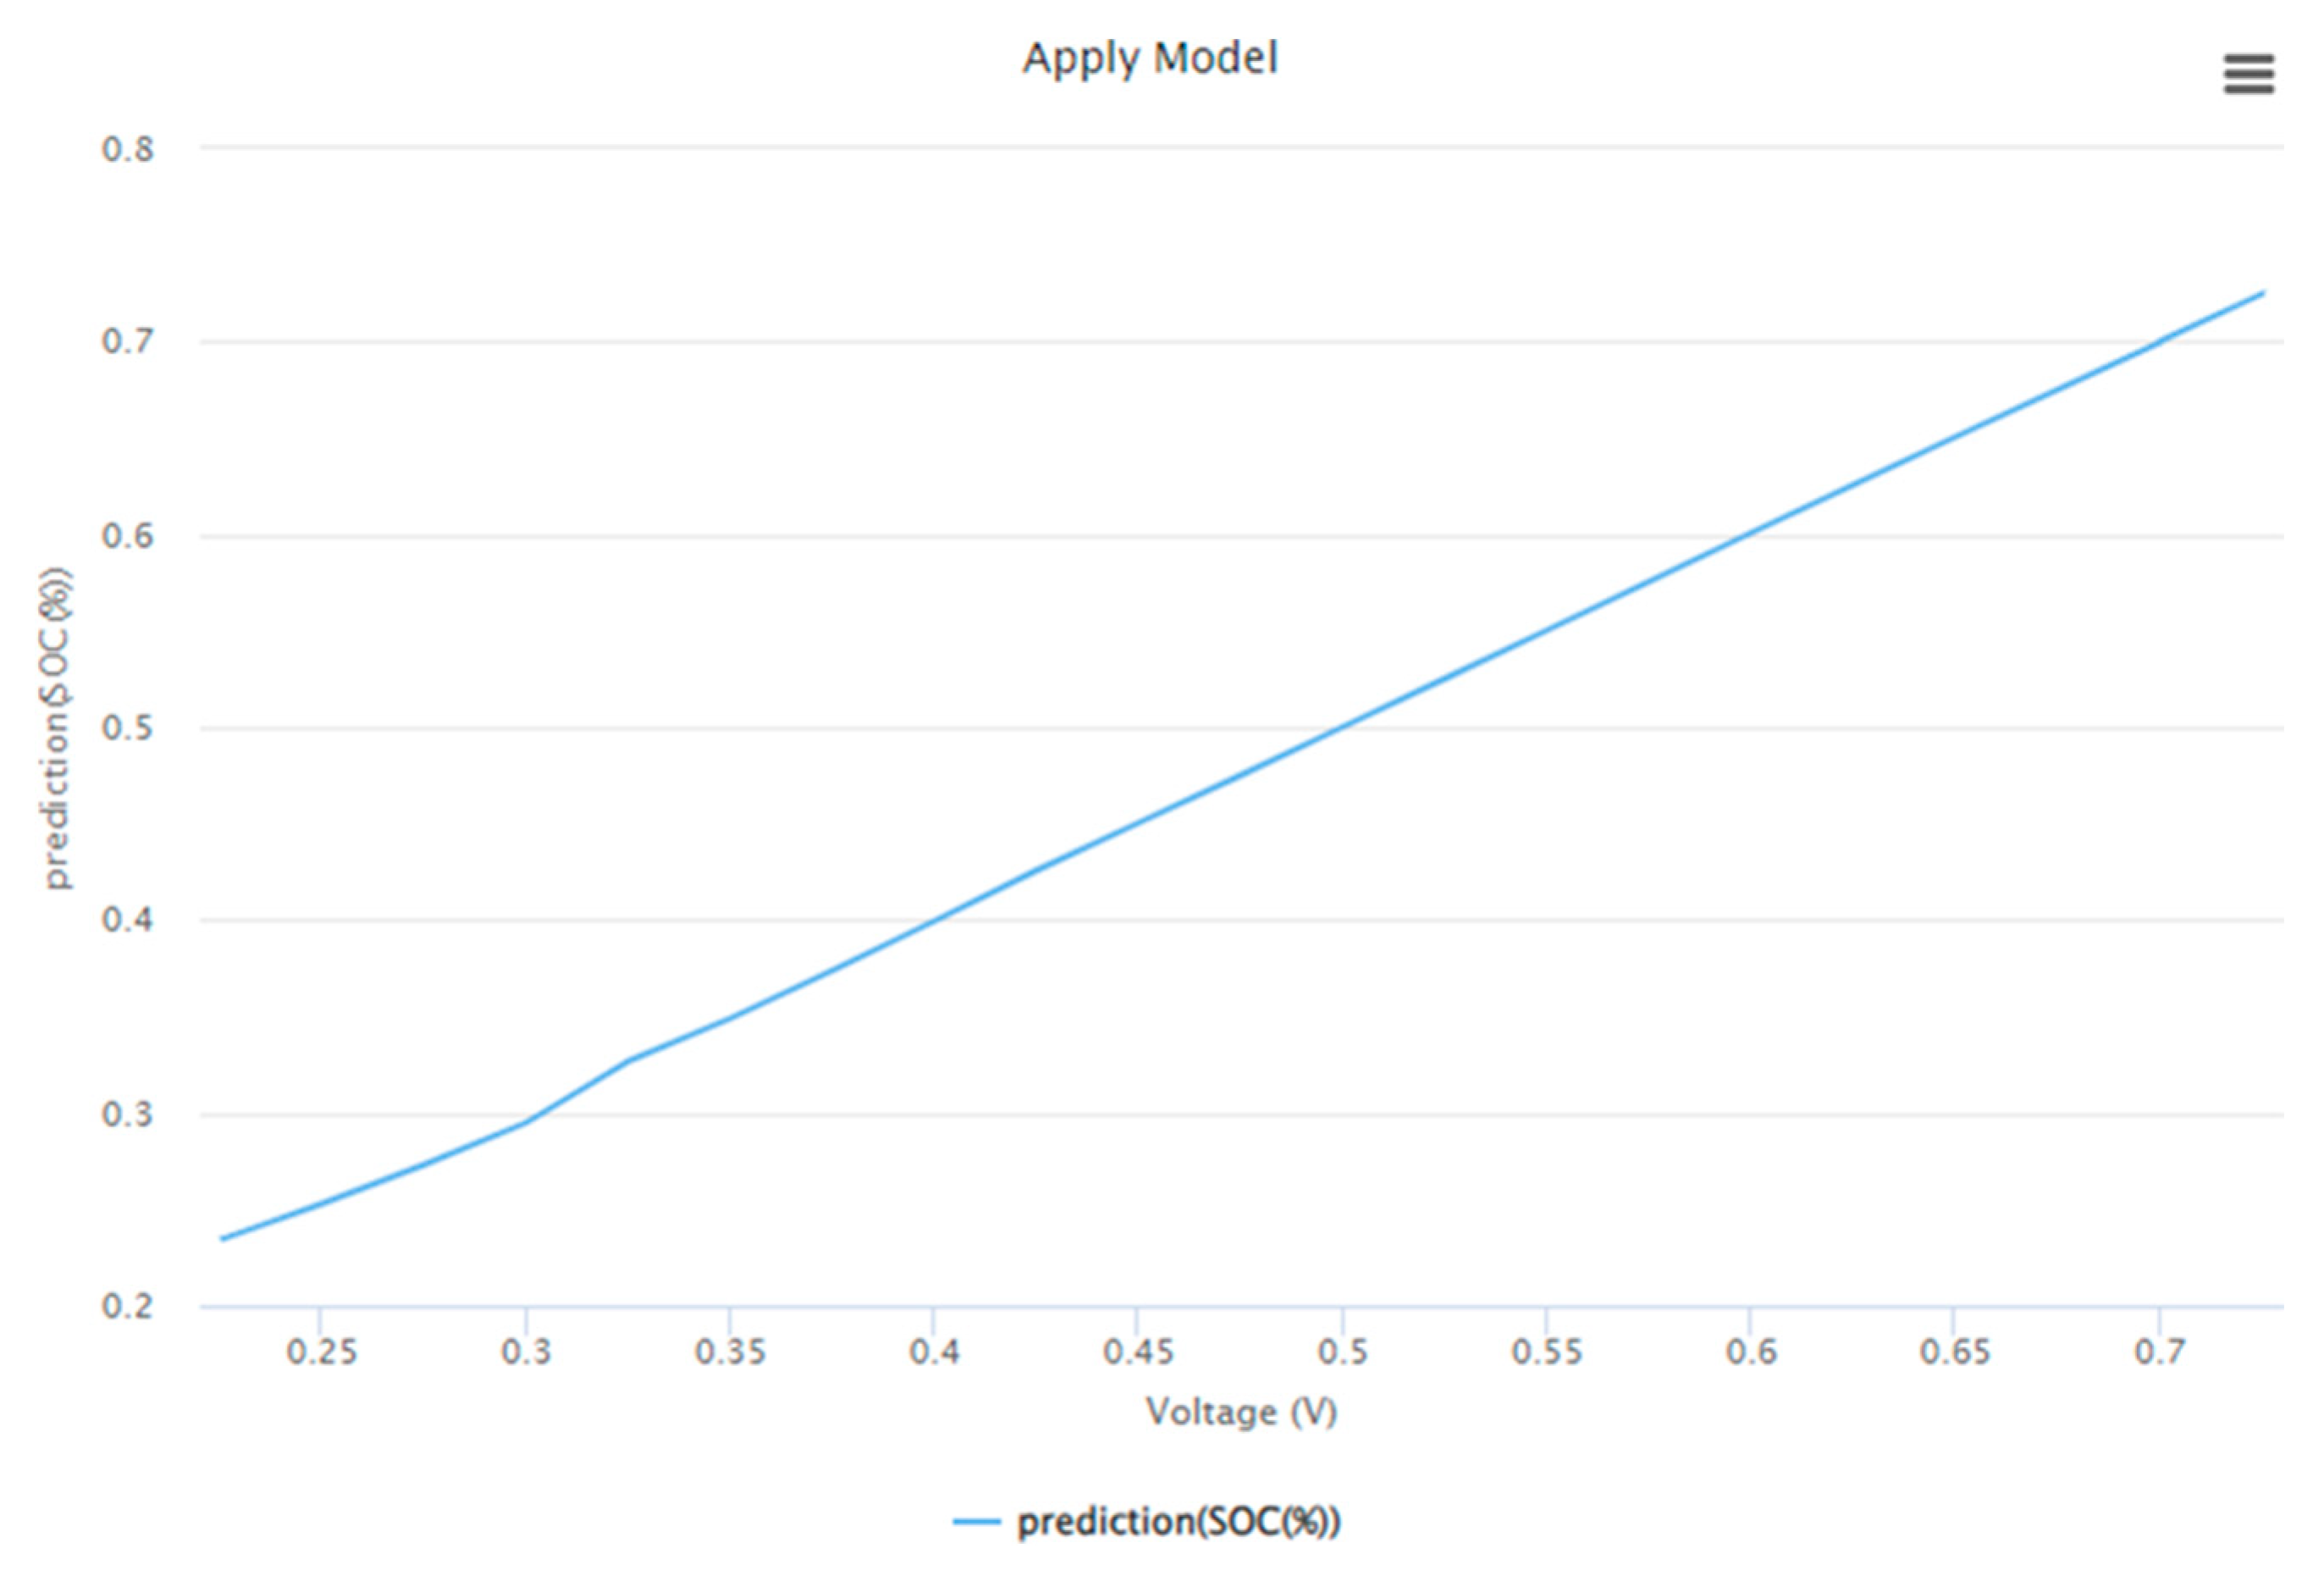
7.2. Data Processing Using Linear Regression

The linear regression flowchart shown in Figure 11 begins with program initialization, which is the process of entering the library that will be used in the linear regression data processing function, followed by uploading the SOC data file to Google Colab. Before being processed, the data will be tested for normality. The objective is to check whether the data can be processed further or not quantitatively. If the data are not normal, the data cannot be analyzed. Once normality data checking is complete, linear regression modeling can be performed with the Linear Regression() function. Linear regression modeling is obtained with coefficient and intercept values. The RMSE and MAE values are also calculated.
In the process of analyzing the data to determine the linear regression model with the actual SOC and the estimated SOC parameters in Table 6, when processing data with the regression function, it is necessary to determine the related variables that are used as input for the regression architecture model. A total of two variables are processed using the regression function, namely, variables X and Y, where X is the actual SOC and Y is the estimated SOC.
In Figure 12, the results of linear regression modeling are obtained. In the model, there is a red, straight line, which is a linear line from the regression function. The linear line is the relationship of the two variables processed, namely, the actual SOC and the estimated SOC. The linear regression model used is presented in Table 6 and Table 7, with a coefficient value of 1.00426298 and an intercept of −0.39176098. A final regression equation is presented in Equation (8).
The linear regression model used produces a coefficient value of 1.00426298 and an intercept of −0.39176098, so the linear regression equation is
Estimation SoC (Y) = 1.00426298 Actual SoC (X) − 0.39176098
This study also presents a comparison between Supervised Learning Machine Learning (regression) and machine learning neural networks. Figure 13 is a graph of the output results using the neural network from the RapidMiner application, which shows the relationship between voltage on the X axis (horizontal) in the range of 0.2 to 0.7 and the estimated State of Charge (SOC) on the Y axis (vertical) in the range of 0.234 to 0.721 in the form of normalized data. In the graph, there is a blue line that shows the results of SOC prediction using a neural network.

8. Conclusions

According to the results of this study, the following summary can be drawn:
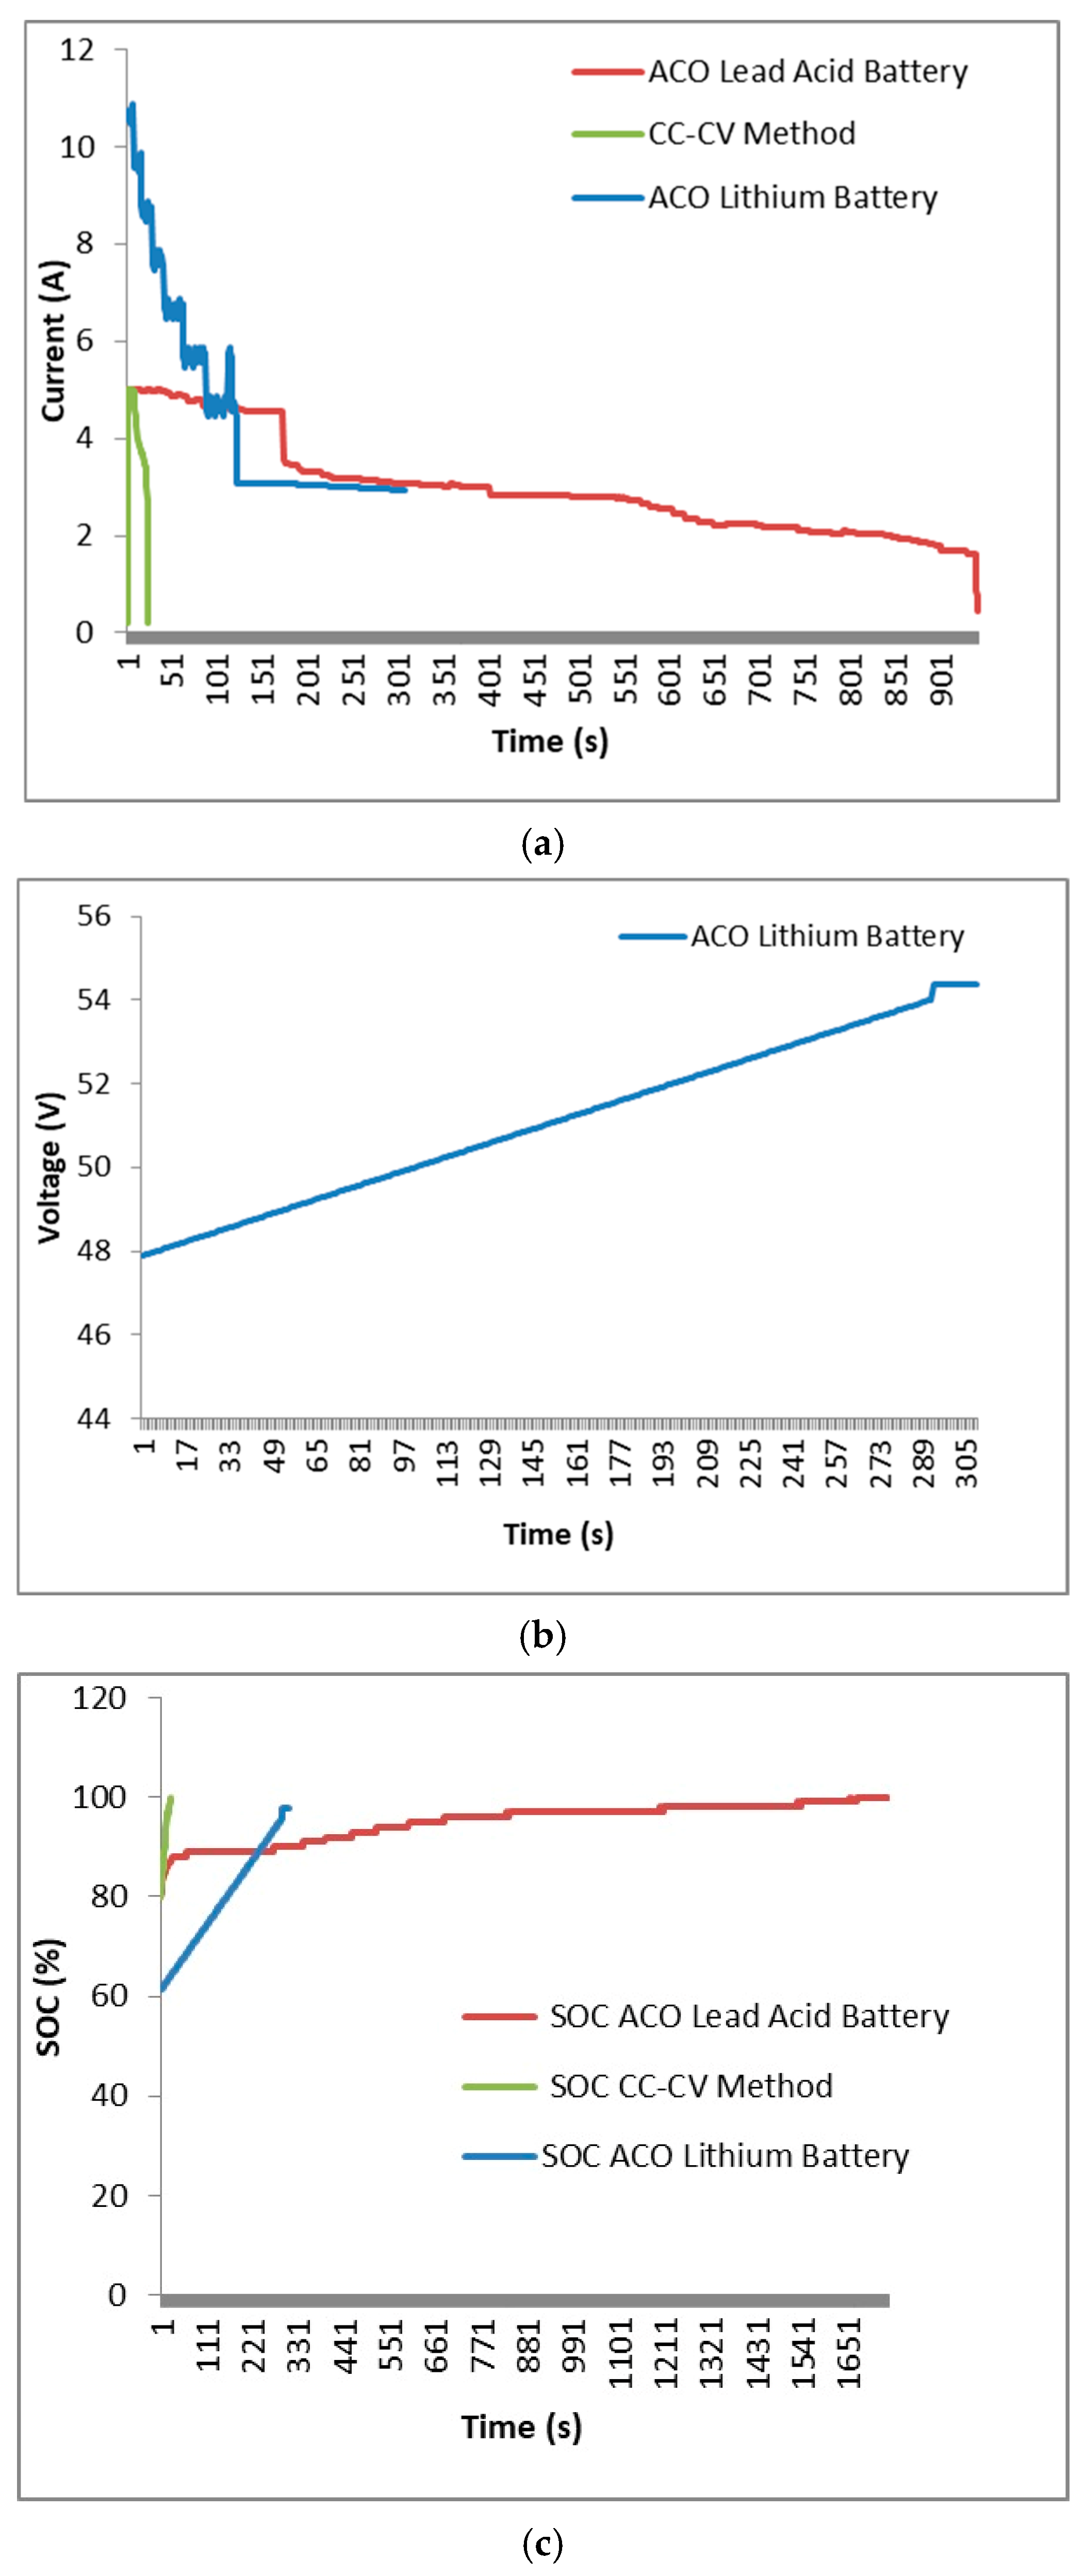
  • The Ant Colony algorithm uses both supervised learning and unsupervised learning and produces current patterns of 10 A, 5 A, 3 A, 2 A, and 0 A as the best current path in the battery charging system to produce a fast and safe charging process for the battery.
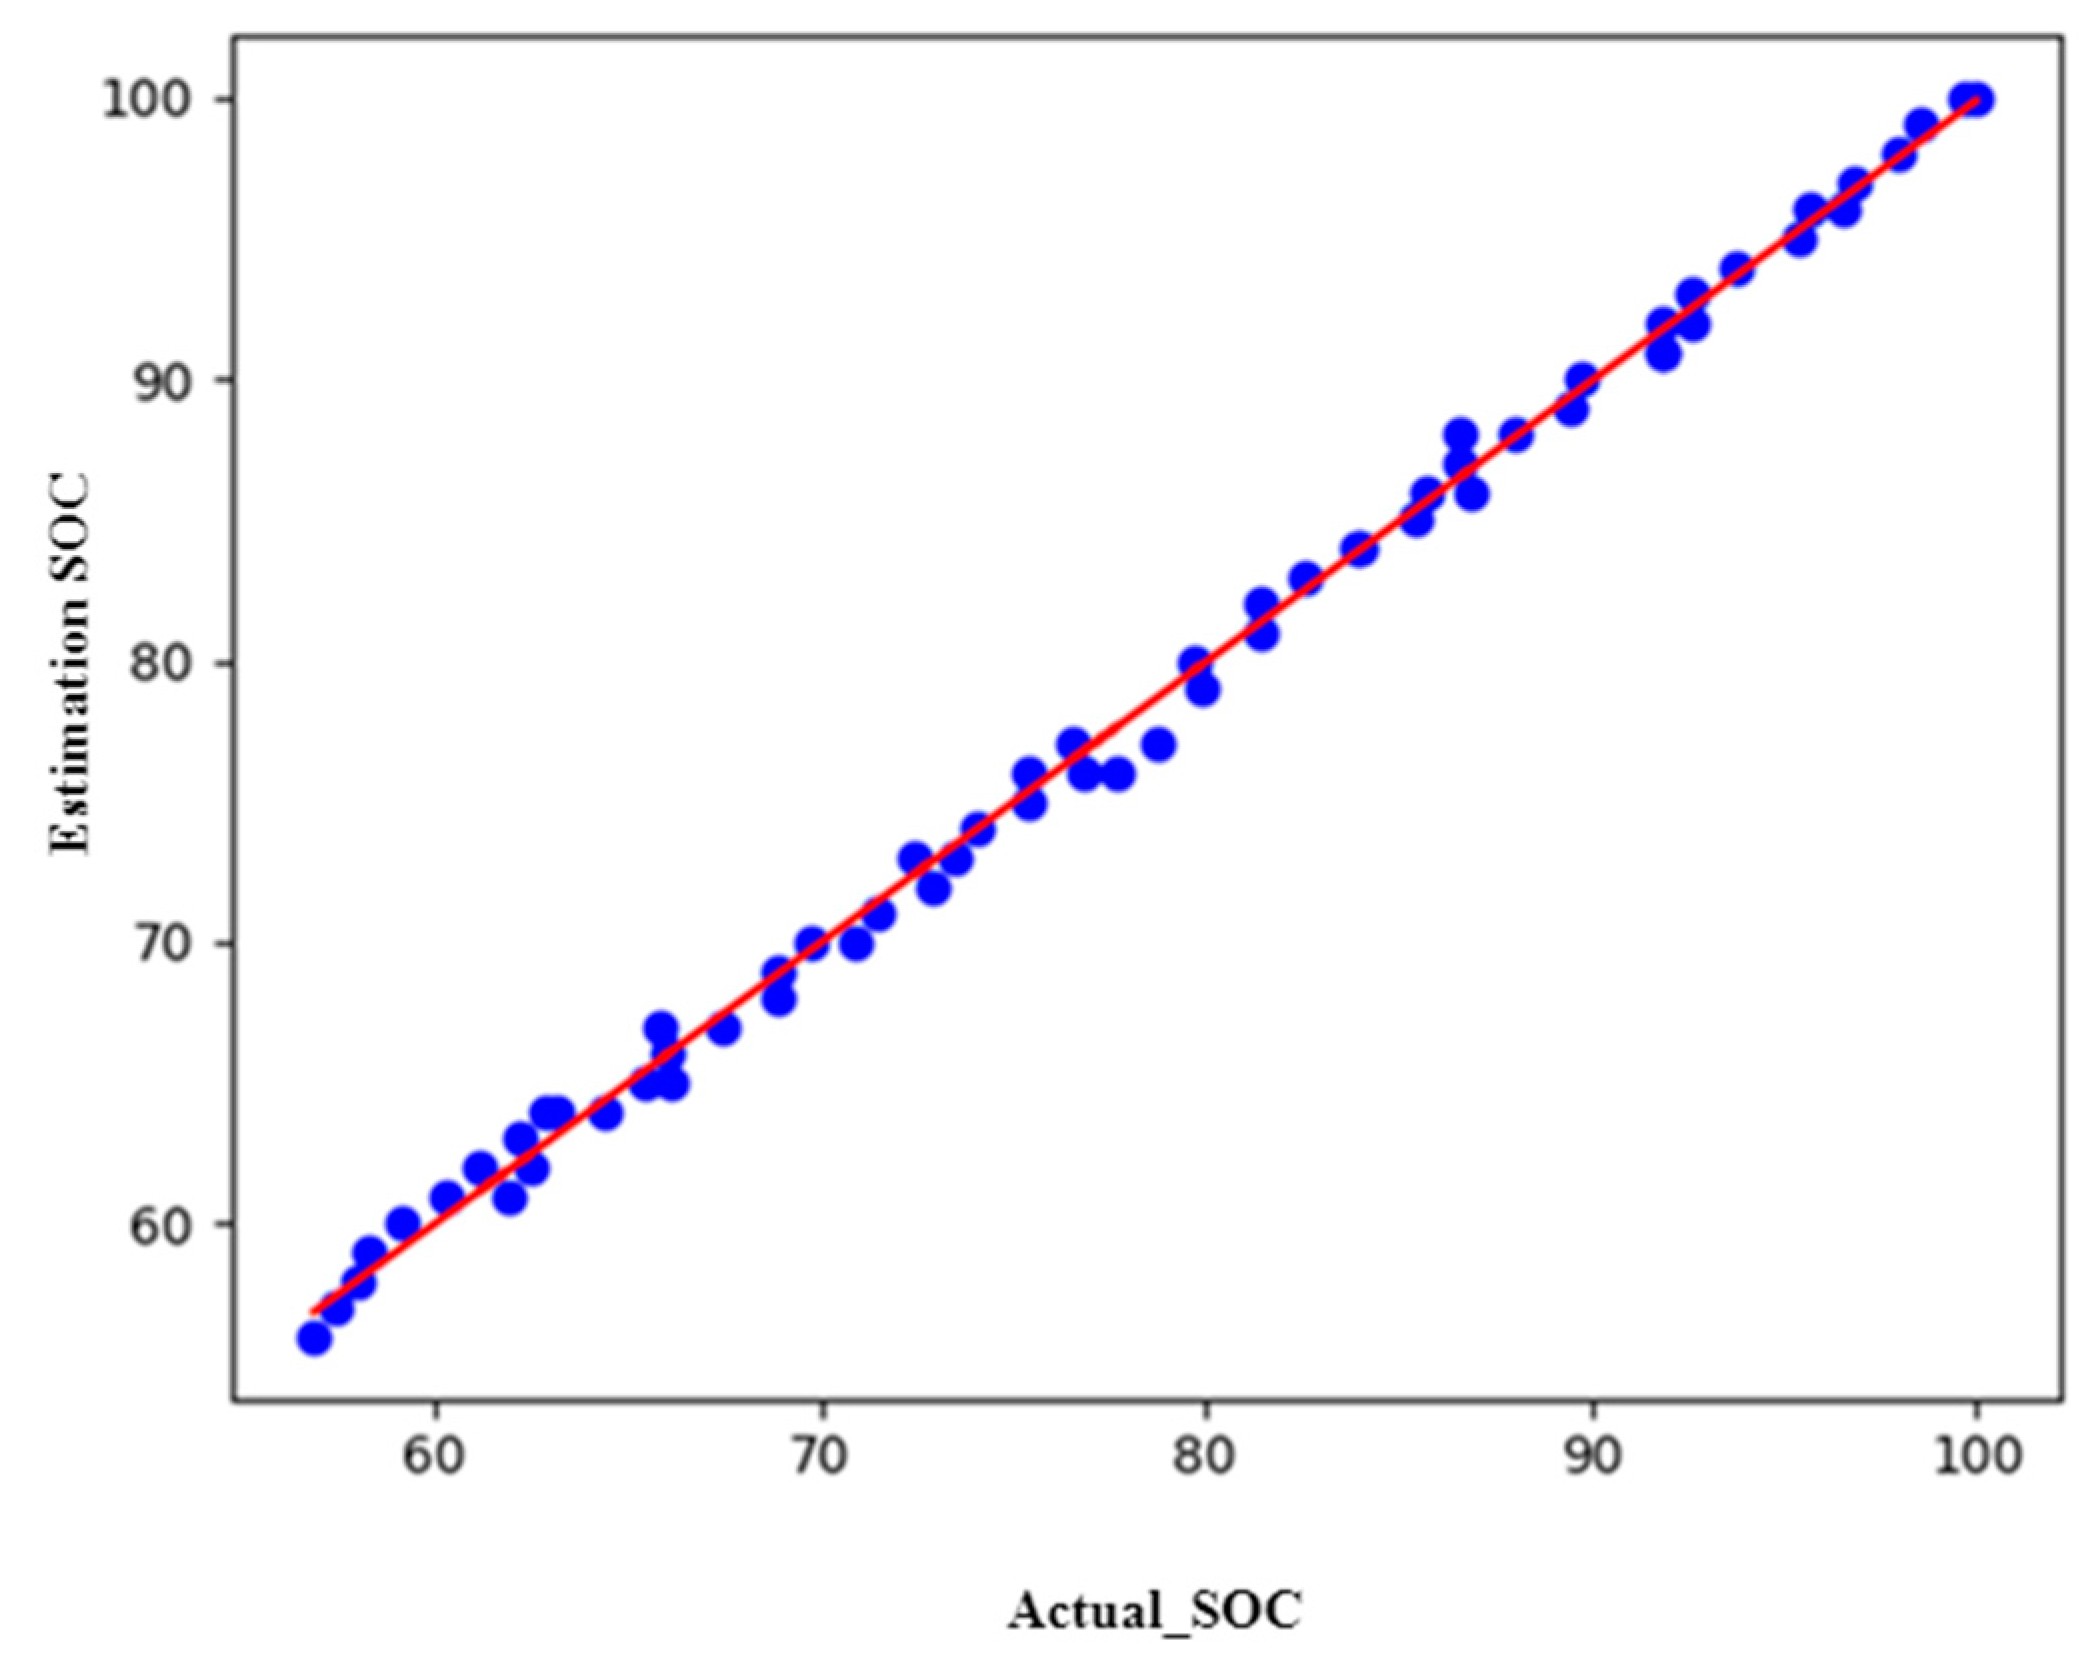
  • The SOC estimation results of lead acid batteries using the Ant Colony algorithm, based on linear regression data, produce good accuracy, with an RMSE value of 0.32238 and an MAE of 0.27002.
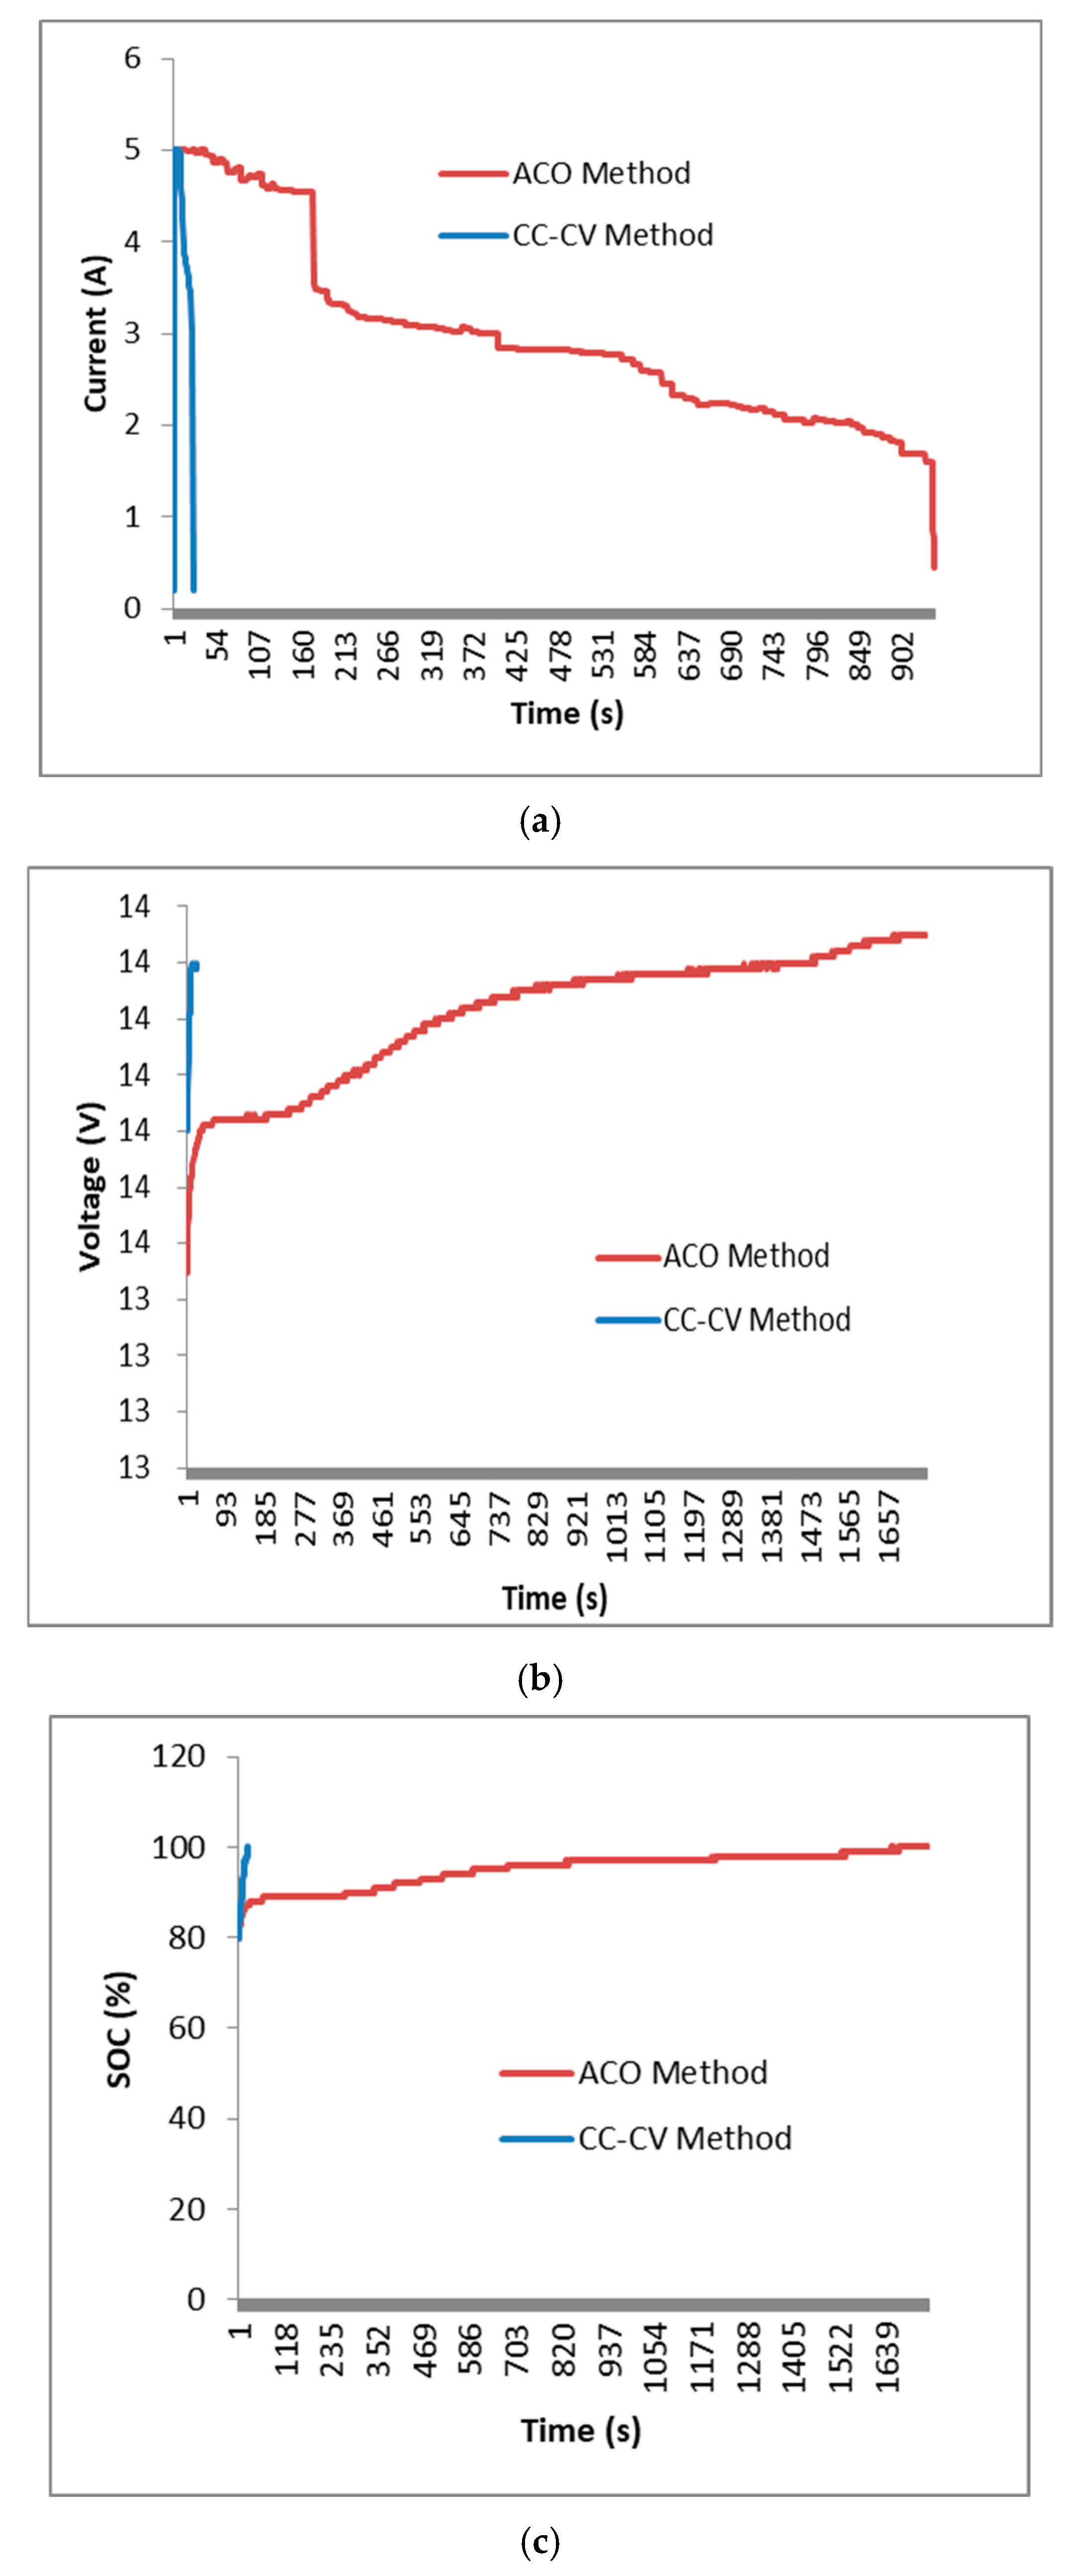
  • The charging system with the Ant Colony Optimization algorithm has a charging current when charging the battery that is more stable compared to charging without the Ant Colony Optimization algorithm, which has spikes and high fluctuations. As such, it can be said that charging with the ACO algorithm is a safe way to charge the battery.

Author Contributions

Conceptualization, S.M.; methodology, S.M.; software, S.M.; validation, S.M., E.P. and N.L.H.; formal analysis, S.M. and W.C.; investigation, S.M.; resources, E.P., N.L.H., T.D. and A.C.A.B.; writing—original draft preparation, S.M.; writing—review and editing, S.M., M.W.B.U., S.U.H. and W.C.; visualization, S.M. and W.C.; supervision, W.C.; project administration, E.P., N.L.H. and T.D.; funding acquisition, S.M. and W.C. All authors have read and agreed to the published version of the manuscript.

Funding

The corresponding authors thank Diponegoro University for the Adjunct Professor program No. 1276/UN7.J7/DK/2024. The APC was funded by Wahyu Caesarendra.

Data Availability Statement

Data are unavailable due to privacy or ethical restrictions.

Conflicts of Interest

The authors declare no conflicts of interest.

References

  1. Hou, H.; Du, B.; Guo, D.; Xu, H.; Fan, Y. Path to the Sustainable Development of China’s Secondary Lead Industry: An Overview of the Current Status of Waste Lead-Acid Battery Recycling. Environ. Impact Assess. Rev. 2024, 15, 107389. [Google Scholar] [CrossRef]
  2. Queiroz, M.B.; Duarte RC, O.; Lima, J.F.; Vilar, E.O. Comparative Evaluation of Grid Corrosion of Lead-Acid Batteries Formed by Casting and Rolling Process. J. Power Sources 2024, 596, 234113. [Google Scholar] [CrossRef]
  3. Khan, A.B.; Akram, A.S.; Choi, W. State of Charge Estimation of Flooded Lead Acid Battery Using Adaptive Unscented Kalman Filter. Energies 2024, 17, 1275. [Google Scholar] [CrossRef]
  4. Yin, L.; Liu, S.; Yin, D.; Du, K.; Yan, J.; Armwood-Gordon, C.K.; Li, L. Development of Rechargeable Cement-Based Batteries with Carbon Fiber Mesh for Energy Storage Solutions. J. Energy Storage 2024, 93, 112181. [Google Scholar] [CrossRef]
  5. Su, W.; Zhang, Y.; Wang, H.; Yang, M.; Niu, Z. An Ultrafast Air Self-Charging Zinc Battery. Adv. Mater. 2024, 36, 2308042. [Google Scholar] [CrossRef]
  6. Du, X.Y.; Song, L.N.; Liang, S.; Wang, Y.F.; Wang, Y.; Wang, H.F.; Xu, J.J. Photo-Assisted Chemical Self-Rechargeable Zinc Ion Batteries with High Charging and Discharging Efficiency. Angew. Chem. 2024, 136, e202411845. [Google Scholar] [CrossRef]
  7. Rani, N.N.; Drenganathan, R.K.; Praveen, G.D.; Santhoshkumar, B.; Prasad, S.G. Self Charging In E-Vehicle Using Two Batteries. In Proceedings of the 2024 International Conference on Communication, Computing and Internet of Things (IC3IoT), Chennai, India, 17–18 April 2024. [Google Scholar]
  8. Song, H.; Liu, C.; Amani, A.M.; Gu, M.; Jalili, M.; Meegahapola, L.; Yu, X.; Dickeson, G. Smart Optimization in Battery Energy Storage Systems: An Overview. Energy AI 2024, 17, 100378. [Google Scholar] [CrossRef]
  9. Nouri, A.; Lachheb, A.; El Amraoui, L. Optimizing Efficiency of Vehicle-to-Grid System with Intelligent Management and ANN-PSO Algorithm for Battery Electric Vehicles. Electr. Power Syst. Res. 2024, 226, 109936. [Google Scholar] [CrossRef]
  10. Rauf, M.; Kumar, L.; Zulkifli, S.A.; Jamil, A. Aspects of Artificial Intelligence in Future Electric Vehicle Technology for Sustainable Environmental Impact. Environ. Chall. 2024, 14, 100854. [Google Scholar] [CrossRef]
  11. Iqbal, S.; Alshammari, N.F.; Shouran, M.; Massoud, J. Smart and Sustainable Wireless Electric Vehicle Charging Strategy with Renewable Energy and Internet of Things Integration. Sustainability 2024, 16, 2487. [Google Scholar] [CrossRef]
  12. Qi, Z. Application of Improved Ant Colony Algorithm in Optimizing the Charging Path of Electric Vehicles. World Electr. Veh. J. 2024, 15, 230. [Google Scholar] [CrossRef]
  13. Li, Z.; Wei, Y.; Park, J.H. An Improved Bilevel Algorithm Based on Ant Colony Optimization and Adaptive Large Neighborhood Search for Routing and Charging Scheduling of Electric Vehicles. IEEE Trans. Transp. Electrif. 2024; early access. [Google Scholar]
  14. Karno, S.P.A.; Ristono, A.; Soepardi, A. Allocation Optimization of An Electrical Vehicle Charging Station Using Ant Colony Algorithm; IEOM Society International: Southfield, MI, USA, 2024. [Google Scholar] [CrossRef]
  15. Banerjee, A.; Pradhan, S.; Misra, B.; Chakraborty, S. A Guide to Meta-Heuristic Algorithms for Multi-objective Optimization: Concepts and Approaches. In Applied Multi-Objective Optimization; Springer: Berlin/Heidelberg, Germany, 2024. [Google Scholar]
  16. Ourouss, K.; Naja, N.; Jamali, A. Defending Against Smart Grayhole Attack Within MANETs: A Reputation-Based Ant Colony Optimization Approach for Secure Route Discovery in DSR Protocol. Wirel. Pers. Commun. 2021, 116, 207–226. [Google Scholar] [CrossRef]
  17. Shahriar, S.; Al-Ali, A.R.; Osman, A.H.; Dhou, S.; Nijim, M. Prediction of EV Charging Behavior Using Machine Learning. IEEE Access 2021, 9, 111576–111586. [Google Scholar] [CrossRef]
  18. Mazhar, T.; Asif, R.N.; Malik, M.A.; Nadeem, M.A.; Haq, I.; Iqbal, M.; Kamran, M.; Ashraf, S. Electric Vehicle Charging System in the Smart Grid Using Different Machine Learning Methods. Sustainability 2023, 15, 2603. [Google Scholar] [CrossRef]
  19. Yaghoubi, E.; Yaghoubi, E.; Khamees, A.; Razmi, D.; Lu, T. A Systematic Review and Meta-Analysis of Machine Learning, Deep Learning, and Ensemble Learning Approaches in Predicting EV Charging Behavior. Eng. Appl. Artif. Intell. 2024, 135, 108789. [Google Scholar] [CrossRef]
  20. Bairwa, B.; Saleem, S.A.; Jampala, K. Machine Learning for Battery Charging: From Prediction to Categorization. In Proceedings of the 2024 15th International Conference on Computing Communication and Networking Technologies (ICCCNT), Kamand, India, 24–28 June 2024. [Google Scholar]
  21. Shi, T.; Zhao, F.; Zhou, H.; Qi, C. Research on Intelligent Energy Management Method of Multifunctional Fusion Electric Vehicle Charging Station Based on Ma-Chine Learning. Electr. Power Syst. Res. 2024, 229, 110037. [Google Scholar] [CrossRef]
  22. Reddy, M.R.; Pandian, R. Edge Detection of an Image based on Ant Colony Optimization Technique. Int. J. Sci. Res. 2013, 2, 1256–1260. [Google Scholar]
  23. Hua, C.C.; Lin, M.Y. A Study of Charging Control of Lead-Acid Battery for Electric Vehicles. In Proceedings of the 2000 IEEE International Symposium on Industrial Electronics (Cat. No. 00TH8543), Cholula, Puebla, Mexico, 4–8 December 2000. [Google Scholar]
Figure 1. Ant path at the initialization stage of the ACO algorithm.
Digital 05 00006 g001
Figure 2. ACO distribution path.
Digital 05 00006 g002
Figure 3. The best chosen path for ants’ movement.
Digital 05 00006 g003
Figure 4. Flowchart of the ACO algorithm.
Digital 05 00006 g004
Figure 5. System diagram of charging control of the ACO algorithm.
Digital 05 00006 g005
Figure 6. ACO architecture for 5 stages of modeling.
Digital 05 00006 g006
Figure 7. Infrastructure used when charging, with a detailed illustration of the stages.
Digital 05 00006 g007
Figure 8. (a) Current to time graph during battery charging. (b) Graph of voltage against time during battery charging. (c) SOC graph against time during battery charging.
Digital 05 00006 g008
Figure 9. (a) Current to time graph of ACO and CC-CV method. (b) Graph of voltage against time for ACO and CC-CV method. (c) SOC graph against time for ACO and CC-CV method.
Digital 05 00006 g009
Figure 10. (a) Comparison of current prediction of ACO method for lead acid battery and lithium battery and CC-CV method. (b) Graph of voltage prediction of ACO method for lithium battery. (c) Comparison SOC prediction of ACO method for lead acid battery and lithium battery and CC-CV method.
Digital 05 00006 g010
Figure 11. Linear regression flow diagram and algorithm sequence.
Digital 05 00006 g011
Figure 12. Linear regression results of the test data.
Digital 05 00006 g012
Figure 13. Neural network results of the test data.
Digital 05 00006 g013
Table 1. Five stages of modeling.
StagePossible Current (A)
1151413121110
25432
3321
421
50
Table 2. Stages’ current ranges.
Stage12345
Current (A)105320
Range (A)9.5–10.54.5–5.52.5–3.51.5–2.50–0.5
Table 3. Detecting the selected path.
Path (Line)Distance τ i j n i j ( τ i j ) α ( n i j ) β P i j Selected
15 A210.50.50.459Yes
10 A310.330.330.303Yes
5 A610.160.160.146No
3 A1010.10.10.092No
Note: τi,j = path pheromones, and the initial pheromones are set at 1, ni,j = 1/Distance.
Table 4. Detecting distance.
PathDistanceRemaining PheromonePheromone Added τ i j n i j ( τ i j ) α ( n i j ) β P i j Selected
15 A20.50.510.50.50.646Yes
10 A30.50.330.830.330.2740.354No
Table 5. Battery charging information.
Battery Charging InformationDescription
Initial battery voltage12.98 V
Full battery voltage14.50 V
Initial battery SOC56%
Full battery SOC100%
Total charging time12.73 min
Data retrieval interval1 s
Table 6. Comparison of charging data with ACO algorithm and without ACO algorithm.
No.Voltage (V)Estimation
SoC (%)
Actual SoC (%)Absolute
Error
(Error)2RMSEMAE
1.12.985656.570.570.320.320.27
2.12.995656.850.850.73
3.13.005757.140.140.02
4.13.015757.420.420.18
5.13.025857.710.280.08
151.14.4910099.710.280.08
152.14.50100100.000.000.00
Total:41.0415.79
Table 7. Analysis results table.
CoefficientInterceptRMSEMAE
1.00426298−0.391760980.322380.27002
Disclaimer/Publisher’s Note: The statements, opinions and data contained in all publications are solely those of the individual author(s) and contributor(s) and not of MDPI and/or the editor(s). MDPI and/or the editor(s) disclaim responsibility for any injury to people or property resulting from any ideas, methods, instructions or products referred to in the content.

