Abstract
In the process of collecting evidence of activities and events in network devices, there are problems with content and storage, and we aim to solve the problems faced by network devices in network forensics. In this paper, we propose a simple method for solving the problems with content and storage in acquiring communication logs on end hosts, implement a sniffing tool that captures raw packets with communication event control, compare it with existing tools, and conduct experiments and considerations. Through these experiments and considerations, we confirmed that the proposed communication log acquisition method can be implemented on the end host, and that the problem can be solved by using a tool that implements the proposed method. Also, we confirmed that it can be applied to real-world communication log collection scenarios, and that it can coexist with existing systems and tools that collect communication logs.
1. Introduction
As described in Refs. [1,2], the following is known: Network forensics, similar to other forensic tasks, involves obtaining information, strategizing, collecting and analyzing evidence, and reporting to obtain evidence-based results that can be presented in legal proceedings. At the beginning of an investigation, information must be obtained about the incident itself and the environment. This strategy requires a detailed plan for how to conduct the investigation. The strategies should also detail how evidence will be acquired. The evidence used in network forensics can be obtained from either end or from intermediate devices. In collecting and analyzing the evidence, three vital components must be considered: documentation, capture, and storage or transport. In documentation, all actions, systems, files, and resources must be carefully logged. It is also essential to maintain self-descriptive notes to simplify identification of the collected evidence. The descriptive content should contain the date, time source, investigating officer, and method used to acquire the evidence.
Capturing evidence involves ensuring that data or network traffic packets, as well as logs, are written to a CD or removable hard drive. Network forensics tools such as packet sniffers or traffic analyzers are used to capture and analysis packets [3,4]. Storage/transport implies that the evidence should be stored in a secure place to maintain the chain of custody. It is essential to maintain updated and signed logs containing the details of all parties that have obtained access to the evidence. Care should also be exerted when handling and disposing of evidence to maintain its integrity, reliability, and admissibility before a court of law.
In the process of collecting evidence of activities and events in network devices, there are problems with content and storage. Network devices have limited storage capacity, and may not be able to store content data at the level of granularity required. Network devices do not perform secondary or continuous storage, so resetting the device leaves no data behind. Therefore, if the speed of communication exceeds the processing capacity, log data may be dropped or recorded data may not be able to continue being stored [1]. In our research, we aim to solve these problems faced by network devices in network forensics by providing a communication log acquisition method.
In this paper, we propose a simple method for acquiring communication logs on end hosts that solve problems with content and storage in network forensic evidence acquisition tasks. Moreover, as a practical example of the proposed method, we implement a packet sniffer tool that runs on Windows OS, and describe experiments that compare it with existing tools.
Until now, there have been studies to avoid or improve the situation by speeding up the processing, increasing the efficiency, and improving the performance of equipment in the network devices [5,6]. The proposed method is assumed for acquisition of communication events and packets at the end host, and achieves comprehensiveness of recording and continuity of record storage by controlling the permission/blocking of communication events using a filter driver in the protocol stack, according to the status of primary storage and secondary storage. Also, in order to discuss the usefulness of the research, the impact of the research, and its applications, we implement a packet sniffer tool that realizes the proposed method, and conduct experiments and discussions using it.
Regarding the usefulness of this research, we confirmed that the proposed communication log acquisition method can be implemented on the end host, and that the problem can be solved by using a tool that implements the proposed method. Also, regarding the impact and application of this research, we confirmed that it can be applied to real-world communication log collection scenarios, and that it can coexist with existing systems and tools that collect communication logs.
The problems with the content and storage of network devices are the direct cause of loss of comprehensiveness of records and the continuity of record storage and, as far as the authors know, there is no fundamental solution. If the comprehensiveness of records (which means communication logs are recorded without omission) and the continuity of record storage (which means communication log records are continuously protected from modification or deletion) are lost, it will have a major impact on incident response and legal disputes, as some events can be confirmed and others cannot. The contribution of this research is to provide a method to completely solve these problems and to show that the implemented tool can be replaced with or combined with existing tools.
Section 2 describes the background and problem setting of this research, the motivation for presenting the communication log acquisition method, and future research directions and technological advances that may help overcome the challenges. Section 3 describes the proposal for a communication log acquisition method on end hosts, integration of the proposed method, and the network protocol stack. Section 4 describes interaction between drivers and Win32 applications, WFP and the cooperation between WFP and the protocol stack as technologies used in implementation. Section 5 describes the implementation of a packet sniffer tool, limitations of the implemented packet sniffer tool, and how to handle errors and abnormalities. Section 6 describes the comparison with existing tools, experiments, and their results. Section 7 provides considerations related to the usefulness, impact, and application of this research. Finally, Section 8 summarizes this research, and also mentions future challenges and the limitations of this research.
2. Background and Problem Setting
In the process of collecting evidence of activities and events in network devices, there are problems with content and storage. Network devices have limited storage capacity, and may not be able to store content data at the level of granularity required. Network devices do not perform secondary or continuous storage, so resetting the device leaves no data behind. Therefore, if the speed of communication exceeds the processing capacity, log data may be dropped, or recorded data may not be able to continue being stored [1].
Because a network includes numerous sources that can serve as evidence, several types exist, depending on the source of the evidence. For acquisition of event logs and raw packets from devices at the boundaries of the broadcast and collision domains, the sources are routers, switches, and devices connected to mirror ports. With this type, if the network is a broadcast domain, events and raw packets of communications with hosts outside the network can be captured and recorded. If the network is a collision domain, events and raw packets of communications with hosts within the network can be acquired and recorded. In addition, with this type, the source of evidence can be identified by IP address, port number, etc.
When acquiring evidence (such as capturing and recording communication logs) and preserving evidence (such as calculating hash functions and digital signatures for the logs), a situation may arise where the comprehensiveness of records and continuity of record storage cannot be maintained. Until now, there have been studies to avoid or improve the situation by speeding up the processing, increasing the efficiency, and improving the performance of equipment [5,6].
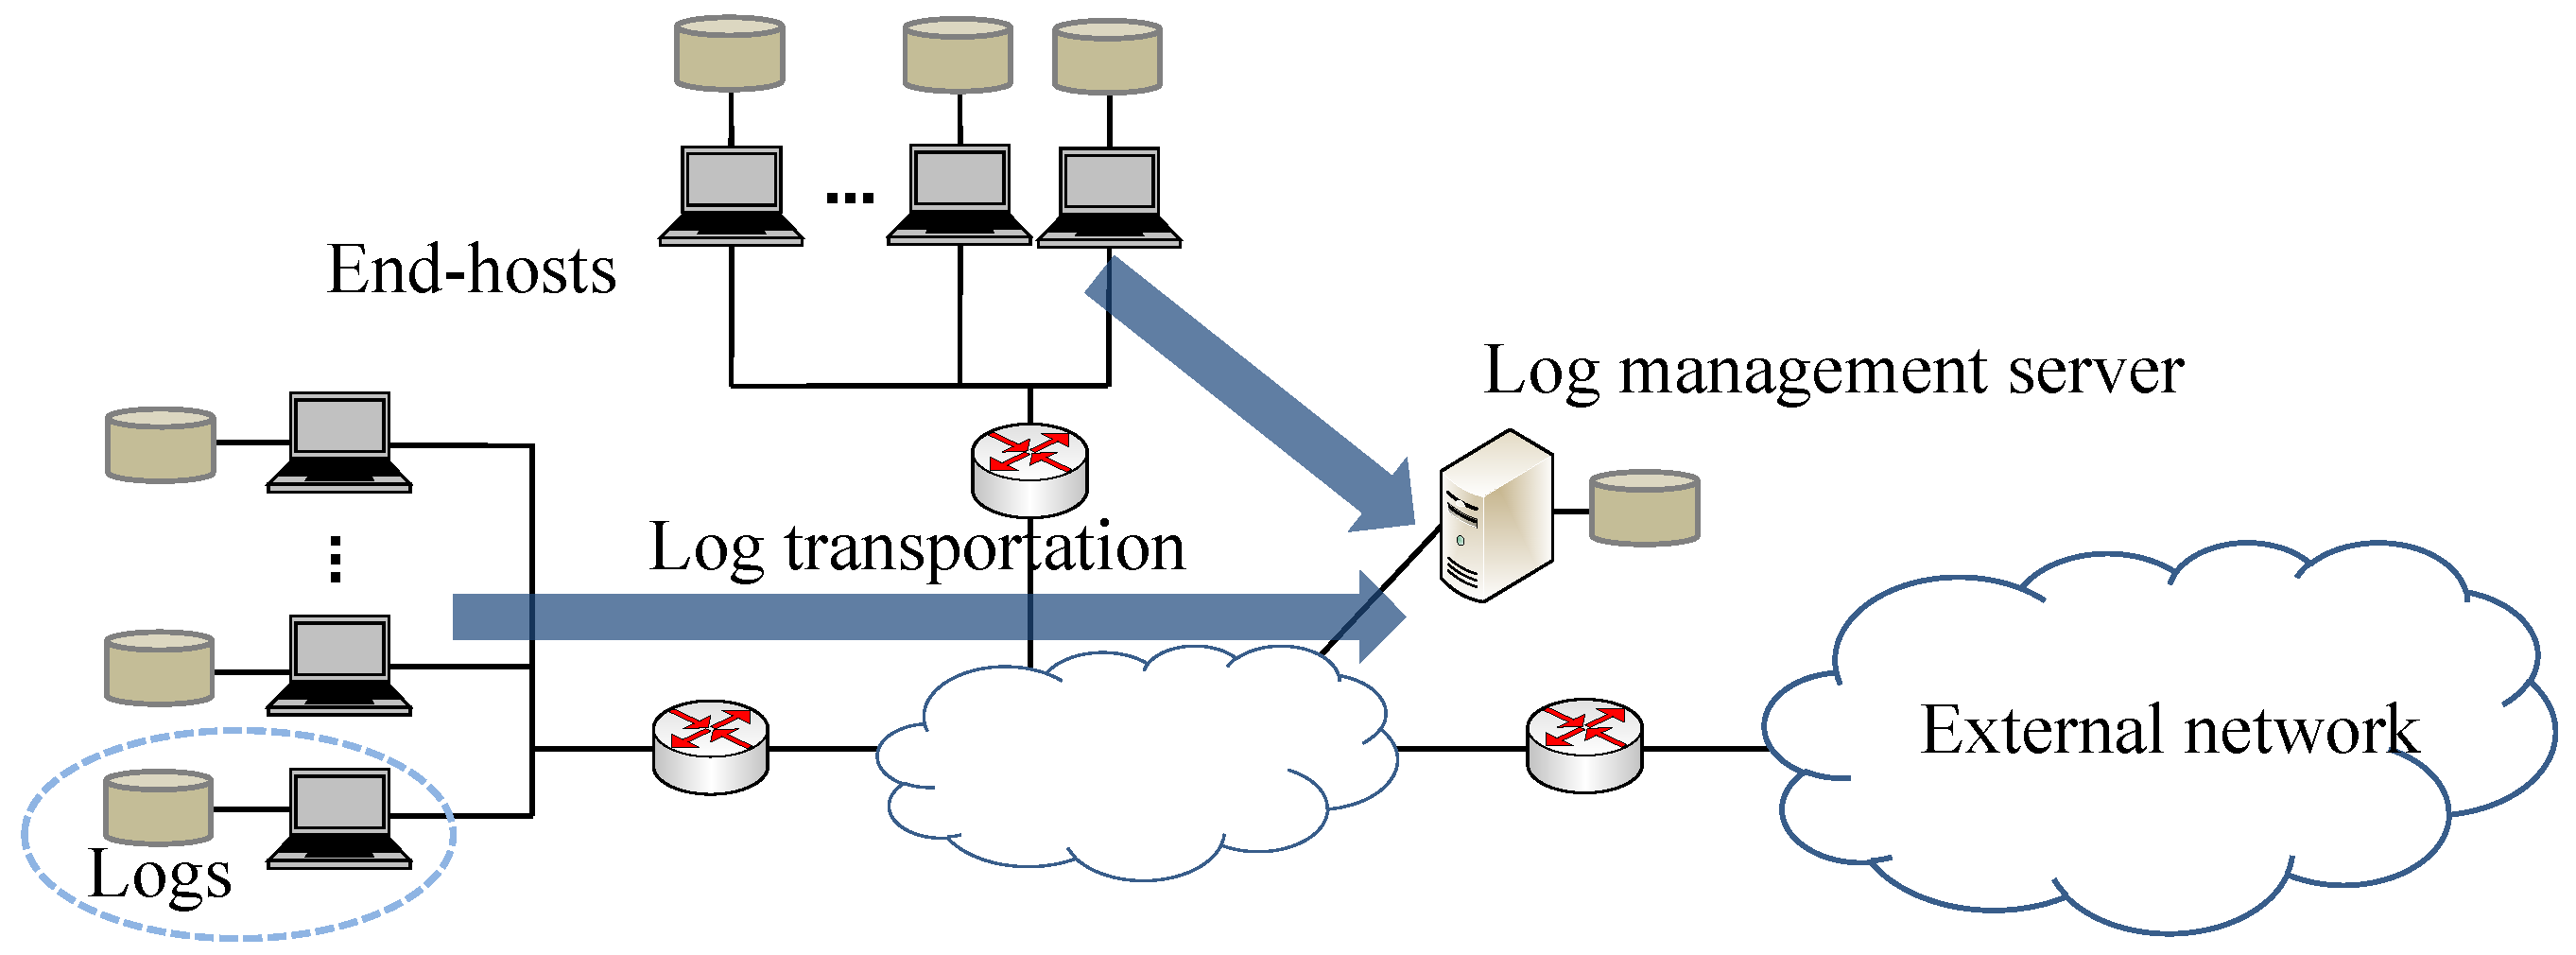
In contrast, for acquisition of communication events and packets in addition to various events at the end host, the source is the end host itself, as shown in Figure 1. With this type, the network device driver obtains host communication events, and communication events and packets are comprehensively acquired without being missed.
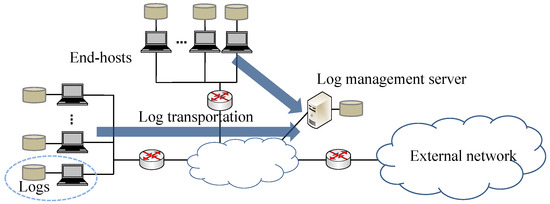
Figure 1.
Communication log acquisition on end hosts.
With this type, the source and location of evidence are clear because the source of events is the host itself, and storage capacity constraints are less stringent than those on network devices, making it easier to store evidence at the lowest level of granularity. Moreover, evidence is acquired and stored at the end host; therefore, it is easy to control the privacy of the host’s users.
To preserve the evidence of communication in a form that facilitates verification of the correctness of its content, it is necessary to preserve the evidence using digital signatures. In addition, to comprehensively record and continuously store evidence, it is necessary to periodically transfer evidence to the log management server and transfer evidence from secondary to tertiary storage on the log management server. In network forensics, these tasks must be performed reliably without failure.
The amount of communication logs generated per unit time on the host is obtained by multiplying the number of communication events per unit time by the log record size per event. If the amount of communication logs generated per unit time exceeds the processing amount per unit time for preserving communication logs (evidences), the primary storage becomes exhausted and no more communication events can be retrieved. Additionally, if the amount of communication evidence generated per unit time exceeds the amount transferred per unit time to the log management server, secondary storage will be exhausted and communication evidence will not continue to be maintained.
Until now, the only measures available have been to prevent communication events and communication data from being missed, and to prevent primary and secondary storage from being depleted as much as possible. In particular, network forensic systems that acquire raw packets have not become popular because tools, equipment, and hosts for acquiring communication logs are expensive, and logs can only be stored for a short period of time. Inbound or outbound communication statistics logs are often collected from devices such as FW, IDS, UTM, and routers at the entrance to an organization’s internal network. Additionally, communication event logs are often acquired along with various logs on server hosts on an organization’s server network. Some organizations with a little more money will install a dedicated host or device at the entrance to the organization’s internal network to capture raw packets. Additionally, an increasing number of organizations are introducing systems that collect communication event logs along with various logs from client hosts on their internal networks.
Logs obtained for forensic purposes are used as an information equivalent to supporting evidence to understand what was happening at the time a trouble or incident occurred. If logs are not obtained and recorded, or if they do not contain detailed information (the granularity of the information is large), they will not be useful in investigation and analysis situations. Obtaining raw packets as a communication log is useful, because it allows you to know when the communication was sent, where it came from, where it was sent, and what information was sent. However, the rapid increase in log data makes it easy for communication events and packets to be missed, and for primary and secondary storage to become depleted, which has hindered its widespread use. If the proposed communication log acquisition method and the implemented tools in this paper become widespread, it will be possible to obtain communication logs containing detailed information. It is thought that it will be possible to clarify matters that were previously unknown in forensic investigation and analysis.
Current research efforts focus on enhancing the capability to capture, preserve, and record logs through faster processing, greater efficiency, and improved equipment performance. By optimizing the types of logs acquired, log size, and retention periods according to device performance, we can maintain a reasonable level of comprehensiveness and continuity in log records. As device processing and storage capabilities improve, we expect these conventional limitations to diminish (performance improvements). Our proposed method for communication log acquisition aims to overcome these challenges independently of equipment performance, marking a new direction in the field.
Digital twin technology, which creates a virtual replica of the real world in a computerized environment, differs from other simulation technologies by reflecting changes in real-time and allowing AI to analyze big data collected by IoT devices to understand subtle phenomena occurring in the physical world. Long Zhang et al. discussed this approach in their support system for industrial IoT scenarios [7], aiming to minimize the total task completion delay across industrial IoT devices. This technology could enhance the performance of log acquisition and recording in IoT environments.
In forensic investigations, logs serve as crucial evidence to reconstruct events. Gaps in log data, or a lack of detail in the logs, can impede investigations. Sergio Saponara et al. explored the use of unsupervised deep learning to enhance the quality of fingerprint images in forensic analysis, which could similarly be applied to predict missing log information using surrounding log data [8].
3. Proposal of a Communication Log Acquisition Method on End Hosts
To prevent the free space in primary and secondary storage for recording events from becoming depleted, it is possible to block processing at the source of the event so that the event does not occur. The requirements for communication log acquisition, which can withstand the depletion of free space in primary and secondary storage and comprehensively record and continuously store evidence, are summarized as follows:
- Requirement 1: The ability to monitor free space during primary and secondary storage.
- Requirement 2: The communication device (source of the event) must be able to intervene during the event.
- Requirement 3: The communication device (source of the event) must be able to control its occurrence.
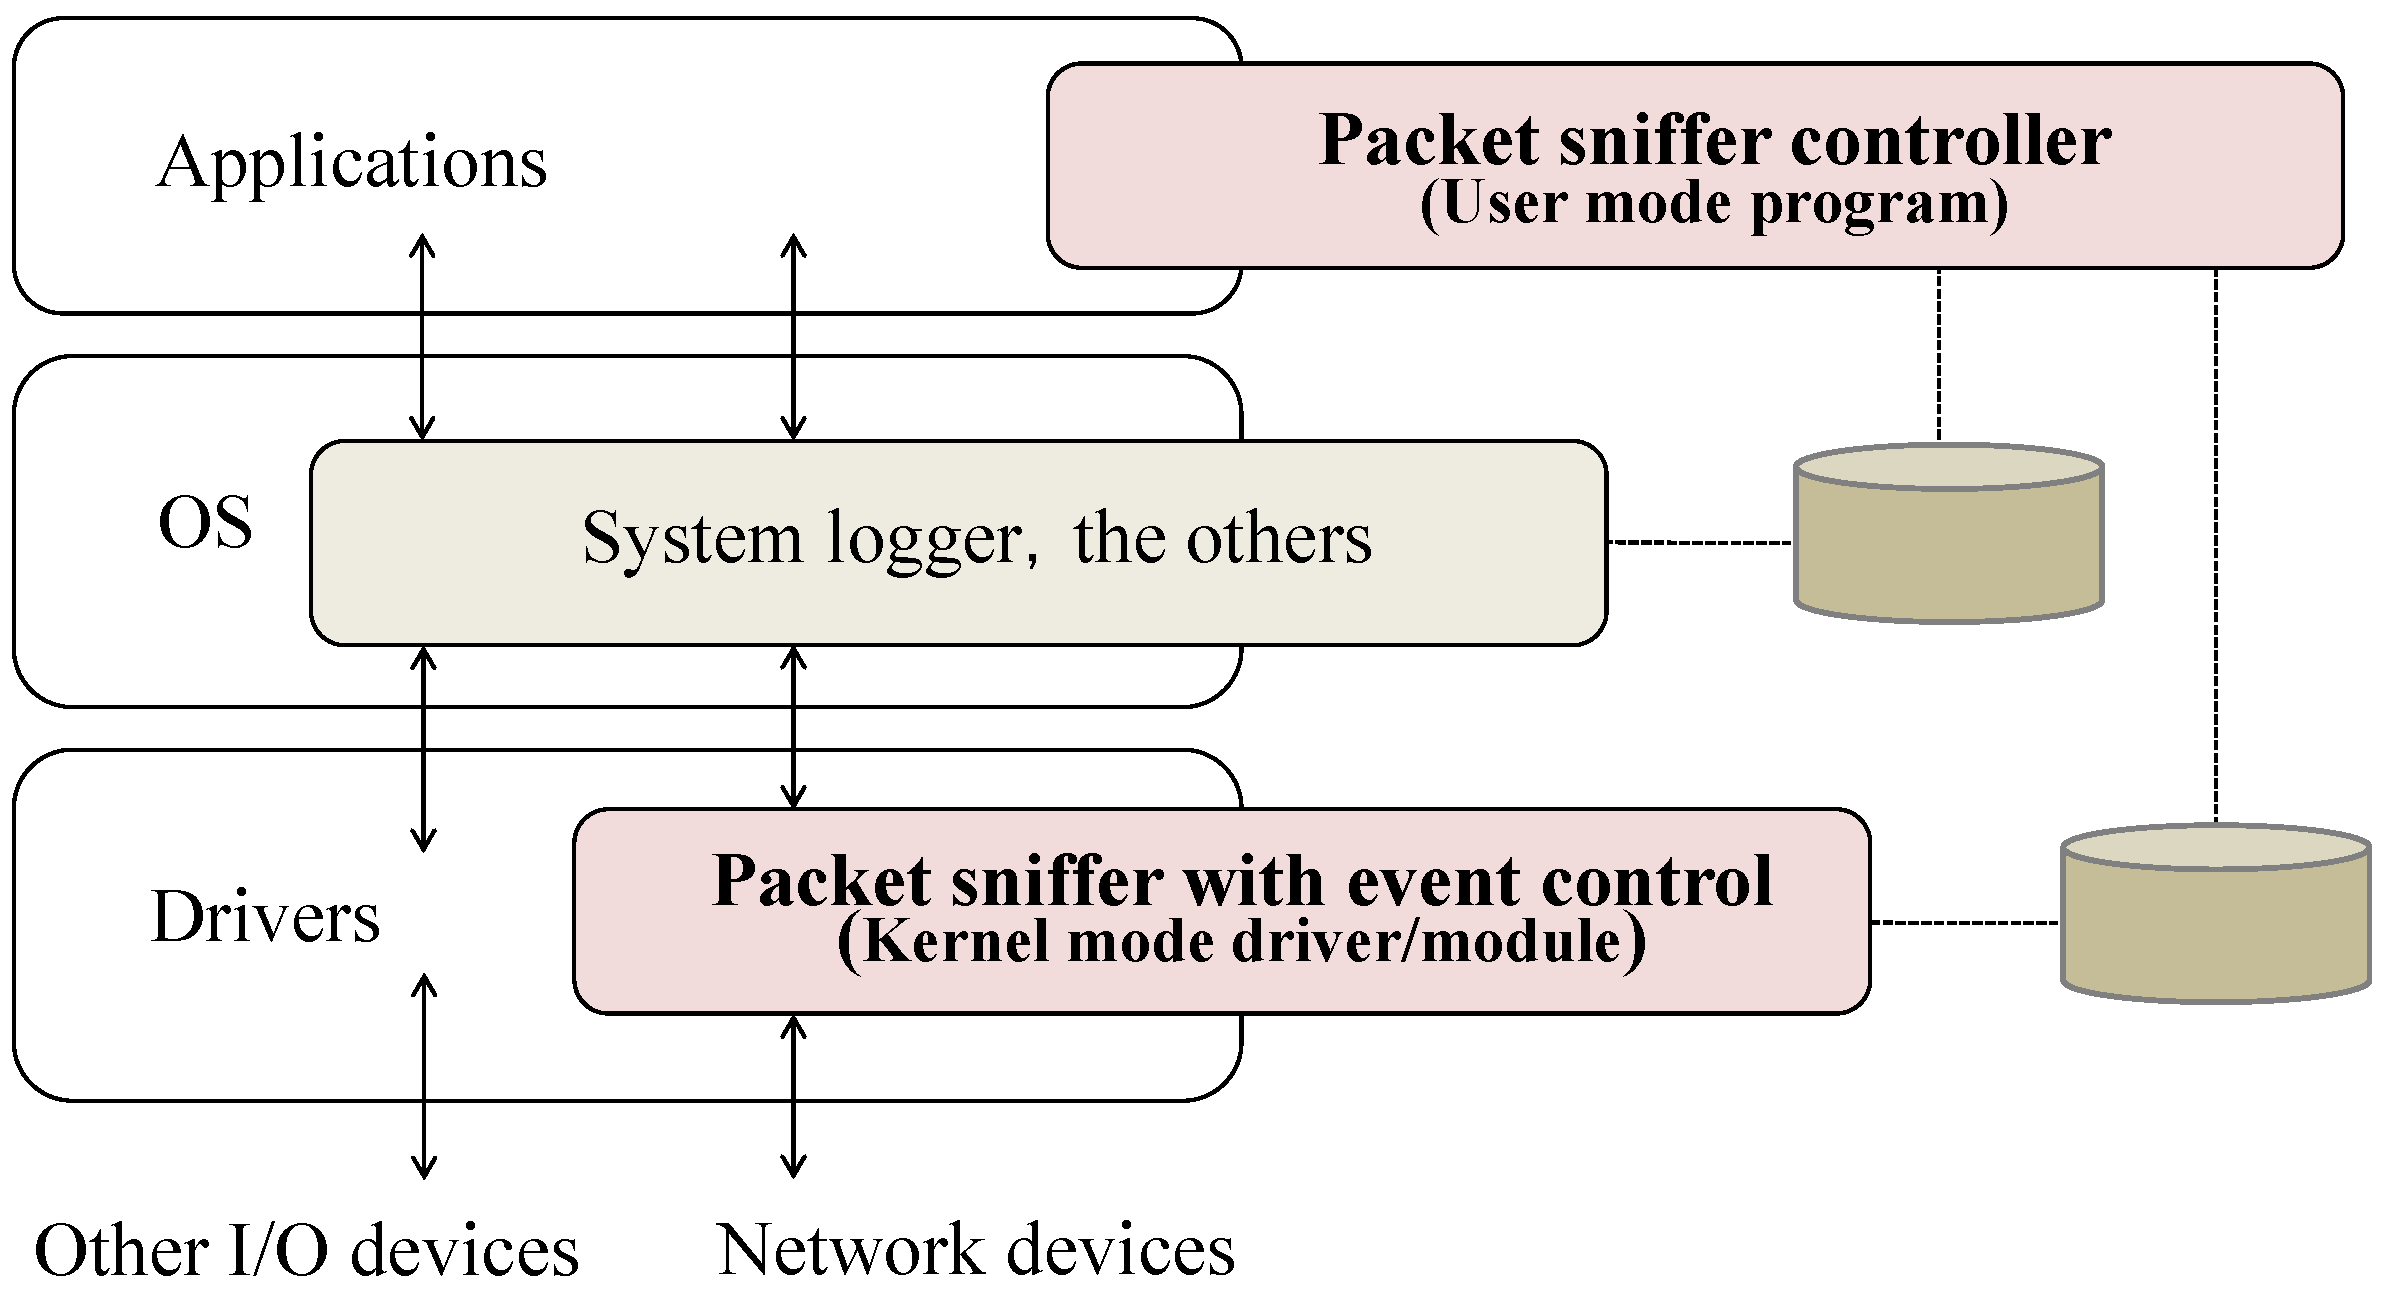
As shown in Figure 2, we propose a communication log acquisition method that captures and records raw packets while controlling the permission/blocking of the output to the upper or lower layers using a filter driver that can be inserted into the protocol stack of a communication device.
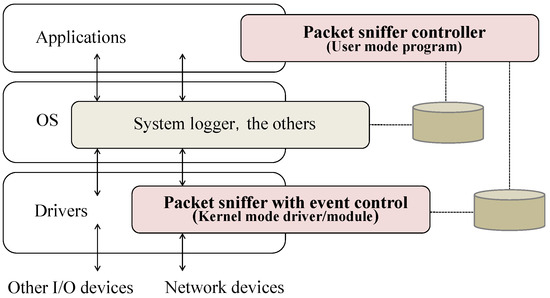
Figure 2.
Proposal of a communication log acquisition method.
The packet sniffer, which controls communication events, performs the following processes as a kernel mode driver in Windows and as a kernel mode module in Linux/Unix.
- As preprocessing, the following processing is executed at host startup and resume.
- There are variables to hold the primary storage free space threshold and secondary storage free space threshold, variables to hold the IP address of the log management server to which communication logs are transferred, and variable to hold maximum log file size. These variables are initialized.
- Load the primary storage free space threshold and secondary storage free space threshold into variables from the configuration file when blocking link layer processing of the OS’s network protocol stack. Read the IP address of the log management server to which communication logs are transferred from the file into a variable. Read the maximum log file size from the file into a variable.
- Register the function that describes the layer to be hooked and the process to be called at that time so that the process of the link layer of the OS network protocol stack is hooked and the callout function is called.
- Prepare a variable-length queue to temporarily hold log records containing communication data and its attribute data in memory. It allows synchronous access from functions that process callouts and functions that process add log records to log files. Run the function that adds log records to the log file as a separate thread.
- When an inbound frame/outbound frame arrives at the link layer, the following callout processing is executed before processing at the link layer.
- Extract the inbound/outbound direction, protocol, and source/destination addresses from the data that will be passed to the link layer. If the source/destination address matches the address of the log management server, the execution of the link layer process is permitted (specify the permission return value) and the process is returned.
- If the communication event control mode is “Always Block” or if the primary storage free space and secondary storage free space variables remain at their initial values, the execution of the link layer process is blocked (specify the block return value) and the process is returned.
- If the communication event control mode is “control based on storage free space”, compare whether the variable value that holds the free space in the primary storage and the free space in the secondary storage is less than the threshold value. If either of them is less than the threshold, block (specify the return value of the block) so that the link layer processing is not executed, and return the processing.
- If the control mode of the communication event is “Always Permit”, the LLC layer process does nothing, assuming that default permission is specified as the return value.
- Reserve an area for log records that store communication data and its attribute data in the non-paged pool for the kernel. Acquire the time as a timestamp and copy it to the log record along with the communication data (frame data). Push log records to the variable-length queue provided during setup.
- As part of the process of adding log records to the log file, if the variable-length queue prepared during setup contains one or more log records, the following process is repeatedly executed.
- If the log file does not exist, create a new one.
- If the operation mode is “mode that performs both communication event control and logging”, pop the log record at the head of the variable-length queue. Then, the timestamp, communication data (frame data), and attribute data stored in the log record are added to the end of the log file.
- If the size of the log file to which the log is added exceeds the maximum log file size, create a new log file with a different name. Then, set the log destination to this log file.
- As a process of cooperation with the packet sniffer controller, the operation mode, control mode, free space of primary storage, and free space of secondary storage sent from the packet sniffer controller are stored in each variable.
- As termination processing, the following processing is executed when the host is stopped or goes to sleep.
- A function that adds log records to the log file, extracts the log records contained in the variable-length queue, and releases the log record memory area. Then, stop this thread.
- Delete the registered function that describes the process to be called when hooking.
The packet sniffer controller performs the following processes as a user mode program in both Windows and Linux/Unix.
- The packet sniffer controller is assumed to be executed on the command line as a process of cooperation with the packet sniffer. It accepts operation mode and control mode as command line arguments. Obtain the free space in primary storage and free space in secondary storage using the API provided by the OS. The specified operation mode and control mode, and the obtained free space in primary storage and free space in secondary storage are sent to the packet sniffer using IOCTL.
When the free space in the primary or secondary storage is exhausted, the filter driver of the protocol stack blocks communication events; thus, even if communication occurs, the event will not be captured or recorded. When the free space in the primary or secondary storage is secured again, the filter driver of the protocol stack allows the communication event, and the communication, acquisition, and recording of the event continue without interruption.
In forensic investigation and analysis, various logs are collected and correlated in chronological order in order to clarify what happened at the time. At the host, communication events can be reliably acquired, in addition to host user’s operation events and system (OS) and application events, making it easy to correlate multiple pieces of evidence.
By adopting the proposed method, the host user can encrypt the logs with a key known only to the host user, without passing the logs to a third party. Additionally, logs can be anonymized so that the host user cannot be identified. Events obtained by the host may include user privacy information. Disclosure/nondisclosure and anonymization of this information can be performed under the user’s control.
Among the fundamental phases of the digital forensic process—collection, examination, analysis, and reporting—the collection and examination phases require safeguarding of the integrity of evidence data [2]. An example of technology used to ensure the integrity of logs at the end host is implementing signature technology with a security chip like TPM. Discussions on the confidentiality of logs relate to protecting the privacy of end-host users, while those on availability pertain to the robustness of forensic systems. However, these topics diverge from the primary focus of this paper, which centers on specific issues and methodologies. Therefore, we have excluded these broader security discussions from our scope.
4. Technologies Used in Implementation
Windows Filtering Platform (WFP) is a set of API and system services that provide a platform for creating network filtering applications. The WFP API allows developers to write code that interacts with the packet processing that takes place at several layers in the networking stack of the operating system. WFP consists of a set of hooks into the network stack and a filtering engine that coordinates network stack interactions [9].
- Filter engine: The core multi-layer filtering infrastructure, hosted in both kernel-mode and user-mode, that replaces the multiple filtering modules in the Windows XP and Windows Server 2003 networking subsystem. It filters network traffic at any layer in the system over any data fields that a shim can provide. It implements the “Callout” filters by invoking callouts during classification. It returns “Permit” or “Block” actions to the shim that invoked it for enforcement. It provides arbitration between different policy sources.
- Shims: Kernel-mode components that reside between the Network Stack and the filter engine. Shims make the filtering decision by classifying against the filter engine. The following is a list of available shims.
- –
- Application Layer Enforcement (ALE) shim.
- –
- Transport Layer Module shim.
- –
- Network Layer Module shim.
- –
- Internet Control Message Protocol (ICMP) Error shim.
- –
- Discard shim.
- –
- Stream shim.
- Callouts: The set of functions exposed by a driver and used for specialized filtering. Besides the basic actions of “Permit” and “Block”, callouts can modify and secure inbound and outbound network traffic.
- API: A set of data types and functions available to the developers to build and manage network filtering applications. These data types and functions are grouped into multiple API sets.
- New functions: Windows 8 and Windows Server 2012 introduce new Windows Filtering Platform programming elements. New functionality includes the following:
- –
- Layer 2 filtering: Provides access to the L2 (MAC) layer, allowing filtering of traffic at that layer.
- –
- vSwitch filtering: Allows packets traversing a vSwitch to be inspected and/or modified. WFP filters or callouts can be used at the vSwitch ingress and egress.
- –
- App container management: allows access to information about app containers and network isolation connectivity issues.
- –
- IPsec updates: extended IPsec functionality including connection state monitoring, certificate selection, and key management.
I/O control codes (IOCTLs) are used for communication between user-mode applications and drivers, or for communication internally among drivers in a stack. I/O control codes are sent using IRPs. A user-mode application uses the function CreateFile() to obtain the device handle of the target device, and calls the function DeviceIoControl(), specifying a predefined control code and output buffer. When DeviceIoControl() is called, the I/O manager creates IRP_MJ_DEVICE_CONTROL request and sends it to the top-level driver [10].
- Defining I/O control codes: An I/O control code is a 32-bit value that consists of several fields. Use the system-supplied CTL_CODE macro, which is defined in Wdm.h and Ntddk.h, to define new I/O control codes. The definition of a new IOCTL code, whether intended for use with IRP_MJ_DEVICE_CONTROL requests.
- Buffer descriptions for I/O control codes: Because DeviceIoControl() accepts both an input buffer and an output buffer as arguments, all IRP_MJ_DEVICE_CONTROL requests supply both an input buffer and an output buffer. If you want to pass arbitrary data to the driver, set it in the output buffer.
A dispatch routine handles one or more types of IRPs [11]. (The type of an IRP is determined by its major function code.)
- Writing IRP dispatch routines: The driver’s function DriverEntry() registers dispatch routine entry points by storing them in the dispatch table of the driver object. When an IRP is sent to the driver, the I/O subsystem calls the appropriate dispatch routine based on the major function code of IRP. To obtain a pointer to the driver’s I/O stack location, call the function IoGetCurrentIrpStackLocation() in its dispatch routine. The control code sent to the device and output buffer can be retrieved from the obtained pointer.
5. Implementation of a Packet Sniffer Tool
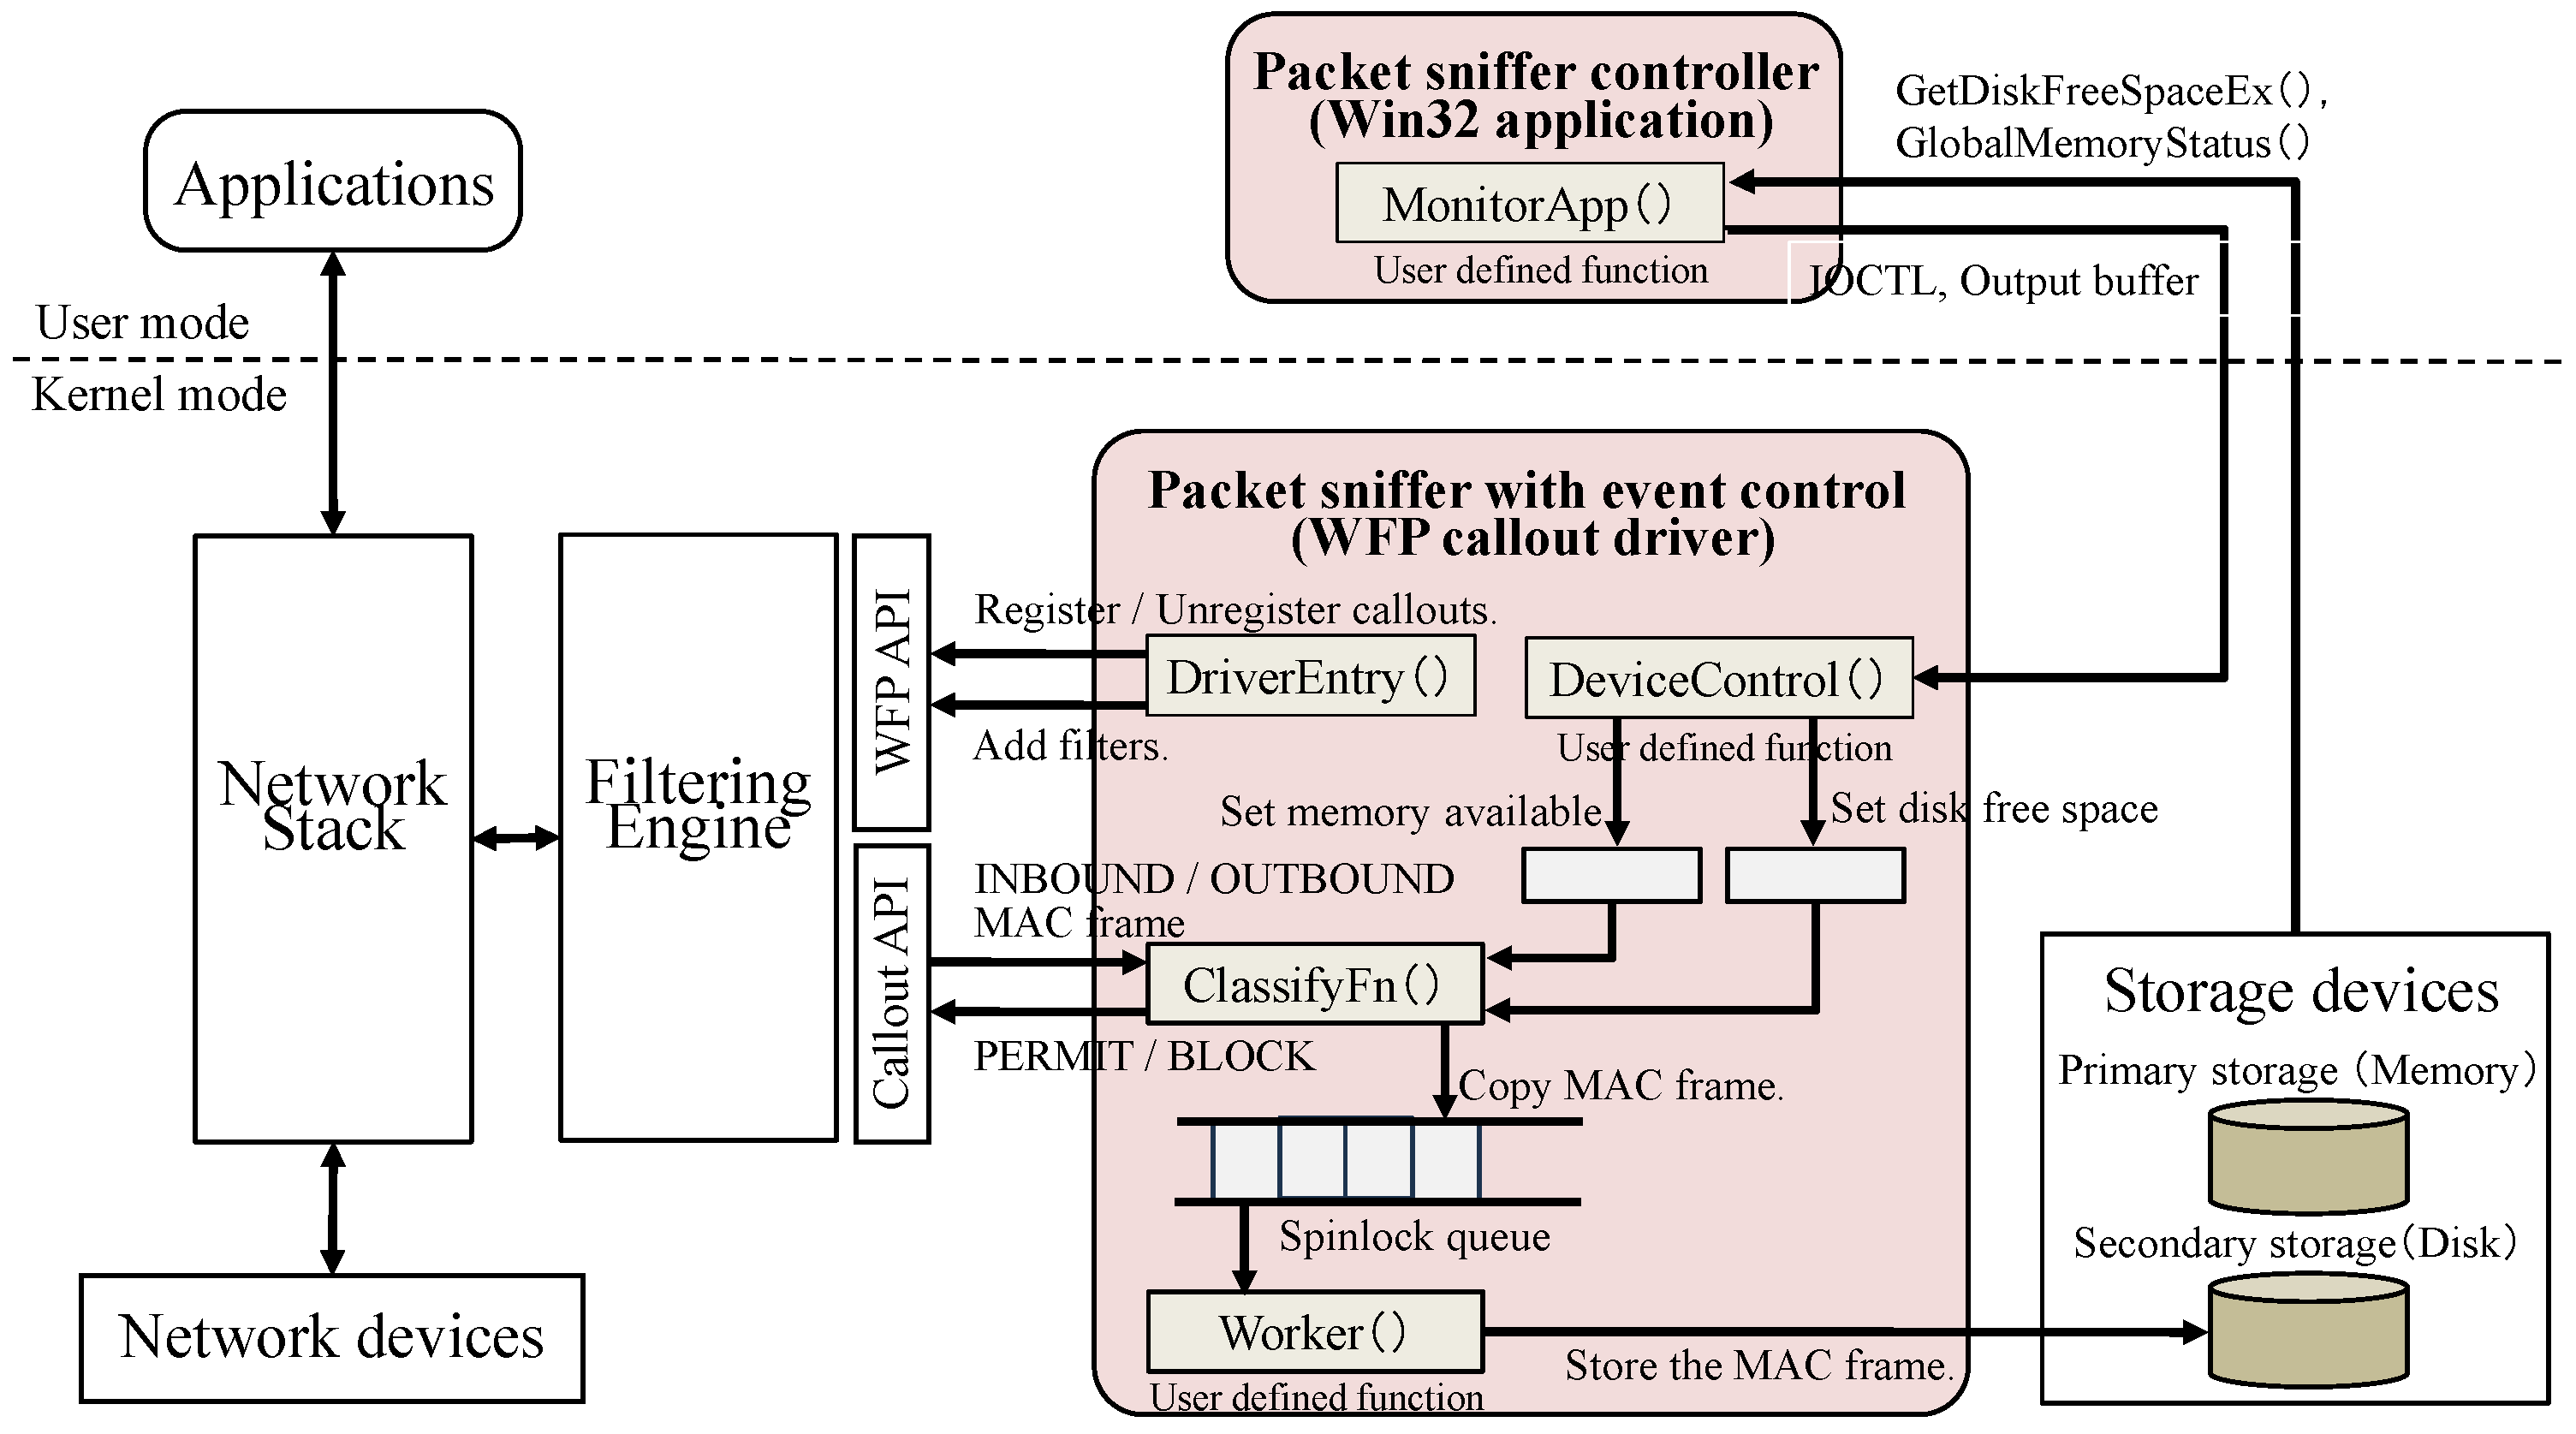
The packet sniffer tool based on the proposed method that runs on a Windows host is implemented as a KMDF-based callout driver of the WFP [9] and a user-mode Win32 Application program that works with the callout driver, as shown in Figure 3. I/O control code (IOCTL) [10,11] is used to link the WFP callout driver and Win32 application. When running an application, tool users can specify operating and control modes using command line arguments. The application acquires the free space in the primary storage and the free space in the secondary storage, and notifies the driver along with information on the operation mode and control mode.
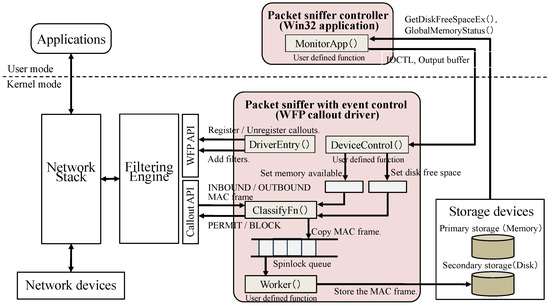
Figure 3.
Implementation of a packet sniffer tool using WFP.
The following process is written in the callout driver program (packet sniffer with event control):
Kernel mode device drivers have DriverEntry() as the function called after the driver is loaded, and DriverUnload() as the callback function set in DriverObject that is called when unloading.
- The function DriverEntry() performs packet sniffer preprocessing. Initialize the variables for holding the free capacity of the primary storage and the free capacity of the secondary storage, and variables for holding the operation mode and control mode of the packet sniffer.
- There are variables to hold the primary storage free space threshold and secondary storage free space threshold, variables to hold the IP address of the log management server to which communication logs are transferred, and variable to hold maximum log file size. These variables are set value by reading from the registry file.
- Using the functions FwpmEngineOpen0(), FwpmTransactionBegin0(), FwpmSubLayerAdd0(), FwpsCalloutRegister0(), RwpmCalloutRegister0(), and FwpmFilterAdd0(), add a sublayer to the WFP filtering engine and register callout functions ClassifyFn(), NotifyFn(), and FlowDeleteFn() for the inbound and outbound communication of the LLC Layer (FWPM_LAYER_INBOUND_MAC_FRAME _NATIVE, FWPM_LAYER_OUTBOUND_MAC_FRAME_ETHERNET).
- Using the functions InitializeListHead(), KeInitializeSpinLock(), and KeInitializeEvent(), prepare a variable-length queue used to temporarily hold logs. Also, using the functions PsCreateSystemThread() and ObReferenceObjectByHandle(), execute the user-defined function Worker() that processes the variable-length queue as a thread and obtains a reference handle for this function.
- A driver object is created using the functions IoCreateDevice() and IoCreateSymbolicLink() so that it can be linked with the user-defined function MonitorApp() in the user mode application, and the user defined function DeviceControl() that receives dispatch requests is registered.
If the driver is unloaded while executing the above, use the functions FwpmEngineClose0() and FwpsCalloutUnregisterById0() to unregister the function that describes the process called by the hook. Also, use the functions IoDeleteSymbolicLink() and IoDeleteDevice() to delete the device object for IOCTL processing and the symbolic link. - The callout function ClassifyFn() performs the packet sniffer callout processing. Communication data and attribute data passed to the layer to be hooked are passed as arguments to the ClassifyFn() function. Also, control to allow/block processing in this hierarchy is achieved by rewriting the members of the structure passed as the return value argument of the ClassifyFn() function.
- Extract the source/destination IP addresses from the communication data, and if either matches the IP address of the log management server, set the communication event permission (FWP_ACTION_PERMIT) in the structure member and return the process. When blocking a communication event based on the control mode, set the block (FWP_ACTION_BLOCK) as a member of the structure and return the process. If communication events are permitted, perform the following processing.
- Use the ExAllocatePool2() function to dynamically allocate the log record area for storing communication data and its attribute data in the non-paged pool for the kernel.
- Obtain the local time as a timestamp using the KeQuerySystemTime() function. And using the functions NdisGetDataBuffer(), NdisRetreatNetBufferDataStart(), NdisAdvanceNetBufferDataStart(). Extract frame data from the communication data that has arrived at the layer.
- Copy the timestamp, communication data (frame data), and its attribute data to a log record and push it to a variable-length queue (spinlock queue) using the functions KeAcquireInStackQueuedSpinLock(), KeSetEvent(), and KeReleaseInStackQueuedSpinLock().
- The user-defined function Worker() is responsible for adding log records to the packet sniffer’s log file. If the log file does not exist, use the functions InitializeObjectAttributes() and ZwCreateFile() to create a new log file, and use this as the log recording destination. Repeat steps 1 to 3 until the driver is unloaded.
- Use the function KeWaitForSingleObject() to wait for an event to add a log record to the variable-length queue. When an event occurs, retrieve log records from the variable length queue using the functions KeAcquireInStackQueuedSpinLock(), KeRemoveHeadList(), and KeReleaseInStackQueuedSpinLock().
- If the operation mode is “mode that performs both communication event control and logging”, use the function ZwWriteFile() to add the timestamp and frame data stored in the log record to the end of the log file. Free the log record memory area using the function ExFreePoolWithTag().
- Count the data size written to the log file. If the exported data size exceeds the variable value that holds the maximum log file size, create a new log file with a different name using the functions InitializeObjectAttributes() and ZwCreateFile(). Then, set it as the destination for writing the next log record.
When the driver is unloaded, use the functions KeAcquireInStackQueuedSpinLock(), RemoveHeadList(), ExFreePoolWithTag(), and KeReleaseInStackQueuedSpinLock() to retrieve the log records contained in the variable-length queue and free the log record memory area. Terminate the thread using the function PsTerminateSystemThread(). - The user-defined function DeviceControl() executes the process of linking the packet sniffer with the packet sniffer controller. Use the function IoGetCurrentIrpStackLocation() to retrieve the IOCTL and output buffer, and set the operating mode and control mode sent from the packet sniffer controller, free space in primary storage, and free space in secondary storage in the respective variables.
- The function DriverUnload() executes the packet sniffer termination process. Use the functions FwpmEngineClose0() and FwpsCalloutUnregisterById0() to unregister the function that describes the process called at hook time, and use the functions IoDeleteSymbolicLink() and IoDeleteDevice() to delete the device object for IOCTL processing and the symbolic link.
Thefollowing process is written in the user-mode application program (packet sniffer controller):
- The user-defined function MonitorApp() executes the processing of cooperation with the packet sniffer. The free space in primary storage and the free space in secondary storage are obtained by using the functions GetDiskFreeSpaceEx() and GlobalMemoryStatus(). The operation mode and control mode specified as command line arguments, and the acquired free space in primary storage and free space in secondary storage are stored in a output buffer. The IOCTL and the output buffer are sent to the packet sniffer (kernel mode device driver) via the IO manager using the functions CreateFileW(), DeviceIoControl().
If you run the packet sniffer controller with a command line argument that enables logging and run the implemented tool, or if you run the packet sniffer controller with a command line argument that disables logging, and runs the implemented tool and existing packet sniffer tool, it is possible to capture packets with event control.
The implemented tool is intended to operate on Windows 8 or later, and uses WFP to control MAC frame input/output events and acquire MAC frames in the callout function for the LLC layer (NDIS layer) in the link layer. In Linux OS, a similar mechanism as above could be implemented as a kernel module that works with Netfilter [12]. The Netfilter is a framework provided by the Linux kernel that allows various networking-related operations to be implemented in the form of customized handlers. The Netfilter represents a set of hooks inside the Linux kernel, allowing specific kernel modules to register callback functions with the networking stack of the kernel. In Unix OS, such as OpenBSD, a mechanism similar to the one described above can be implemented as a kernel module that works with Packet Filter [13]. The Packet Filter (PF, also written as pf) is a BSD licensed stateful packet filter, a central piece of software for firewalling. It is comparable to the netfilter (iptables), ipfw, and ipfilter.
The WFP callout driver is implemented based on KMDF and is required to operate without problems as a driver. We use KMDF driver verification tool, Verifier.exe [14], to test and confirm whether the driver responds without crashing, hanging, or failing to unload when memory is low. KMDF is one of the frameworks included in Windows Driver Frameworks (WDF), and it is developed by MS Corporation for developing device drivers of Windows. It is a driver framework to support driver developers who create and maintain device drivers for Windows 2000 and later operating systems. WFP is a platform provided since Windows Server 2008 and Windows Vista to intervene in network protocol stack processing instead of firewall hooks and filter hook drivers (filter drivers). The WFP callout driver is implemented based on KMDF due to OS compatibility.
The implemented tool hooks and intervenes in the processing of the NDIS layer (LLC layer in the link layer) of the network protocol stack, acquires and records communication logs (raw packets), and controls communication events. When intervening in the processing of the NDIS layer, new inbound and outbound data arriving at that layer is buffered in kernel memory. If callout processing involves processing that requires a large amount of calculation, the processing of the hierarchy will stall, the buffer will overflow, and subsequent data will be discarded. The time required for callout processing depends on the performance of the hardware and software of the host. Therefore, when running the implemented tool, the inbound and outbound communication speeds of the host can be said to be limited by the performance of the hardware and software of the host.
A fixed amount of memory repeatedly is allocated and released in device driver. If the repetition rate is too fast, the memory release cannot keep up and the free memory space runs out, causing the driver to crash, hang, or fail to unload. In the implemented tool, if the number of frame reception/transmission events per unit time exceeds a certain number (a small value is set with a large safety margin), frame processing in the NDIS layer is blocked as an exception handling.
6. Comparison with Existing Tools
For the type that acquires and records communication event logs at the network boundary, for example, NetFlow [15] and Syslog [16] are used to acquire and record logs of communication events and their statistics, and periodically transfer them to a log server. NetFlow is a protocol developed by Cisco for collecting traffic information. It is installed in network devices such as routers and switches, and generates flow data such as source IP address, destination IP address, TCP/UDP port source number, TCP/UDP port destination number, and L3 protocol. Syslog is a protocol for transporting log messages over a network. It is used to transfer and collect logs acquired and recorded by server devices and network devices to a log server (Syslog server) via an IP network. By combining NetFlow and Syslog, flow data acquired and recorded by network devices can be transferred to a log server. However, if the log generation speed of network equipment exceeds the log transfer speed, it becomes impossible to maintain comprehensiveness of records and continuity of record storage.
For types that acquire and record logs of raw packets and communication events on the end host, some well-known tools that can capture packets on a host include Wireshark/Tshark [17] and TCPDUMP [18]. These use libraries called WinPcap on Windows and libpcap on Unix to obtain MAC frames at the LLC layer (NDIS layer) in the link layer. In contrast, the packet sniffer based on the proposed method is assumed to run on a host with Windows 8 or later, and uses WFP to control MAC frame input/output events and to acquire MAC frames, in the LLC layer (NDIS layer). There is no significant difference from existing tools when it comes to retrieving the MAC frames. The difference among Wireshark/Tshark, TCPDUMP, and the implemented tools lies in whether they have a mechanism to control the establishment of an event.
Using PC1 (Windows 10 Pro, 64-bit Test mode, Memory: 8 GB, CPU: Intel(R) Core i7-10750H 2.60 GHz, SSD: 128 GB) and PC2 (Windows 7 Pro, 32-bit, Memory: 4 GB, CPU: Intel(R) Core i7-5557U 3.10 GHz, SSD: 128 GB), we record the disk free space (disk free space on C drive), memory free space (memory available), and transmission/reception amount, while using iperf [19] to generate the test traffic. PC1 and PC2 are connected using a 1 GBps bandwidth hub and an Ethernet full-duplex cable, and each PC keeps its OS up to date and runs only the programs used in the experiment. The disk free space and memory free space were obtained using a Win32 application we created ourselves in which called GetDiskFreeSpaceEx() and GlobalMemoryStatus(), respectively, at 1 s intervals. The transmission/reception amount was obtained from the iperf measurement result output. In PC1, we executed the Tshark, implemented tool, iperf in server mode, and Testlimit [20] to consume a certain amount of physical memory. In PC2, we executed iperf in client mode. The Tshark and implemented tool are configured to create a new log file and record the data there if the size of the log file exceeds 2 GB. The implemented tool is configured to block communication at the NDIS layer (LLC layer in link layer) when the disk free space becomes less than 1 GB or the memory free space becomes less than 900 MB.
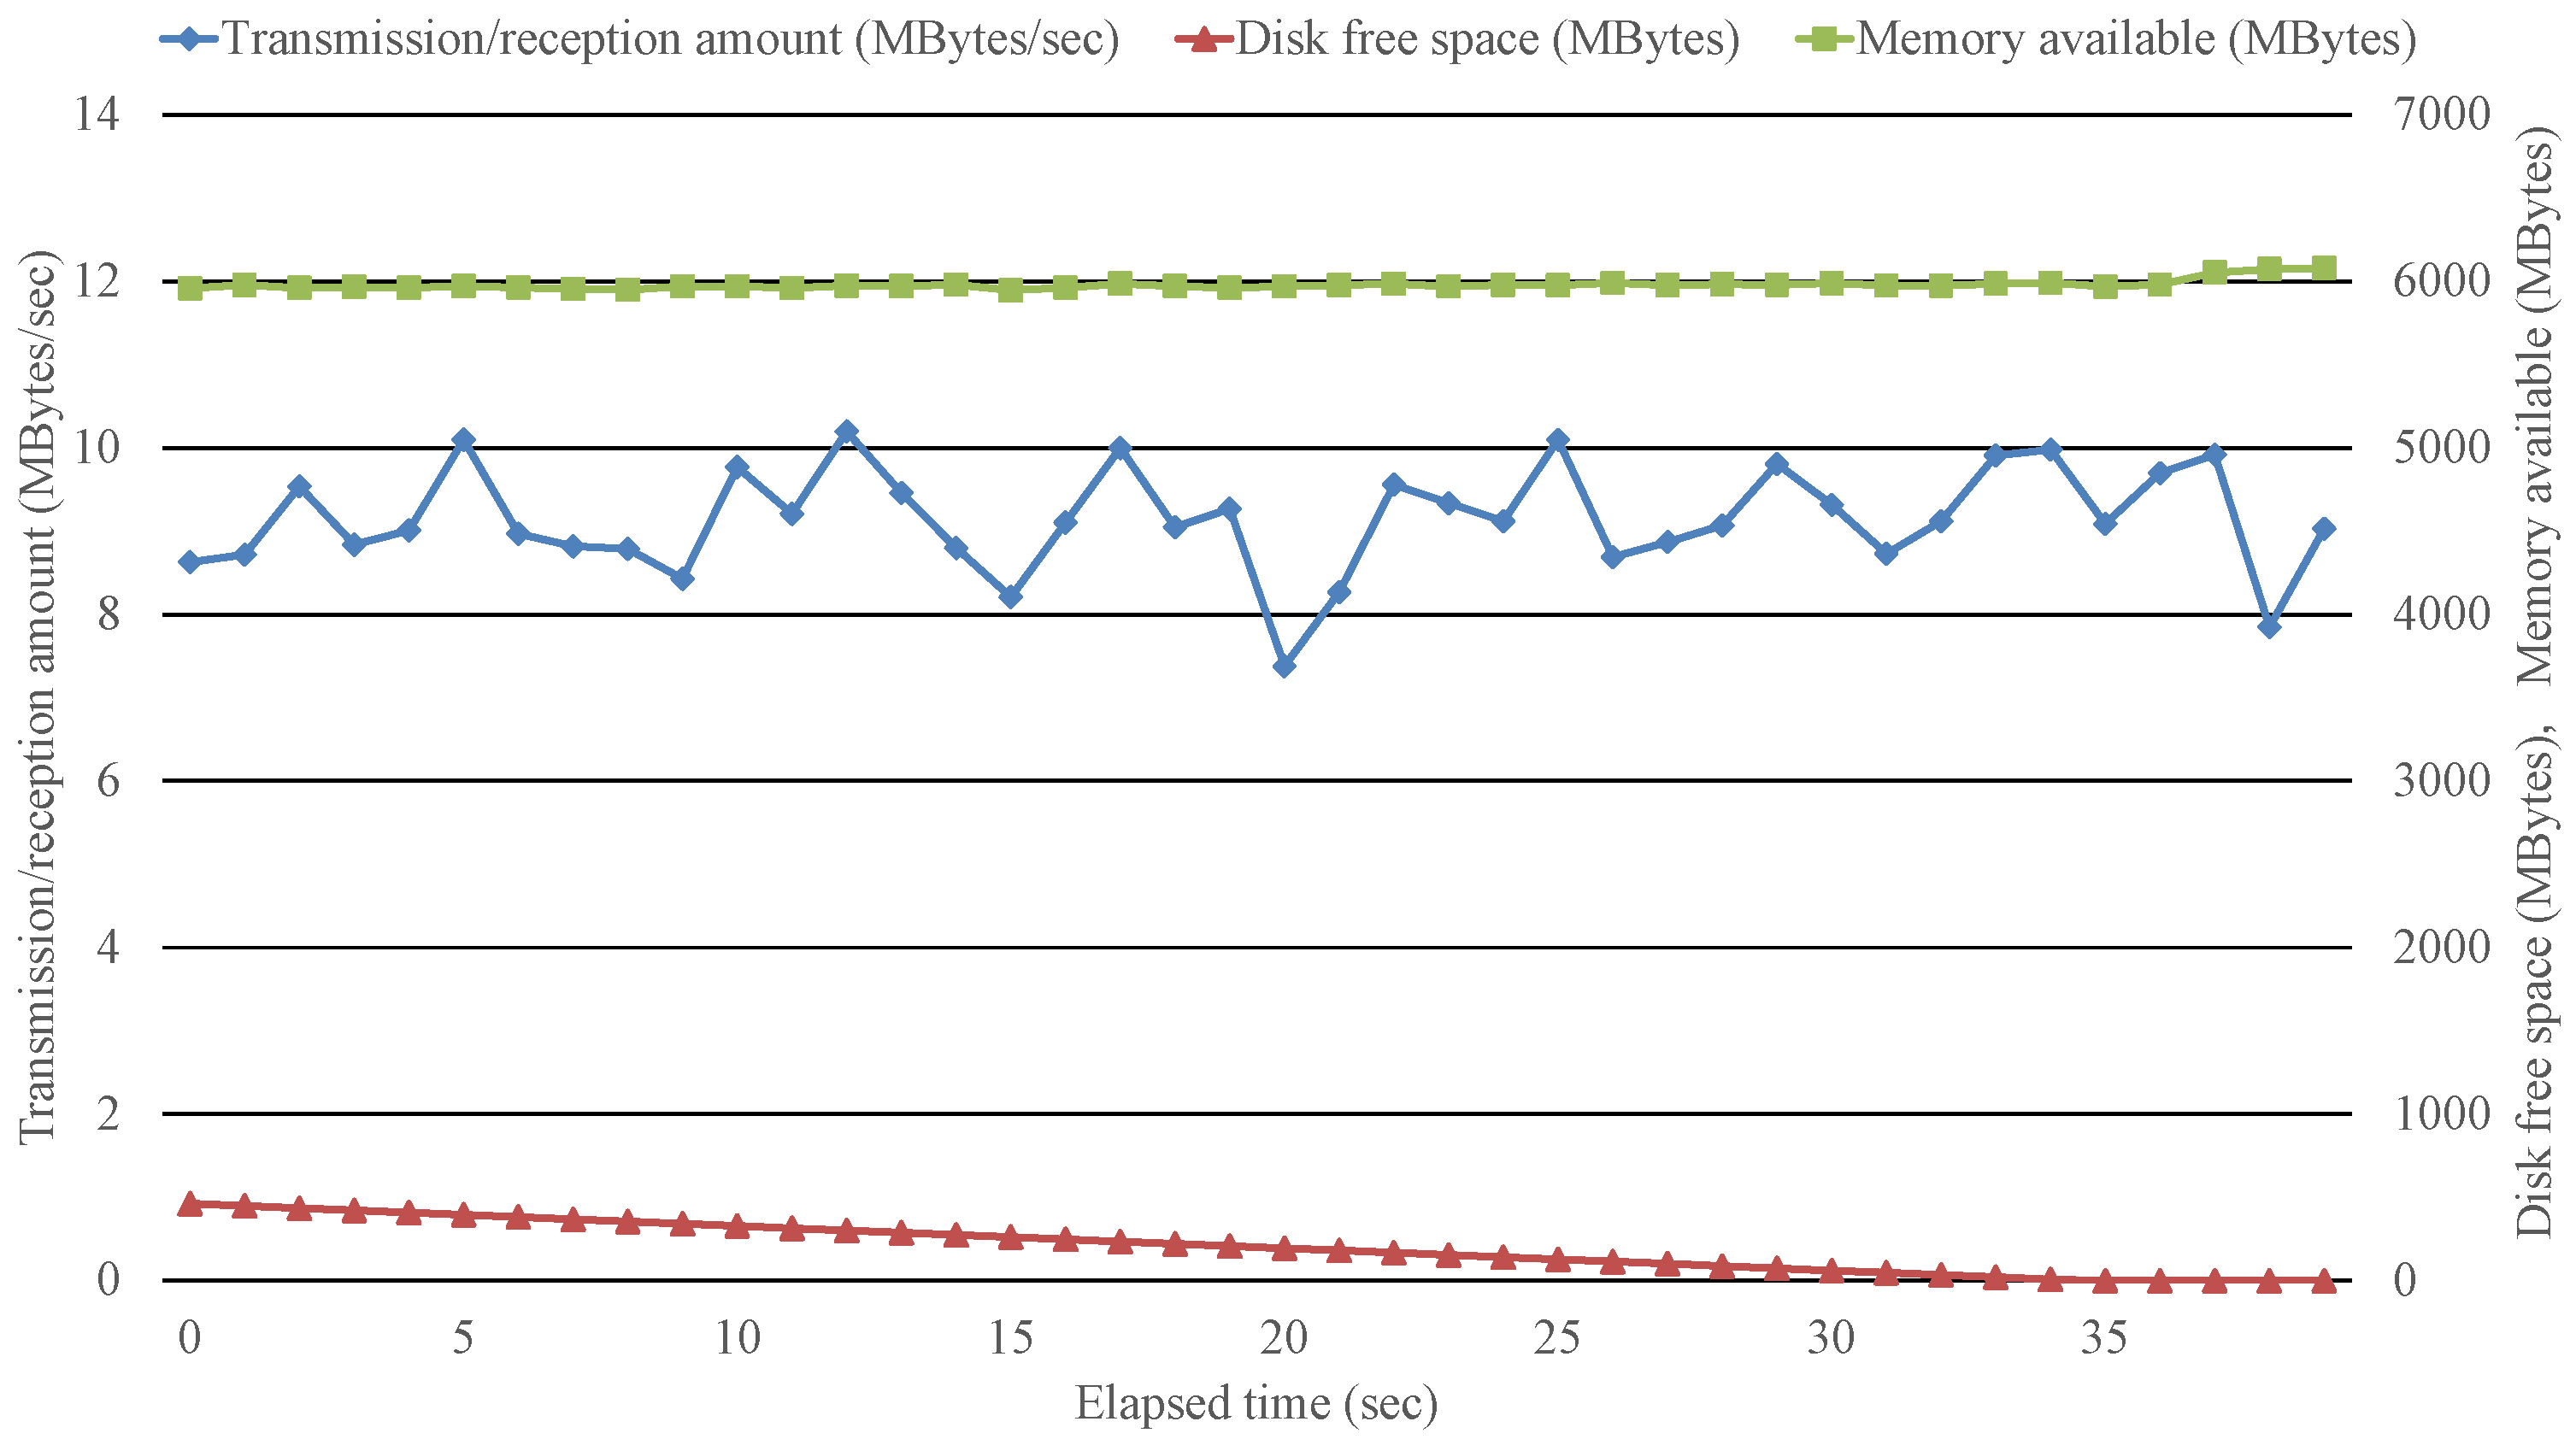
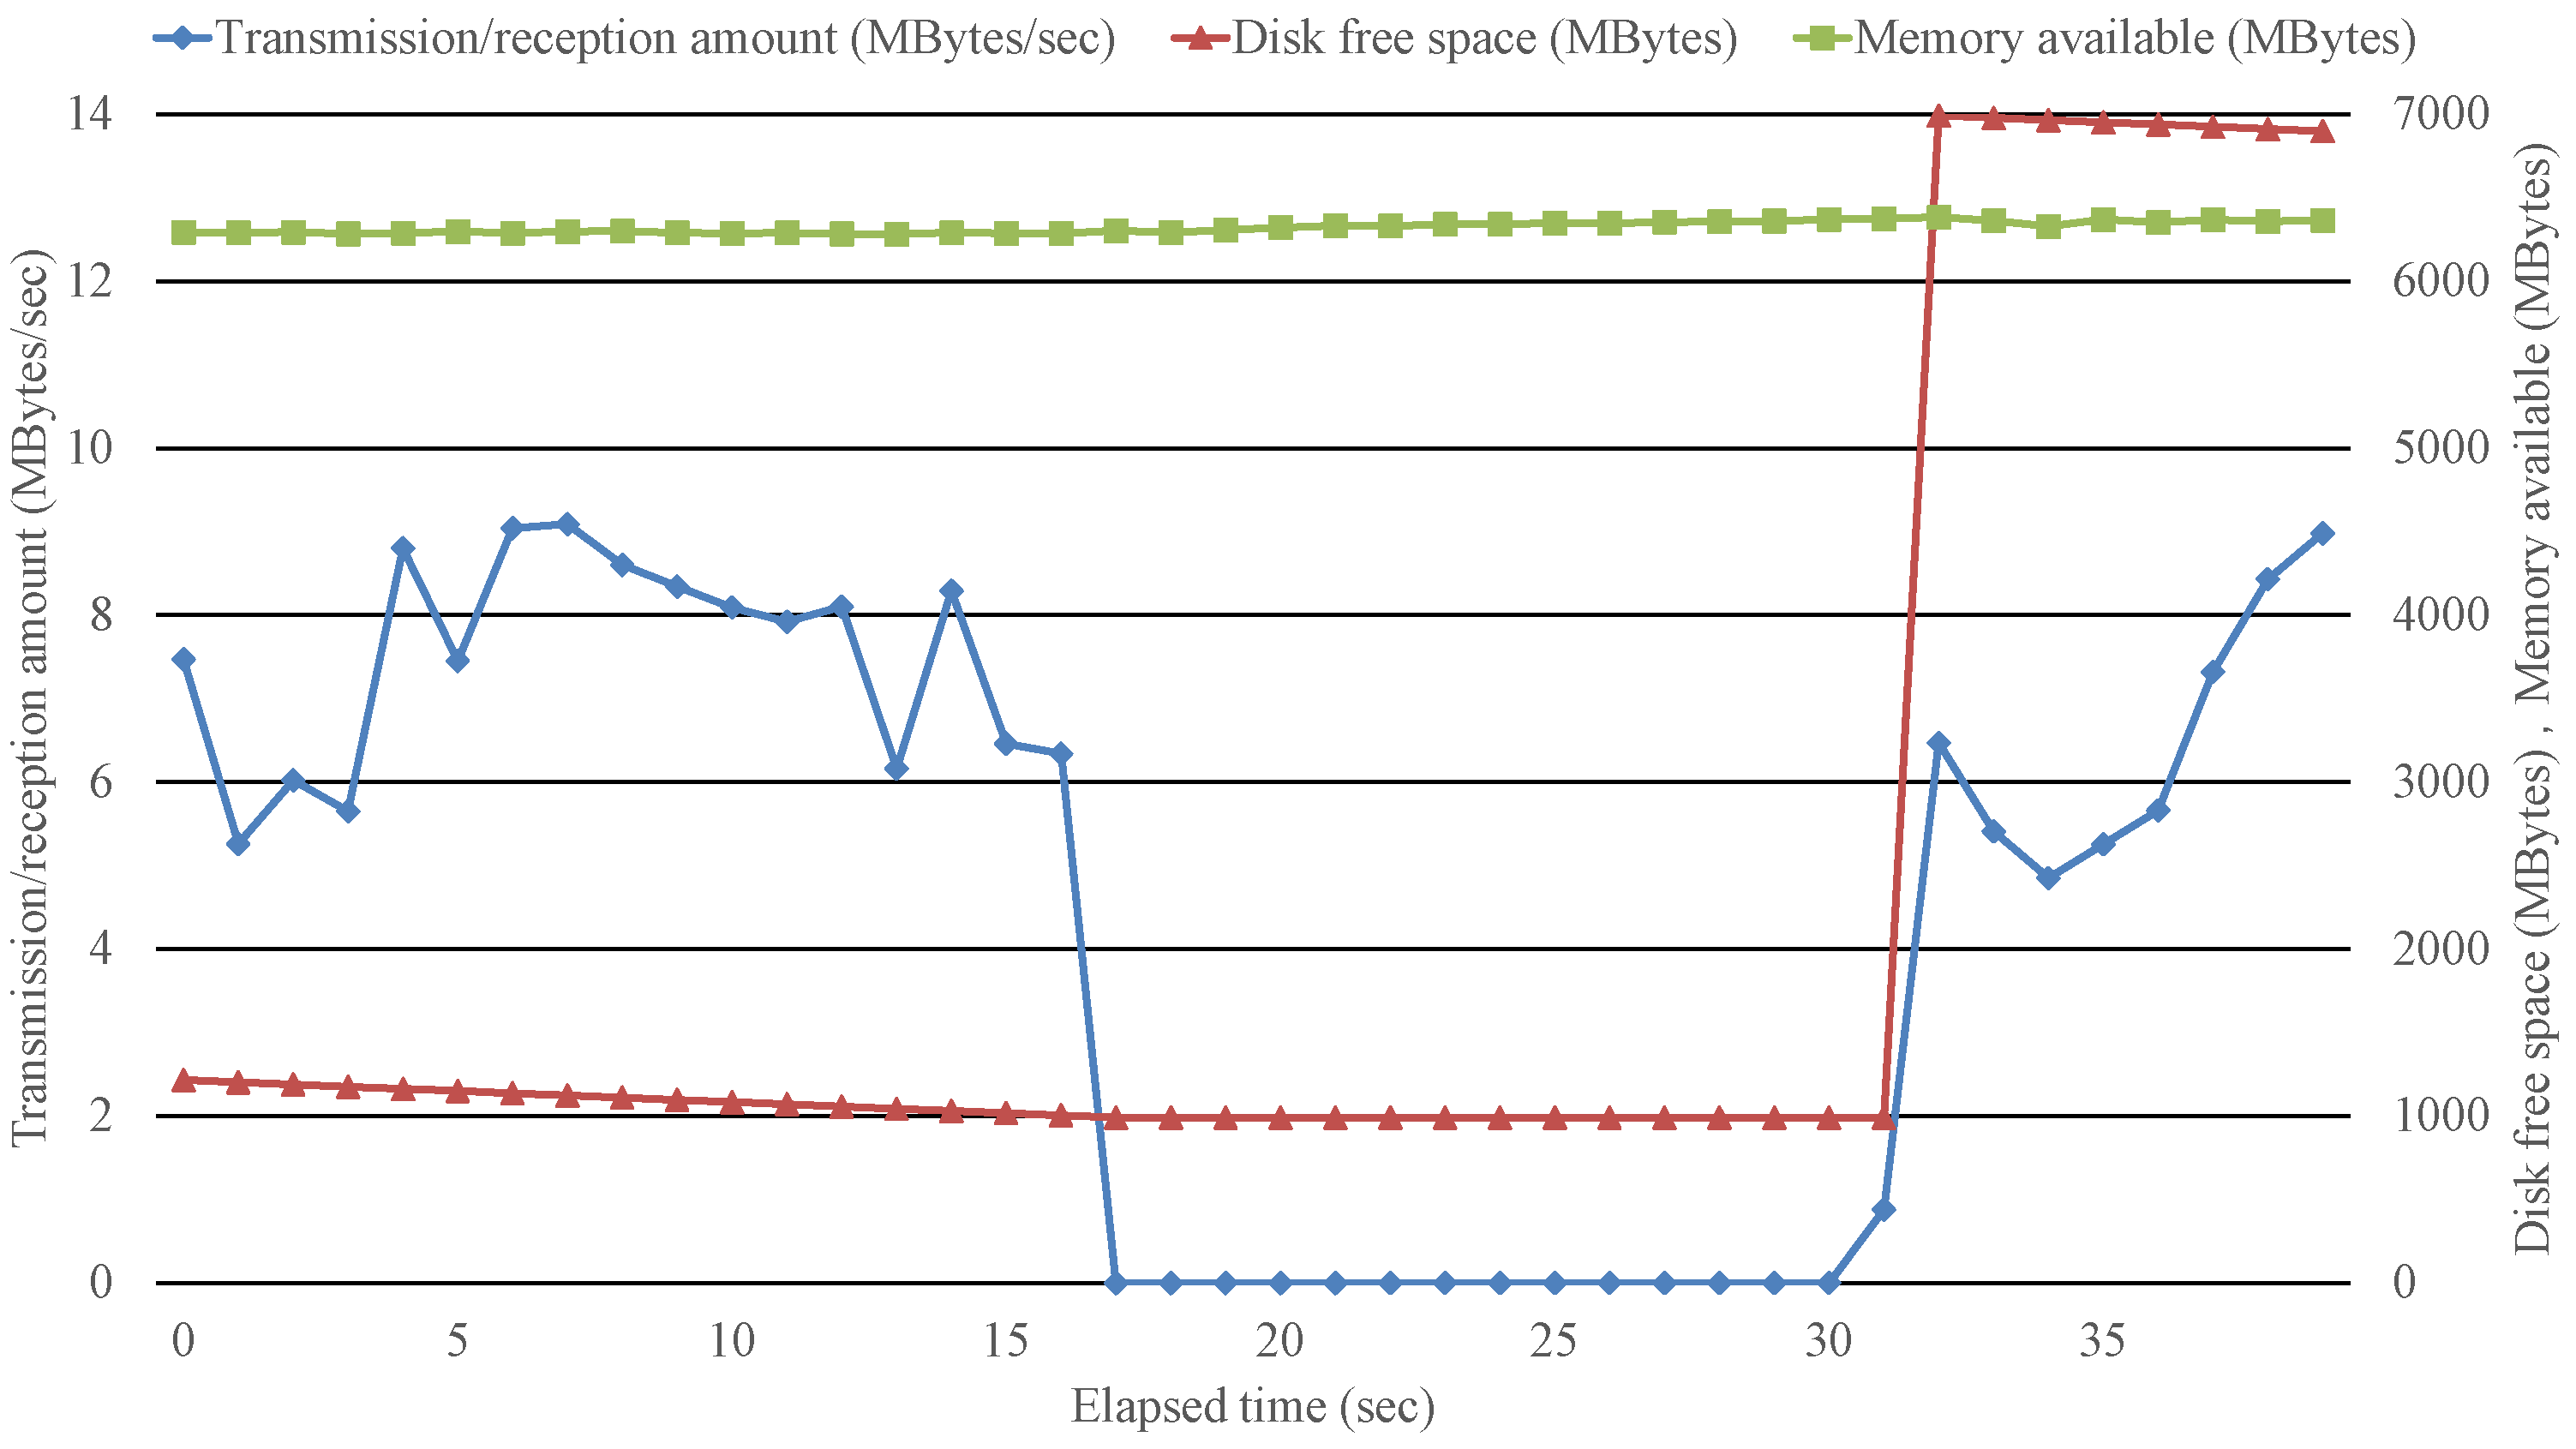
We measured the disk free space, memory free space, and transmission/reception amount when the iperf (UDP, inbound (PC2 to PC1), bandwidth 100 Mbits/s) and Tshark are executed in PC1. As shown in Figure 4, when the free space on the disk is exhausted at 35 s, the Tshark stops acquiring and recording packets; however, the iperf continued to send packets, and the comprehensiveness of the recording is lost. When rotating files that record packets with a fixed file size and a fixed number of files, if the log generation speed exceeds the log transfer speed to the outside, the past files will be overwritten, making it difficult to continue recording storage.
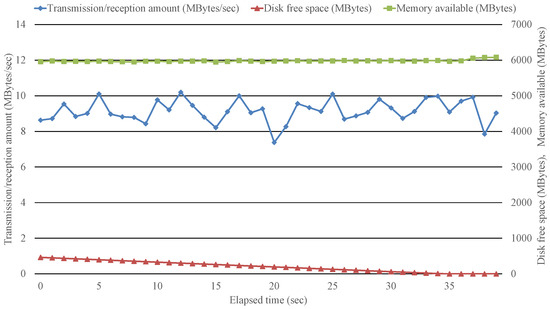
Figure 4.
Time-series changes in the disk free space, memory free space, and transmission/reception amount when the iperf (UDP, inbound (PC2 to PC1), bandwidth 100 Mbits/s) and Tshark are executed.
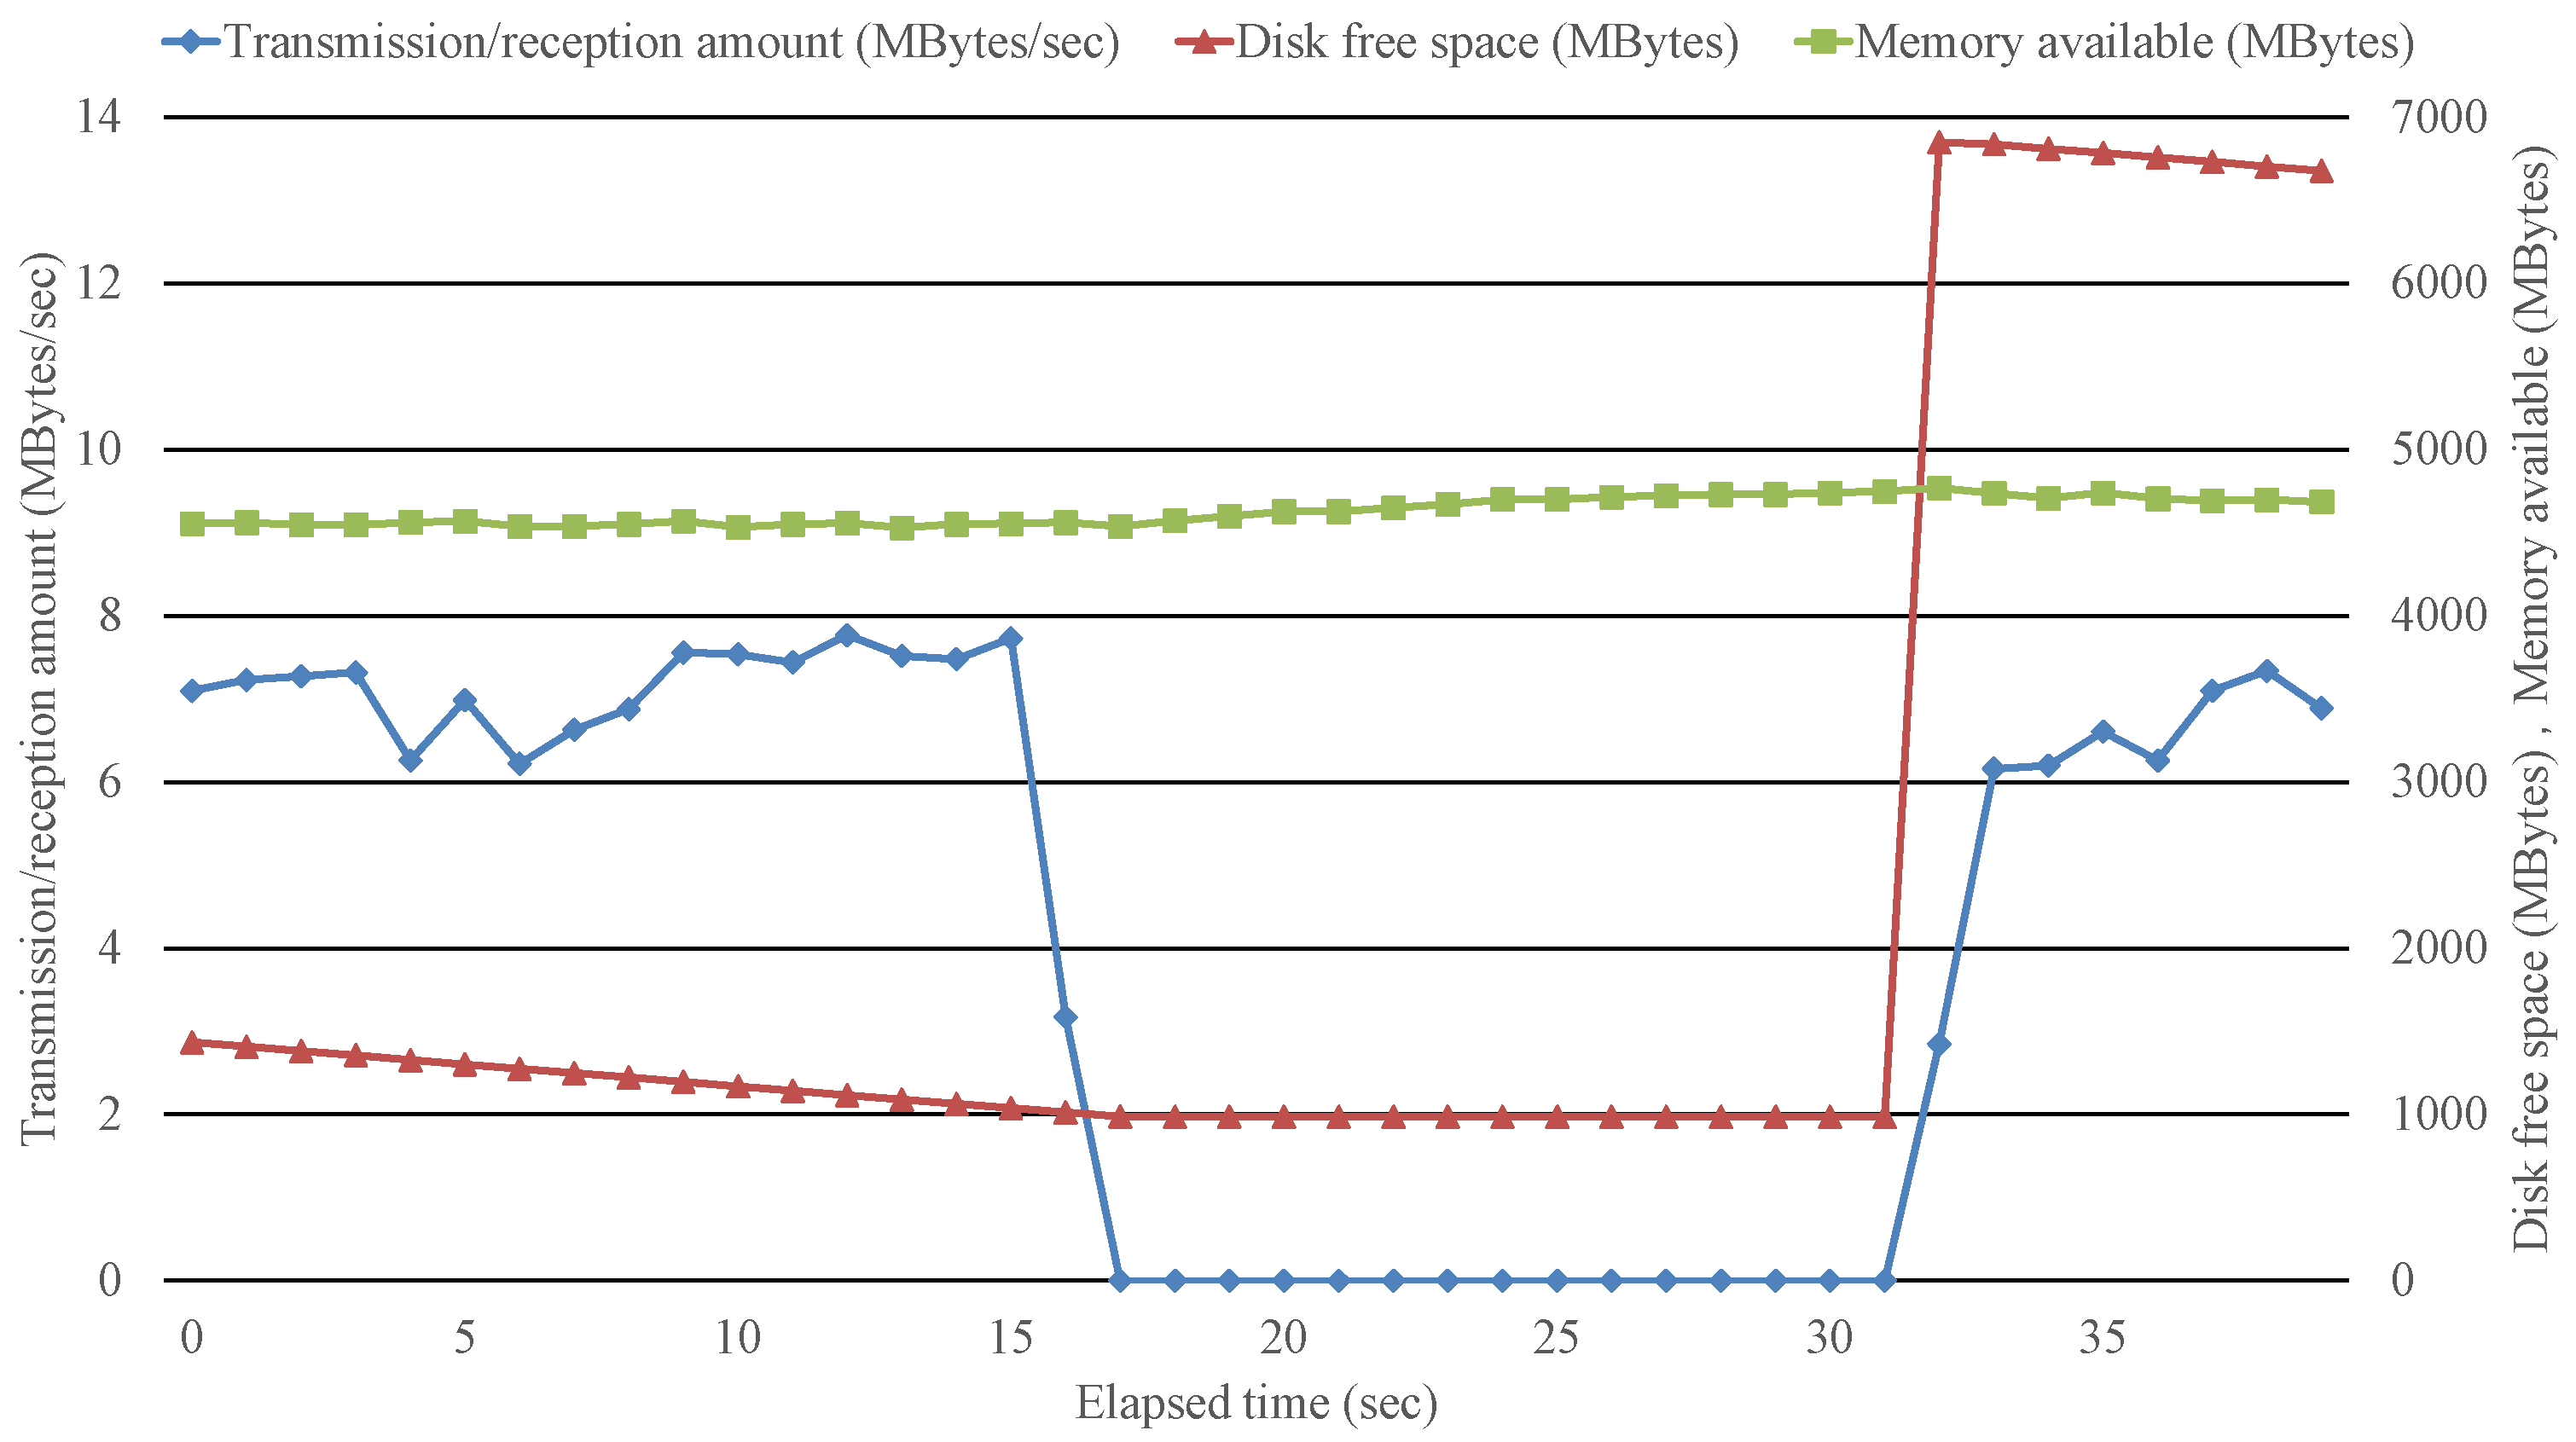
Next, we measured the disk free space, memory free space, and transmission/reception amount when the iperf (UDP, inbound (PC2 to PC1), bandwidth 100 Mbits/s) and implemented tool are executed in PC1. At 15 s after communication is blocked, we manually moved the log files to a USB memory and recovered free disk space. As shown in Figure 5, when the disk free space falls below 1 GB at 17 s, the implemented tool blocks the inbound and outbound traffic at the NDIS layer and temporarily stops capturing and recording. When the disk conditions recover at 31–32 s, the NDIS layer permits traffic to pass again and capturing and recording can resume. It can be said that the implemented tools have achieved comprehensiveness of records and continuity of record storage.

Figure 5.
Time-series changes in the disk free space, memory free space, and transmission/reception amount when the iperf (UDP, inbound (PC2 to PC1), bandwidth 100 Mbits/s) and implemented tool are executed. The figure illustrates the behavior when the disk free space falls below 1 GB.
Next, we measured the disk free space, memory free space, and transmission/reception amount when the iperf (UDP, inbound (PC2 to PC1), bandwidth 100 Mbits/s), Tshark, and implemented tool are executed in PC1. As above, 15 s after communication is blocked, we manually moved the log files to a USB memory and recovered free disk space. As shown in Figure 6, when the disk free space falls below 1 GB at 17 s, the implemented tool blocks the inbound and outbound traffic at the NDIS layer and temporarily stops capturing and recording. When the disk conditions recover at 31–32 s, the NDIS layer permits traffic to pass again and capturing and recording can resume. We confirmed that the packet data obtained by Tshark is completely included in the packet data obtained by the implemented tool, and it is possible to add the existing tool with the function of controlling communication events according to the status of the secondary storage.
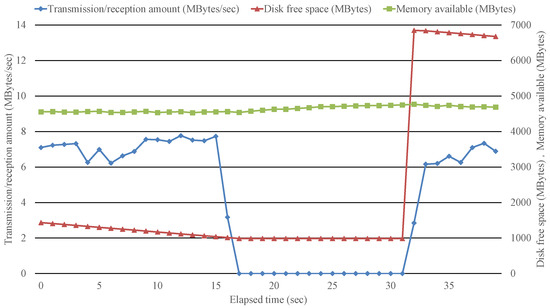
Figure 6.
Time-series changes in the disk free space, memory free space, and transmission/reception amount when the iperf (UDP, inbound (PC2 to PC1), bandwidth 100 Mbits/s), Tshark, and implemented tool are executed. The figure illustrates the behavior when the disk free space falls below 1 GB. Using the implemented tool together, the event control function can be added to the Tshark.
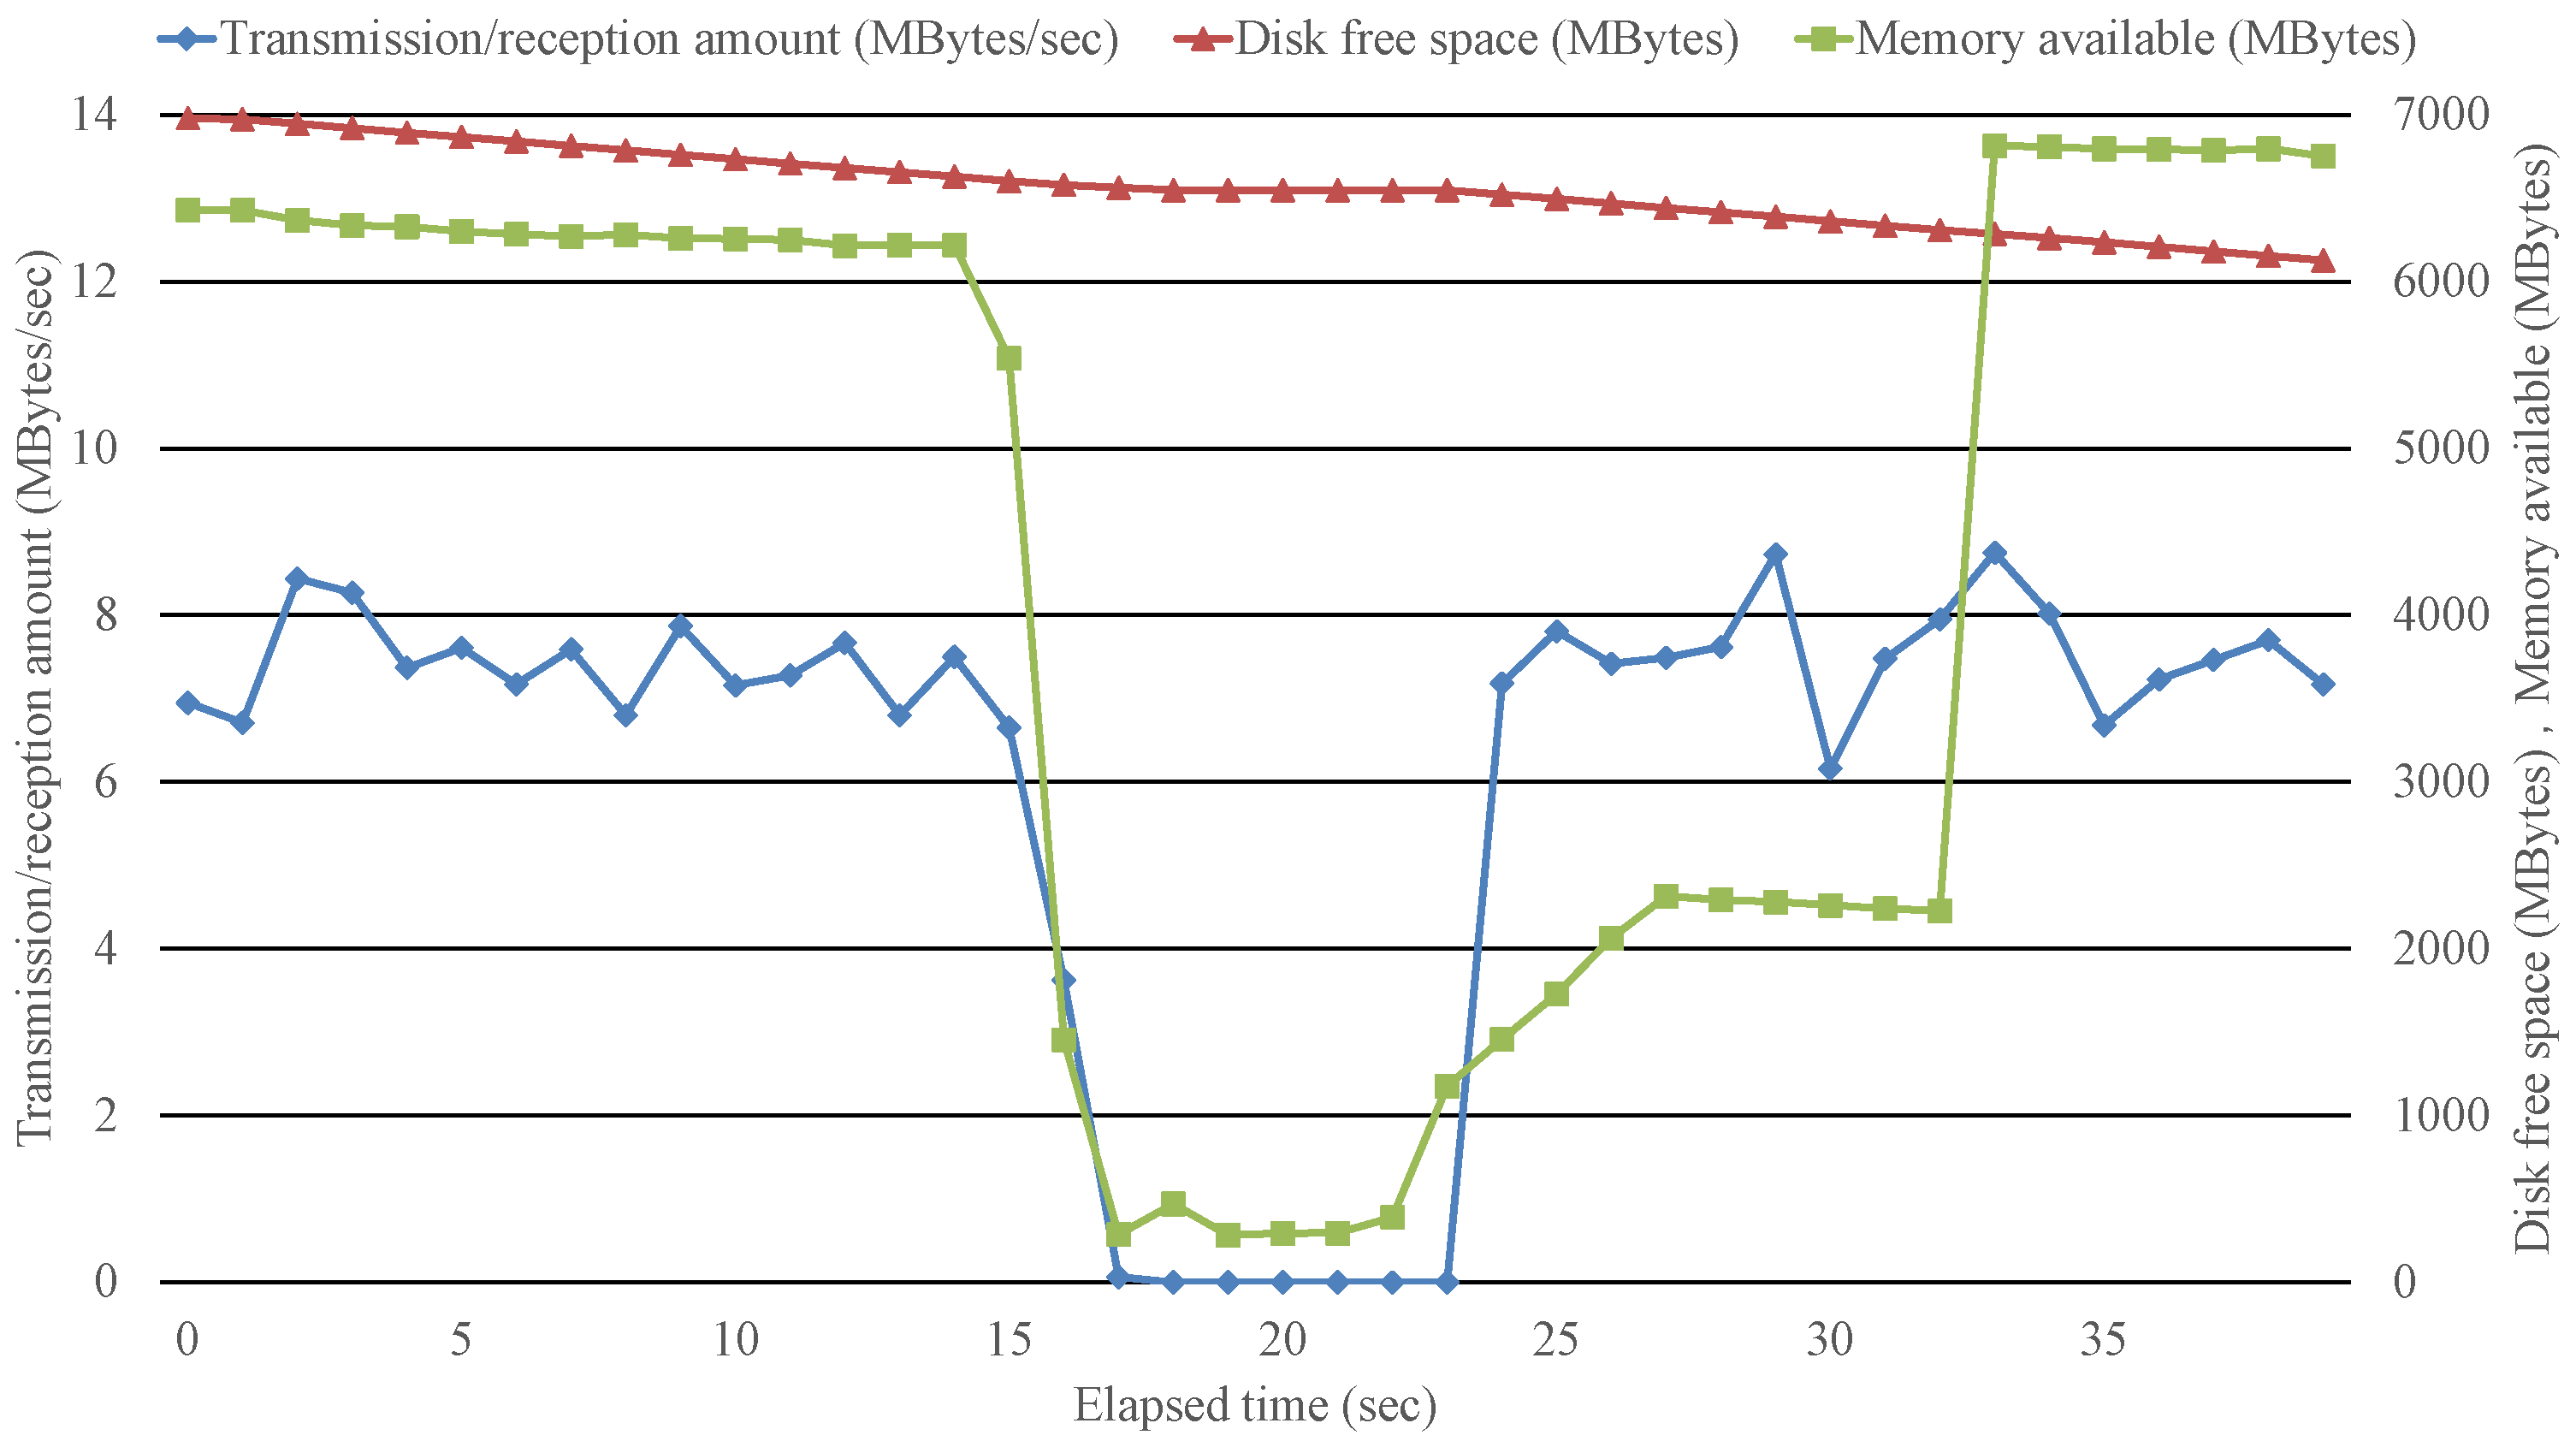
Next, we measured the disk free space, memory free space, and transmission/reception amount when the iperf (UDP, inbound (PC2 to PC1), bandwidth 100 Mbits/s), Tshark, implemented tool, and Testlimit are executed in PC1. We manually execute Testlimit with the option to consume 8 GB of memory. As shown in Figure 7, when the memory free space falls below 900 MB at 16–17 s, the implemented tool blocks the inbound and outbound traffic at the NDIS layer and temporarily stops capturing and recording. When the memory conditions recover at 23–24 s, the NDIS layer permits traffic to pass again and capturing and recording can resume. We confirmed that the packet data obtained by Tshark is completely included in the packet data obtained by the implemented tool. And, we confirmed that it is possible to add the existing tool with the function of controlling communication events according to the status of the primary storage.
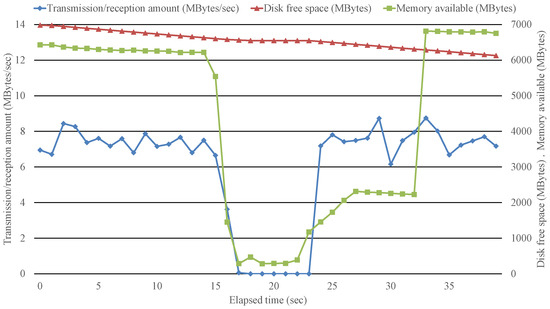
Figure 7.
Time-series changes in the disk free space, memory free space, and transmission/reception amount when the iperf (UDP, inbound (PC2 to PC1), bandwidth 100 Mbits/s), Tshark, implemented tool, and Testlimit are executed. The figure illustrates the situation just before and after the free memory falls below 900 MB (16–17 s).
Although the processing load on the function ClassifyFn() was limited, the inbound reception amount was reduced by about 40%. When we performed the same four experiments as above except for iperf (outbound (PC1 to PC2)), we obtained similar results, except that the outbound transmission amount decreased by about 15%. In addition, while running Tshark and the implemented tools at the same time, we executed iperf (TCP inbound/outbound), web access (TCP inbound/outbound), ping (ICMP echo request/reply), nslookup (UDP inbound/outbound), arp (arp request/reply), and checked whether the implemented tool can control blocking/allowing of communication events and the retrieved packets were the same.
7. Discussion
On the usefulness of this research, we consider two points: (1) the proposed communication log acquisition method can be implemented on the end host, and (2) the problem can be solved by using a tool that implements the proposed method.
Regarding (1), if it is possible to intervene in the process of the network protocol stack, then it is possible to allow/block communication events regardless of the OS and applications. Therefore, a possible implementation method is to use a filter hook driver (filter driver) that hooks a specific layer of the protocol stack. To implement the proposed method on the Windows host, we decided to use a callout driver using WFP. For Windows Server 2008, Windows Vista, and later, it is recommended to use WFP instead of firewall hooks and filter hook drivers (filter drivers). For device drivers, if we write a program that uses up the free space in primary storage, it may crash, hang, or fail to unload. Implementing a device driver, it is necessary to use a verification tool to test and confirm that these problems do not occur when memory space is low. The implemented WFP callout driver is written based on KMDF. KMDF-based driver verification tool Verifier.exe was used to test and confirm whether the driver responded to low memory conditions without crashing, hanging, or failing to unload.
Regarding (2), we conducted an experiment to run the WFP callout driver and the Win32 application that cooperates with it on the Windows host, and confirmed whether the issue of interest was resolved. In the first experiment, when using an existing sniffer tool, we confirmed that it was impossible to acquire and record communication logs (raw packets), and the tool stopped working under the condition that the free space in secondary storage ran out. In the second experiment, when the implemented tool is used, we confirmed that communication events are blocked to prevent further increase in communication logs under the condition that the free space in secondary storage falls below a certain value. We also confirmed that communication events are allowed and communication log acquisition and recording resumes under the condition that the free space in the secondary storage recovers to a certain value or more. In the third experiment, when an existing sniffer tool and the implemented tool were used together, we confirmed that the control of blocking/allowing communication events according to the free space of secondary storage could be applied to the existing sniffer tool as well. In this experiment, we ran the implemented tool in the same operating mode as the second experiment (both communication event control and communication log acquisition/recording are enabled). Furthermore, it is also possible to apply only communication event control to an existing sniffer tool by running a tool implemented in another operating mode (only communication event control is valid). In the fourth experiment, when the existing sniffer tool and the implemented tool are used together, we confirmed that the existing sniffer tool can be used to control blocking/allowing of communication events according to the free space in primary storage. In this experiment, we used both existing sniffer tools and the implemented tool. However, it can be seen that even with the implemented tool alone, it is possible to control blocking/permission of communication events according to the free space of primary storage.
These four experiments were conducted under the condition that 100 Mbps of UDP communication was provided as load traffic from PC2 (the communication partner host) to PC1 (the host on which the sniffer tool operates). In addition, we conducted the experiment under the condition that 100 Mbps UDP communication was given as load traffic from PC1 to PC2, and although there was a difference in the decrease in reception rate, the same results were obtained. When we conducted the experiment under the condition that 100 Mbps UDP communication was given as load traffic from PC2 to PC1, the reception rate decreased by about 40% compared to the transmission rate. Furthermore, when we conducted the experiment under the condition that 100 Mbps UDP communication was applied as load traffic from PC1 to PC2, the reception rate decreased by about 15% compared to the transmission rate. At least the reception rate is around 50 Mbps, so there should be no major problems with the host used as a client. The implemented tool needs to retain inbound frames to the NDIS layer (LLC layer) and outbound frames from the NDIS layer (LLC layer) while recording them to disk. So the WFP callout driver contains a process that repeatedly allocates and releases nonpaged memory for the kernel. The inbound frame is passed from a lower layer as an individual frame, and the outbound frame is passed from an upper layer as a collection of multiple frames scheduled for transmission. Therefore, inbound frame reception events occur more frequently than outbound frame transmission events. If the number of frame receive/send events per unit time exceeds a certain value, the WFP callout driver contains a process that blocks inbound/outbound frames in order to avoid driver crashes, hangs, and reload failures due to insufficient memory. Since a large safety margin is set in the threshold for the number of frame transmission/reception events per unit time, it is thought to be the reason why the inbound frame reception rate is low. Since we are not aiming to increase the speed of acquiring and recording communication logs, we would like to consider reducing the reception rate in the future work.
We confirmed that the implemented tool is able to control the blocking/permission of communication events by using the existing sniffer tool and the implemented tool together, in case of using iperf or a web browser to give TCP inbound/outbound traffic as load traffic, in case of using ping to give ICMP echo request/echo reply packets, in case of using nslookup to give UDP packets, and in case of using ARP to give ARP request/reply packets. Also, we confirmed that the communication log recorded by each of the existing sniffer tool and the implemented tool is completely consistent. From these experiments, we confirmed that the implemented tool can acquire and record communication events with control over blocking/permission of communication events even for protocols above the MAC layer such as TCP, ICMP, and ARP.
On the impact and application of this research, we consider two points: (3) it can be applied to real-world communication log collection scenarios, and (4) it can coexist with existing systems and tools that collect communication logs.
Regarding (3), we list scenarios for acquiring and recording communication logs in the real world, and consider whether the proposed communication log acquisition method can be applied to each scenario.
The acquisition of communication logs can be broadly divided into two types, depending on the location where communication events are acquired (source of communication event). The first one is that event logs, statistical logs, or raw packets of all communications are acquired by a probe host or probe device connected to a device on the communication path between hosts or a mirror port of the device. The other is that event logs, statistical logs, or raw packets of communications addressed to and originated from itself are acquired by the host used as the server or client.
One of the scenarios for acquiring communication logs in the real world is as follows: A router at the boundary between the internal network and external network, or a probe device connected to the mirror port of the router, acquires event logs, statistical logs, or raw packets of communication via the router. These logs are transferred to the log management server and stored in the server. In this scenario, an attempt is made to log all communications that go through the router. When the amount of communication per unit time via a router increases, communication events and packets may be missed by the router or the probe device, and communication logs may be lost due to primary and secondary storage being depleted. Until now, several approaches have been considered to minimize the possibility of missing communication events, packets, and depleting primary and secondary storage. For example, increasing the granularity of logs to reduce log size, streamlining the process of acquiring and recording communication events and packets at the router or probe device, streamlining the process of transferring logs from the router or probe device to log management servers, and improving the performance of the hardware in the router or probe device are listed. We considered applying the proposed communication log acquisition method to this scenario. To prevent the router or probe device from dropping communication events or packets, or from depleting primary and secondary storage, an FW is set to outside the router and using the FW temporarily throttle or block the traffic passing through the router. However, if the scale of the internal network is large, the amount of communication per unit time via the border router is greatly limited, which may affect the usability of the network system.
Another scenario for acquiring communication logs in the real world is as follows: Each host to be monitored acquires and temporarily records event logs, statistical logs, or raw packets of communications addressed to and originating from itself, transfers the logs to a log management server, and stores the logs in the server. In this scenario, each monitored host attempts to log all communications sent and received by the host. When the amount of communication transmitted and received by a host per unit time increases, communication events and packets may be missed, or communication logs cannot be recorded due to depletion of primary and secondary storage. Until now, approaches similar to those mentioned above have been considered in order to prevent communication events and communication data from being missed, and to prevent primary and secondary storage from being depleted as much as possible. When acquiring raw packets as communication logs, primary and secondary storage are likely to be depleted, so they are often used for limited periods of time, such as for dealing with server failures and understanding usage status, rather than for forensic purposes. This scenario is suitable for the proposed communication log acquisition method, and can be applied to not only host communication, but also acquisition of various logs such as OS, applications, services, user operations, etc. By controlling event permission/blocking at the event source, the rate of event generation may be limited to a certain level, but the impact is limited to the host and is considered to be limited.
Regarding (4), we will consider whether the implemented tools can be used additionally while there are existing systems or tools that realize each of the two scenarios listed above.
The proposed communication log acquisition method is suitable for the second scenario mentioned above. We have confirmed through experiments that comprehensive communication log recording and continuity of record storage can be achieved by operating the implemented tool, or by operating both the implemented tool and an existing tool or system. Existing systems or tools that realize each of the two scenarios differ in the location where communication events are acquired (the origin of the communication events). Therefore, the mechanisms for acquiring communication logs are independent from each other, and each can be operated at the same time without affecting each other.
The implemented tool captures raw packets as communication logs and records them in a PCAP format log file. When the implemented tool is used in conjunction with an existing sniffer tool or an existing communication event acquiring and recording system, the functionality of communication event control can be added to the existing tool or system. The implemented tool works correctly, even when existing tools record raw packets to log files in other formats, or when recording communication event logs and statistics logs to log files. Even if primary storage or secondary storage is depleted, the comprehensiveness of these log records and the continuity of record storage can be maintained.
8. Conclusions
To comprehensively record and continuously store communication logs on end hosts, the logs must be periodically transferred to a log management server and moved from secondary storage to tertiary storage on that server. From a forensic perspective, it is important to perform these procedures reliably without failure.
In this paper, we proposed a communication log acquisition method for solving problems with content and storage in acquiring communication logs on end hosts that satisfies the comprehensiveness of records and continuity of record storage. As an example, we implemented a packet sniffer tool that runs on Windows OS and conducted experiments to compare it with existing tools.
The communication data sent and received by the host are processed by the protocol stack of the communication device. The proposed method controls the permission/blocking of communication events in the filter driver (WFP callout driver) of the protocol stack according to the state of the primary and secondary storage, thereby achieving record comprehensiveness and continuity.
The proposed method and its implementing tool either allow or block all communication events, depending on the available space in primary and secondary storage. Given that some traffic has higher priority, uniform control of permissions and blocks presents challenges for network system availability. For example, when managing communication events, we could consider introducing a mechanism that blocks traffic in stages, starting from low priority traffic.
In order to achieve them for the entire network forensic system, the log management server is required to continue storing various types of log data. However, it is difficult to completely satisfy the requirement in terms of cost, and the only way to achieve is to set a limited period for storing log data. This will be a future issue.
Author Contributions
Conceptualization, Y.F. and Y.S.; methodology, Y.F. and Y.S.; software, Y.F.; validation, Y.F.; investigation, Y.F. and Y.S.; resources, M.H. and M.M.; data curation, Y.F.; writing—original draft preparation, Y.F.; writing—review and editing, Y.S. and M.H.; visualization, Y.F.; supervision, M.M.; funding acquisition, Y.S. All authors have read and agreed to the published version of the manuscript.
Funding
This research was partially supported by the Ministry of Internal Affairs and Communications entitled “Research and development on new generation encryption technology for secure wireless communication services” in “Research and Development for Expanding Radio Wave Resources (JPJ000254)”.
Data Availability Statement
No new data were created or analyzed in this study. Data sharing is not applicable to this article.
Conflicts of Interest
The authors declare no conflicts of interest.
References
- Davidoff, S.; Ham, J. Network Forensics: Tracking Hackers through Cyberspace; Pearson Education, Inc.: London, UK, 2012; pp. 16–22. [Google Scholar]
- NIST SP 800-86 Guide to Integrating Forensic Techniques into Incident Response. Available online: https://csrc.nist.gov/pubs/sp/800/86/final (accessed on 10 January 2024).
- Kurniawan, A.; Riadi, I. Detection and analysis cerber ransomware based on network forensics behavior. Int. J. Netw. Secur. 2018, 20, 836–843. [Google Scholar]
- Qureshi, S.; Tunio, S.; Akhtar, F.; Wajahat, A.; Nazir, A.; Ullah, F. Network Forensics: A Comprehensive Review of Tools and Techniques. Int. J. Adv. Comput. Sci. Appl. (IJACSA) 2021, 12, 879–887. [Google Scholar] [CrossRef]
- Li, J.; Wu, C.; Ye, J.; Ding, J.; Fu, Q.; Huang, J. The Comparison and Verification of Some Efficient Packet Capture and Processing Technologies. In Proceedings of the 2019 IEEE International Conference on Dependable, Autonomic and Secure Computing, International Conference on Pervasive Intelligence and Computing, International Conference on Cloud and Big Data Computing, International Conference on Cyber Science and Technology Congress (DASC/PiCom/CBDCom/CyberSciTech), Fukuoka, Japan, 5–8 August 2019; pp. 967–973. [Google Scholar]
- Sikos, L.F. Packet analysis for network forensics: A comprehensive survey. Forensic Sci. Int. Digit. Investig. 2020, 32, 200892. [Google Scholar] [CrossRef]
- Zhang, L.; Wang, H.; Xue, H.; Zhang, H.; Liu, Q.; Niyato, D.; Han, Z. Digital Twin-Assisted Edge Computation Offloading in Industrial Internet of Things With NOMA. IEEE Trans. Veh. Technol. 2023, 72, 11935–11950. [Google Scholar] [CrossRef]
- Saponara, S.; Elhanashi, A.; Gagliardi, A. Reconstruct fingerprint images using deep learning and sparse autoencoder algorithms. In Proceedings of the Real-Time Image Processing and Deep Learning 2021, Online, 12 April 2021; p. 1173603. [Google Scholar] [CrossRef]
- Windows Filtering Platform. Available online: https://learn.microsoft.com/en-us/windows/win32/fwp/windows-filtering-platform-start-page (accessed on 10 January 2024).
- Introduction to I/O Control Codes. Available online: https://github.com/MicrosoftDocs/windows-driver-docs/blob/staging/windows-driver-docs-pr/kernel/defining-i-o-control-codes.md (accessed on 10 April 2024).
- Writing IRP Dispatch Routines. Available online: https://learn.microsoft.com/en-us/windows-hardware/drivers/ifs/writing-irp-dispatch-routines?source=recommendations (accessed on 10 April 2024).
- netfilter. Available online: https://netfilter.org/ (accessed on 10 April 2024).
- OpenBSD PF—User’s Guide. Available online: https://www.openbsd.org/faq/pf/index.html (accessed on 10 April 2024).
- Using KMDF Verifier. Available online: https://learn.microsoft.com/en-us/windows-hardware/drivers/wdf/using-kmdf-verifier (accessed on 10 April 2024).
- RFC3954 Cisco Systems NetFlow Services Export V9 October. Available online: https://www.ietf.org/rfc/rfc3954.txt (accessed on 10 January 2024).
- RFC5424 The Syslog Protocol March 2009. Available online: https://www.ietf.org/rfc/rfc5424.txt (accessed on 10 January 2024).
- WIRESHARK. Available online: https://www.wireshark.org (accessed on 10 January 2024).
- TCPDUMP & LiBPCAP. Available online: https://www.tcpdump.org (accessed on 10 January 2024).
- iPerf—The Ultimate Speed Test Tool for TCP, UDP and SCTP. Available online: https://iperf.fr (accessed on 10 January 2024).
- Testlimit v5.24. Available online: https://learn.microsoft.com/ja-jp/sysinternals/downloads/testlimit (accessed on 10 January 2024).
Disclaimer/Publisher’s Note: The statements, opinions and data contained in all publications are solely those of the individual author(s) and contributor(s) and not of MDPI and/or the editor(s). MDPI and/or the editor(s) disclaim responsibility for any injury to people or property resulting from any ideas, methods, instructions or products referred to in the content. |
© 2024 by the authors. Licensee MDPI, Basel, Switzerland. This article is an open access article distributed under the terms and conditions of the Creative Commons Attribution (CC BY) license (https://creativecommons.org/licenses/by/4.0/).

