1. Introduction
Treatment duration is one of the most important factors that patients consider when deciding whether to undergo orthodontic treatment [
1]. An exact and accurate prediction of the duration of the total orthodontic treatment might motivate patients or prepare them for what to expect (Mavreas and Athanasiou, 2008) [
2]. Additionally, a reliable idea of the treatment duration helps the orthodontist to better plan the overall treatment and the sequence of appointments (Fink and Smith, 1992; Mavreas and Athanasiou, 2008) [
1,
2]. Earlier studies reported that orthodontic treatment employing fixed appliances typically lasts 14 to 33 months (Kafle et al., 2019; Tsichlaki et al., 2016) [
3,
4] with a mean of around 22 to 24 months, depending on the discrepancy being treated (Aljehani and Baeshen, 2018; Simister, 2007) [
5].
Factors influencing the duration of orthodontic treatment are manifold. They range from general malocclusion, anatomic and biologic factors (such as bone morphology, patient age, and disease), the type of treatment (extraction versus nonextraction), to the planned treatment technique (Bhikoo et al., 2018) [
6]. A further aspect might be patient cooperation, which is closely related to socio-economic factors and education (Kafle et al., 2019; Mavreas and Athanasiou, 2008; Tsichlaki et al., 2016) [
2,
3,
4].
As teeth have to be moved through the bone, one decisive factor influencing the speed of orthodontic tooth movement and thus treatment duration is bone metabolism, i.e., the ability of bone to remodel as a result of the applied force systems (Abbing et al., 2020) [
7]. Bone metabolism depends, in part, on age, the bony structure itself, and/or systemic disease (Abbing et al., 2020; Kaur and El-Bialy, 2020; Landin-Ramos, 2020) [
7,
8,
9]. One could approach the prediction of treatment duration via bone morphology. Here, the bone structure and density, the thickness of the cortical bone, and the structure of the spongious bone would have to be analyzed in detail. An approach using fractal analysis of panoramic X-ray images has recently been presented (Cesur et al., 2020) [
10], while more classical approaches use indices of severity, such as the American Board of Orthodontics Discrepancy Index (ABO-DI), to give an answer to patients’ frequent question, “When do I get my braces off?” (Aljehani and Baeshen, 2018) [
5].
Artificial intelligence (AI) is bringing a paradigm shift to healthcare, powered by the increasing availability of healthcare data and the rapid progress of analytics techniques [
11]. Machine learning (ML) is a subset of AI techniques, used to determine complex models and extract knowledge. In clinical practice, ML predictive models can assist the clinician in decision-making regarding individual patient care [
12,
13].
To our knowledge, ML has not been used to predict orthodontic treatment length. Therefore, our study aimed to build and compare ML models to predict orthodontic treatment length and to identify factors affecting the duration of orthodontic treatment using an ML approach.
2. Materials and Methods
We retrospectively evaluated the records of 631 patients who completed orthodontic treatment at All Care Orthodontics, Chicago, IL. Ethical approval (IRP Number 20193360) for this study was obtained from the research ethics committee of WIRB-Copernicus. All experiments were completed in accordance with approved guidelines.
The inclusion criteria were as follows: patients who had (1) received comprehensive orthodontic treatment; (2) successfully finished their orthodontic treatment without disruption during the treatment period; (3) a complete set of standard orthodontic records pretreatment and at a debond appointment; and (4) had treatment by a board-certified orthodontist. The exclusion criteria were patients who had: (1) received limited orthodontic treatment; (2) received phase one orthodontic treatment; (3) had treatment disrupted and, consequently, increased treatment length; (4) more than four failed appointments; (5) treatment under Medicaid coverage; and (6) craniofacial syndromes. A total of 518 patients met the inclusion criteria, and their records were used in this study.
The following parameters were collected for each patient: (1) gender, race, and age when treatment started; (2) commute distance to the orthodontic office in miles; (3) overjet, overbite, maxillary, and mandibular arch crowding calculated in mm; (4) malocclusion classification (I, II, and III); (5) actual treatment length, in months, starting from the bonding to the debonding appointment; (6) estimated treatment length determined by an orthodontist; (7) treatment difficulty estimated by artificial intelligence (AI score: 1, easy to 5, very difficult) using a deep learning model, previously published by Talaat et al., 2021 [
13].
Implementation of Machine Learning Models
A total of nine machine learning algorithms were tested. These included: (1) simple linear regression (baseline model); (2) modified simple linear regression; (3) polynomial linear regression; (4) K nearest neighbor (KNN); (5) simple decision tree; (6) bagging regressor; (7) random forest; (8) gradient boosting regression; and (9) adaboost regression [
14].
The cases corresponding to each of the possible outcomes were divided into two groups: 70% of cases were used for ML training and the remaining 30% for ML testing. The same training and testing sets were used with every model to ensure a fair comparison. After each model was trained and optimized using 70% of the patient sample, the remaining 30% of cases served as the testing dataset to evaluate the model’s predictive ability. We compared all models using three indicators: mean squared error (MSE) of the training data, MSE of the testing data, and coefficient of determination (R2) of the model on the entire dataset. Ideally, the testing MSE should be as low as possible. A training MSE that is much lower than the testing MSE usually indicates the model overfitting on the training dataset. In addition, a higher R2 score is desirable, representing the proportion of the variance for the dependent variable (actual treatment time) that is explained by independent variables in a regression model. Furthermore, we analyzed residual values according to the statistical best practices and generated feature importance and permutation importance for each model.
3. Results
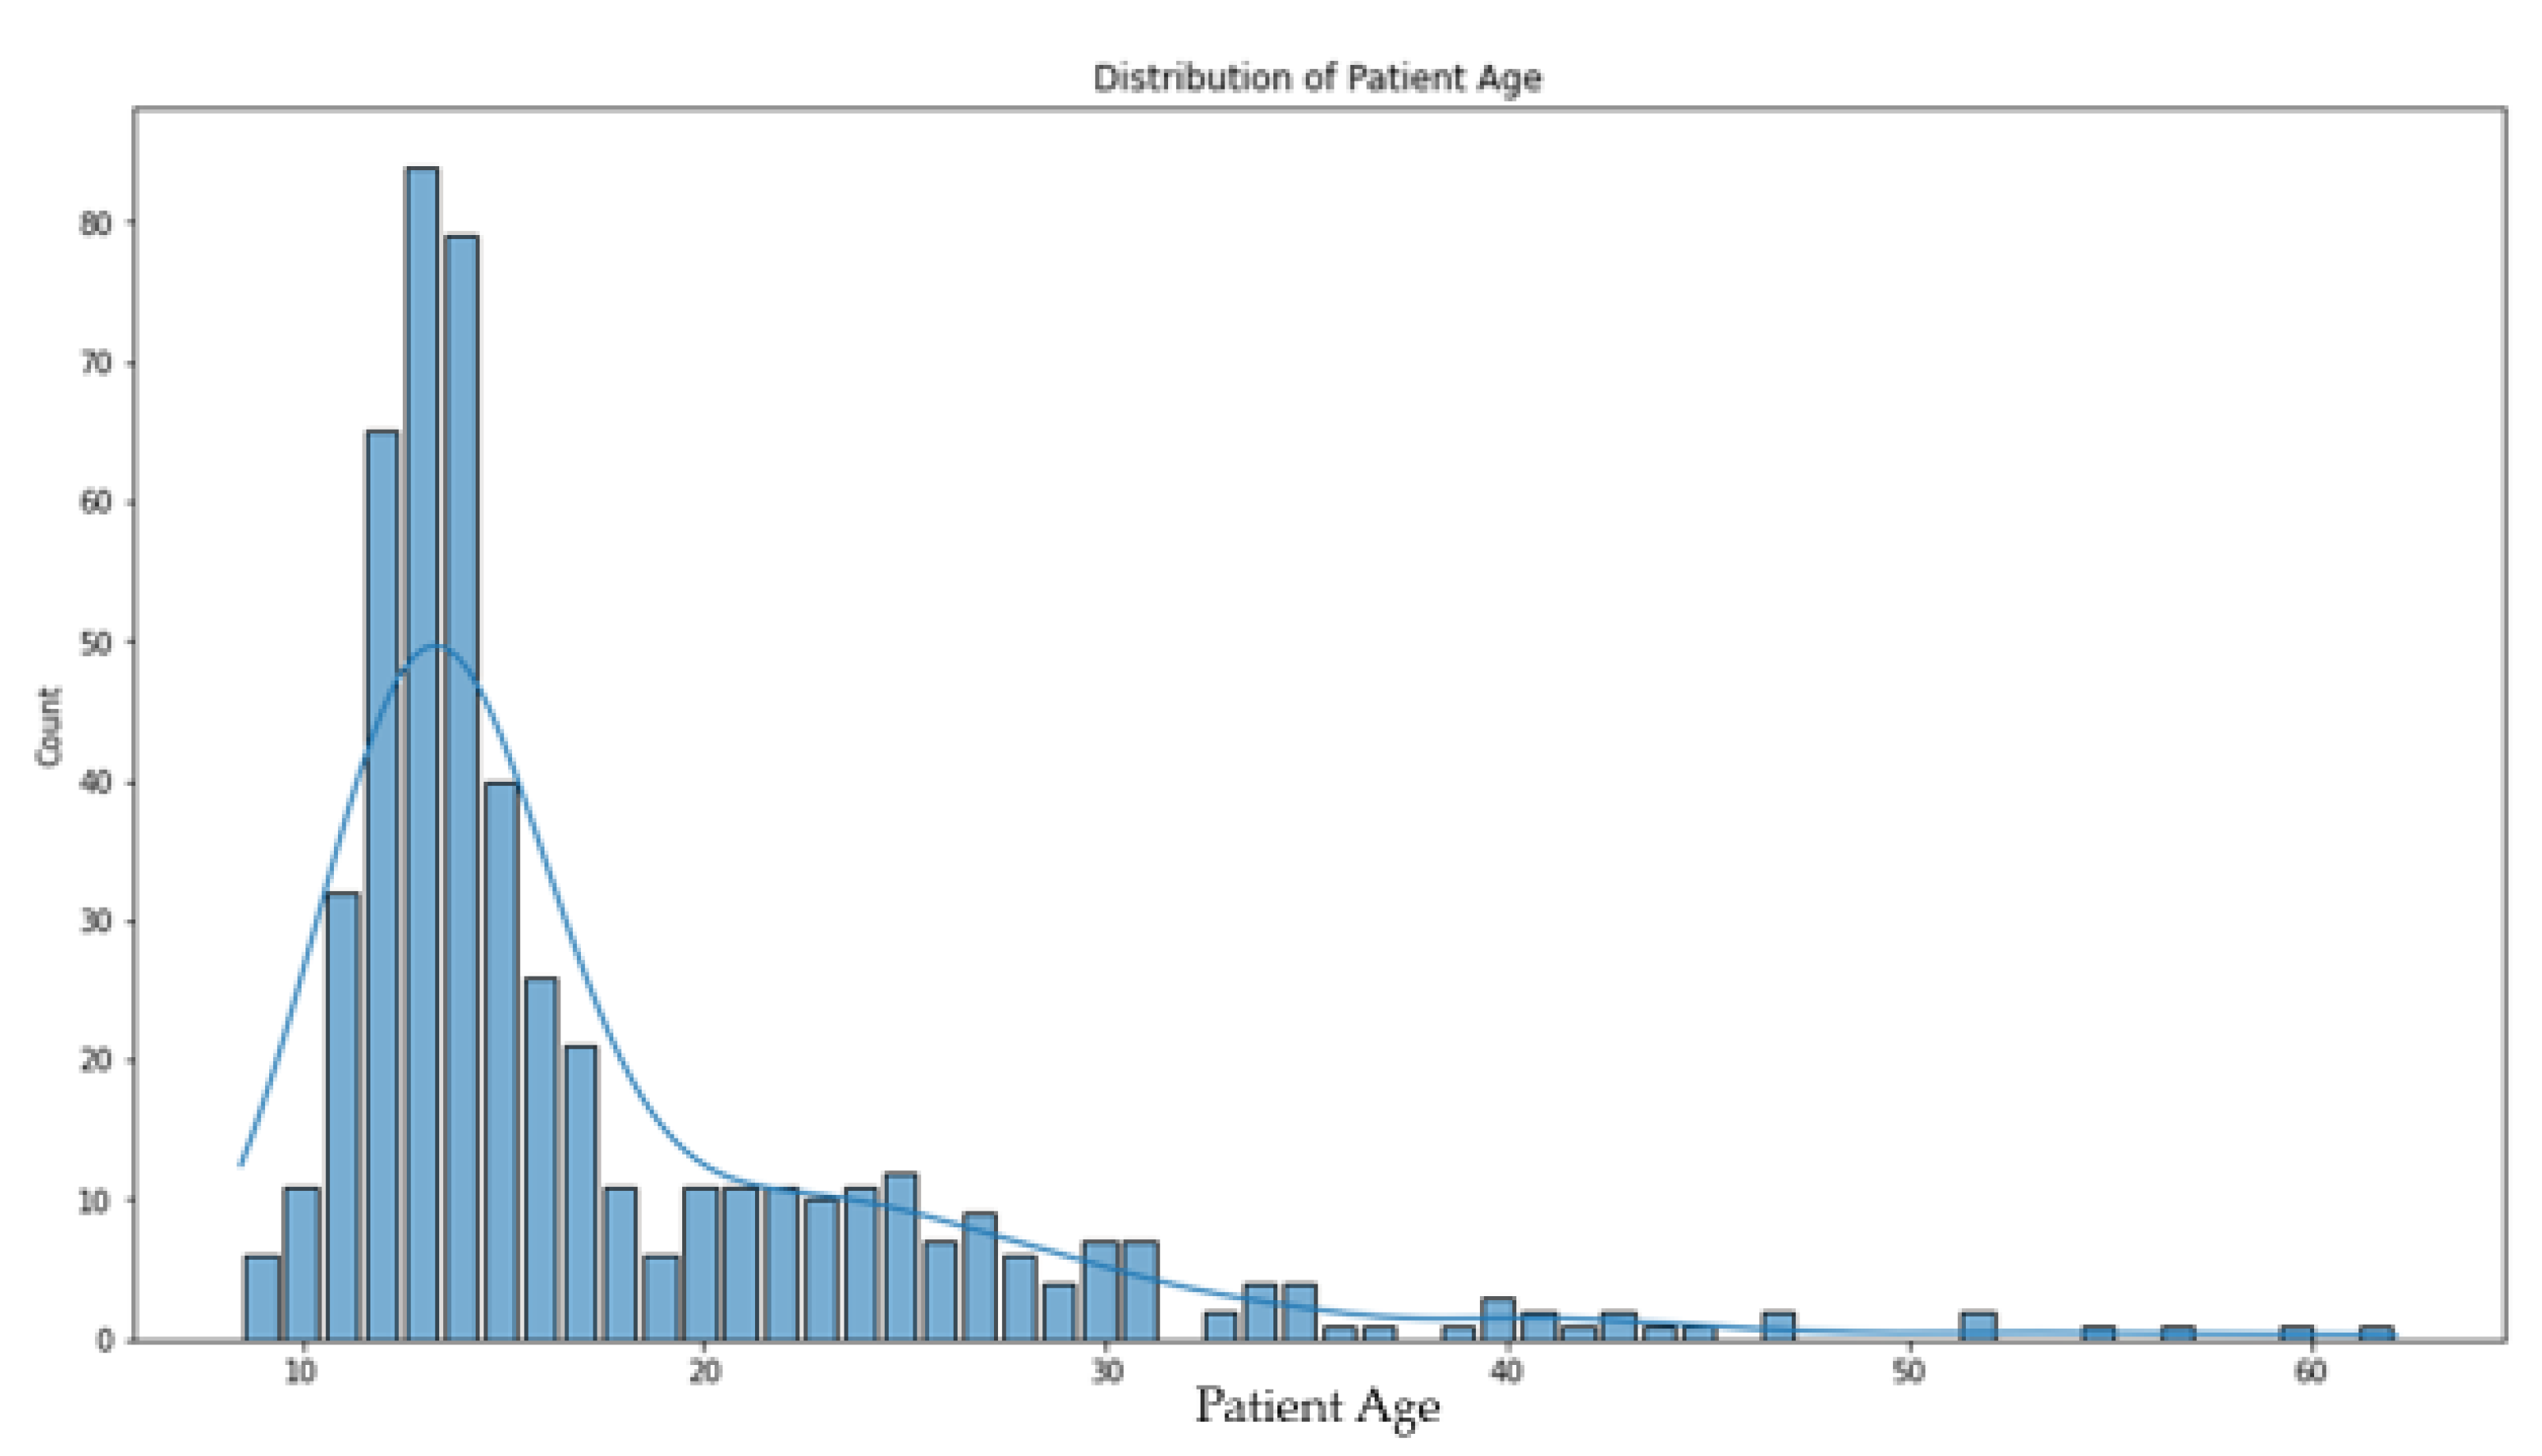
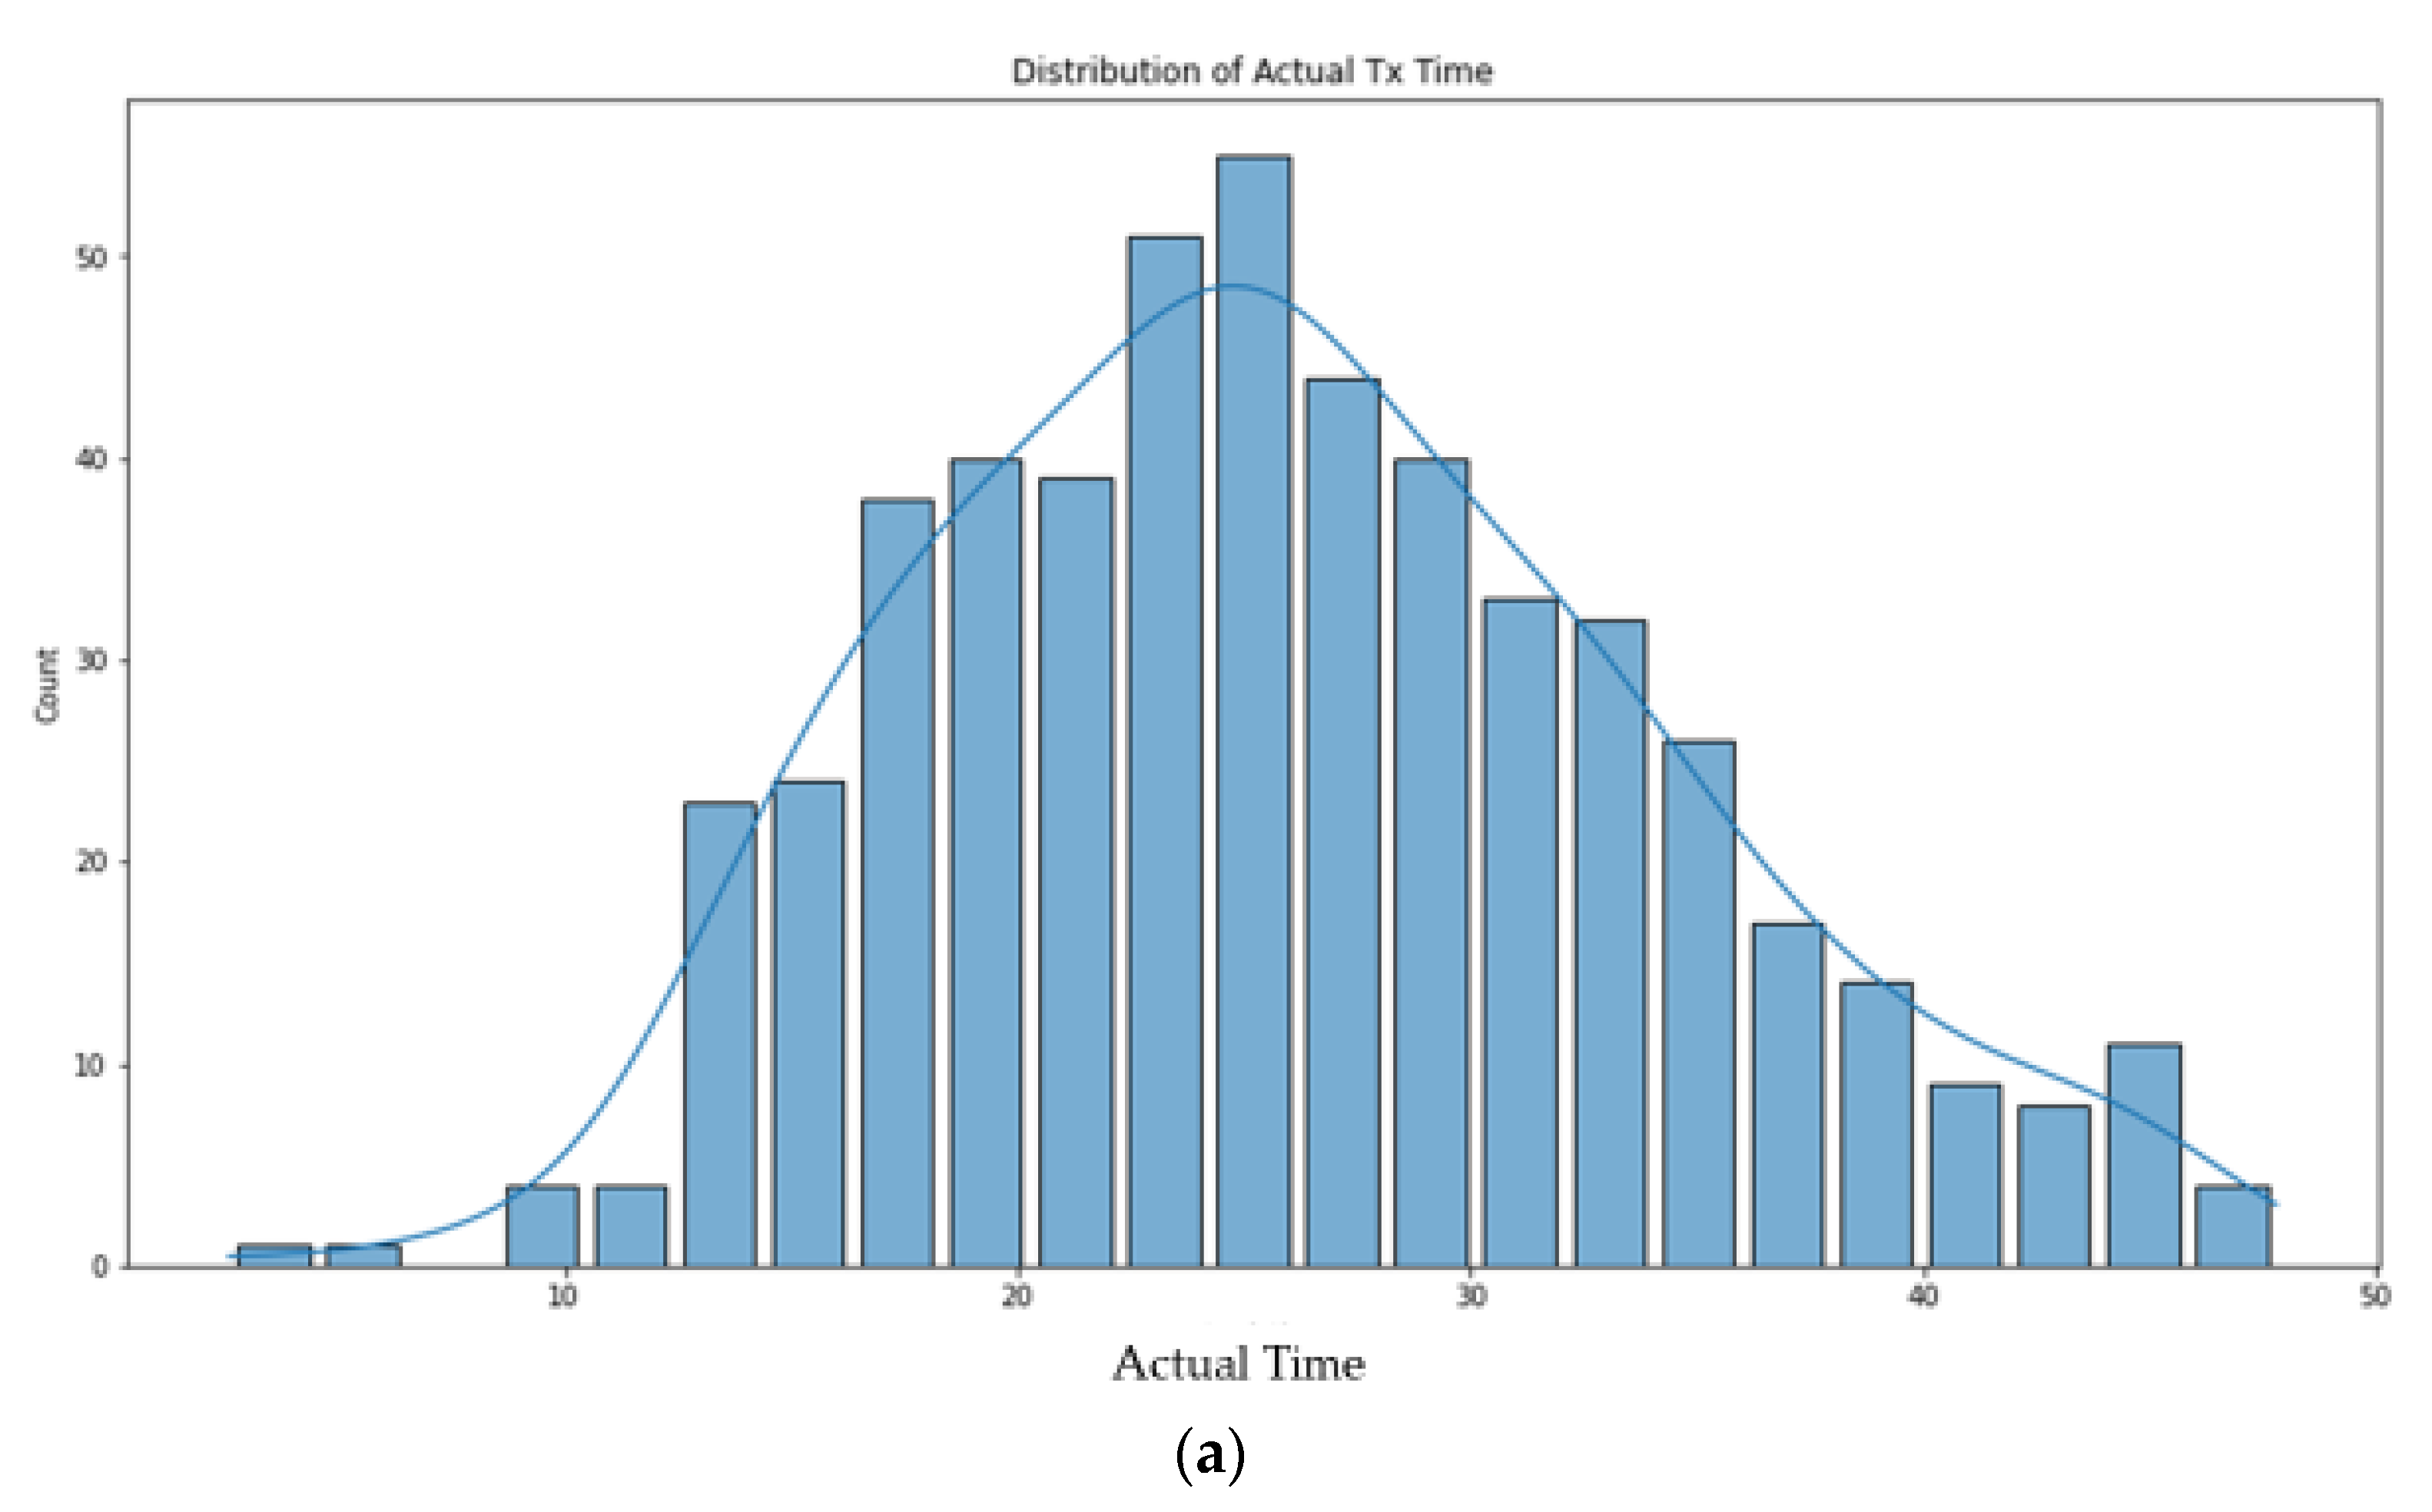
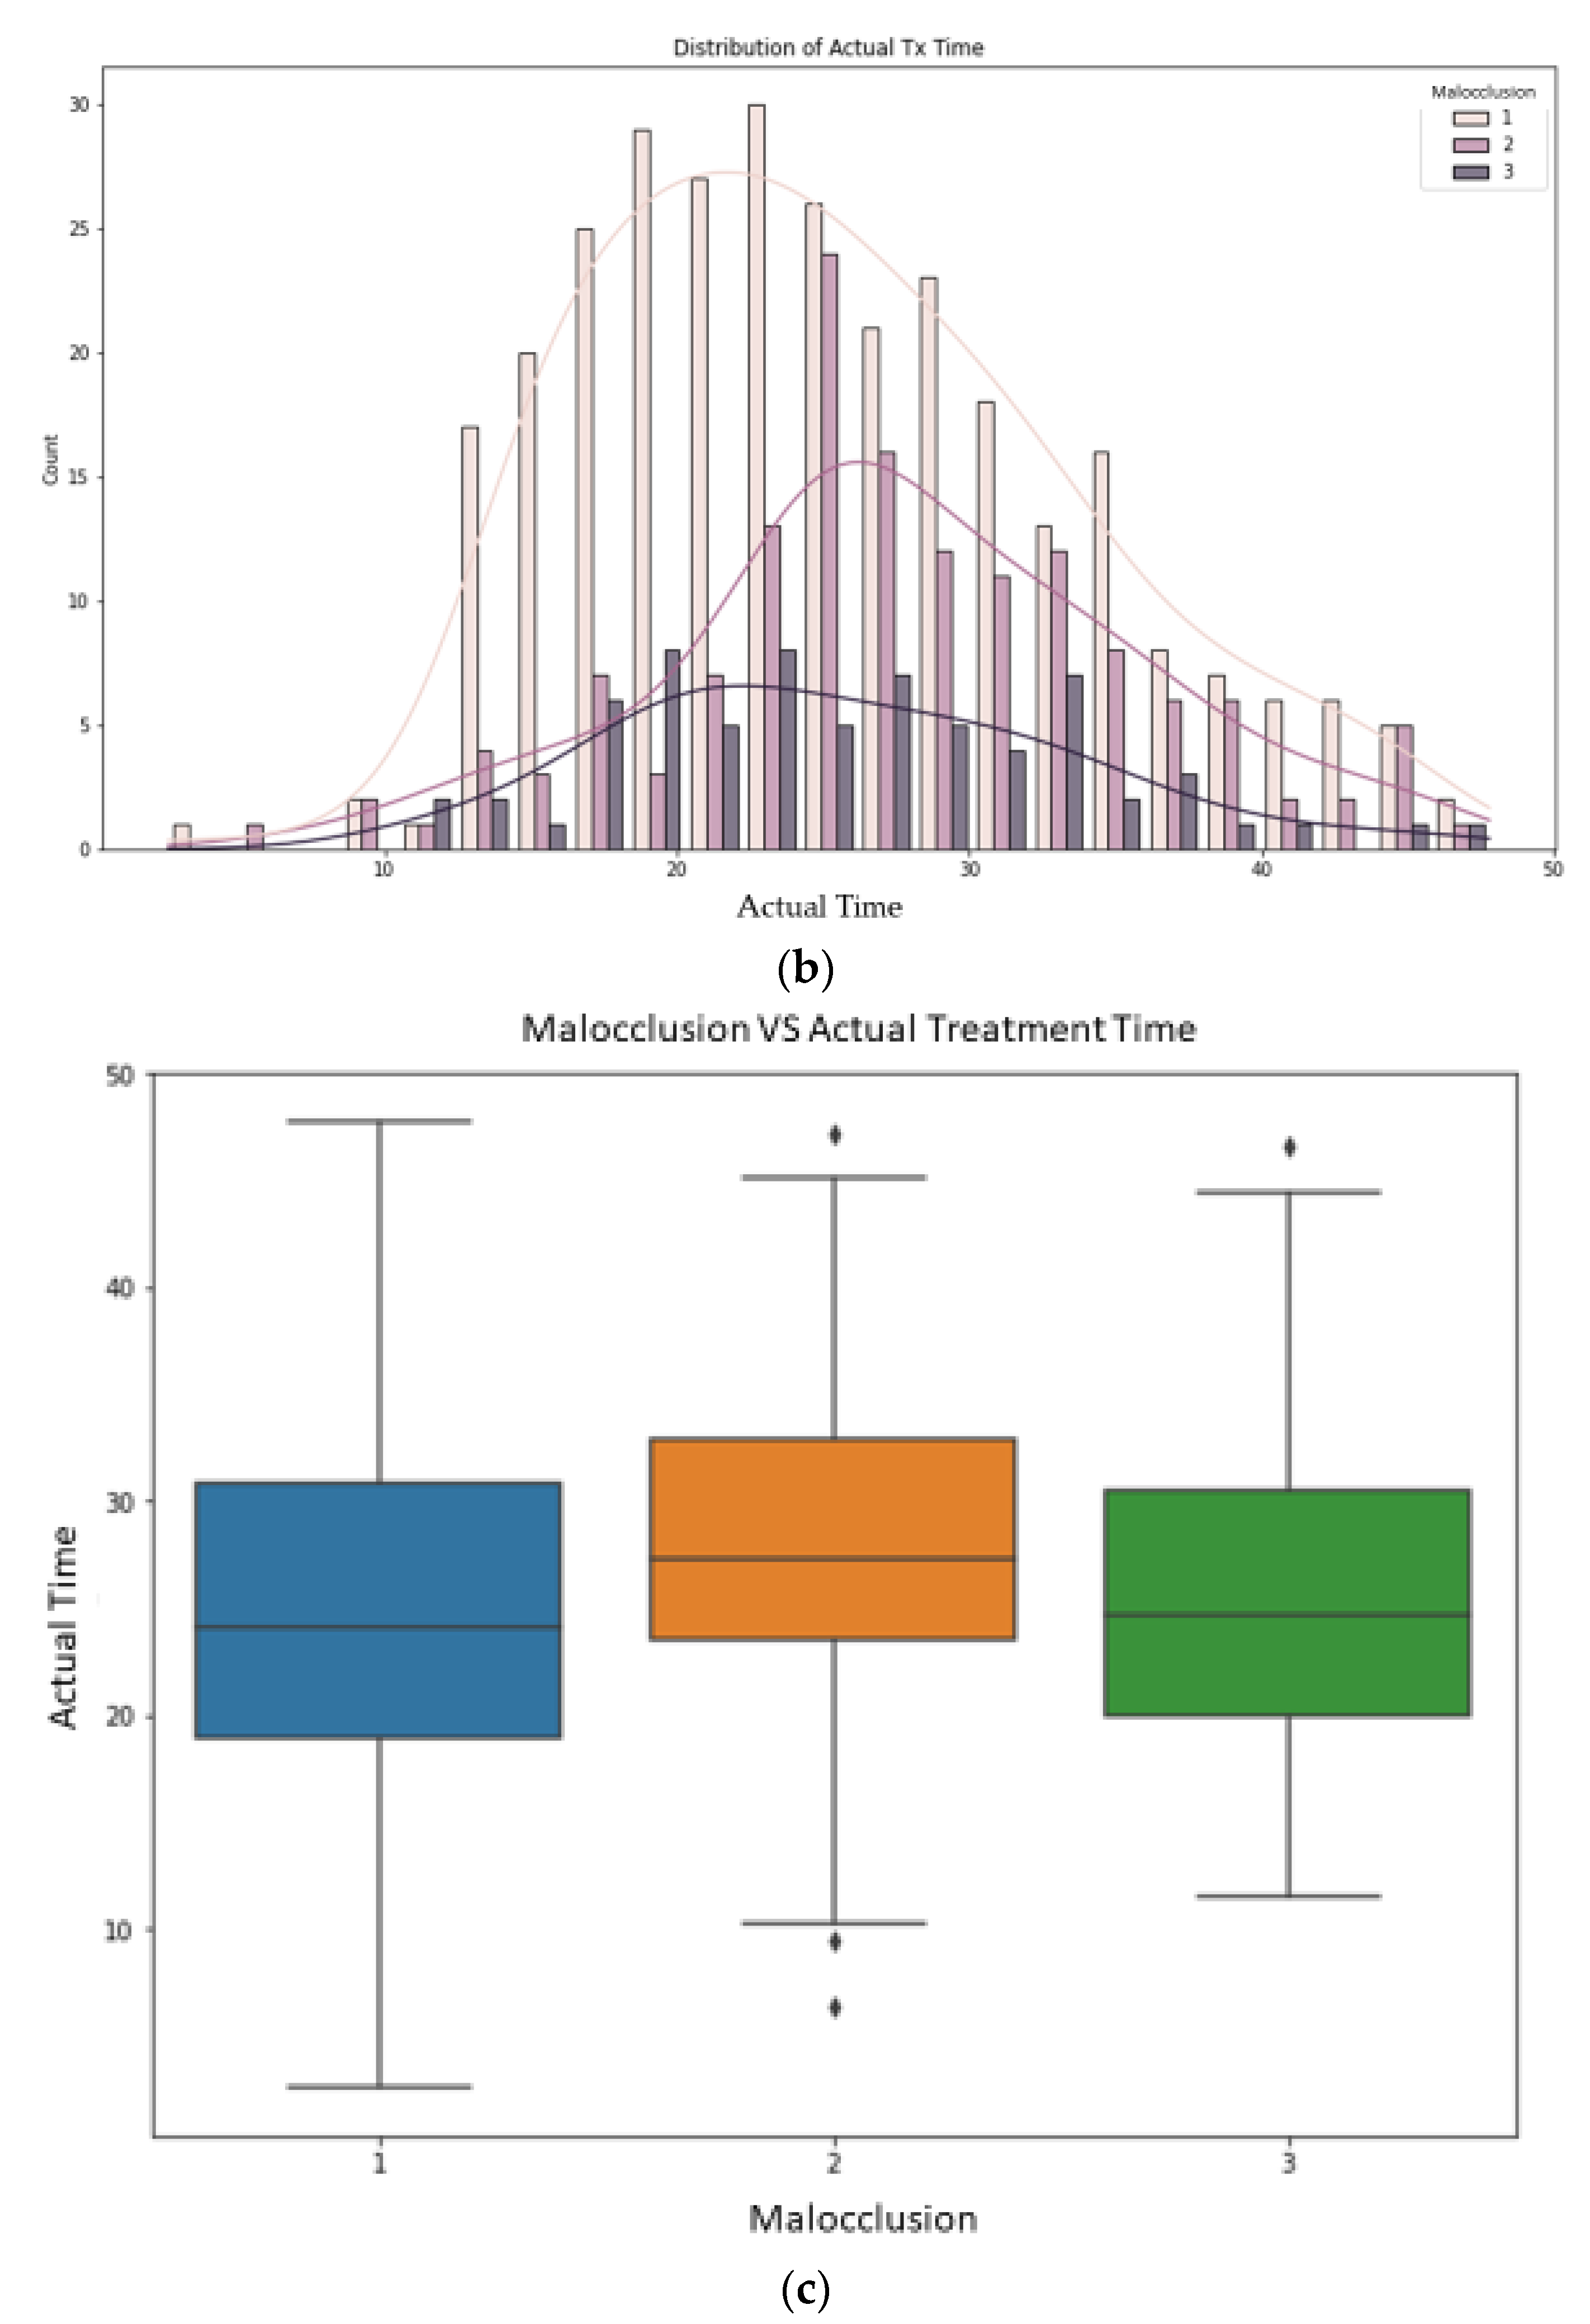
This study used data from 518 patients, 281 females and 237 males. The mean patient age was 17.49 +/− 8.15 years, and the mean patient treatment time was 26.10 +/− 8.15 months; the mean crowding was 3.18 +/− 3.64 mm for the maxillary arch and 2.79 +/− 3.56 mm for the mandibular arch (negative crowding represents spacing); class I malocclusion was present in 299 cases, class II in 145, and class III in 74. The mean treatment difficulty estimated by AI score was 2.53 +/− 0.81. The mean patient commute distance to the orthodontic office was 3.44 +/− 4.979 miles (
Table 1) (
Figure 1 and
Figure 2).
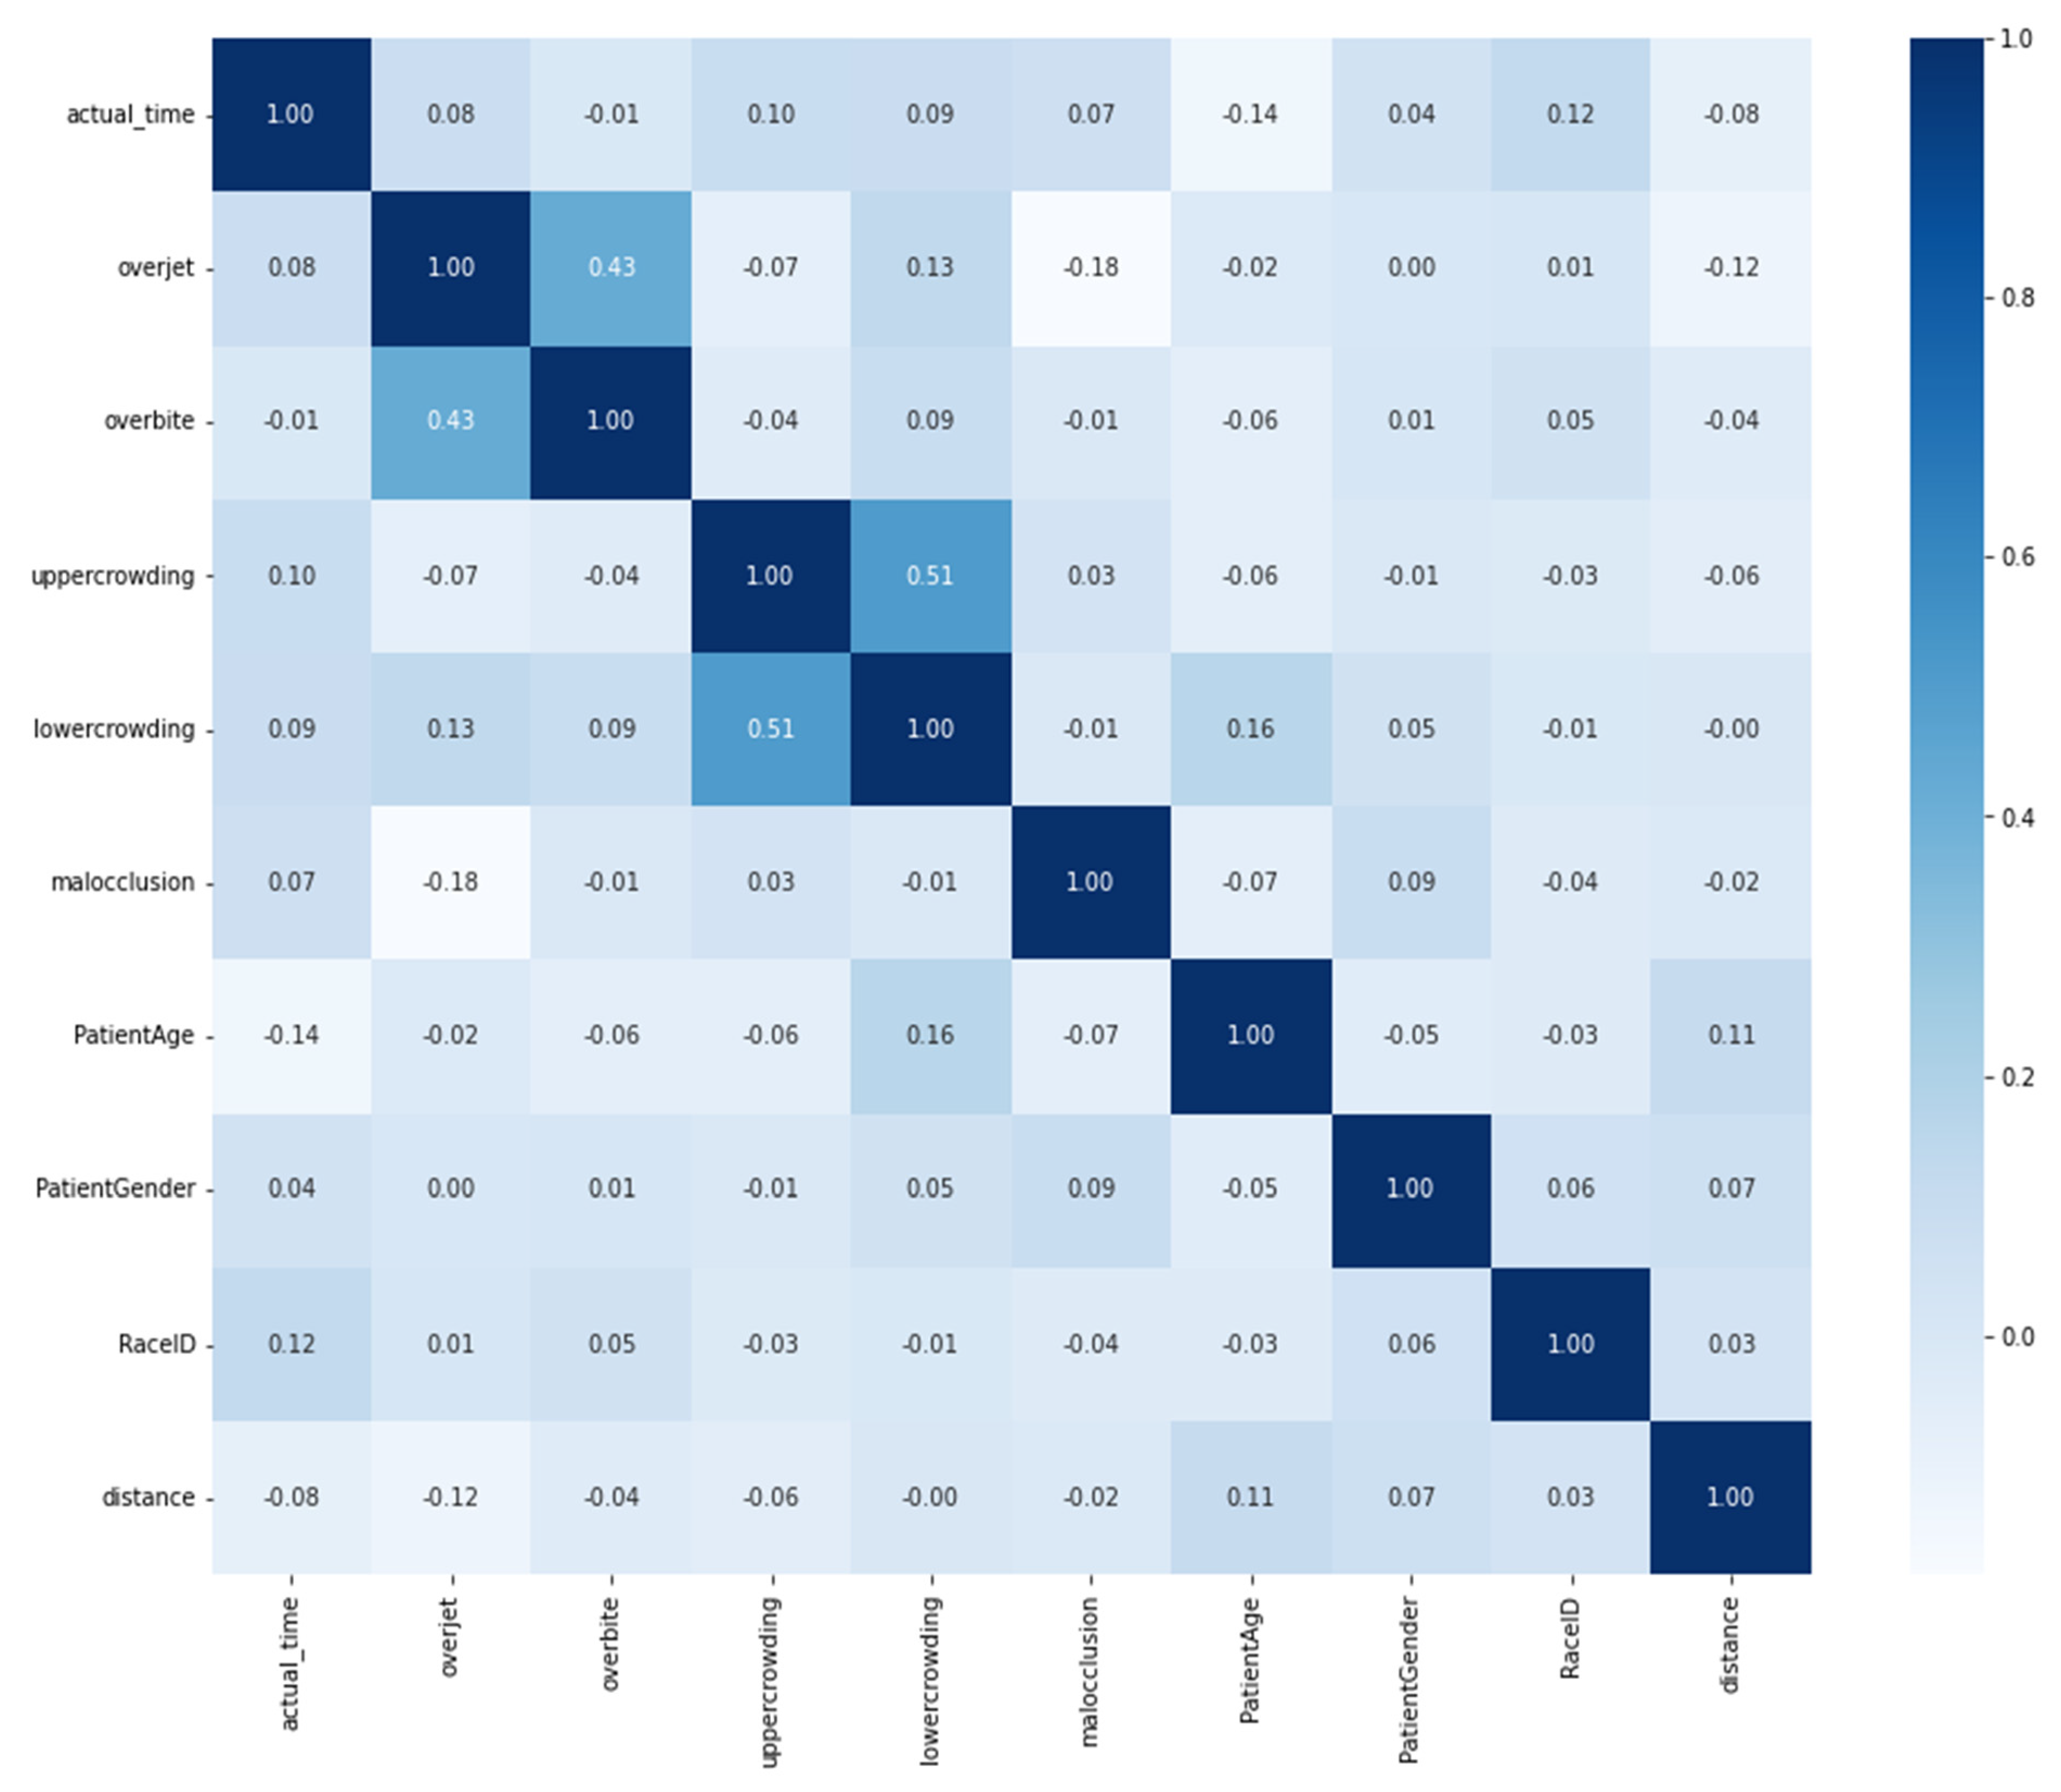
The correlation between the variables shown in
Figure 3 revealed that the overbite and overjet values were highly correlated (0.43). In addition, both maxillary and mandibular crowding values were highly correlated (0.51). All other pairs did not show significant correlations.
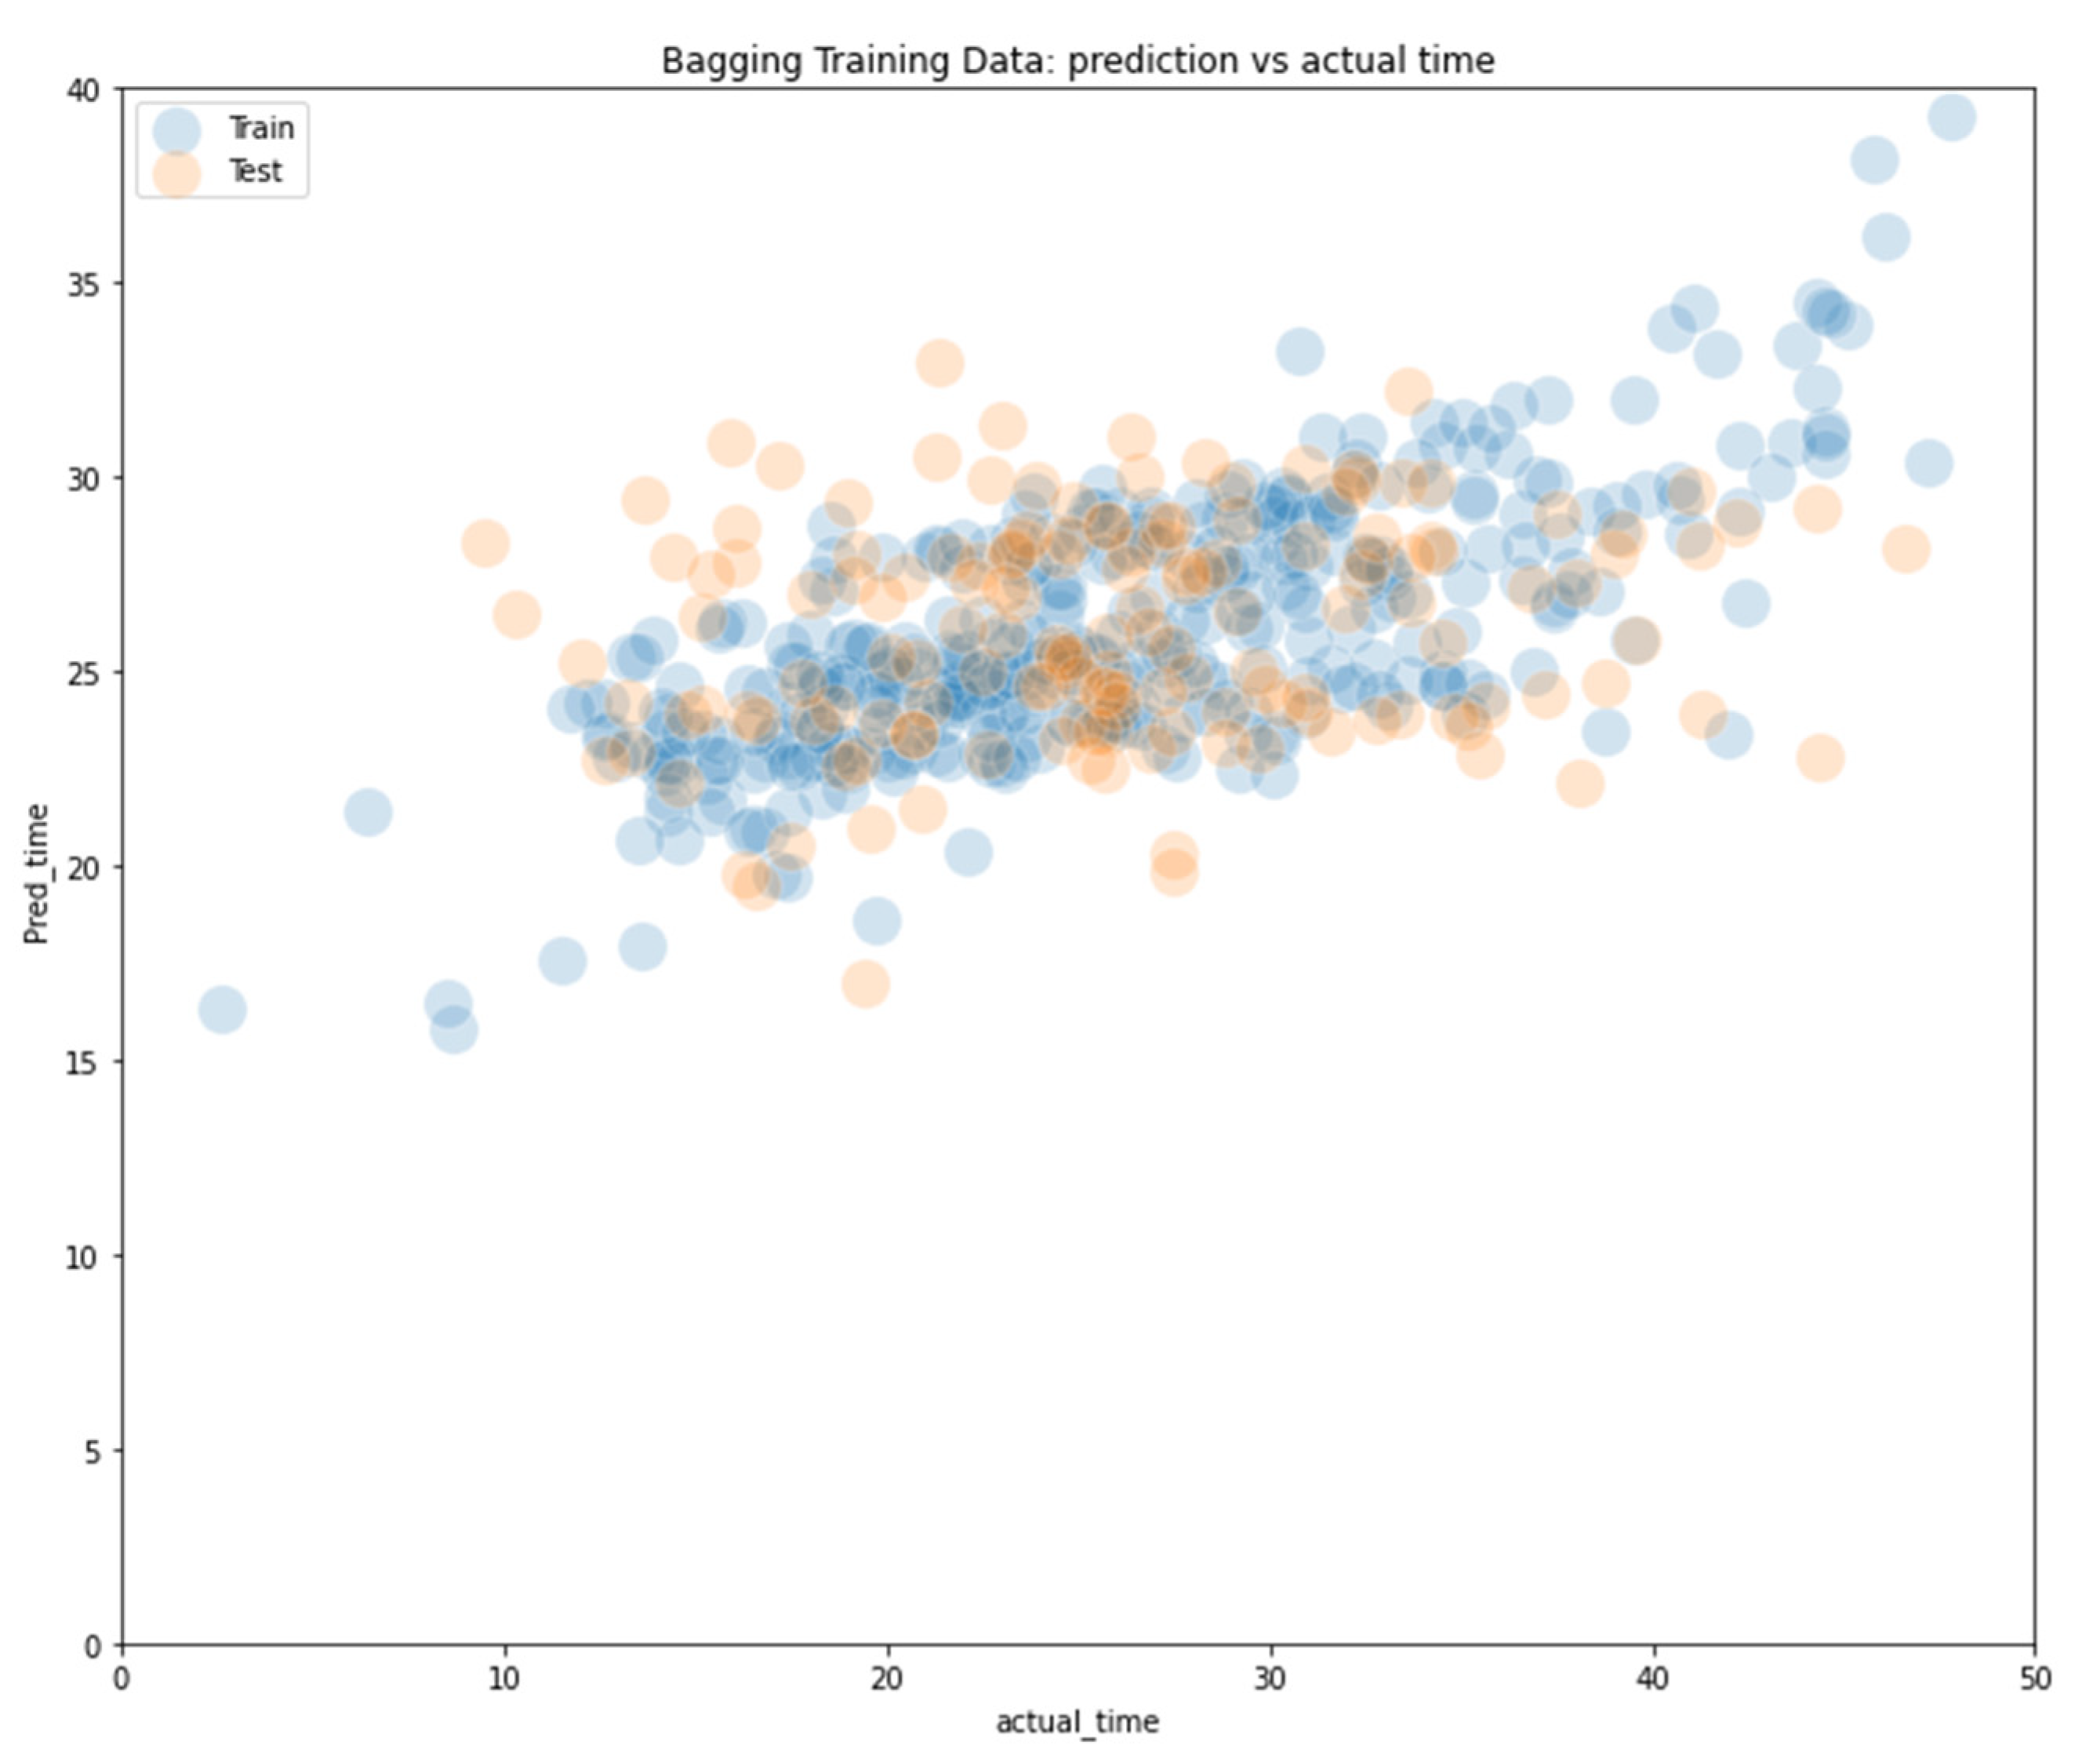
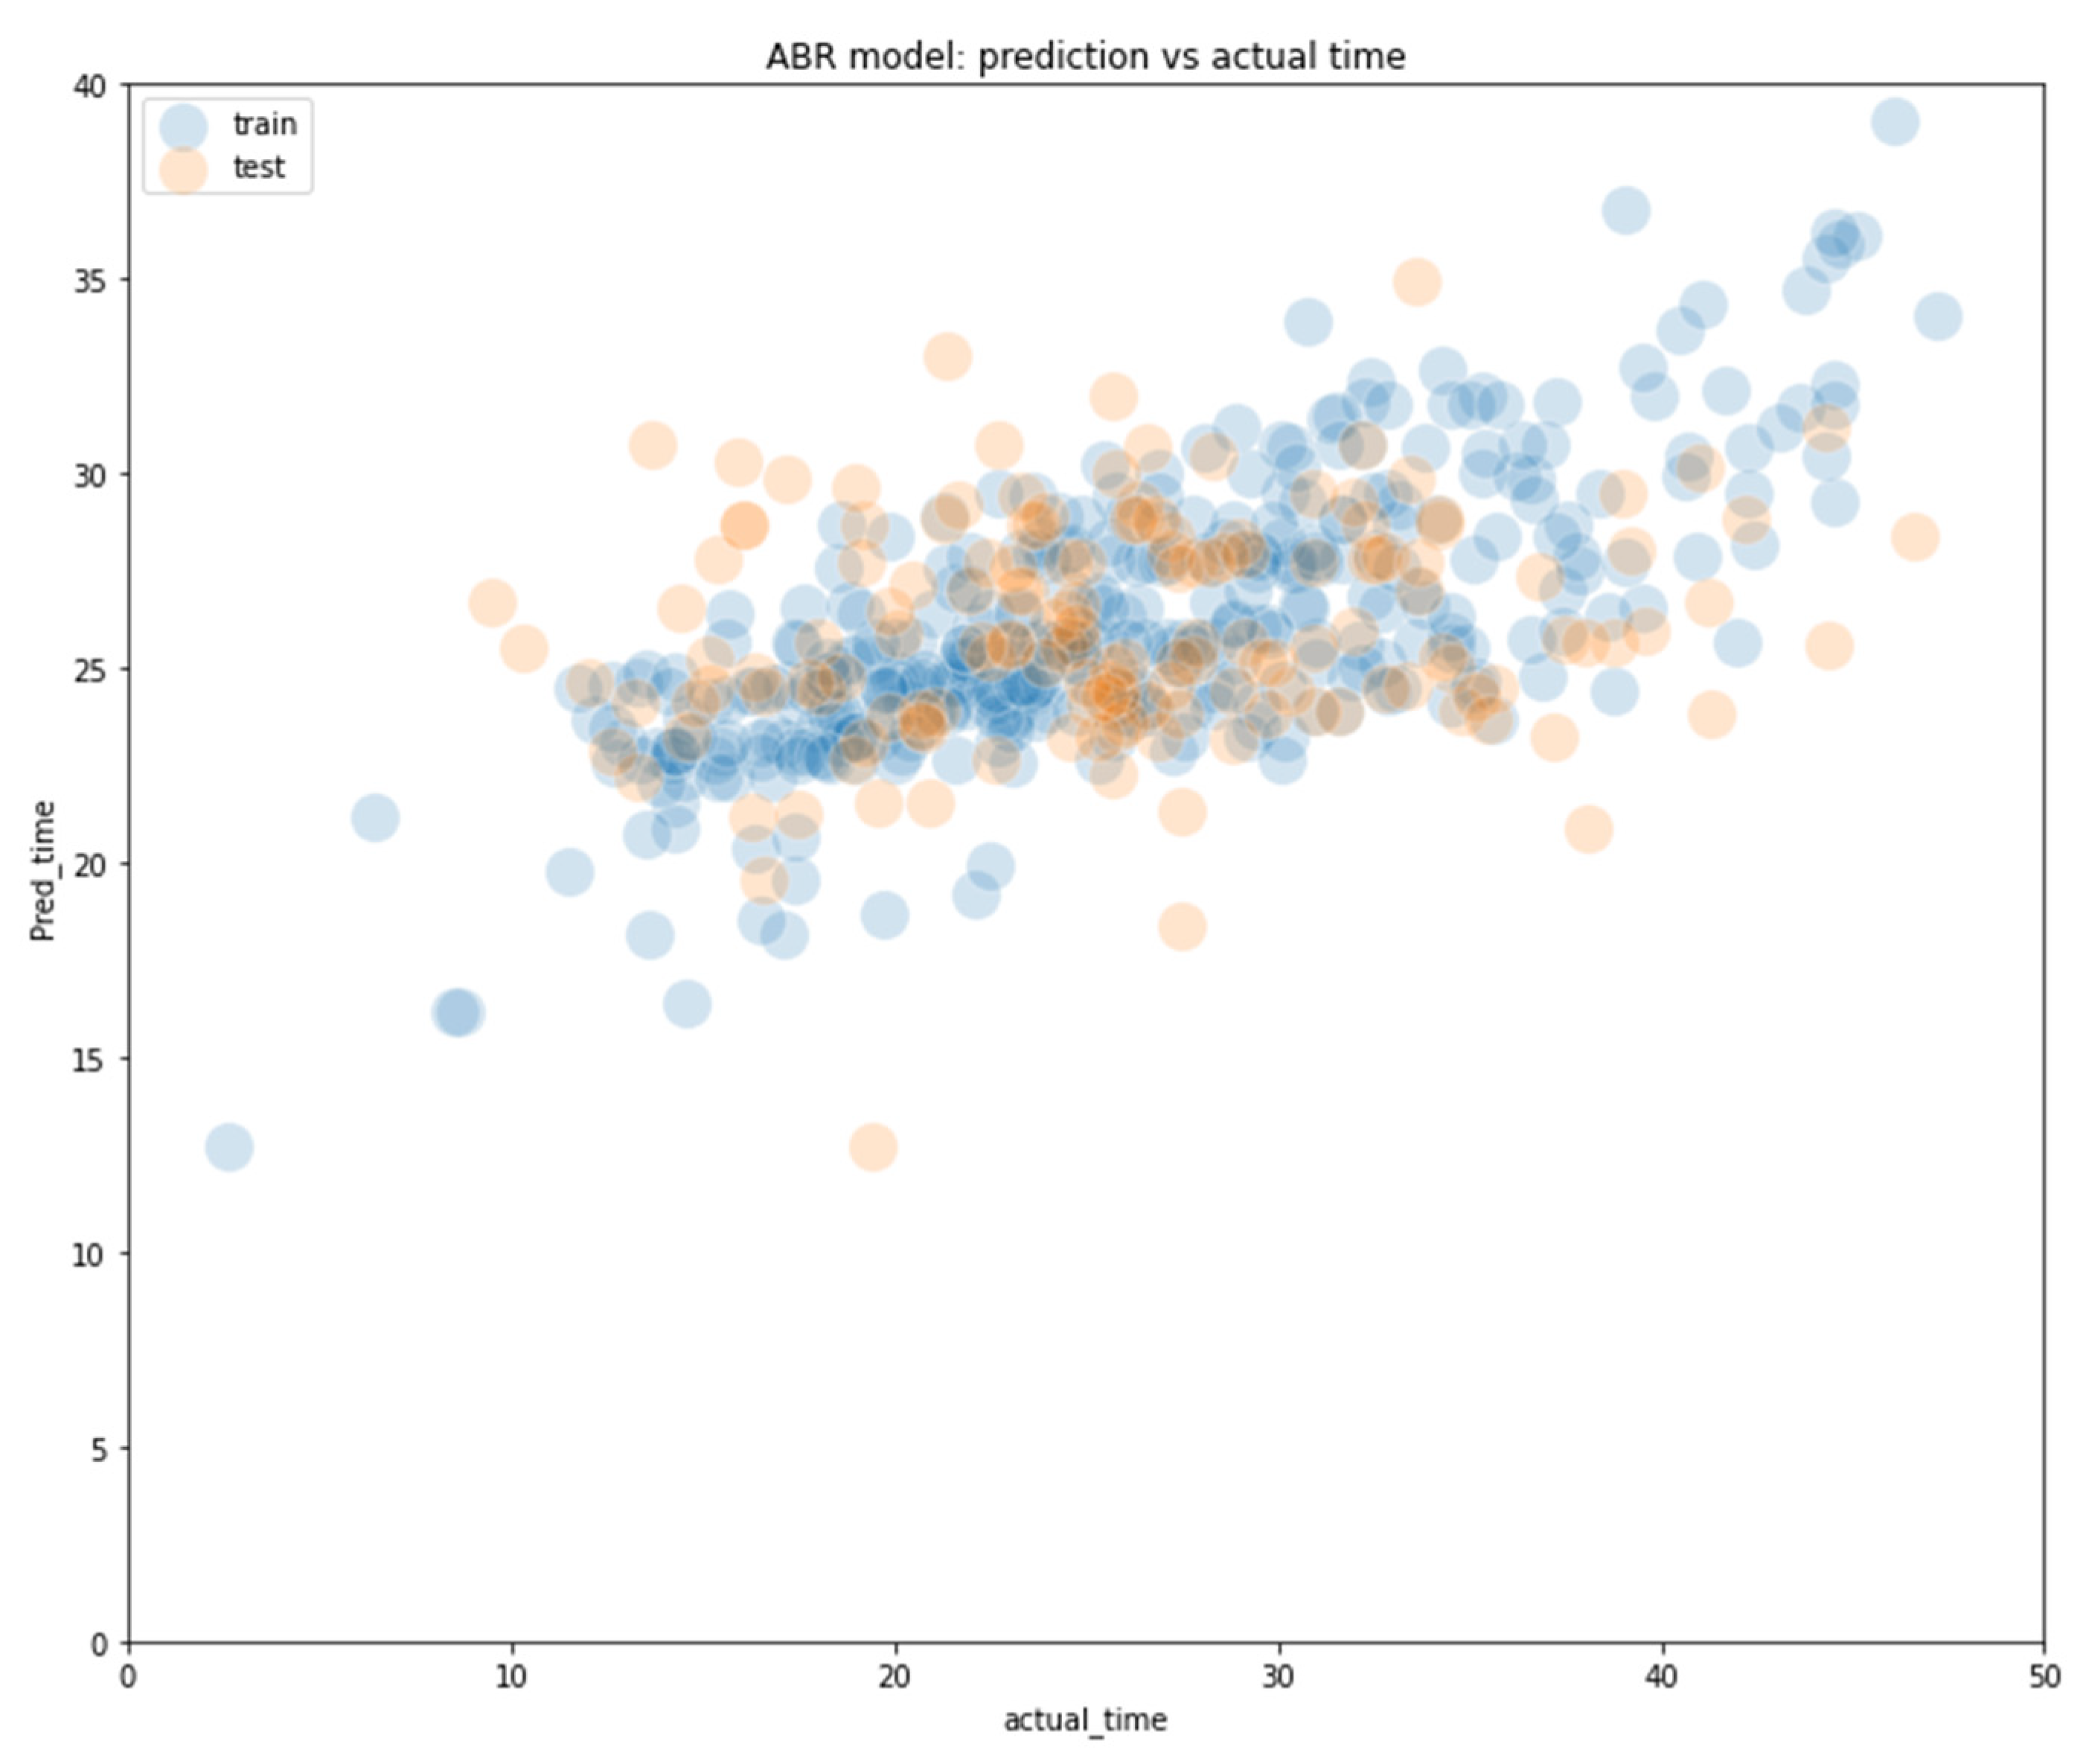
Different ML models behave differently when processing the inputs. Accordingly, the performance of these models also varies. For the ML algorithms evaluated, the following was observed: bagging and adaboost were the best models, with much lower MSE values for both training and testing datasets and a higher R2 score to explain the variances (
Table 2) (
Figure 4 and
Figure 5).
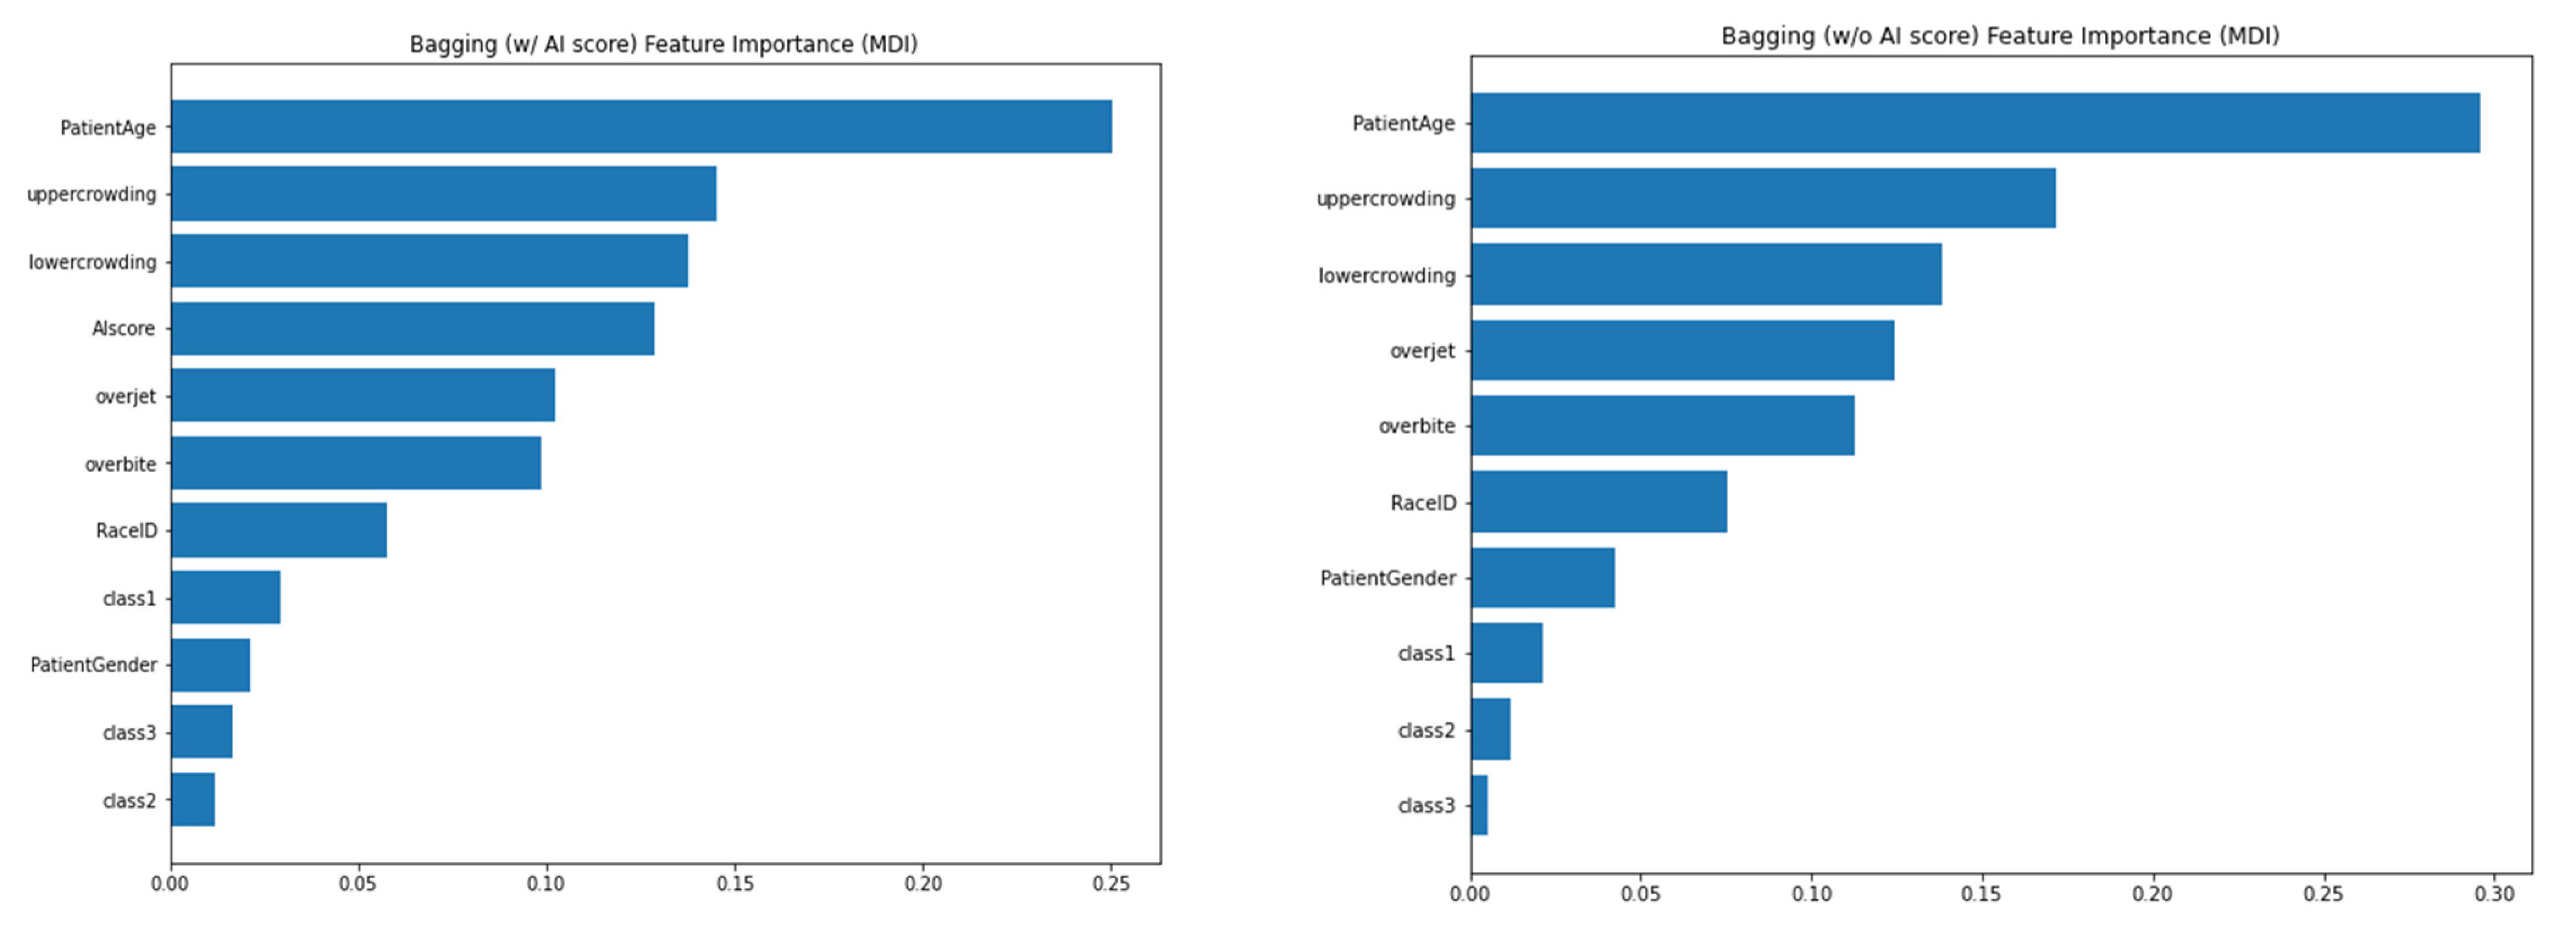
The charts shown in the following figures identify the importance of each indicator in the ML models through feature importance and permutation importance. The R2 scores of between 0.27 and 0.33 were significantly larger than the chance level, making it possible to subtract individual feature importance and permutation importance to probe which features are most predictive.
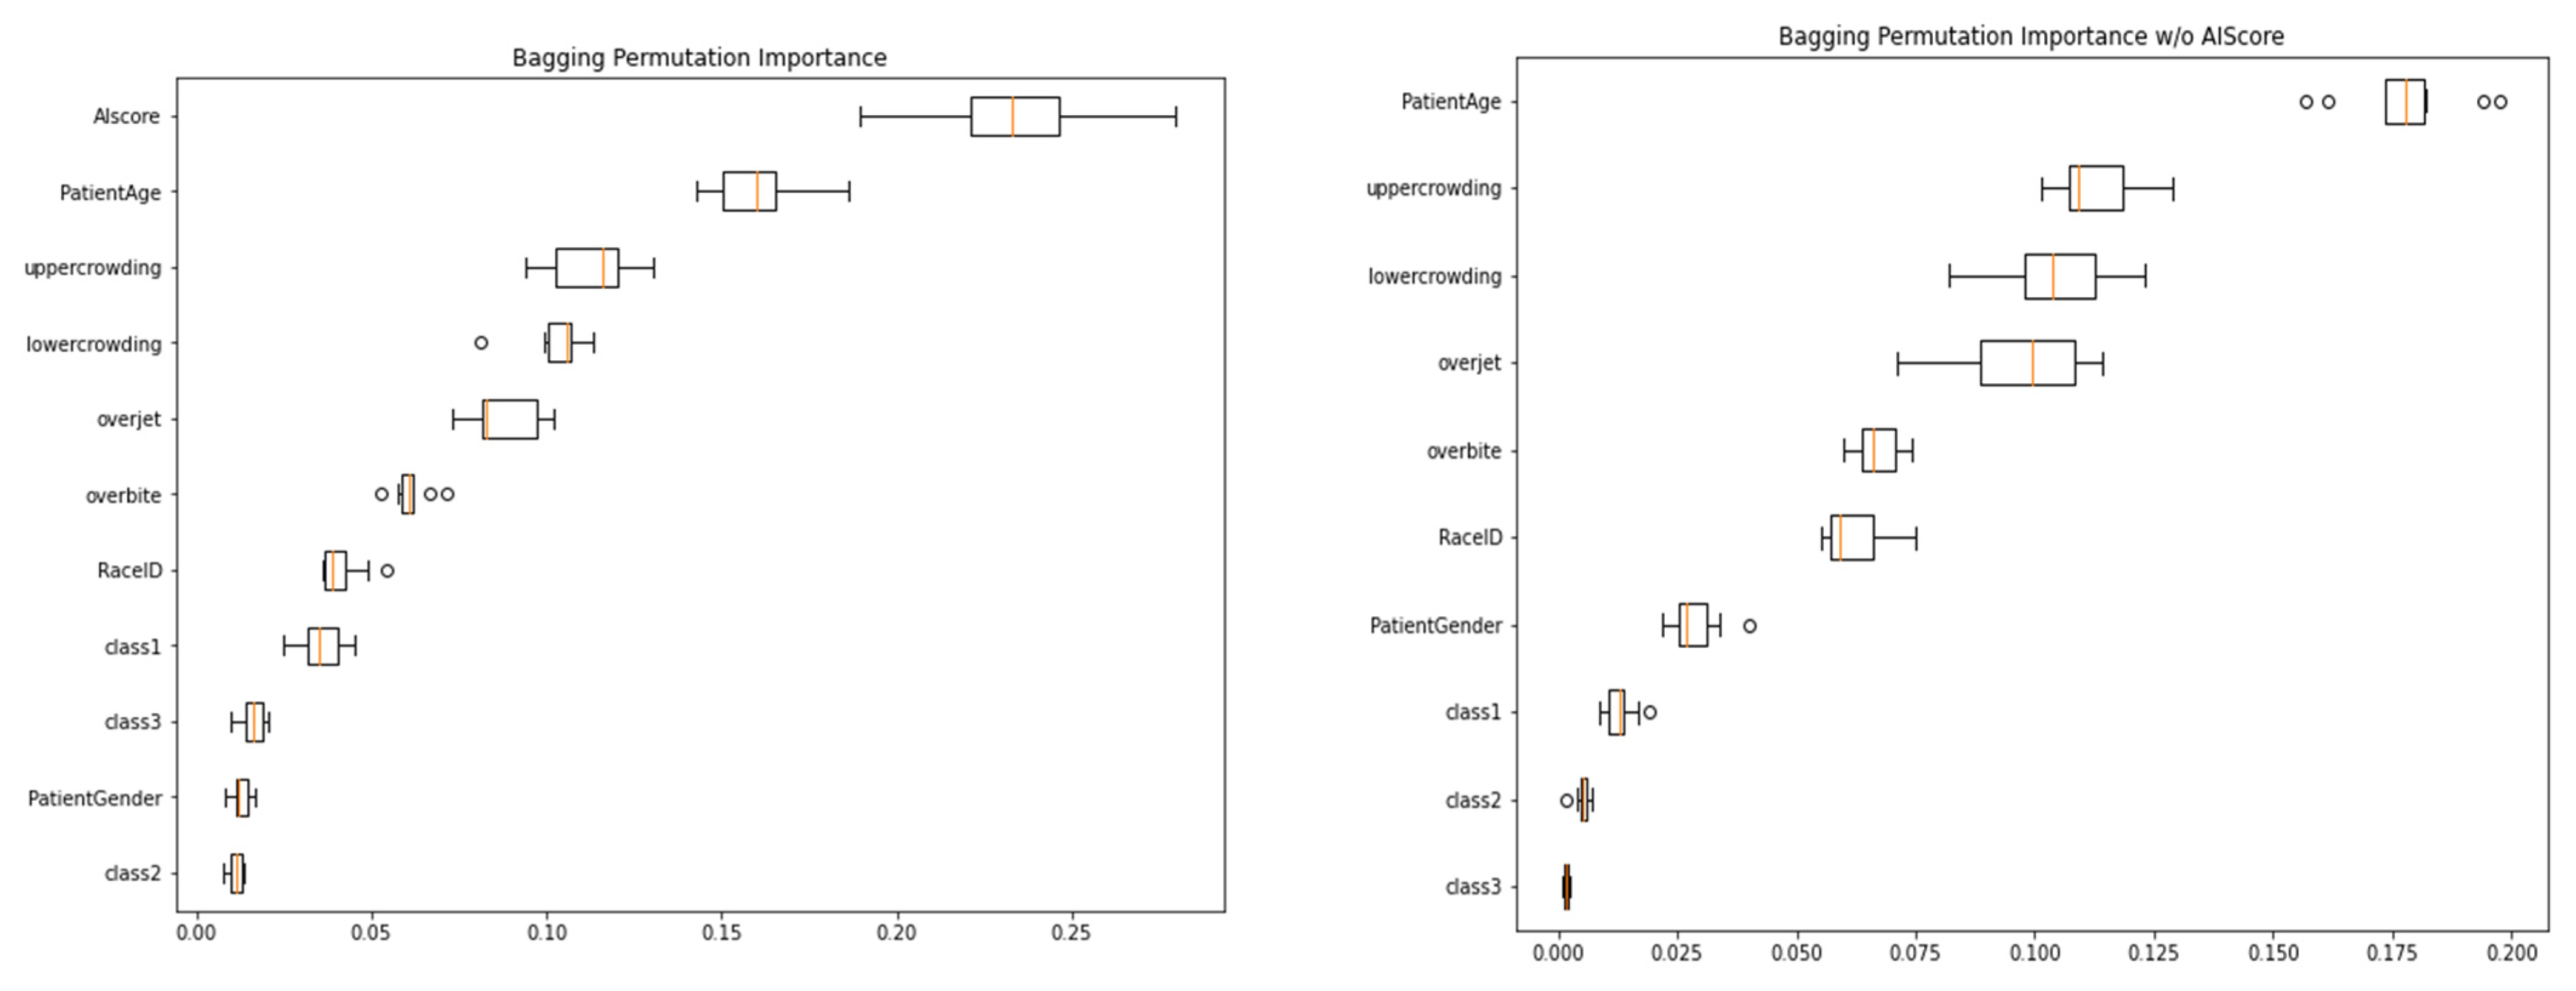
Feature importance, as the name suggests, shows the importance of each feature variable in the model. For a complex such as bagging, random forest, or adaboost, feature importance is the average of all submodels. Permutational importance measures the decrease in a model score when a single feature value is randomly shuffled. This procedure breaks the relationship between the feature and the target. Therefore, this decrease in the model score indicates how much the model depends on the feature.
With or without AI scores, the feature importance shows that patient age, maxillary crowding, and mandibular crowding are the three most predictive components in the Bagging model (
Figure 6). Overjet, overbite, and race identification also have quite a significant feature importance.
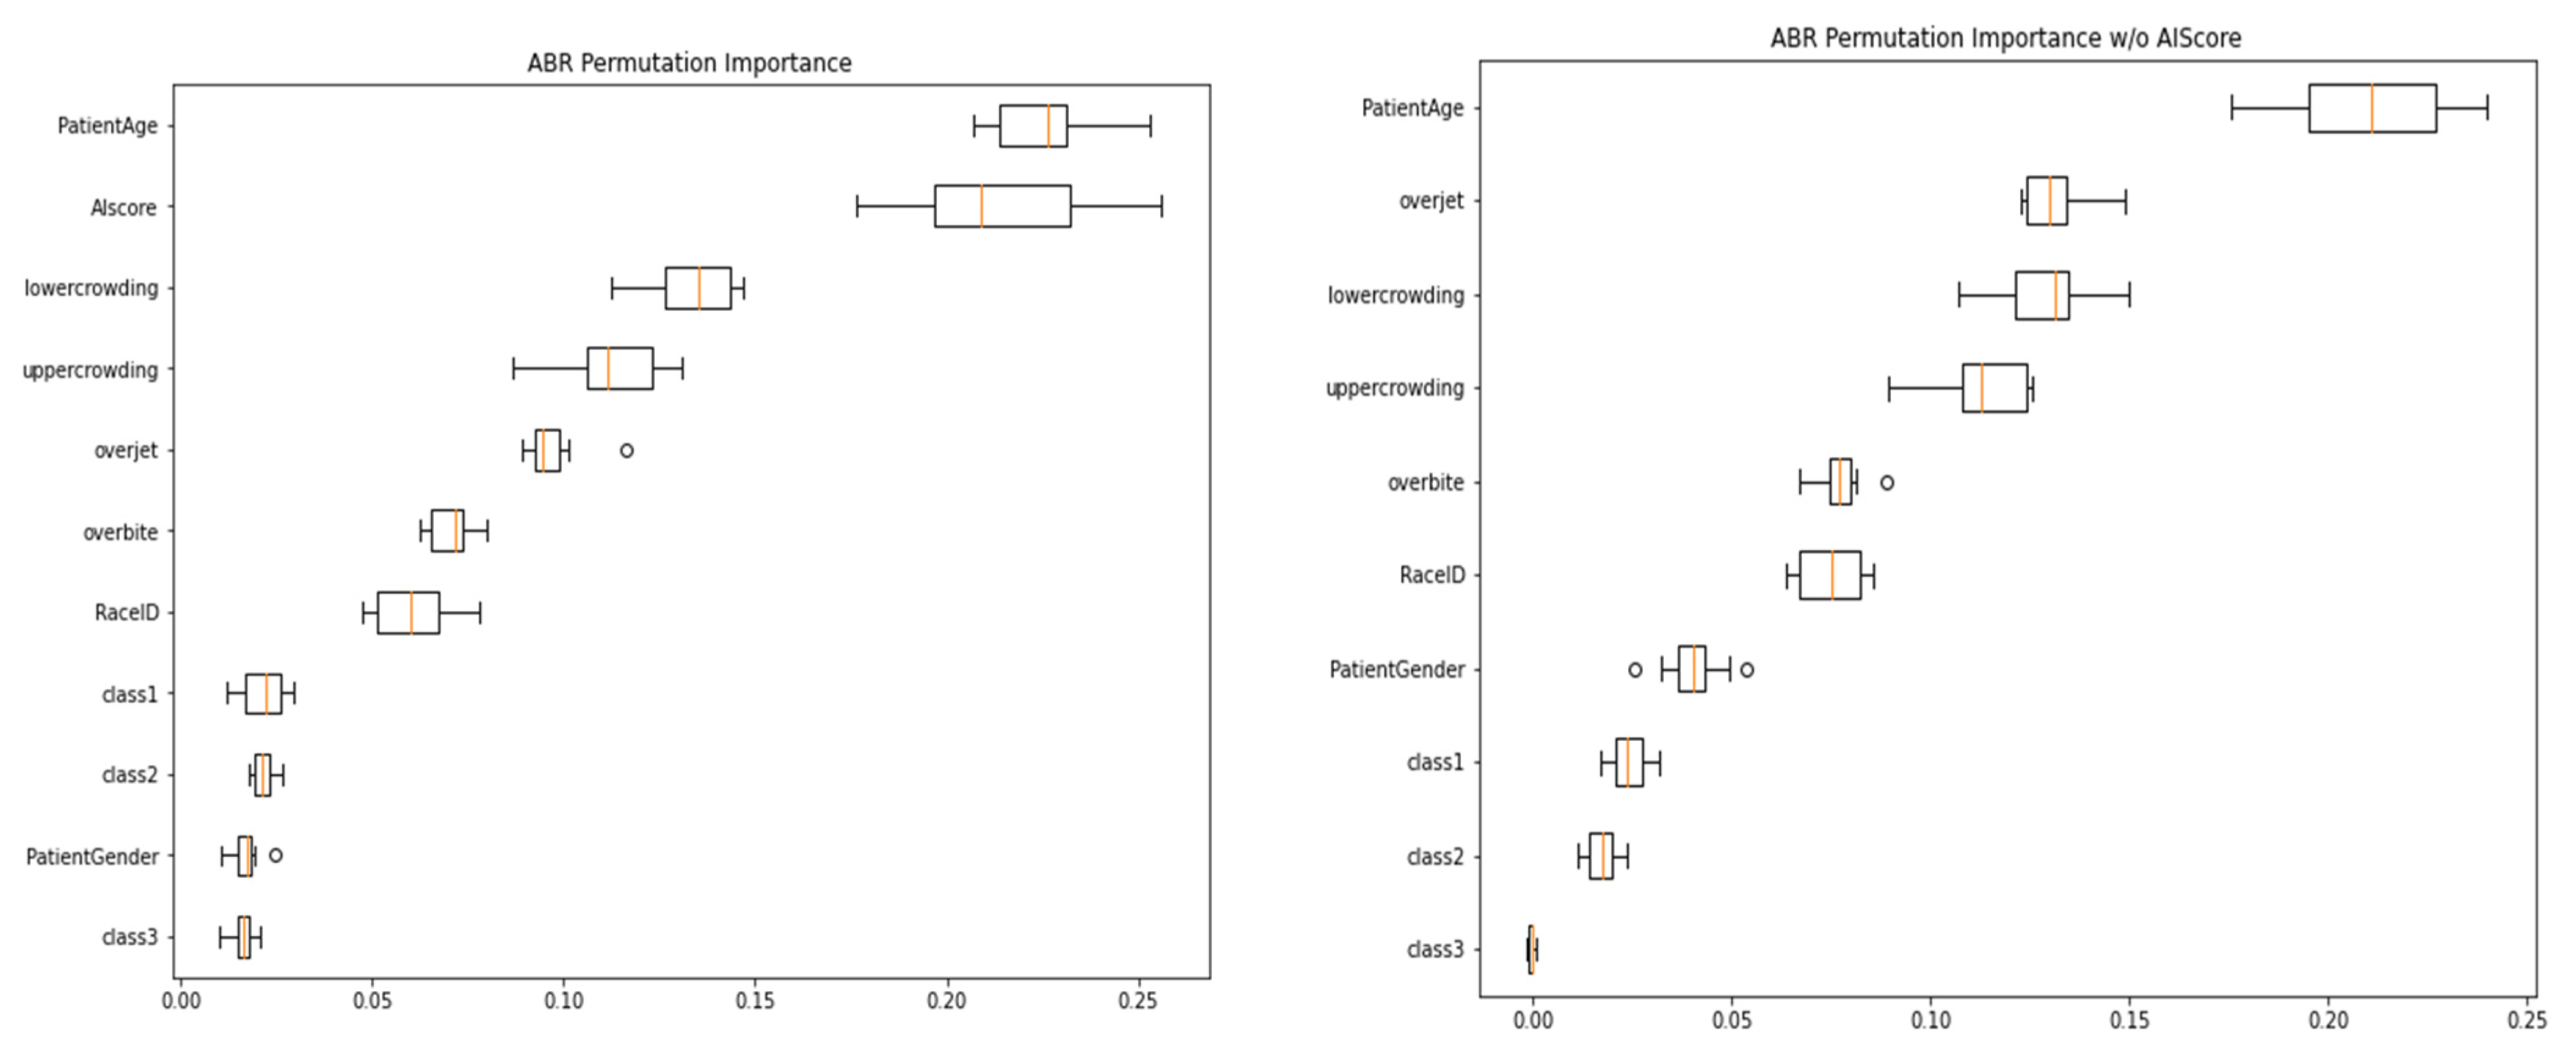
We can see that patient age, maxillary crowding, and mandibular crowding are also the top predictive variables measured by permutation importance in the bagging model (
Figure 7). In addition,
Figure 5 shows that the AI score played an important role in the model including the AI score as a predictive variable.
With results very similar to the bagging model, the feature importance of the adaboost model (with or without an AI score;
Figure 8) shows that patient age, maxillary crowding, and mandibular crowding are the three most predictive components. Overjet, overbite, and race identification also have significant feature importance.
The permutation importance results of adaboost (
Figure 9) show results similar to those of the bagging models, with patient age, maxillary, and mandibular crowding being more significant than other variables. In the adaboost model without an AI score, overjet stood out as the second most important variable.
4. Discussion
The ML models built in this study were used to predict the orthodontic treatment length based on multiple factors, including patient demographics, types of malocclusion, and measures of malocclusion severity such as crowding, overjet, and AI score for treatment difficulty. When we evaluated the performance of different ML models, we found that the bagging and adaboost models had better performance than the other ML models tested. Bagging, or bootstrap aggregating, is based on the decision tree model. It generates multiple samples of training data via bootstrapping, training a deeper decision tree on each sample of training data, then outputs the averaged results of all models, i.e., aggregating. Compared to regular decision tree models, bagging enjoys the benefits of high expressiveness and low variances. Adaboost is a complex boosting decision tree regression model that uses multiple subsequent trees of residuals to build a combined, e.g., boosting. Adaboost assigns larger weights to outliers in each iteration of the boosting model building. This makes Adaboost especially efficient compared to other boosting methods [
15]. We tested the performance of the ML models with and without the AI score [
13]. Adding the AI score improved the ML models’ performances and this was especially evident with the bagging and adaboost models. The AI score is based on malocclusion detection and assessment by AI from clinical images, including crowding, spacing, deep bite, open bite, and crossbite [
13]. AI score is a novel method for assessing the case difficulty, confirming that the more difficult the case, the longer the treatment duration.
We assessed the feature importance for the ML predictive models; patient age, maxillary crowding, and mandibular crowding were the top features. Patient age could be a contributing factor due to the biological differences between adolescents and adults. Vayda et al., in 1995, reported significant differences in treatment length between adults and adolescents [
16]. Other studies reported no significant differences in treatment length between adults and adolescents [
17]. Additional parameters contribute to treatment length prediction by ML. For example, crowding, overjet, overbite, and AI score are all measures for the severity of the malocclusion; previous studies found that quantitative malocclusion indices, such as peer assessment rating (PAR) and the objective grading system (OGS), correlated with treatment length [
3]. Other factors were found to have less contribution, such as gender, race, and malocclusion classification into Class I, II, and III; this aligns with previous findings [
1,
3,
7]. Unexplored factors may also contribute to treatment length, including the orthodontic technique employed, operator skill and experience, and patient compliance. The impact of these factors is unknown and needs to be examined.
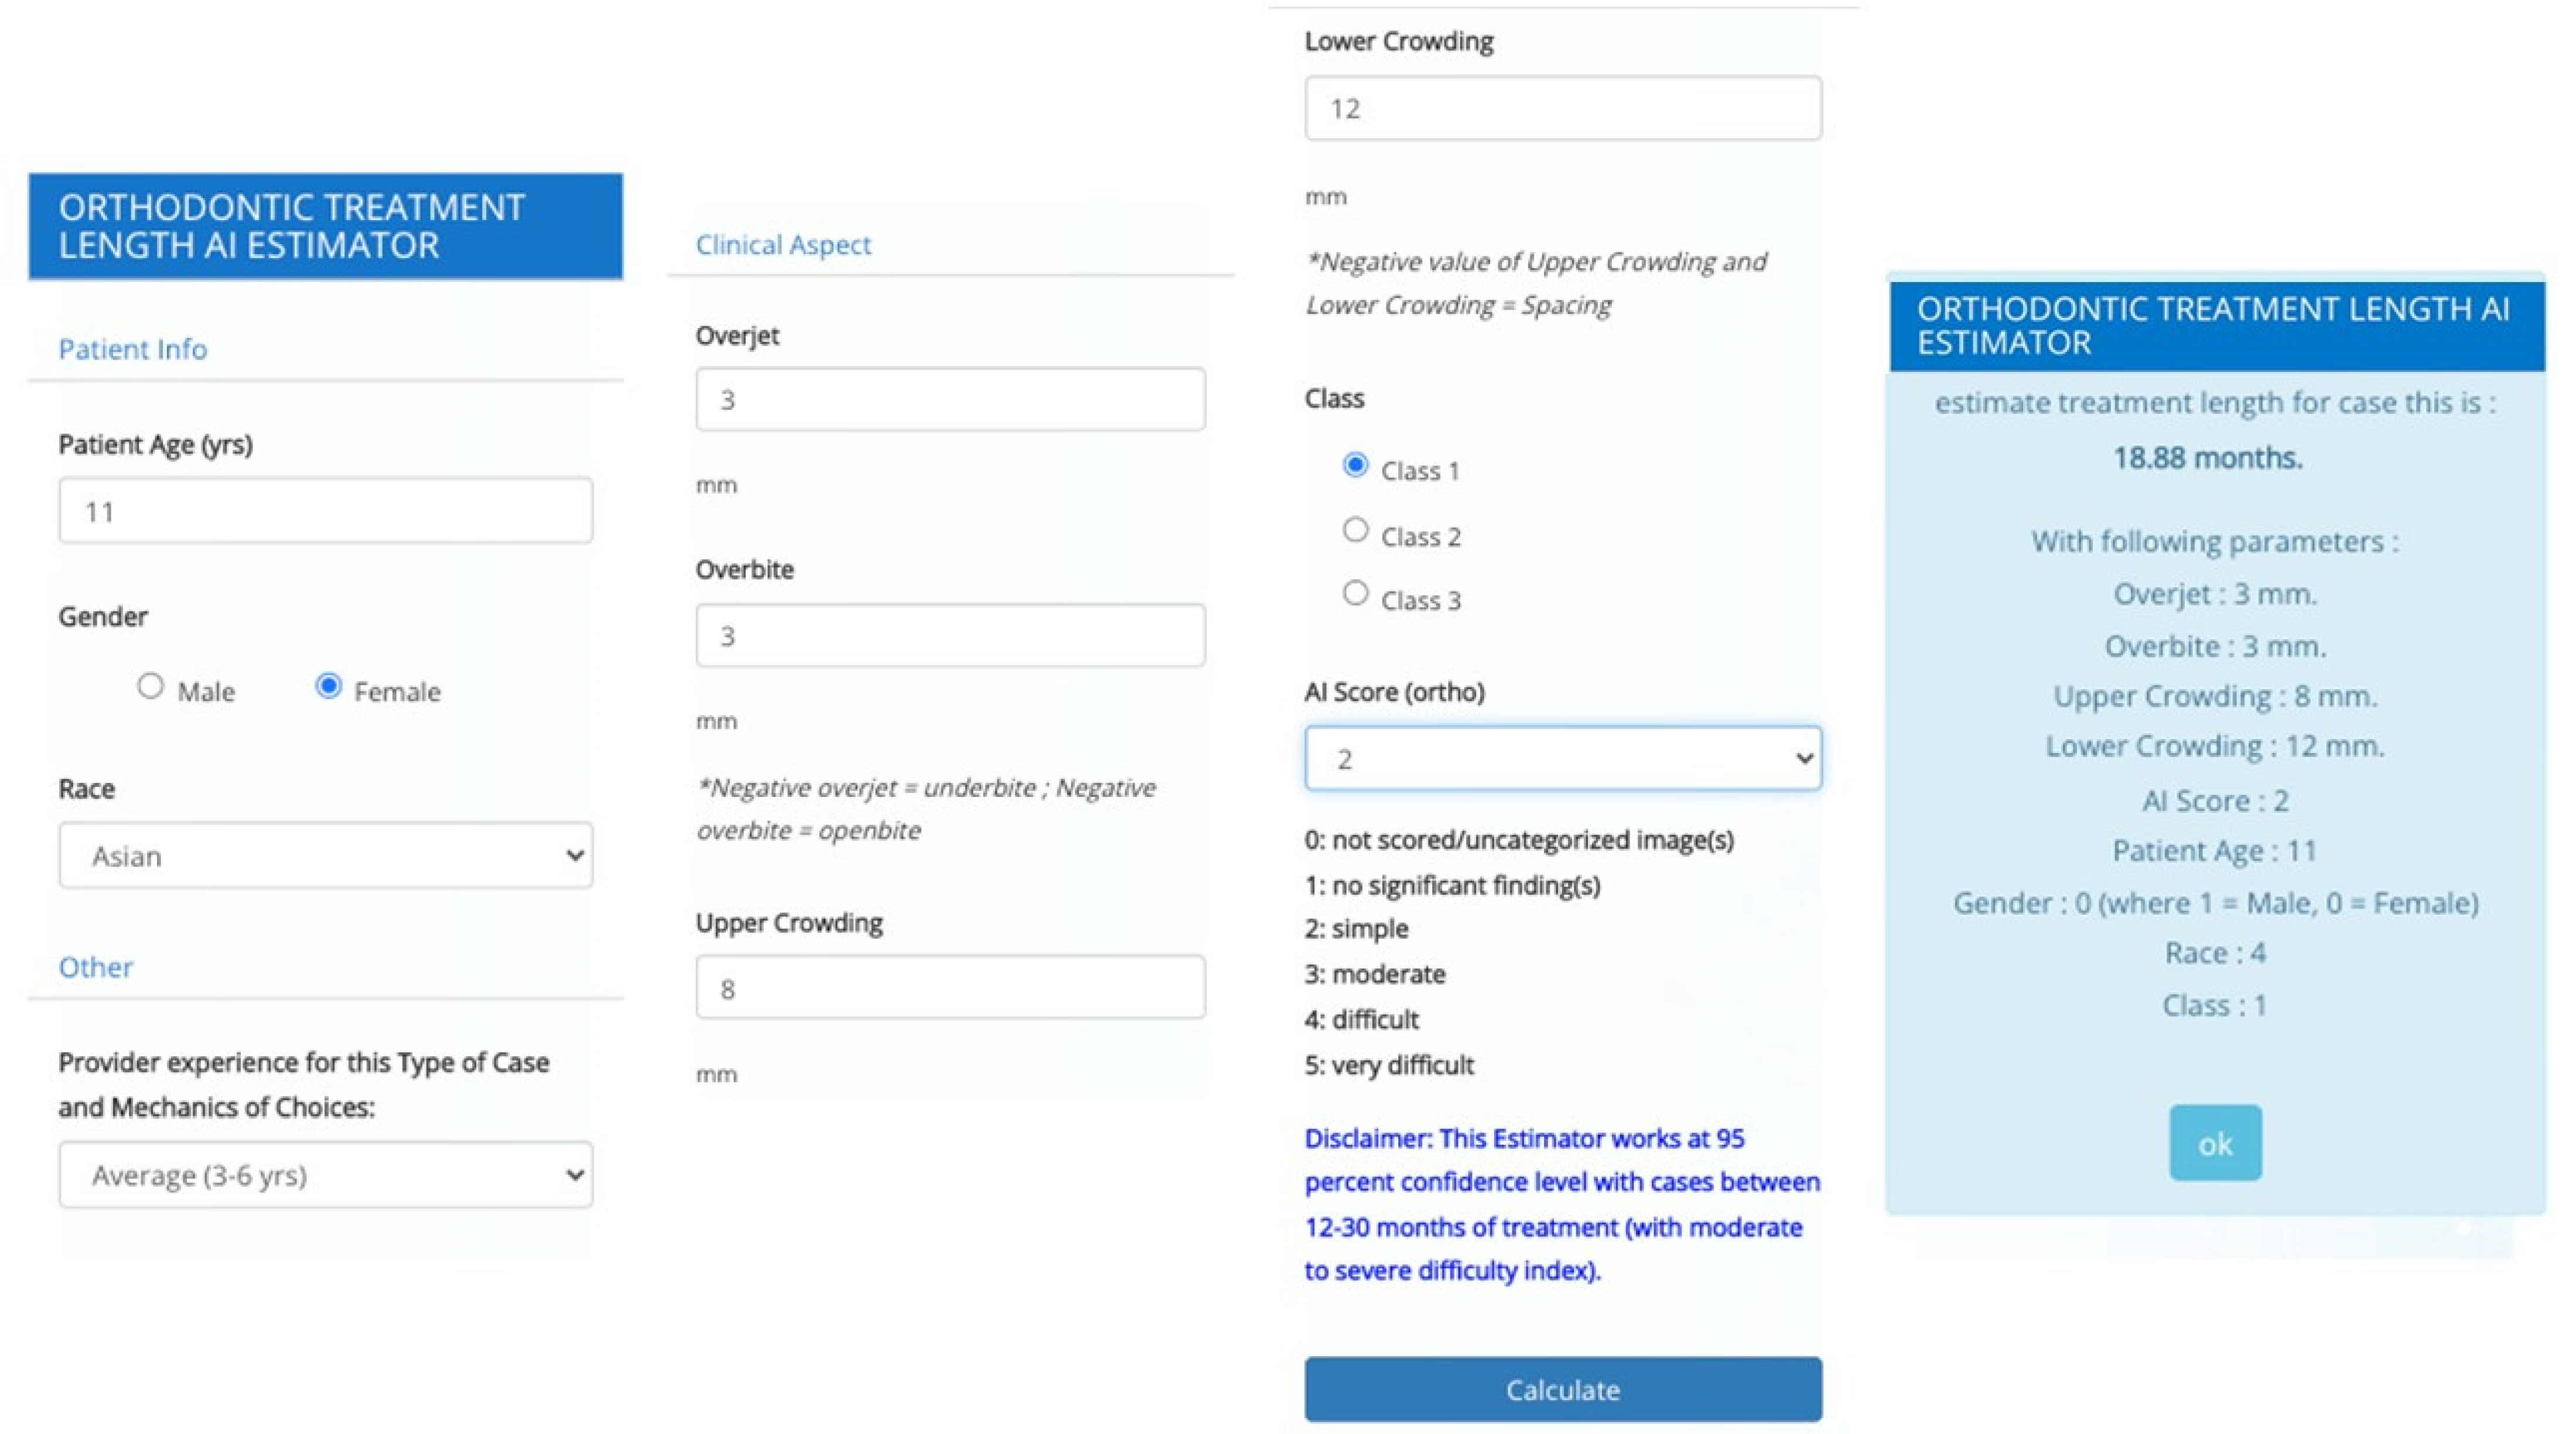
The scope of this study was to build a predictive model that can be used at initial patient screening or consultation. Other parameters can be used to fine-tune the ML models in the future. Furthermore, individual and subjective issues create more variations than the quantifiable factors presented in the study. However, we can perform additional studies to correlate those numeric variables to better understand the impact on treatment length. A clinical application of the ML predictive models presented in this study could be a software or a mobile application with a graphical user interface (GUI) that could be used during the orthodontic screening or consultation to provide helpful information for both the patient and the orthodontist (
Figure 10). Furthermore, these ML models could be integrated with orthodontic software currently available.
5. Conclusions
We achieved our objective of developing predictive models-based ML methods. Bagging and adaboost ML methods provided good predictability for orthodontic treatment length when patient information, such as age, malocclusion, and crowding, was provided. Furthermore, the study demonstrated the relative importance of each factor. Additional studies should be conducted on large, diverse datasets to include more variables and improve the performance of ML models for understanding of orthodontic treatment length.
Author Contributions
Conceptualization, B.K.; methodology, B.K. and F.S.; software, validation, A.Y.P., A.H. and A.K.; formal analysis, investigation, resources, data curation, A.Y.P. and M.H.E.; writing—original draft preparation, M.H.E.; writing—review and editing, M.H.E., S.T. and C.B.; visualization, supervision and project administration, B.K. All authors have read and agreed to the published version of the manuscript.
Funding
This research received no external funding.
Institutional Review Board Statement
Ethical approval (IRP Number 20193360) for this study was obtained from the research ethics committee of WIRB-Copernicus.
Informed Consent Statement
The requirement for informed consent from the study subjects was waived due to the retrospective study design.
Data Availability Statement
Restrictions apply to the availability of these data. Data was obtained from third party (All Care Orthodontics, Chicago, IL, USA).
Conflicts of Interest
The authors declare no conflict of interest.
References
- Fink, D.F.; Smith, R.J. The duration of orthodontic treatment. Am. J. Orthod. Dentofac. Orthop. 1992, 102, 45–51. [Google Scholar] [CrossRef]
- Mavreas, D.; Athanasiou, A.E. Factors affecting the duration of orthodontic treatment: A systematic review. Eur. J. Orthod. 2008, 30, 386–395. [Google Scholar] [CrossRef] [PubMed]
- Tsichlaki, A.; Chin, S.Y.; Pandis, N.; Fleming, P.S. How long does treatment with fixed orthodontic appliances last? A systematic review. Am. J. Orthod. Dentofac. Orthop. 2016, 149, 308–318. [Google Scholar] [CrossRef] [PubMed]
- Kafle, D.; Mishra, R.K.; Mahto, R.K.; Luintel, S.; Shrestha, S.; Sangroula, S. Comparison of Orthodontic Treatment Duration Among Extraction Versus Non Extraction Therapies. Orthod. J. Nepal. 2019, 9, 57–60. [Google Scholar] [CrossRef]
- Aljehani, D.; Baeshen, H.A. Effectiveness of the American Board of Orthodontics Discrepancy Index in predicting Treatment Time. J. Contemp. Dent. Pract. 2018, 19, 647–650. [Google Scholar] [PubMed]
- Bhikoo, C.; Xu, J.; Sun, H.; Jin, C.; Jiang, H.; Hu, R. Factors affecting treatment duration of labial inversely impacted maxillary central incisors. Am. J. Orthod. Dentofac. Orthop. 2018, 153, 708–715. [Google Scholar] [CrossRef] [PubMed]
- Abbing, A.; Koretsi, V.; Eliades, T.; Papageorgiou, S.N. Duration of orthodontic treatment with fixed appliances in adolescents and adults: A systematic review with meta-analysis. Prog. Orthod. 2020, 21, 37. [Google Scholar] [CrossRef] [PubMed]
- Kaur, H.; El-Bialy, T. Shortening of Overall Orthodontic Treatment Duration with Low-Intensity Pulsed Ultrasound (LIPUS). J. Clin. Med. 2020, 9, 1303. [Google Scholar] [CrossRef]
- Landin-Ramos, M.; Yadav, S.; Gandhi, V.; Upadhyay, M.; Tadinada, A. Is there a relationship between mandibular cortical bone thickness and orthodontic treatment time? Angle Orthod. 2020, 90, 794–800. [Google Scholar] [CrossRef]
- Cesur, E.; Bayrak, S.; Kursun-Çakmak, E.Ş.; Arslan, C.; Köklü, A.; Orhan, K. Evaluating the effects of functional orthodontic treatment on mandibular osseous structure using fractal dimension analysis of dental panoramic radiographs. Angle Orthod. 2020, 90, 783–793. [Google Scholar] [CrossRef]
- Jiang, F.; Jiang, Y.; Zhi, H.; Dong, Y.; Li, H.; Ma, S.; Wang, Y.; Dong, Q.; Shen, H.; Wang, Y. Artificial intelligence in healthcare: Past, present and future. Stroke Vasc. Neurol. 2017, 2, 230–243. [Google Scholar] [CrossRef] [PubMed]
- Venugopalan, S.R.; Elnagar, M.H.; Karhade, D.S.; Allareddy, V. Assessment of Outcomes by Using Machine Learning. In Machine Learning in Dentistry; Ko, C.-C., Shen, D., Wang, L., Eds.; Springer International Publishing: Berlin/Heidelberg, Germany, 2021; pp. 131–143. [Google Scholar] [CrossRef]
- Talaat, S.; Kaboudan, A.; Talaat, W.; Kusnoto, B.; Sanchez, F.; Elnagar, M.H.; Bourauel, C.; Ghoneima, A. The validity of an artificial intelligence application for assessment of orthodontic treatment need from clinical images. Semin. Orthod. 2021, 27, 164–171. [Google Scholar] [CrossRef]
- Evaluate and Select a Machine Learning Algorithm—IBM Garage Practices. Available online: https://www.ibm.com/garage/method/practices/reason/evaluate-and-select-machine-learning-algorithm/ (accessed on 30 May 2022).
- Borstelmann, S.M. Machine Learning Principles for Radiology Investigators. Acad. Radiol. 2020, 27, 13–25. [Google Scholar] [CrossRef] [PubMed]
- Vayda, D.; Korsch, S.; Weyant, R.; Vig, K.V. Does patient age affect duration or success of orthodontic treatment? J. Dent. Res. 1995, 74, 163. [Google Scholar]
- Dyer, G.S.; Harris, E.F.; Vaden, J.L. Age effects on orthodontic treatment: Adolescents contrasted with adults. Am. J. Orthod. Dentofac. Orthop. 1991, 100, 523–530. [Google Scholar] [CrossRef]
| Publisher’s Note: MDPI stays neutral with regard to jurisdictional claims in published maps and institutional affiliations. |
© 2022 by the authors. Licensee MDPI, Basel, Switzerland. This article is an open access article distributed under the terms and conditions of the Creative Commons Attribution (CC BY) license (https://creativecommons.org/licenses/by/4.0/).


 ,
, 

