Article

Investigation of Cross-Reactivity of Anti-Ephrin-B2 Antibody to Other Ephrin-B Members in an Immunohistochemical Study in a Cohort of Oral Squamous Cell Carcinoma

by
Dipak Sapkota
1,*,
Evan M. Vallenari
1,
Dhanalakshmi Tamatam
1,2,
Olaf Joseph Franciscus Schreurs
1,
Sushma Pandey
1,
Tine Merete Søland
1,3,
Daniela-Elena Costea
4,5,
Burcu Tokozlu
1,6 and
Hans-Christian Åsheim
1,7,*
1
Department of Oral Biology, Faculty of Dentistry, University of Oslo, 0316 Oslo, Norway
2
Department of Natural Environment, Faculty of Forestry, Technical University, 960 01 Zvolen, Slovakia
3
Department of Pathology, Rikshospitalet, Oslo University Hospital, 0424 Oslo, Norway
4
The Gade Laboratory for Pathology, Department of Clinical Medicine, 5020 Bergen, Norway
5
Centre for Cancer Biomarkers (CCBIO), Faculty of Medicine and Dentistry, University of Bergen, 5020 Bergen, Norway
6
Department of Oral Pathology, Faculty of Dentistry, Gazi University, Ankara 06510, Turkey
7
School of Health Sciences, University College Kristiania, 0153 Oslo, Norway
*
Authors to whom correspondence should be addressed.
Oral 2022, 2(2), 148-162; https://doi.org/10.3390/oral2020015
Submission received: 11 February 2022 / Revised: 12 March 2022 / Accepted: 3 April 2022 / Published: 12 April 2022

Abstract

:
Ephrin-B1,-B2 and -B3 proteins share a high degree of sequence similarity. Investigation of these proteins as putative prognostic markers in human cancers including oral squamous cell carcinoma (OSCC) has been limited by challenges in generating specific antibodies against them. The current study examined the reactivity of a polyclonal anti-human ephrin-B2 antibody (HPA008999) against ephrin-B proteins and investigated the prognostic significance of immunoreactivity of the same antibody at different intra-tumor sites in OSCC specimens. By amino acid sequence comparison, immunocytochemistry and Western blot analysis on cell lysates and precipitates from HEK-293T cells transfected with EFNB1, EFNB2, or EFNB3 expression constructs, we demonstrated that HPA008999 reacted to all ephrin-B proteins. Using immunohistochemistry (IHC) with the HPA008999 antibody in a cohort (n = 131) of OSCC, we showed high immunoreactivity at the tumor center, but not at the tumor invading front, was significantly associated with worse 5-year overall survival probabilities. In conclusion, the HPA008999 antibody reacted to all ephrin-B proteins and the immunoreactivity at the tumor center might be useful as a prognostic marker in OSCC. These data underscore the need for the investigation of antibodies for cross-reactivity to similar protein members for obtaining reliable and meaningful results in IHC based biomarker studies.

1. Introduction

Oral squamous cell carcinoma (OSCC), a major histological variant of oral cancer, is a malignancy arising from the epithelial lining of the anterior 2/3rd of the tongue, hard palate, gingiva, the floor of the mouth and cheeks. OSCC accounts for approximately 40% of head and neck squamous cell carcinomas (HNSCC), a heterogeneous group of malignancies in the head and neck region. OSCC is characterized by an aggressive growth pattern with frequent involvement of local cervical nodes, leading to an average 5-year survival rate of 50–60% [1]. Despite the tremendous efforts toward improvements in diagnosis and management, the survival of OSCC patients has not improved significantly. This underscores the need for a better understanding of OSCC pathogenesis/biology in order to identify molecular markers for prognostic and therapeutic applications.
Ephrin-B proteins are membrane-bound ligands of a family of transmembrane receptor tyrosine kinases, the Eph receptors (Eph). The ephrin-B family consists of three proteins with high sequence homology, namely ephrin-B1, -B2 and -B3, encoded by EFNB1, EFNB2 and EFNB3 genes, respectively [2,3]. Ephrin-B1-B3 bind preferentially to Eph-B receptors consisting of six receptors, Eph-B1 through 6 [4] as well as to Eph-A4 [5]. Binding of the ephrin-B ligand to an Eph receptor on the neighboring cells can induce bidirectional signaling, resulting in activation of the ephrin-B mediated pathway (reverse signaling) or the Eph receptor mediated pathway (forward signaling) in the corresponding cells [6]. The binding of ephrin-B proteins with Eph-B receptor members has been shown to be promiscuous; for example, Eph-B6 forms complexes with both ephrin-B1 and ephrin-B2 [7]. It has also been shown that ephrin-B1 and ephrin-B2 can interact with the same Eph receptors, leading to similar functional outcomes [8,9].
Ephrin-B1, -B2 and -B3 have been shown to be involved in a number of key biological processes, such as angiogenesis [10,11,12], neural development [13,14,15], and several pathological conditions including human malignancies [6,16,17]. Although the roles of ephrin-B1 and -B3 in carcinogenesis are poorly understood as compared to those of ephrin-B2, these members have been reported to have both tumor suppressive [18,19] and tumor promoting functions [6,20,21]. The mechanisms for these diverse and sometimes opposing biological roles of ephrin-B in human malignancies are, however, not fully understood and the relative activation of forward versus reverse ephrin-B/Eph-receptor signaling in a cell/tissue- and context-dependent manner is considered to be important [22,23]. Indeed, the expression of ephrin-B2 was shown to vary with respect to intra-tumor sites in human glioblastomas [17,18] and malignant melanomas [24]. Ephrin-B2 was reported to be down-regulated at the invading front area in glioblastomas [17,18], and up-regulated in malignant melanoma [24] as compared to the tumor center, thus linking ephrin-B2 expression with intra-tumor heterogeneity.
Given their key functional roles in human malignancies, there is a growing interest in the investigation of ephrin-B proteins as putative prognostic markers in human cancers. Nevertheless, because of the sequence similarity between both ephrin ligands and Eph-receptors, some challenges in generating specific antibodies against them have been realized and the requirement for proper antibody validation strategies was suggested previously [25,26,27]. The Human Protein Atlas (HPA) aims to map all human proteins in the cells, tissues, and organs with different approaches including protein detection with validated antibodies (https://www.proteinatlas.org/about, accessed on 21 September 2021) [28]. The Atlas antibodies are considered reliable and are popular among the scientific communities. The current study examined the reactivity of a polyclonal anti-human ephrin-B2 antibody (Atlas Antibodies, HPA008999) against ephrin-B proteins, and investigated the prognostic significance of HPA008999 immunoreactivity at different intra-tumor sites in OSCC specimens. By utilizing cell transfection, precipitation, Western blot and immunocytochemistry, we first demonstrated that HPA008999 reacted with ephrin-B1,-B2 and -B3. We further showed that the immunoreactivity of HPA008999 at the tumor center in OSCC specimens, but not at the tumor invading front, was significantly associated with worse 5-year overall survival probabilities of OSCC patients.

2. Materials and Methods

2.1. Sequence Alignment Analysis

The Basic Local Alignment Search Tool (BLAST, NCBI, NIH) was used to compare the amino acid sequences of ephrins-B1-B3. Next, sequence similarity between ephrin-B1-B3 for the immunogen sequence (consisting of 71 amino acids) used to generate the anti-ephrin-B2 antibody HPA008999 from the HPA [28] was examined.

2.2. Transfections, Immunoprecipitation and Western Blotting

HEK-293T were cultured in high-glucose DMEM supplemented with L-glutamine, 10% (v/v) heat-inactivated FBS (PromoCell), and penicillin/streptomycin (PAA Laboratories) at 37 °C in a humidified atmosphere with 5% CO2. HEK-293T cells were transiently transfected using Lipofectamine 2000 (Thermo Fisher) with expression constructs for human EFNB1 [29], EFNB2 [29], or EFNB3 [17], and cell lysates were prepared 48 h after transfection (cells were lysed with 0.5% NP40 with protease inhibitors). The cell lysates were resolved in ready-cast SDS-PAGE gels (Bio-Rad Laboratories), transferred to nitrocellulose membrane (Whatman), and incubated with anti-ephrin-B2 (Atlas Antibodies Cat# HPA008999, RRID:AB_1078721). Next, cell lysates of transfected HEK-293T were immunoprecipitated with Eph-B2-Fc (cat no: 5189-B2-050 from R & D Systems) or HPA008999. Briefly, the lysate and Eph-B2-Fc (1 μg) were incubated overnight at 4 °C in a rotating wheel, followed by incubation with Protein G–Dynabeads (10 μL) at 4 °C for 1 h. Precipitates were resolved and transferred as described above and incubated with the primary antibodies anti-ephrin-B1 (Santa Cruz Biotechnology Cat# sc-1011, RRID:AB_631414), anti-ephrin-B2 (Atlas Antibodies Cat# HPA008999, RRID:AB_1078721) or anti-ephrin-B3 (Santa Cruz Biotechnology Cat# sc-271328, RRID:AB_10608991) for 1 h at room temperature. Membranes were washed and incubated with a HRP-linked secondary antibody for 1 hour at room temperature and visualized using ECL Plus Western blotting detection system (GE Healthcare BioSciences, Chicago, IL, USA).

2.3. Immunocytochemistry on HEK-293T Cells Transfected with EFNB1, EFNB2 and EFNB3 Expression Constructs

Approximately 200,000 HEK-293T cells were plated into 6 well plates and transfected with EFNB1, EFNB2, or EFNB3 expression vectors or no DNA using Lipofectamine 2000 as the transfection reagent. After 48 h, cells were fixed in 10% neutral buffered formalin for 15 min at room temperature, washed with phosphate buffered saline and centrifuged. The pellet was reconstituted in 500 µL of 3% agar solution, solidified, wrapped into a piece of lens paper, dehydrated in graded ethanol, cleared in xylene and embedded in paraffin. Four micron thick sections of formalin fixed paraffin embedded (FFPE) cell pellets were subjected to immunocytochemistry. Briefly, sections were deparaffinized in xylene and hydrated in graded ethanol. Endogenous peroxidase was quenched with 0.3% hydrogen peroxide in methanol for 30 min, and heat-induced epitope retrieval was performed in Tris-EDTA buffer, pH 9, containing 10 mM Tris, 1 mM EDTA and 0.05% Tween-20. A blocking step with 1 mg/mL human IgG (Gammanorm®, Octapharma, Jessheim, Norway) for 1 h was performed to avoid nonspecific binding of rabbit immunoglobulins to HEK cells. The sections were then incubated for 2 h with rabbit anti-ephrin-B2 (HPA008999) at 1 µg/mL. In addition to antibody diluent alone, consisting of 1% IgG free bovine serum albumin (Jackson ImmunoResearch Europe, Cambridgeshire, UK) in washing buffer, Rabbit Ig (Agilent Cat# X0903) was used as an isotype-matched control. Bound antibody was amplified by incubation with horseradish peroxidase labeled polymer conjugated to anti-rabbit antibody (Agilent Cat# K4003, RRID:AB_2630375) for 30 min and visualized with 3,3′-diaminobenzidine as substrate. Nuclei were counterstained with Mayer’s hematoxylin (Agilent Cat#S3309) before dehydration and mounting. Chemicals, other than stated above, were obtained from Sigma (Merck, Darmstadt, Germany).

2.4. External Transcriptome Datasets

EFNB1, EFNB2 and EFNB3 mRNA expression levels in OSCC and corresponding normal controls were examined in two independent microarray datasets (Estilo et al., 2009; OSCC (n = 20) and matched controls (n = 20) [30], and Chen et al., 2008; OSCC (n = 167), oral dysplasia (n = 17) and control specimens (n = 45) [31]). The Consensus mRNA dataset, generated from a combination of three datasets (The HPA RNA-seq data, GTEx RNA-seq data: The Genotype-Tissue Expression data and The Functional Annotation of Mammalian Genomes 5 data (FANTOM5)) [32], were obtained from the HPA. The specimen characteristics of different transcriptomic datasets were as follows: HPA dataset consisted of 483 tissue samples representing 37 different human normal tissues (no oral tissue included), GTEx consisted of 54 different human tissues across nearly 1000 individuals (no oral tissue included), and FANTOM5 consisted of specimens from 60 different normal tissues including two tongue specimens. In addition, mRNA expression data for 17 different cancer types including HNSCC (consisting of 62% of OSCC) [33] from the TCGA datasets were exported from the HPA portal [28].

2.5. FFPE Specimens of Human OSCC

The FFPE specimens of OSCC used in the current study were collected at the Haukeland University Hospital between 1998 and 2012. A total of 131 Human papillomavirus (HPV)- negative (as determined by p16 IHC) [34] OSCC specimens were immunostained using HPA008999. Of them, 12 samples were excluded from the statistical analysis as they contained few tumor cells for IHC evaluation. All OSCC cases were primary tumors and the patients had no history of chemo- or radiotherapy prior to surgery. The Reporting Recommendations for Tumor Marker Prognostic Studies guidelines [35] were followed where appropriate. The study was approved by the Committee for Medical and Health Research Ethics in West Norway (2010/481 REK vest).

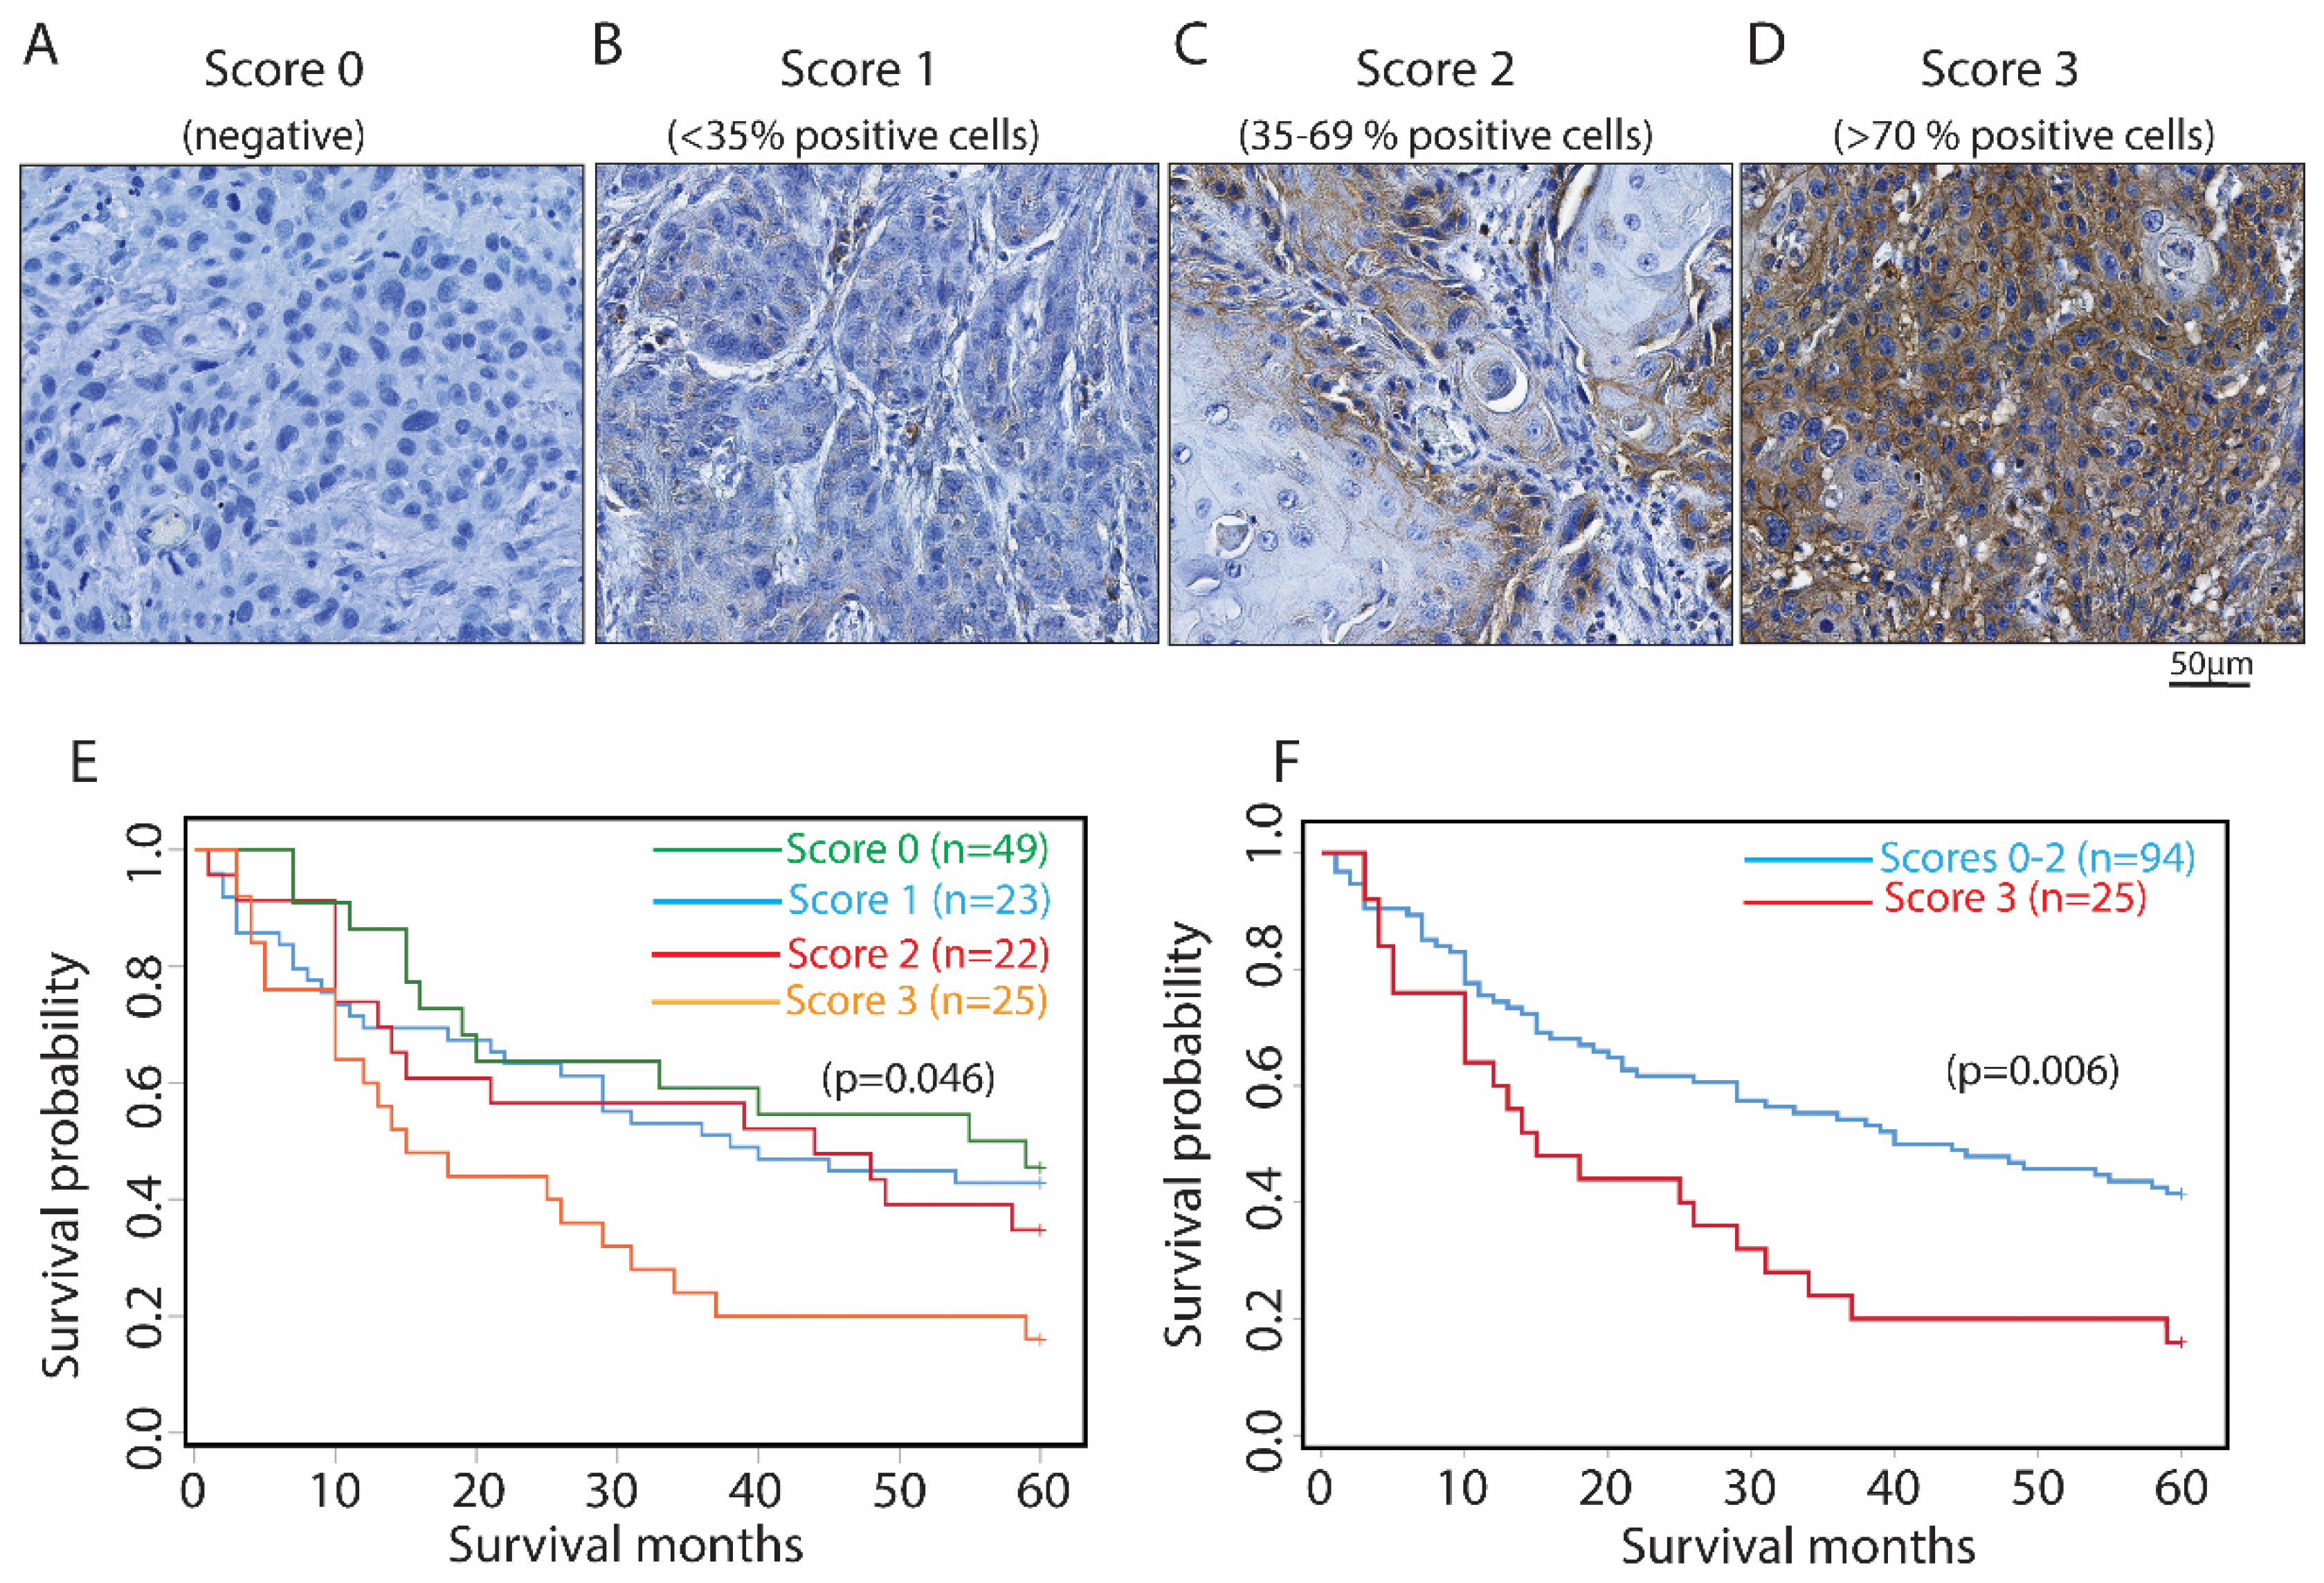
2.6. Immunohistochemistry and Evaluation of Immunoexpression

IHC was performed using 4–5 µm thick sections as described previously [36]. Briefly, antigen retrieval was performed using heat treatment in Tris-EDTA, pH 9.0 (DAKO). After blocking, sections were incubated with polyclonal rabbit anti-human ephrin-B2 primary antibody (HPA008999, 1:50 dilution) overnight at 4 °C. Amplification and visualization were conducted as described above for HEK-293T cells. Sections incubated with 3% bovine serum albumin instead of the primary antibody served as negative controls.
The immunostained slides were scanned at ×40 using Nano Zoomer XR digital scanner (Hamamatsu) and were analyzed manually at ×20 using QuPath open source software for Windows(Belfast, UK) [37]. After inter-observer calibration, the IHC evaluation was performed by BT and DS without prior knowledge of the clinicopathological information of OSCC. Out of the 131 OSCC immunostained cases, immunoreactivity for HPA008999 was evaluated at the tumor center and tumor invading front area in 119 and 118 specimens, respectively. The remaining specimens (12 for tumor center and 13 for tumor invading front area) were excluded from the analysis as they contained no or few tumor cells. The scanned slides were semi-quantitatively evaluated both at the tumor center and the corresponding invading front area of the tumor as described in a previous study [36]. Approximately 3–4 randomly selected tumor regions at the tumor center or invading front/islands were used to score 200–500 tumor cells. The invading front was defined as the deepest part of an invasive tumor consisting of the 3–4 deepest cell layers. Where it was not possible to mark clear invasive fronts, the deepest invading tumor islands consisting of >50 cells were used. OSCC were grouped based on the percentage of positive cells (irrespective of the sub-cellular localization) into the following scores: 0 (no staining); 1 (<35% positive cells); 2 (35–69% positive cells) and 3 (70% positive cells).

2.7. Statistical Analysis

Differences in the means between two paired groups were examined using Student’s paired t-test, whereas Analysis of variance (ANOVA) with Tukey’s multiple comparison test were used to examine differences in means between more than two groups. Association between the HPA008999 immunoreactivity scores and other categorical clinicopathological variables was examined using the Chi-square test or McNemar–Bowker tests. Survival analysis was performed using the Kaplan–Meier plots with log-rank test. Multivariate Cox proportional hazard models were created by using all clinicopathological variables that were significantly associated with 5-year overall survival with univariate Cox analysis. The level of significance was set at 5%. SPSS 25 (IBM, Armonk, NY, USA) and/or GraphPad prism version 8.0.1 (San Diego, CA, USA) for Windows were used for statistical analysis.

3. Results

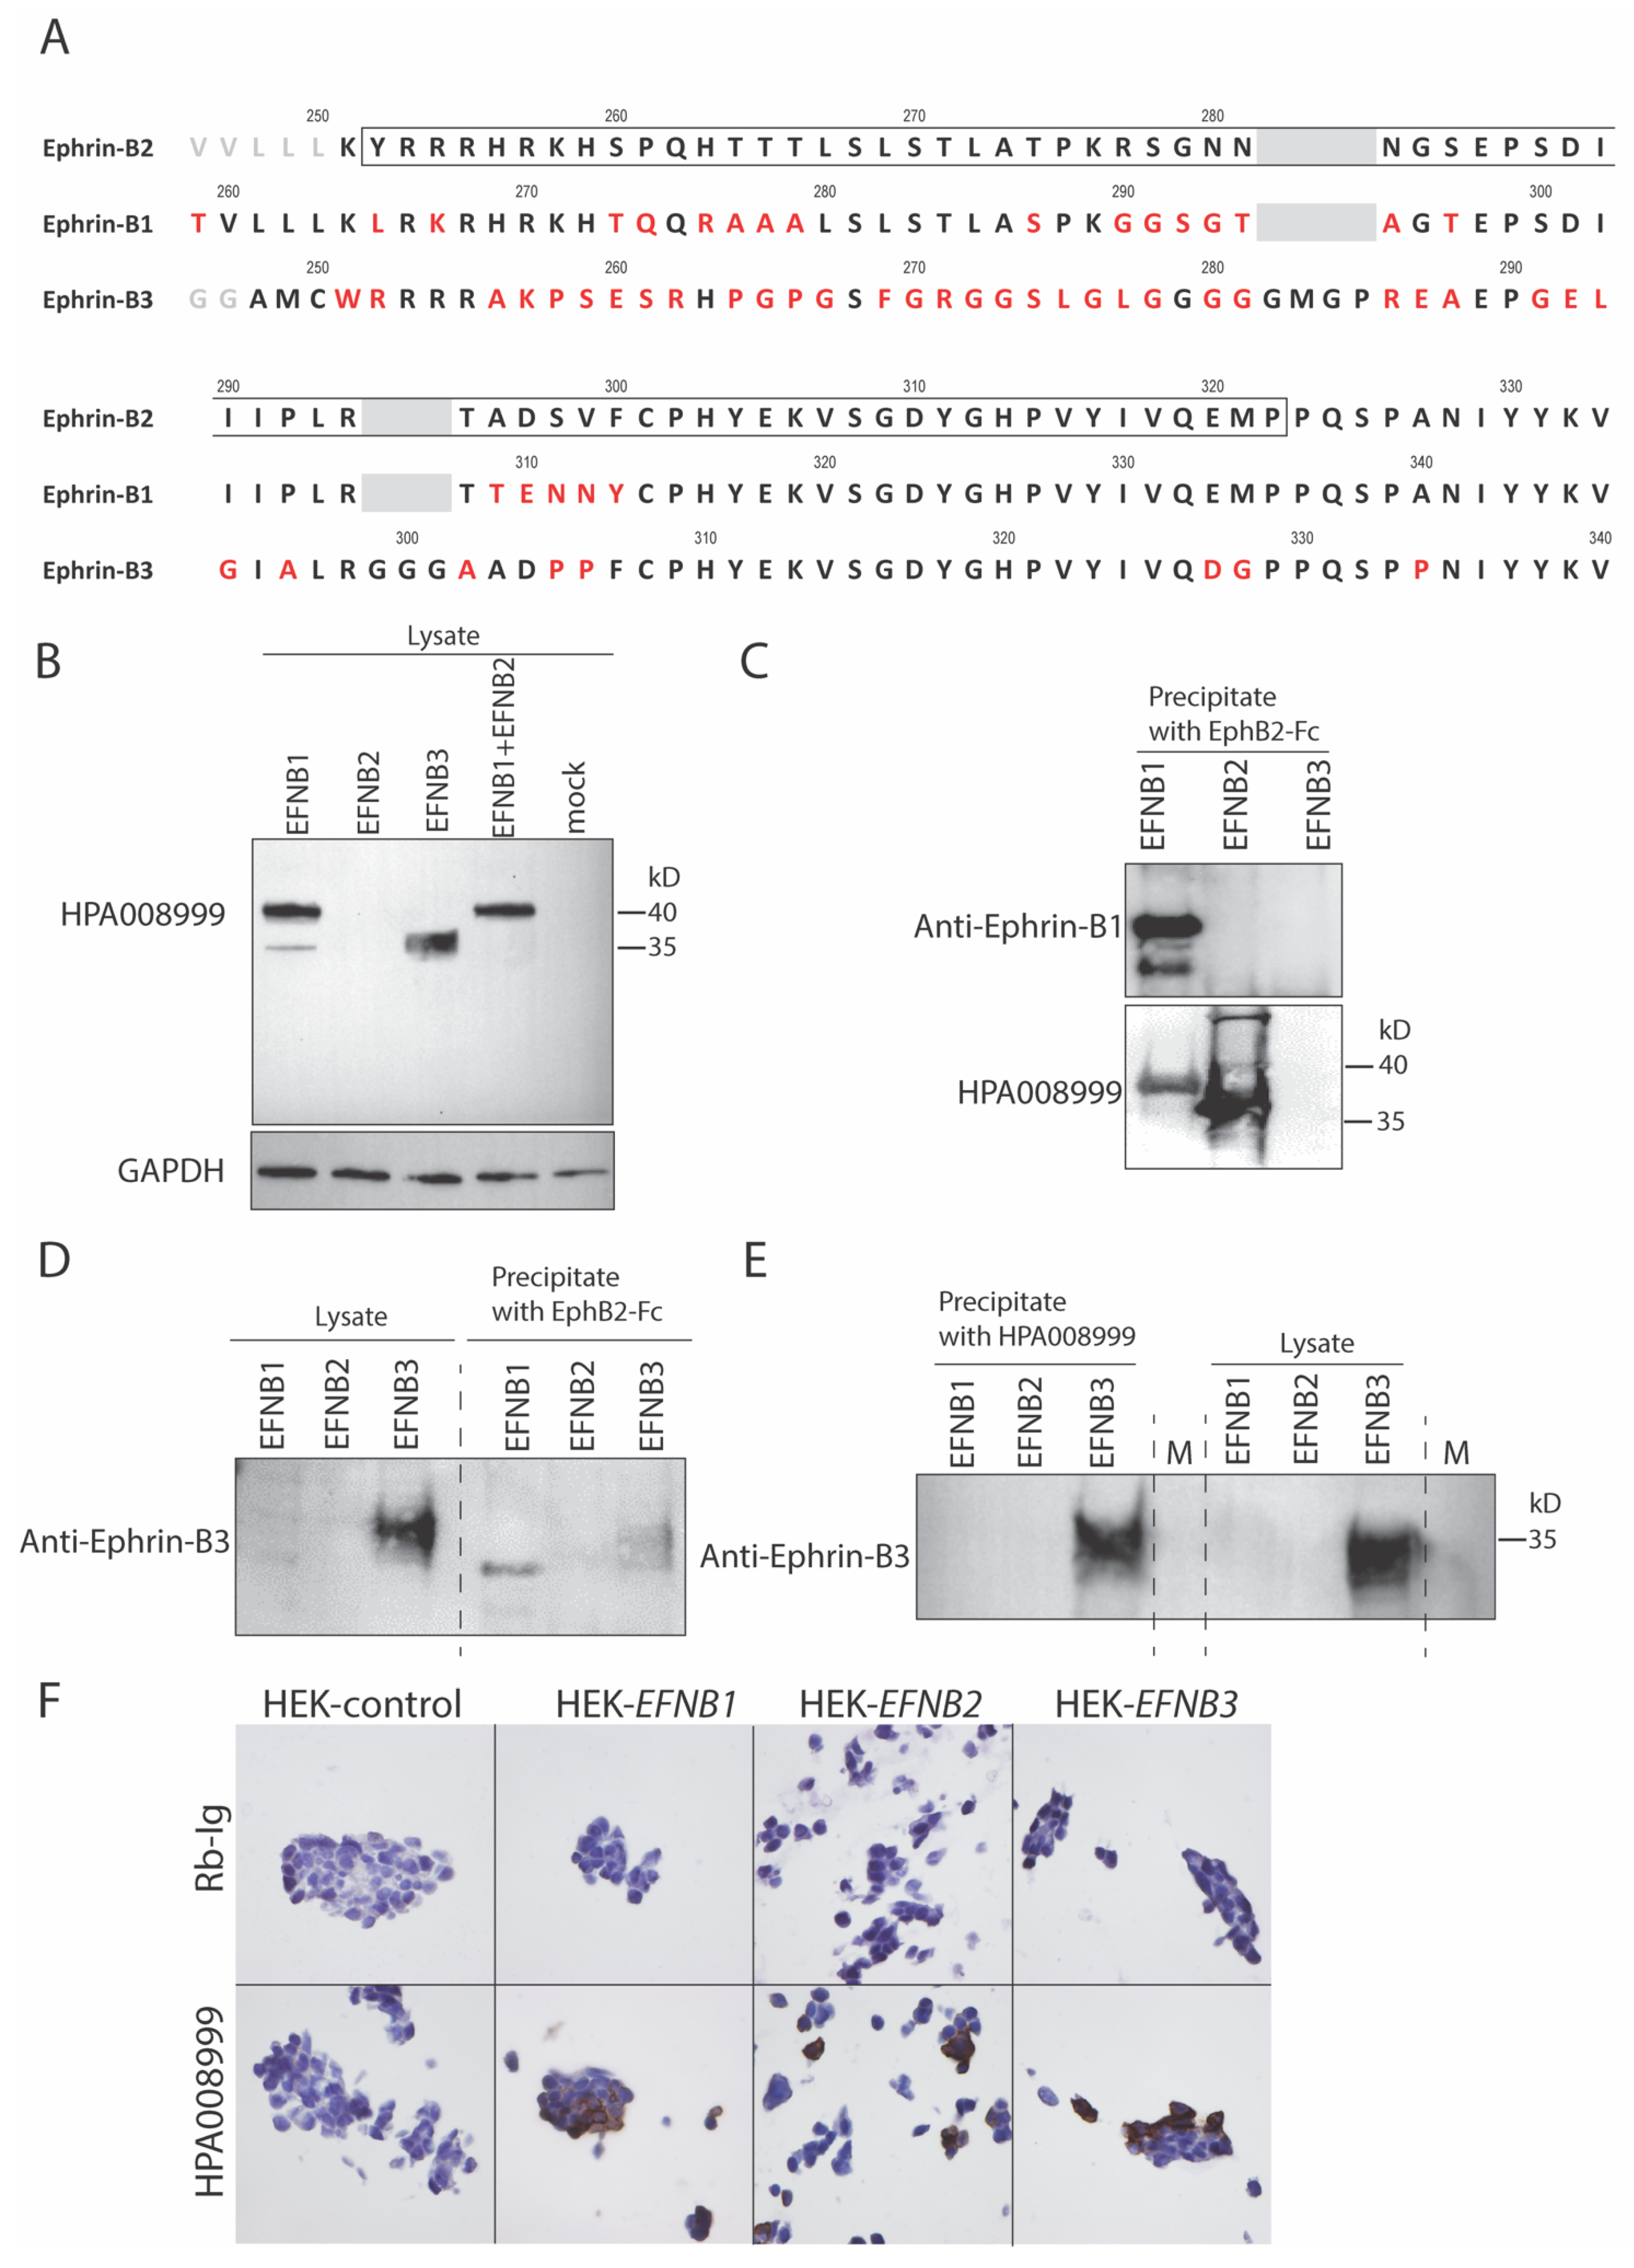
3.1. A High Degree of Sequence Identity Was Observed between Ephrins-B1, -B2 and -B3

The immunogen sequence used to generate the HPA008999 antibody covered amino acid numbers 252–322 of ephrin-B2 (GenBank: AAH69342.1), which covers most of the intracellular domain of ephrin-B2. Protein BLAST alignment of ephrin-B1 (accession number P98172), ephrin-B2 (accession number P52799) and ephrin-B3 (accession number Q15768) showed a higher degree of amino acid similarity between ephrin-B2 and -B1 (55% identity between the amino acid sequences) than between ephrin-B2 and -B3 or ephrin-B3 and -B1 (40% and 41% identity), respectively. In particular, the immunogen amino acid sequence was found to have a high proportion of identities to both ephrin-B1 (71%) and ephrin-B3 (67%) with several overlapping amino acid stretches, in particular between amino acids 300–319, large enough to contain an epitope (Figure 1A).

3.2. Anti-Ephrin-B2 Antibody HPA008999 Reacted with All Ephrin-B Members

Due to the high sequence similarity between ephrin-B members in the immunogenic sequence used to generate the HPA008999 antibody, we examined if HPA008999 could react exclusively to ephrin-B2 or to -B1 and -B3 as well, by Western blotting and IHC using HEK-293T cells transfected with EFNB1, EFNB2, EFNB3 or EFNB1 + EFNB2. Western blot analysis using lysates from EFNB1, EFNB2, or EFNB3 transfected HEK-293T cells showed that the anti-ephrin-B2 HPA008999 antibody reacted to ephrin-B1 and ephrin-B3, but surprisingly not to lysates from the ephrin-B2 transfected cells (Figure 1B). Concentrating different ephrin-B members from transfectant lysates by precipitating them with EphB2-Fc showed that HPA008999 reacted with precipitates from ephrin-B1 and ephrin-B2 transfectants but not to ephrin-B3 (Figure 1C). In order to investigate if this could be related to poor precipitation of ephrin-B3 with EphB2-Fc, we next performed a Western blot using lysates from ephrin-B3 transfectants alone or EphB2-Fc precipitated ephrin-B3 from the same lysate (used 10× more lysate for precipitation) with an anti-ephrin-B3 antibody. Of note, a much weaker signal was observed from EphB2-Fc precipitate than lysate alone (Figure 1D), indicating that EphB2-Fc precipitated ephrin-B3 poorly under the conditions used. This could explain why there was no signal from ephrin-B3 precipitate with EphB2-Fc in Figure 1C. We next investigated if ephrin-B3 could be precipitated from lysates from ephrin-B3 transfectants with the HPA008999 antibody. Western blot analysis of the precipitate or lysate alone with a specific ephrin-B3 antibody showed that ephrin-B3 could clearly be immunoprecipitated with HPA008999 (Figure 1E). To conclude, the HPA008999 antibody reacted with all ephrin-B members under the experimental conditions used.
Supporting the Western blot results, immunocytochemistry using the HPA008999 antibody showed no staining in mock transfected HEK-293T cells, whereas strong membrane-cytoplasmic staining was shown in HEK-293T cells transfected with either EFNB1, EFNB2 or EFNB3. The isotype control and antibody diluent controls were negative (Figure 1F).

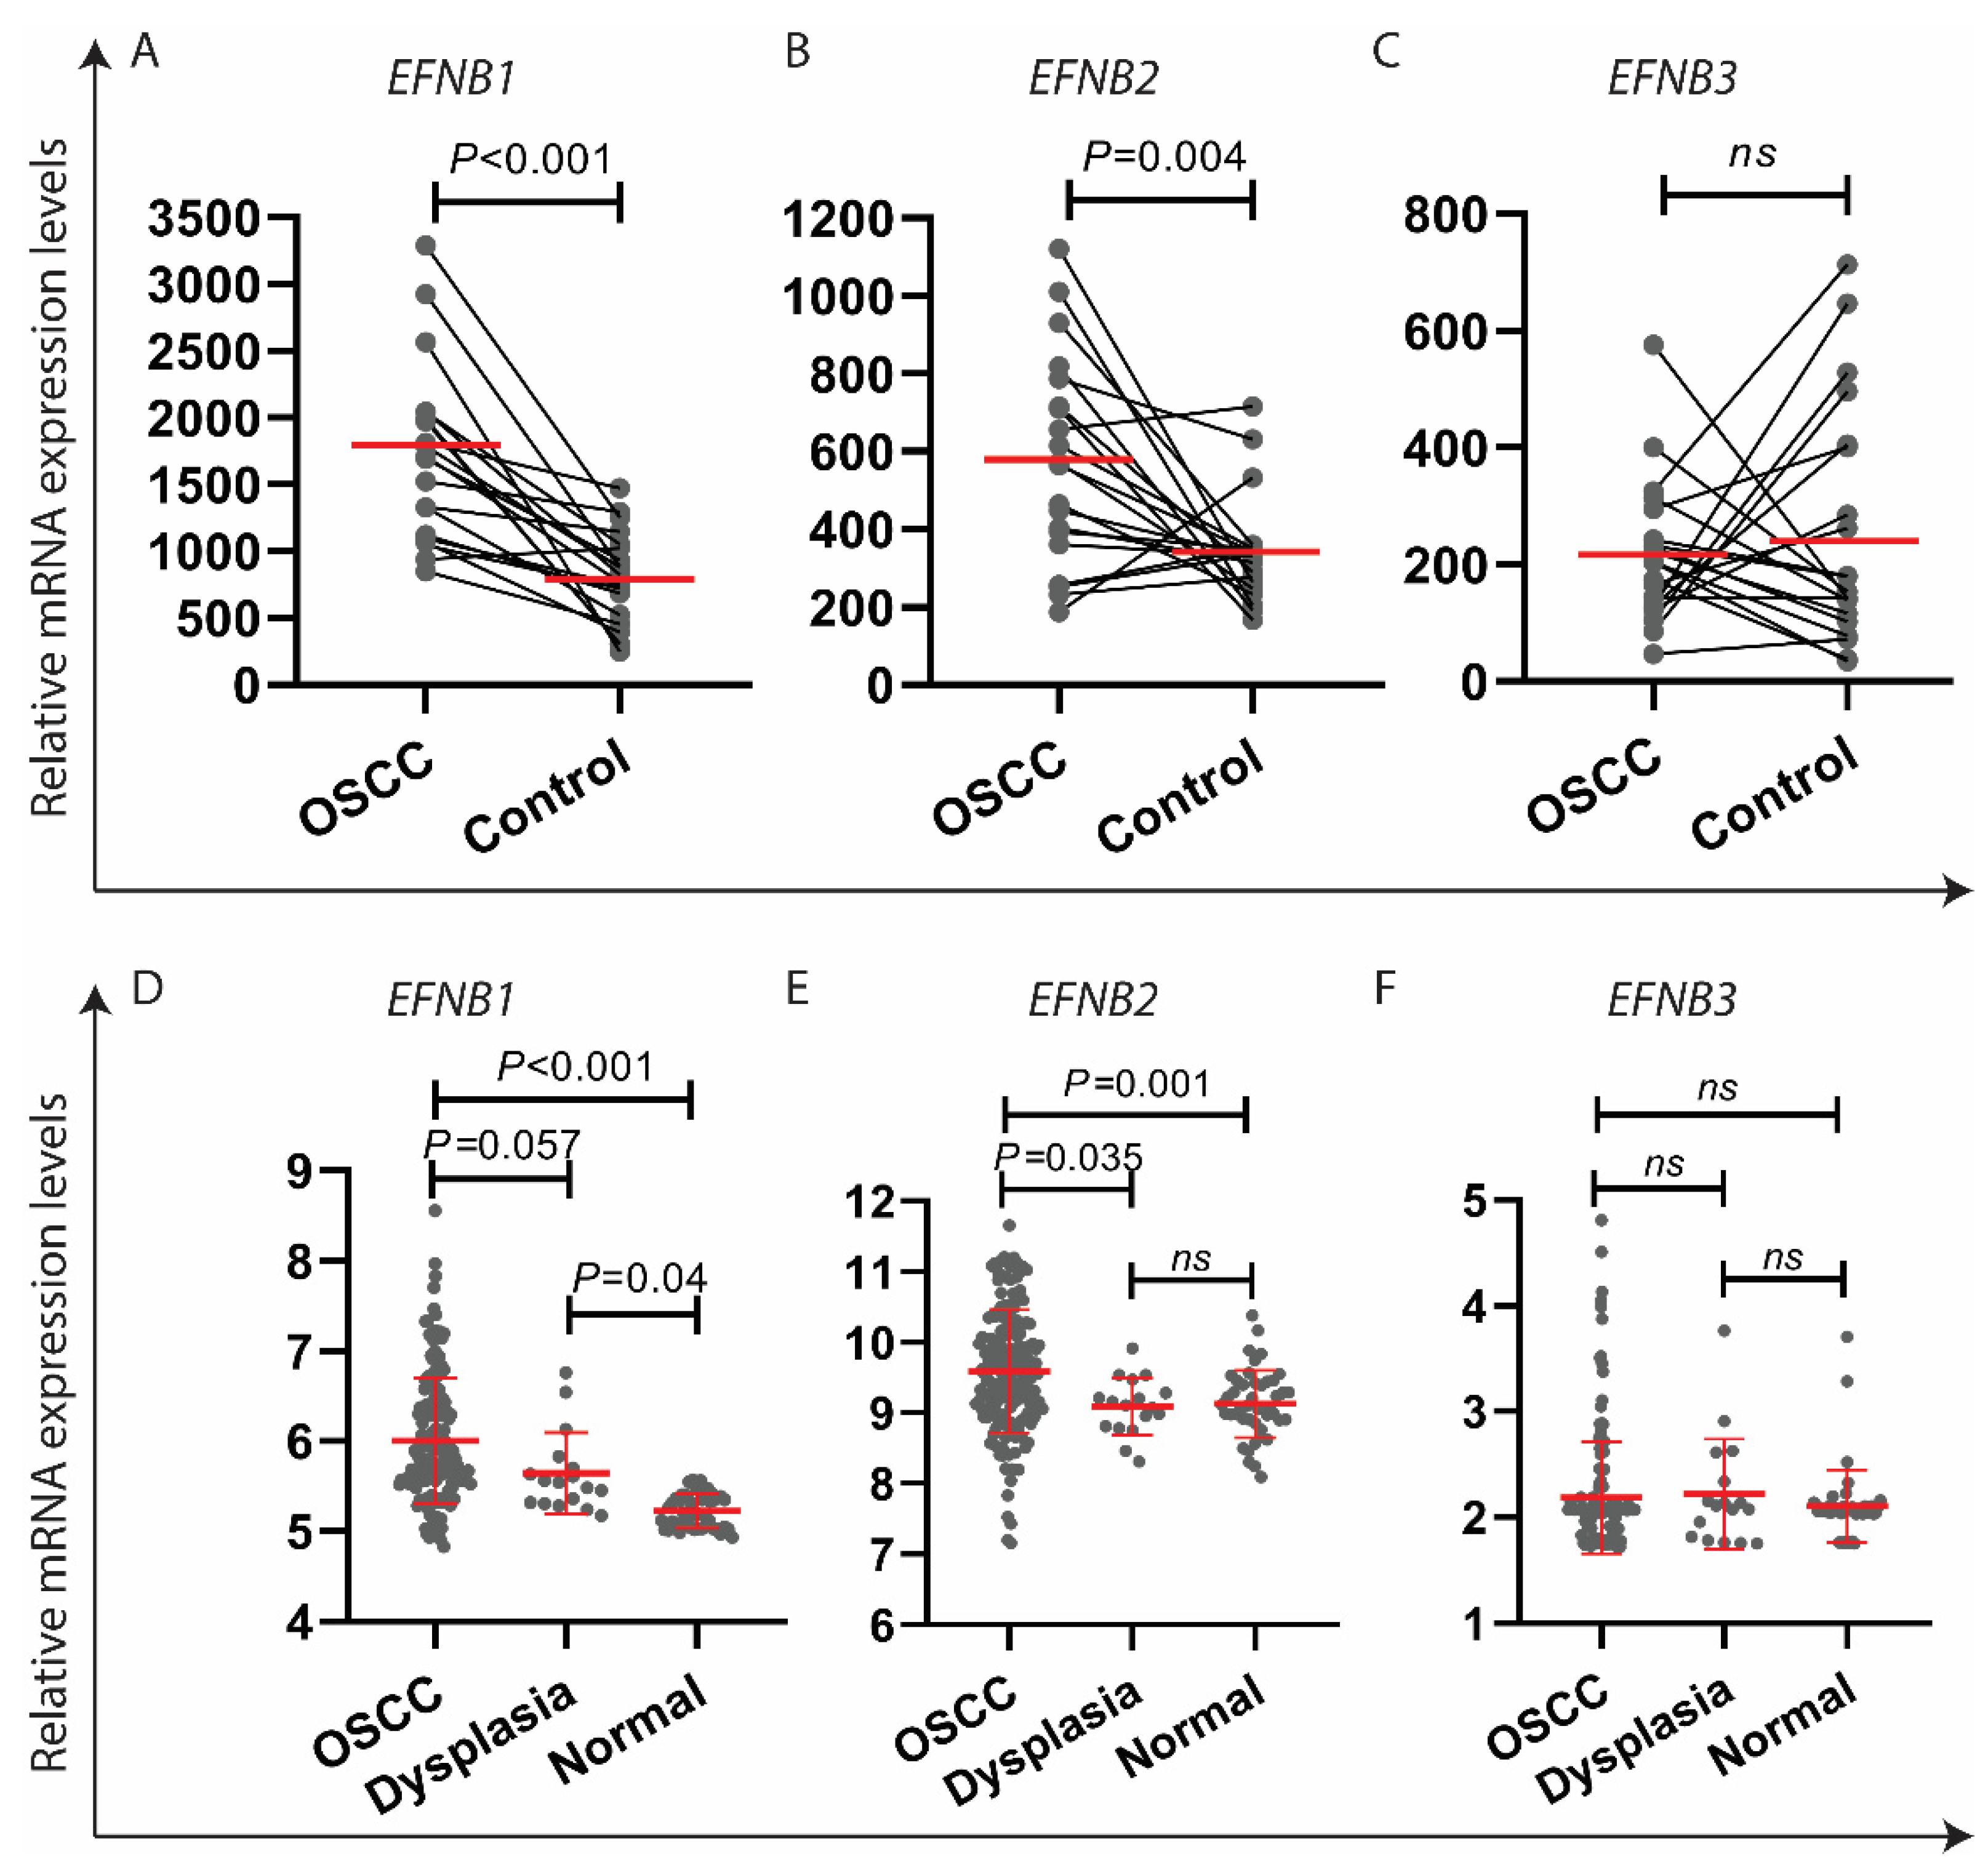
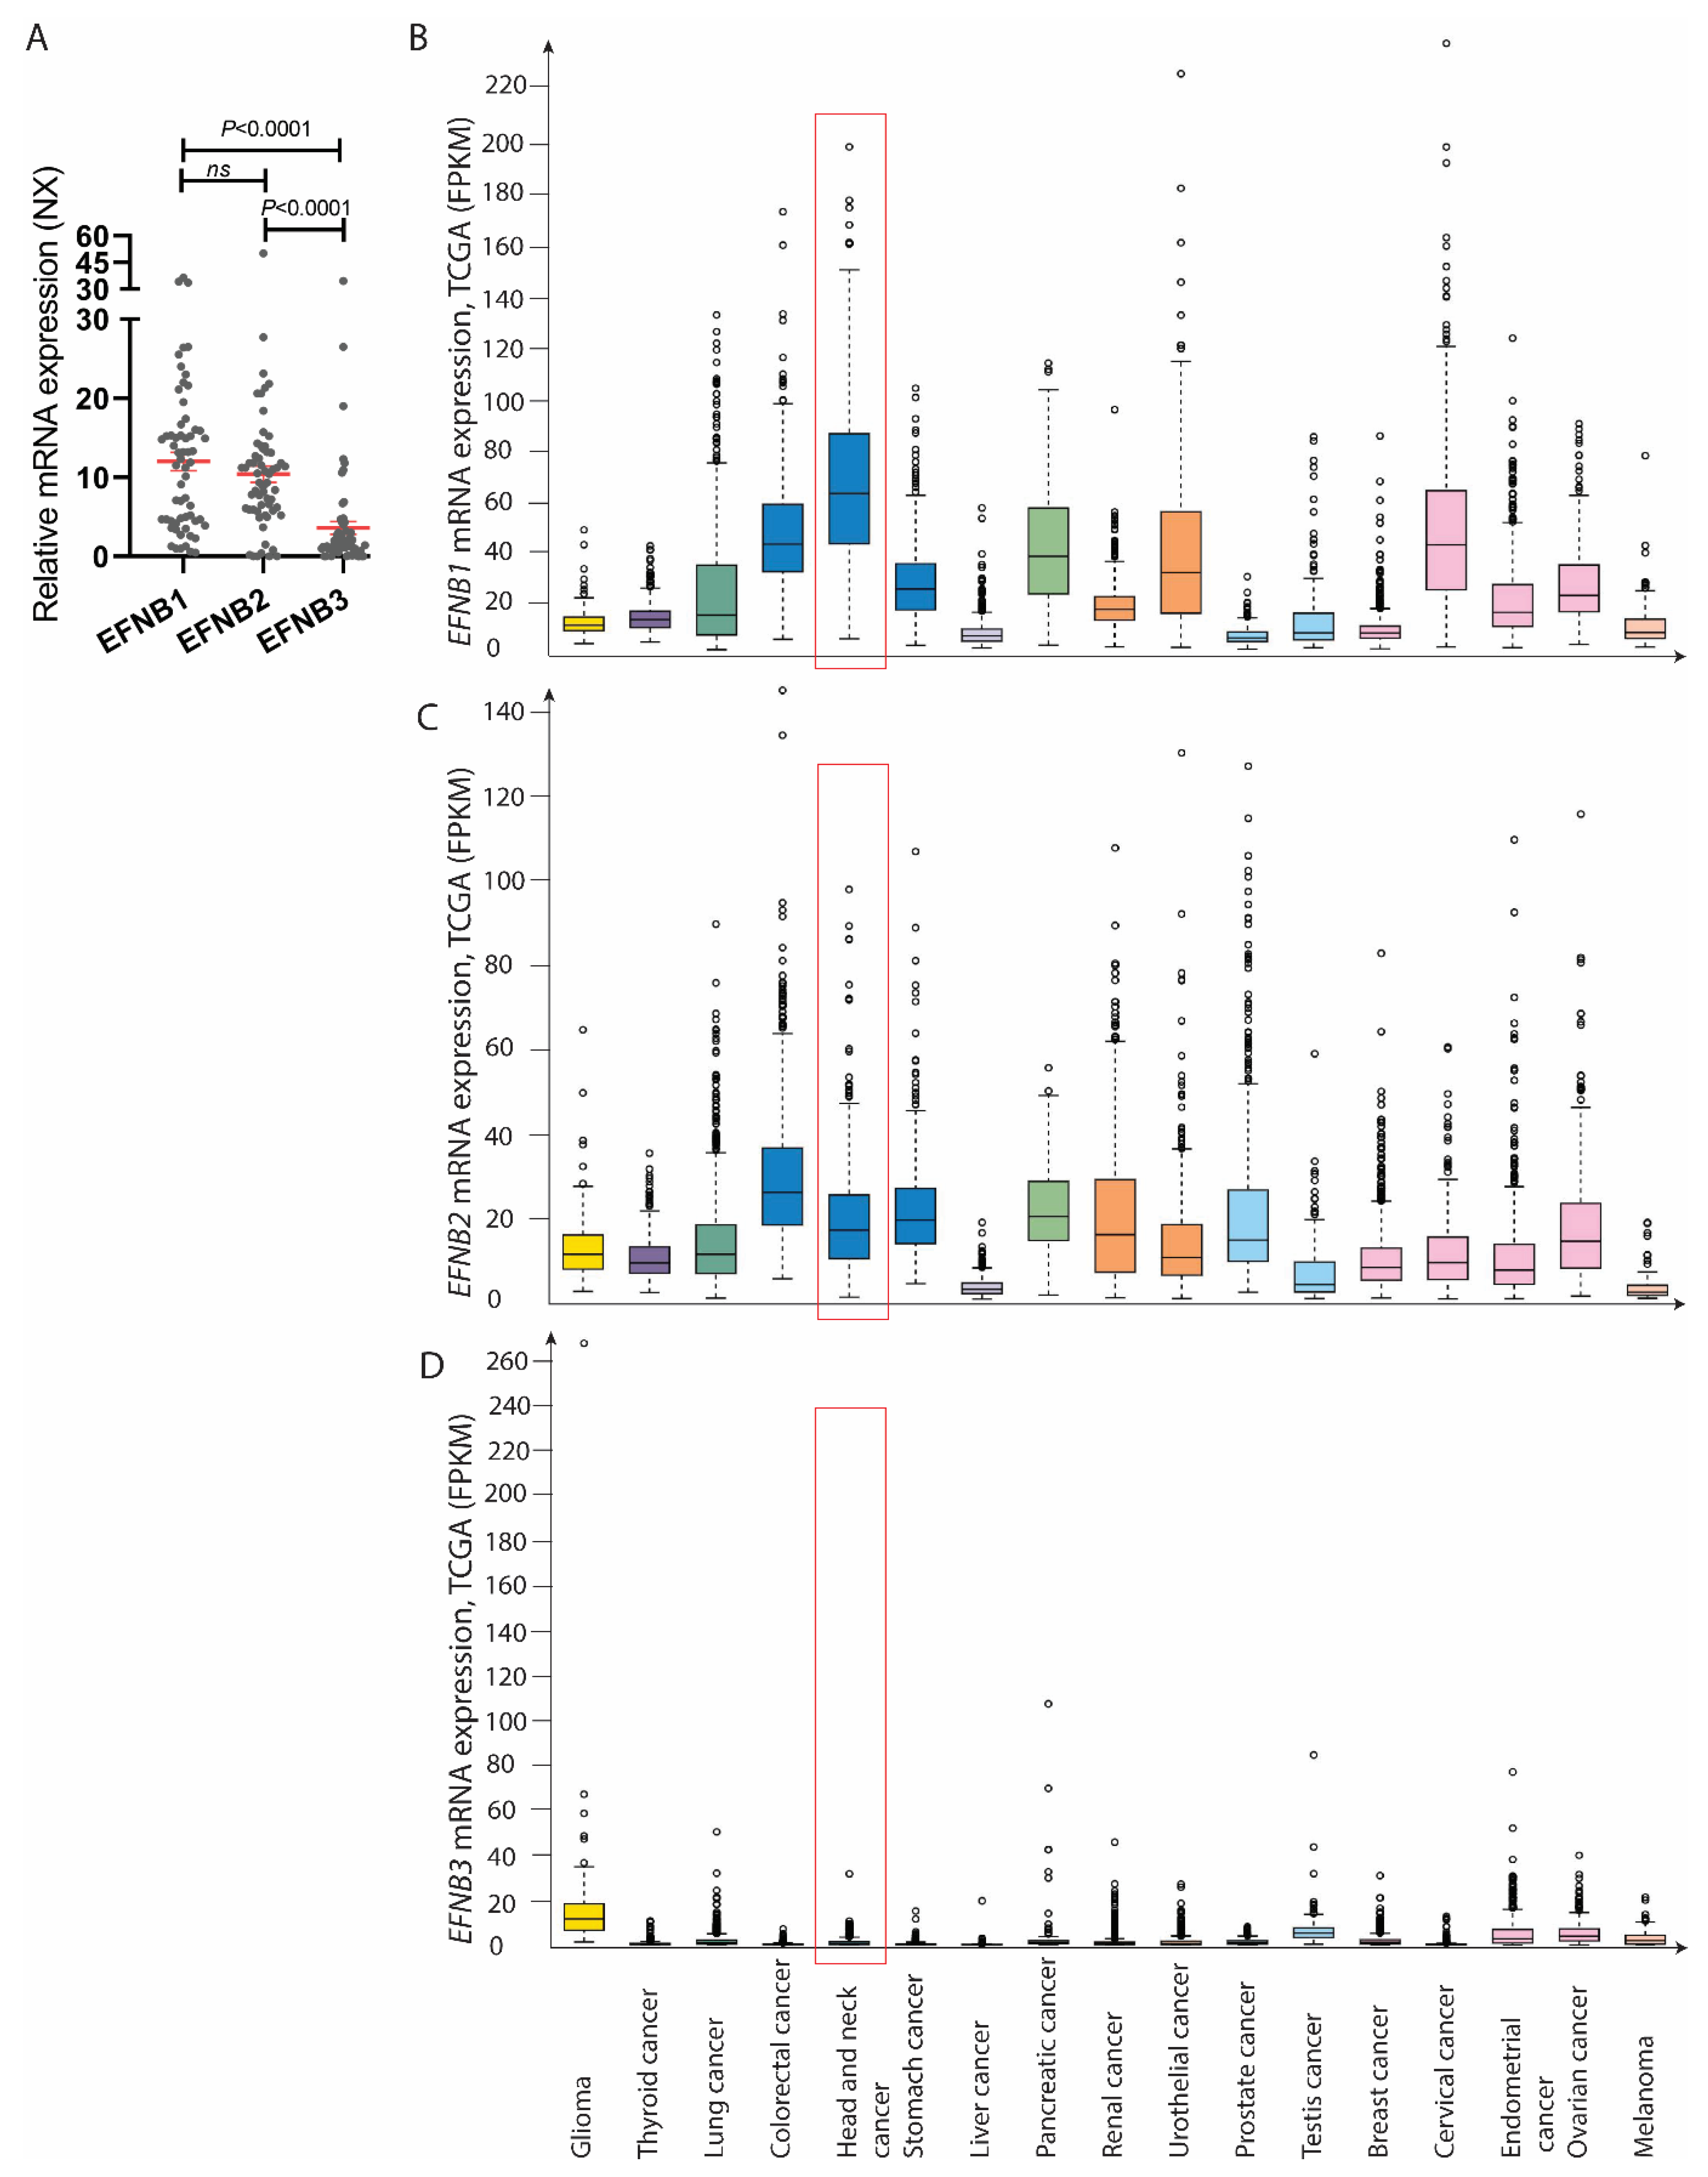
3.3. EFNB1 and EFNB2 mRNA Was Upregulated in OSCC as Compared to the Control Specimens

Both EFNB1 and EFNB2 mRNA levels were found to be significantly up-regulated in OSCC as compared to corresponding normal tissues in two separate OSCC microarray datasets (Figure 2A,B,D,E) [30,31]. In contrast, the expression of EFNB3 was found to be similar between OSCC and controls (Figure 2C,F). Although the EFNB1 mRNA levels were higher in oral dysplastic lesions as compared to the normal controls (Figure 2D), the EFNB2 and EFNB3 mRNA levels were similar between normal and oral dysplastic lesions (Figure 2E,F). Examination of “The Consensus mRNA dataset” showed that the normalized mRNA expression levels of EFNB1 and EFNB2 were significantly higher than that of EFNB3 in various organs including the oral cavity (tongue) (Figure 3A). Similar to these data, mRNA expression levels of EFNB1 and EFNB2 were relatively higher than that of EFNB3 in several types of malignancies including that of OSCC (Figure 3B–D).

3.4. HPA008999 Immunoreactivity Scores Were Positively Associated with Clinical Stage, but Negatively with Tumor Differentiation

HPA008999 immunoreactivity (predominantly a mixed membranous and cytoplasmic expression) was found in tumor cells and keratinocytes in the basal and suprabasal layers in paratumor (located adjacent to the tumor tissue) epithelium with histologically normal structure. Besides the tumor cells, the HPA008999 immunoreactivity was also noticed occasionally in inflammatory cells, endothelial cells, structures in minor salivary glands and skeletal muscle fibers. Out of the 119 OSCC cases examined, 70 (58.8%) and 68 (57.1%) cases showed immunoreactivity to HPA008999 at the tumor center and the invading front areas, respectively.
Based on the immunopositivity of tumor cells, irrespective of the sub-cellular localization, OSCC cases were stratified into high (score 3) and low (scores 0–2) expressing groups, both in the tumor center and the tumor invading front area (Figure 4A–D). HPA008999 immunoreactivity scores at the tumor centers and the corresponding invading front areas were found to be similar in the majority (83 (70.33%)) of OSCC cases (p = 0.075) (Supplementary Tables S1 and S2). However, in 24 cases (20.16%) of the OSCC subsets, the immunoexpression scores at the invading front areas were higher, whereas 10 cases (8.4%) had lower scores at the invading front as compared to the corresponding tumor centers (Supplementary Table S1). Chi-square tests revealed significant associations between OSCC cases with high HPA008999 immunoreactivity at the tumor center with higher tumor stage (positive association, p = 0.032) and poor tumor differentiation (negative association, p = 0.014) (Table 1). Furthermore, OSCC cases with high HPA008999 immunoreactivity at the tumor invading front area were associated significantly with both higher age (p = 0.004) and poor tumor differentiation (p = 0.006) (Supplementary Table S3).

3.5. Higher Immunoreactivity of HPA008999 at the Tumor Center Was Associated with Reduced 5-Year Overall Survival Probabilities of OSCC Patients

When OSCC cases were stratified with respect to HPA008999 immunoreactivity, OSCC cases with an immunoreactivity score of 3 at the tumor center were associated with significantly worse 5-year survival probabilities (p = 0.046, Figure 4E) than that of OSCC with lower (0–2) immunoreactivity scores. As the OSCC with scores 0–2 were found to perform similarly with respect to 5-year survival probabilities, these cases were merged into the ‘low expression group’ for further statistical analyses, whereas score 3 was denoted as the ‘high expression group’. In parallel, OSCC with high HPA008999 immunoreactivity at the tumor center were found to have significantly reduced 5-year survival probabilities (p = 0.006, Figure 4F) compared to OSCC with low immunoreactivity.
Nevertheless, despite similar trends as that for tumor center, associations between the HPA008999 immunoreactivity at the invading front/island and 5-year survival probabilities were not significant (data not shown).

3.6. Higher Immunoreactivity of HPA008999 Was Found to Be an Independent Predictor for Reduced 5-Year Overall Survival of OSCC Patients

Multivariate Cox regression models were created by including all clinicopathological variables (HPA008999 immunoreactivity, clinical stage, recurrence in 5-year duration, and patients’ age) that were significant with Univariate Cox analysis for 5-year survival probabilities (Table 2). High HPA008999 immunoreactivity at the tumor center was found to be an independent predictor for low 5-year survival probabilities (Hazard Ratio: 1.84, CI: 1.10–3.08, p = 0.02, Table 2).

4. Discussion

Similar to previous reports in HNSCC [38,39], analysis of the external transcriptomic datasets showed significant up-regulation of EFNB2 mRNA in OSCC as compared to the normal controls (Figure 2C,D). In line with EFNB2, the mRNA expression levels of EFNB1 were also found to be up-regulated in OSCC specimens as compared to the normal controls in the external transcriptomic datasets. Interestingly, the mRNA levels of EFNB3 were found to be similar between OSCC and control specimens. These data indicate that overexpression of EFNB1 and EFNB2 mRNA, but not of EFNB3, might be linked to HNSCC progression. Although the functional significance of ephrin-B1 in OSCC is currently unknown and warrants further studies, ephrin-B2 was previously shown to promote cell proliferation, invasion and therapy resistance in OSCC/HNSCC [20,40].
Cross-reactivity and poor specificity of antibodies have been major limitations of immunoassays in life science research, including biomarker studies [41,42]. Hence, investigation of antibodies with respect to their specificity and cross-reactivity with similar proteins is mandatory for obtaining reliable and meaningful results in IHC based studies [41]. In the current work, analysis of the immunogen amino acid sequence used to generate HPA008999 antibody indicated a possibility for reactivity not only to ephrin-B2 but also to other ephrin-B members. Indeed, Western blot analysis using transfectant lysates from all ephrin-B members demonstrated that HPA008999 could react to ephrin-B1 and ephrin-B3 lysates, while low or no reactivity was observed to ephrin-B2 lysates (Figure 1B). Still, we demonstrated good reactivity of HPA008999 to ephrin-B2 when ephrin-B2 was concentrated by precipitation with Eph-B2-Fc, indicating that the expression levels of ephrin-B2 in lysates from transfected cells were below detection of HPA008999 by Western blot analysis (Figure 1C). Additionally, the concentration of ephrin-B1 with Eph-B2-Fc showed strong reactivity with HPA008999 (Figure 1C). Ephrin-B3 was poorly concentrated with Eph-B2-Fc but could be precipitated using HPA008999 (Figure 1D,E). Overall, the HPA008999 antibody could react with all ephrin-B members. The reaction between the HPA008999 antibody and all ephrin-B members was further independently validated by using immunocytochemistry in HEK-293T cells (Figure 1F).
These results imply that IHC with the HPA008999 antibody can detect ephrin-B1, -B2 and/or -B3 if expressed in the given tissue. It was interesting to note that mRNA expression of EFNB3 was found to be significantly lower than that of EFNB1 and EFNB2 in a wide range of normal human tissues including the tongue, and in human malignancies including OSCC (Figure 3). Similar observations were reported in small cell lung carcinoma specimens and also in cell lines [43]. Hence, it is reasonable to believe that the HPA008999 antibody reactivity in OSCC materials in the current study might mainly reflect the expression of both ephrin-B1 and -B2 and to a lesser extent that of ephrin-B3. However, this observation warrants further study using IHC with specific antibodies for each of the ephrin-B members in the same OSCC material.
Here, by using the HPA008999 antibody we examined the prognostic significance of the HPA008999 immunoreactivity with respect to intra-tumor localization in OSCC. A higher immunoreactivity score at the tumor center was associated with clinicopathological features of poor prognosis, such as higher tumor stage and poor differentiation (Table 1). The high immunoreactivity score at the invading front, however, was associated only with poor tumor differentiation (Supplementary Table S3). Furthermore, the HPA008999 immunoreactivity scores only at the tumor center but not at the tumor invading front area were found to be significantly associated with reduced 5-year survival probabilities (Figure 4E,F). Multivariate Cox proportional hazard analysis further indicated that the HPA008999 immunoreactivity score at the tumor center might be useful as an independent prognostic factor in OSCC.
Given that the tumor cells at the invading front area are believed to have a more aggressive phenotype and are associated with specific molecular alterations more relevant for patient prognosis [34,36,44], the absence of a significant correlation between ephrin-B1/B2/B3 scores at the invading front area with tumor stage and patient survival was rather surprising. This might be related to the differential HPA008999 immunoreactivity scores in the invading front area as compared to the corresponding tumor centers in subsets of OSCC (Supplementary Table S1). Nevertheless, the significant association between high HPA008999 immunoreactivity at the invasive front area and poor tumor differentiation is in line with that of the tumor center and further substantiates a role for ephrin-B members in tumor differentiation. Although intra-tumor heterogeneity of ephrin-B1 and -B3 expression and its impact on prognosis is unknown in human cancers, the deregulation of ephrin-B2 expression at the tumor front as compared to the tumor center was previously linked to the invasive phenotype of glioblastoma [18] and malignant melanoma [24] tumor cells. Given that ephrin-B2 promotes cell proliferation, migration and invasion, and enhances therapy resistance in OSCC [20,40], it is possible that these effects might be related to poor prognosis in OSCC patients with higher expression of ephrin-B2. Nevertheless, the functional roles of ephrin-B1 and ephrin-B3 in OSCC are currently unknown and warrant further studies.
In conclusion, the HPA008999 antibody reacted with ephrin-B1 and -B3. These data emphasize the need for the investigation of antibodies for cross-reactivity to similar protein members to obtain reliable and meaningful results in IHC based studies. Furthermore, despite similar HPA008999 immunoreactivity scores at the tumor center and corresponding invading front area, only the expression scores at the tumor center were associated with reduced 5-year overall survival of OSCC patients. Overall, these results demonstrate the presence of intra-tumor heterogeneity for HPA008999 immunoreactivity in OSCC, and further emphasize the significance of the selection of proper intra-tumor locations for biomarker studies.

Supplementary Materials

The following supporting information can be downloaded at: https://www.mdpi.com/article/10.3390/oral2020015/s1, Table S1: HPA008999 immunoreactivity scores at tumor center and corresponding tumor invading front/islands in OSCC cases; Table S2: Correlation between HPA008999 immunoreactivity scores at the tumor center and the corresponding tumor invading front/islands in OSCC cases; Table S3: HPA008999 immunoreactivity scores at tumor invading front/islands and clinicopathological variables of the OSCC patients.

Author Contributions

Conceptualization, D.S. and H.-C.Å.; Methodology, D.S., E.M.V., D.T., O.J.F.S., S.P., T.M.S., D.-E.C., B.T. and H.-C.Å.; Software, D.S., E.M.V. and O.J.F.S.; Formal analysis, D.S. and H.-C.Å.; Investigation, D.S, E.M.V., D.T., O.J.F.S., S.P., T.M.S., D.-E.C., B.T. and H.-C.Å.; Writing—original draft preparation, D.S. and H.-C.Å.; Writing—review and editing, D.S, E.M.V., D.T., O.J.F.S., S.P., T.M.S., D.-E.C., B.T. and H.-C.Å.; Visualization, D.S., T.M.S., B.T. and H.-C.Å.; Project administration, D.S. and H.-C.Å.; Funding acquisition, D.S. and H.-C.Å. All authors have read and agreed to the published version of the manuscript.

Funding

This research was funded by Robert and Ella Wenzins legat (D.S.) and the Faculty of Dentistry, University of Oslo (D.S.), Norwegian Cancer Society (H.-C.Å.).

Institutional Review Board Statement

The study was conducted according to the guidelines of the Declaration of Helsinki and approved by The Committee for Medical and Health Research Ethics in West Norway (2010/481 REK vest).

Informed Consent Statement

Informed consent was obtained from all subjects involved in the study that were alive at the beginning of the study. Patient consent was waived for the patients who were dead at the beginning of the study.

Data Availability Statement

Data supporting reported results will be made publicly available if the manuscript is accepted for publication.

Conflicts of Interest

The authors declare no conflict of interest.

References

  1. Jemal, A.; Siegel, R.; Xu, J.; Ward, E. Cancer statistics, 2010. CA Cancer J. Clin. 2010, 60, 277–300. [Google Scholar] [CrossRef] [PubMed]
  2. Eph Nomenclature Committee. Unified nomenclature for Eph family receptors and their ligands, the Ephrins. Cell 1997, 90, 403–404. [Google Scholar] [CrossRef] [Green Version]
  3. Himanen, J.-P.; Rajashankar, K.R.; Lackmann, M.; Cowan, C.A.; Henkemeyer, M.; Nikolov, D.B. Crystal structure of an Eph receptor–ephrin complex. Nature 2001, 414, 933–938. [Google Scholar] [CrossRef] [PubMed]
  4. Mosch, B.; Reissenweber, B.; Neuber, C.; Pietzsch, J. Eph receptors and Ephrin ligands: Important players in angiogenesis and tumor angiogenesis. J. Oncol. 2010, 2010, 135285. [Google Scholar] [CrossRef] [PubMed]
  5. Pasquale, E.B. Eph–ephrin promiscuity is now crystal clear. Nat. Neurosci. 2004, 7, 417–418. [Google Scholar] [CrossRef]
  6. Pasquale, E.B. Eph receptors and ephrins in cancer: Bidirectional signalling and beyond. Nat. Rev. Cancer 2010, 10, 165–180. [Google Scholar] [CrossRef] [Green Version]
  7. Kaenel, P.; Mosimann, M.; Andres, A.C. The multifaceted roles of Eph/ephrin signaling in breast cancer. Cell Adhes. Migr. 2012, 6, 138–147. [Google Scholar] [CrossRef] [Green Version]
  8. Mellitzer, G.; Xu, Q.; Wilkinson, D.G. Eph receptors and ephrins restrict cell intermingling and communication. Nature 1999, 400, 77–81. [Google Scholar] [CrossRef]
  9. Helbling, P.M.; Saulnier, D.M.; Brandli, A.W. The receptor tyrosine kinase EphB4 and ephrin-B ligands restrict angiogenic growth of embryonic veins in Xenopus laevis. Development 2000, 127, 269–278. [Google Scholar] [CrossRef]
  10. Foo, S.S.; Turner, C.J.; Adams, S.; Compagni, A.; Aubyn, D.; Kogata, N.; Lindblom, P.; Shani, M.; Zicha, D.; Adams, R.H. Ephrin-B2 controls cell motility and adhesion during blood-vessel-wall assembly. Cell 2006, 124, 161–173. [Google Scholar] [CrossRef] [Green Version]
  11. Adams, R.H.; Wilkinson, G.A.; Weiss, C.; Diella, F.; Gale, N.W.; Deutsch, U.; Risau, W.; Klein, R. Roles of ephrinB ligands and EphB receptors in cardiovascular development: Demarcation of arterial/venous domains, vascular morphogenesis, and sprouting angiogenesis. Genes Dev. 1999, 13, 295–306. [Google Scholar] [CrossRef] [PubMed]
  12. Huynh-Do, U.; Vindis, C.C.; Liu, H.; Cerretti, D.P.; McGrew, J.T.; Enriquez, M.; Chen, J.; Daniel, T.O. Ephrin-B1 transduces signals to activate integrin-mediated migration, attachment and angiogenesis. J. Cell Sci. 2002, 115, 3073–3081. [Google Scholar] [CrossRef] [PubMed]
  13. Flanagan, J.G.; Vanderhaeghen, P. The ephrins and Eph receptors in neural development. Annu. Rev. Neurosci. 1998, 21, 309–345. [Google Scholar] [CrossRef] [PubMed] [Green Version]
  14. Dimidschstein, J.; Passante, L.; Dufour, A.; Van Den Ameele, J.; Tiberi, L.; Hrechdakian, T.; Adams, R.; Klein, R.; Lie, D.C.; Jossin, Y.; et al. Ephrin-B1 controls the columnar distribution of cortical pyramidal neurons by restricting their tangential migration. Neuron 2013, 79, 1123–1135. [Google Scholar] [CrossRef] [Green Version]
  15. Hruska, M.; Dalva, M.B. Ephrin regulation of synapse formation, function and plasticity. Mol. Cell. Neurosci. 2012, 50, 35–44. [Google Scholar] [CrossRef] [Green Version]
  16. Chen, J.; Zhuang, G.; Frieden, L.; Debinski, W. Eph receptors and Ephrins in cancer: Common themes and controversies. Cancer Res. 2008, 68, 10031–10033. [Google Scholar] [CrossRef] [Green Version]
  17. Nakada, M.; Drake, K.L.; Nakada, S.; Niska, J.A.; Berens, M.E. Ephrin-B3 ligand promotes glioma invasion through activation of Rac1. Cancer Res. 2006, 66, 8492–8500. [Google Scholar] [CrossRef] [Green Version]
  18. Depner, C.; Zum Buttel, H.; Böğürcü, N.; Cuesta, A.M.; Aburto, M.R.; Seidel, S.; Finkelmeier, F.; Foss, F.; Hofmann, J.; Kaulich, K.; et al. EphrinB2 repression through ZEB2 mediates tumour invasion and anti-angiogenic resistance. Nat. Commun. 2016, 7, 12329. [Google Scholar] [CrossRef]
  19. Liu, W.; Jung, Y.D.; Ahmad, S.A.; McCarty, M.F.; Stoeltzing, O.; Reinmuth, N.; Fan, F.; Ellis, L.M. Effects of overexpression of ephrin-B2 on tumour growth in human colorectal cancer. Br. J. Cancer 2004, 90, 1620–1626. [Google Scholar] [CrossRef] [Green Version]
  20. Sasabe, E.; Tomomura, A.; Tomita, R.; Sento, S.; Kitamura, N.; Yamamoto, T. Ephrin-B2 reverse signaling regulates progression and lymph node metastasis of oral squamous cell carcinoma. PLoS ONE 2017, 12, e0188965. [Google Scholar] [CrossRef]
  21. Beauchamp, A.; Debinski, W. Ephs and ephrins in cancer: Ephrin-A1 signalling. Semin. Cell Dev. Biol. 2012, 23, 109–115. [Google Scholar] [CrossRef] [PubMed] [Green Version]
  22. Barquilla, A.; Pasquale, E.B. Eph receptors and Ephrins: Therapeutic opportunities. Annu. Rev. Pharmacol. Toxicol. 2015, 55, 465–487. [Google Scholar] [CrossRef] [PubMed] [Green Version]
  23. Pasquale, E.B. Eph-Ephrin Bidirectional Signaling in Physiology and Disease. Cell 2008, 133, 38–52. [Google Scholar] [CrossRef] [PubMed] [Green Version]
  24. Meyer, S.; Hafner, C.; Guba, M.; Flegel, S.; Geissler, E.K.; Becker, B.; Koehl, G.E.; Orsó, E.; Landthaler, M.; Vogt, T. ephrin-B2 overexpression enhances integrin-mediated ECM-attachment and migration of B16 melanoma cells. Int. J. Oncol. 2005, 27, 1197–1206. [Google Scholar] [CrossRef]
  25. Bundesen, L.Q.; Scheel, T.A.; Bregman, B.S.; Kromer, L.F. Ephrin-B2 and EphB2 regulation of astrocyte-meningeal fibroblast interactions in response to spinal cord lesions in adult rats. J. Neurosci. 2003, 23, 7789–7800. [Google Scholar] [CrossRef] [Green Version]
  26. Cramer, K.S.; Karam, S.D.; Bothwell, M.; Cerretti, D.P.; Pasquale, E.B.; Rubel, E.W. Expression of EphB receptors and EphrinB ligands in the developing chick auditory brainstem. J. Comp. Neurol. 2002, 452, 51–64. [Google Scholar] [CrossRef]
  27. Noberini, R.; Rubio de la Torre, E.; Pasquale, E.B. Profiling Eph receptor expression in cells and tissues: A targeted mass spectrometry approach. Cell Adhes. Migr. 2012, 6, 102–112. [Google Scholar] [CrossRef] [Green Version]
  28. Uhlén, M.; Fagerberg, L.; Hallström, B.M.; Lindskog, C.; Oksvold, P.; Mardinoglu, A.; Sivertsson, Å.; Kampf, C.; Sjöstedt, E.; Asplund, A.; et al. Tissue-based map of the human proteome. Science 2015, 347, 1260419. [Google Scholar] [CrossRef]
  29. Munthe, E.; Rian, E.; Holien, T.; Rasmussen, A.-M.; Levy, F.O.; Aasheim, H.-C. Ephrin-B2 is a candidate ligand for the Eph receptor, EphB6. FEBS Lett. 2000, 466, 169–174. [Google Scholar] [CrossRef] [Green Version]
  30. Estilo, C.L.; O-charoenrat, P.; Talbot, S.; Socci, N.D.; Carlson, D.L.; Ghossein, R.; Williams, T.; Yonekawa, Y.; Ramanathan, Y.; Boyle, J.O.; et al. Oral tongue cancer gene expression profiling: Identification of novel potential prognosticators by oligonucleotide microarray analysis. BMC Cancer 2009, 9, 11. [Google Scholar] [CrossRef] [Green Version]
  31. Chen, C.; Méndez, E.; Houck, J.; Fan, W.; Lohavanichbutr, P.; Doody, D.; Yueh, B.; Futran, N.D.; Upton, M.; Farwell, D.G.; et al. Gene expression profiling identifies genes predictive of oral squamous cell carcinoma. Cancer Epidemiol. Biomark. Prev. 2008, 17, 2152–2162. [Google Scholar] [CrossRef] [PubMed] [Green Version]
  32. Forrest, A.R.R.; Kawaji, H.; Rehli, M.; Kenneth Baillie, J.; de Hoon, M.J.L.; Haberle, V.; Lassmann, T.; Kulakovskiy, I.V.; Lizio, M.; Itoh, M.; et al. A promoter-level mammalian expression atlas. Nature 2014, 507, 462–470. [Google Scholar] [CrossRef] [PubMed] [Green Version]
  33. Lawrence, M.S.; Sougnez, C.; Lichtenstein, L.; Cibulskis, K.; Lander, E.; Gabriel, S.B.; Getz, G.; Ally, A.; Balasundaram, M.; Birol, I.; et al. Comprehensive genomic characterization of head and neck squamous cell carcinomas. Nature 2015, 517, 576–582. [Google Scholar] [CrossRef] [Green Version]
  34. Pandey, S.; Osman, T.A.; Sharma, S.; Vallenari, E.M.; Shahdadfar, A.; Pun, C.B.; Gautam, D.K.; Uhlin-Hansen, L.; Rikardsen, O.; Johannessen, A.C.; et al. Loss of S100A14 expression at the tumor-invading front correlates with poor differentiation and worse prognosis in oral squamous cell carcinoma. Head Neck 2020, 42, 2088–2098. [Google Scholar] [CrossRef] [PubMed] [Green Version]
  35. Altman, D.G.; McShane, L.M.; Sauerbrei, W.; Taube, S.E. Reporting recommendations for tumor marker prognostic studies (REMARK): Explanation and elaboration. PLoS Med. 2012, 9, e1001216. [Google Scholar] [CrossRef] [PubMed] [Green Version]
  36. Sapkota, D.; Bruland, O.; Parajuli, H.; Osman, T.A.; Teh, M.-T.; Johannessen, A.C.; Costea, D.E. S100A16 promotes differentiation and contributes to a less aggressive tumor phenotype in oral squamous cell carcinoma. BMC Cancer 2015, 15, 631. [Google Scholar] [CrossRef] [PubMed] [Green Version]
  37. Bankhead, P.; Loughrey, M.B.; Fernández, J.A.; Dombrowski, Y.; McArt, D.G.; Dunne, P.D.; McQuaid, S.; Gray, R.T.; Murray, L.J.; Coleman, H.G.; et al. QuPath: Open source software for digital pathology image analysis. Sci. Rep. 2017, 7, 16878. [Google Scholar] [CrossRef] [Green Version]
  38. Oweida, A.; Bhatia, S.; Hirsch, K.; Calame, D.; Griego, A.; Keysar, S.; Pitts, T.; Sharma, J.; Eckhardt, G.; Jimeno, A.; et al. Ephrin-B2 overexpression predicts for poor prognosis and response to therapy in solid tumors. Mol. Carcinog. 2017, 56, 1189–1196. [Google Scholar] [CrossRef] [Green Version]
  39. Yavrouian, E.J.; Sinha, U.K.; Rice, D.H.; Salam, M.T.; Gill, P.S.; Masood, R. The significance of EphB4 and EphrinB2 expression and survival in head and neck squamous cell carcinoma. Arch. Otolaryngol. Head Neck Surg. 2008, 134, 985–991. [Google Scholar] [CrossRef] [Green Version]
  40. Bhatia, S.; Sharma, J.; Bukkapatnam, S.; Oweida, A.; Lennon, S.; Phan, A.; Milner, D.; Uyanga, N.; Jimeno, A.; Raben, D.; et al. Inhibition of EphB4–Ephrin-B2 signaling enhances response to Cetuximab–radiation therapy in head and neck cancers. Clin. Cancer Res. 2018, 24, 4539–4550. [Google Scholar] [CrossRef] [Green Version]
  41. Fritschy, J.-M. Is my antibody-staining specific? How to deal with pitfalls of immunohistochemistry. Eur. J. Neurosci. 2008, 28, 2365–2370. [Google Scholar] [CrossRef] [PubMed]
  42. Rhodes, K.J.; Trimmer, J.S. Antibodies as valuable neuroscience research tools versus reagents of mass distraction. J. Neurosci. 2006, 26, 8017–8020. [Google Scholar] [CrossRef] [PubMed] [Green Version]
  43. Tang, X.X.; Brodeur, G.M.; Campling, B.G.; Ikegaki, N. Coexpression of transcripts encoding EPHB receptor protein tyrosine kinases and their Ephrin-B ligands in human small cell lung carcinoma. Clin. Cancer Res. 1999, 5, 455–460. [Google Scholar] [PubMed]
  44. Bryne, M. Is the invasive front of an oral carcinoma the most important area for prognostication? Oral Dis. 1998, 4, 70–77. [Google Scholar] [CrossRef]
Figure 1. Anti-ephrin-B2 antibody HPA008999 reacted to all ephrin-B members. (A) Comparison of amino acid sequences in the intracellular domains of ephrin-B1, ephrin-B2 and ephrin-B3. Boxed area represents the immunogen amino acid sequence for the anti-ephrin-B2 antibody HPA008999. Black letters represent matching, whereas red letters represent non-matching amino acids compared to ephrin-B2. Grey letters represent amino acid outside the intracellular domain. (B) HEK-293T cells were transfected with EFNB1, EFNB2 or EFNB3 alone or co-transfected with EFNB1 and EFNB2 and cell lysates were subjected to Western blot analysis using antibody HPA008999. GAPDH was used as a loading control. (C) Ephrin-B1, -B2 or -B3 were transiently expressed in HEK-293T cells and cell lysates were precipitated with EphB2-Fc and separated on SDS-PAGE and blotted. Blots were probed with HPA008999 antibody. (D) Ephrin-B1, -B2 or -B3 were transiently expressed in HEK-293T cells and cell lysates alone or after precipitation with EphB2-Fc were separated on SDS-PAGE and blotted. Blots were probed with an anti-Ephrin-B3 antibody. (E) Ephrin-B1, -B2 or -B3 were transiently expressed in HEK-293T cells and cell lysates alone or after precipitation with HPA008999 antibody, were separated on SDS-PAGE and blotted. Blots were probed with an anti-Ephrin-B3 antibody. (F) Representative images demonstrating strong membranous/cytoplasmic staining in HEK-293T cells transfected with EFNB1, EFNB2 or EFNB3 using HPA008999 antibody as compared to untransfected HEK-293T cells. No staining was observed in isotype controls.
Oral 02 00015 g001
Figure 2. EFNB1 and EFNB2 mRNA levels were up-regulated in OSCC. EFNB1 and EFNB2 mRNA levels were found to be significantly upregulated in OSCC specimens as compared to normal controls (A,B,D,E) in two independent OSCC microarray datasets ((A) GSE13601 [30]; consisting of tongue OSCC and pair-wised normal tongue epithelium, n = 20, and (B) GSE30784 [31], consisting of 167 OSCC, 45 normal control and 17 oral dysplasia). However, EFNB3 mRNA levels were found to be similar between OSCC and controls (C,F). Paired Student’s t-tests were performed in (AC), while one-way ANOVA with Tukey’s multiple corrections was used in (DF). Horizontal bars represent mean values. Error bars in D-F represent standard deviations.
Oral 02 00015 g002
Figure 3. mRNA expression levels of EFNB1 and EFNB2 were significantly higher than that of EFNB3 in normal and malignant lesions. (A) Consensus mRNA data for EFNB1, EFNB2 and EFNB3 for different organs including the tongue were exported from the Human Protein Atlas and the expression of the respective genes was compared. (BD) mRNA expression data for 17 different cancer types including HNSCC (consisting of 62% of OSCC) [33] from the TCGA datasets were exported from the Human Protein Atlas portal. mRNA expression levels of EFNB1 and EFNB2 were higher in various human malignancies as compared to that of EFNB3. Red boxes mark expression in HNSCC. FPKM: number Fragments Per Kilobase of exon per Million reads.
Oral 02 00015 g003
Figure 4. Higher HPA008999 immunoreactivity at tumor center was associated with poorer 5 year- overall survival of OSCC patients. (AD) Representative images showing different HPA008999 immunoreactivity scores at the tumor center of OSCC lesions. Kaplan–Meier plots demonstrating poorer 5-year overall survival probabilities for OSCC with score 3 as compared to the scores 0–2 (E) and score 3 as compared to rest of the scores combined (F). Log-Rank test was used for statistical analysis.
Oral 02 00015 g004
Table 1. HPA008999 immunoreactivity scores at tumor center and clinicopathological variables of the OSCC patients.
VariablesLow, n (%)High, n (%)p
Age a (years)
≤6851 (83.6)10 (16.4)0.187
>6842 (73.7)15 (26.3)
Gender
Female40 (80.0)20 (20.0)0.818
Male54 (78.3)15 (21.7)
Smoking b
No26 (70.3)11 (29.7)0.283
Yes44 (80.0)11 (20.0)
Alcohol c
No33 (76.7)10 (23.3)0.986
Yes20 (76.9)6 (23.1)
Anatomic location
Tongue40 (74.1)14 (25.9)0.654
Gingiva and buccal mucosa39 (83.0)8 (17.0)
Floor of the mouth11 (78.6)3 (21.4)
Palate and mucosal lip3 (100.0)0 (0.0)
Differentiation
Poor and moderate11 (57.9)8 (42.1)0.014
Well83 (83.0)17 (17.0)
Lymph node involvement
Negative (N0)66 (82.5)14 (17.5)0.178
Positive (N1 & N2)28 (71.8)11 (28.2)
Tumor size d
T1 & T262 (82.7)13 (17.3)0.155
T3 & T430 (71.4)12 (28.6)
Recurrence
No55 (76.4)17 (23.6)0.388
Yes39 (83.0)8 (17.0)
Tumor stage
Early (1 & 2)49 (87.5)7 (12.5)0.032
Late (3 & 4)45 (71.4)18 (28.6)
Tumor budding e
<541(82.0)9 (18.0)0.430
≥537 (75.5)12 (24.5)
Depth of invasion f
<4 cm28 (82.4)6 (17.6)0.491
≥4 cm28 (75.7)9 (24.3)
OSCCs were stratified into high (score 3) and low (scores 0, 1 and 2) scores groups by using ≥70% of cell positivity as a cut-off. a Patients were categorized into low- and high-age groups based on the median age. Data for the following variables were missing in 1 case (a age), 27 cases (b smoking), 50 cases (c alcohol habit), two cases (d tumor size), 20 cases (48 (e tumor budding) and 48 cases (f depth of invasion).
Table 2. Results of a multivariate Cox regression analysis for predicting the 5 year overall survival of OSCC cases.
Univariate Cox Multivariate Cox
VariablesHazard Ratio95% CIp-ValueHazard Ratio95% CIp-Value
HPA008999
immunoreactivity
Low1.981.19–3.290.0081.841.10–3.0 0.02
High
Age
≤681.160.74–1.830.500
>68
Differentiation
Well0.6950.38–1.240.219
Moderate & poor
Node status
N01.3720.853–2.20.192
N1 & N2
Clinical stage
Early (1 & 2)1.751.1–2.790.0171.500.93–2.410.093
Late (3 & 4)
Recurrence in 5 years1.731.1–2.720.0161.631.03–2.580.034
No
Yes
Depth of invasion1.490.81–2.740.194
<4 cm
≥4 cm
CI: confidence interval.
Publisher’s Note: MDPI stays neutral with regard to jurisdictional claims in published maps and institutional affiliations.

