Article

Bulk-Fill Direct Restorative Materials: An In Vitro Assessment of Their Physio-Mechanical Properties

Department of Oral Rehabilitation, Sir John Walsh Research Institute, Faculty of Dentistry, University of Otago, Dunedin 9016, New Zealand
*
Author to whom correspondence should be addressed.
Oral 2021, 1(2), 75-87; https://doi.org/10.3390/oral1020008
Submission received: 9 March 2021 / Revised: 18 March 2021 / Accepted: 6 April 2021 / Published: 12 April 2021

Abstract

:
Bulk-fill restorative material has gained popularity in clinical practice, due to their perceived timesaving aspect. Objective was to compare the properties of bulk-fill direct restorative materials. Filtek Z350 (CR), Filtek One Bulk Fill Restorative (BF), Fuji IX and EQUIA Forte (EF) were compared. Thirty specimens from each material were prepared according to ISO 4049 for three-point flexural strength. Elastic moduli and hardness (n = 20) were evaluated using nanoindentation. Depth of cure (DC) (n = 20) was measured for BF at three different depths (2, 3, 4 mm) and at two irradiation times (20 and 40 s). Wear testing was carried out for three different periods (3, 6, 12 month(s)). All specimens were stored in 37 °C water for 24 h prior to testing. Results were evaluated using one-way ANOVA followed by a post hoc Bonferroni test (p < 0.05). BF and CR showed a significantly higher flexural strength than other groups (p < 0.05), and the highest Weibull modulus was found in CR. BF showed sufficient DC with at least 85%, at all thicknesses. CR and BF also had a high level of translucency than EF and Fuji IX. Significant differences in flexural strength were found among all materials except between Fuji IX and EF. While all material tested are suitable for use clinically, BF and CR have superior properties than GIC based bulk-fill.

1. Introduction

In recent years, resin-based composite (RBC) has gained popularity over amalgam fillings, due to the increasing demand for tooth coloured, mercury free restorations and a more conservative approach to cavity preparations. Composites have also undergone improvement in their aesthetic, bonding outcomes and physical properties [1]. However, restoring an extensive cavity preparation with RBC is considered a technique sensitive and time-consuming task. Clinical procedure for placement of light-cured RBC restoration is conventionally conducted by using an incremental placement technique of 2 mm increments until the cavity is restored. A reason for this is the limited penetration depth of the light to achieve sufficient polymerisation. Another reason is due to the shrinkage associated with the polymerisation of the composite, which can create tensile stresses on the bonding surface [2]. However, the incremental placement technique has several drawbacks, which may compromise the overall clinical success of the restoration. These include entrapment of voids in between layers, contamination in between the composite increments, and higher residual shrinkage stress, due to cavity deformation from polymerisation contraction of individual filling increment [3,4]. In order to overcome these potential issues, a new generation of RBCs has been introduced, known as “Bulk-Fill RBCs”. Bulk-fill composite resins are known for their single-layer technique, which can be placed in the dental cavity with increments of up to 4–5 mm thick [5]. This was made possible largely due to the innovations in resin monomer technology, where new monomers, such as addition-fragmentation monomer (AFM) and 1, 12-Dodecanediol dimethacrylate (DDMA), have reduced polymerisation shrinkage and allowed for deeper penetration of light, thus improving the depth of cure [6,7]. Moreover, bulk-fill composites are typically nano-filled, which improves the optical translucency properties, providing smooth surface texture and improved mechanical properties without needing a further “capping layer” as with older versions of bulk-fill materials [8]. Therefore, bulk-fill composites could be a great alternative to conventional resin composites in terms of discolouration, marginal adaptation and effectiveness under clinical conditions [9]. In addition to resin composite, conventional glass ionomer cement (GIC) is also a popular alternative restorative material. The application of GICs was promoted in the 1970s as an easy to use, bulk-fill material because of their much-reduced shrinkage, compared to RBC [10]. Unfortunately, their use was limited, due to their relatively low tensile strength, abrasion resistance, hardness and poor aesthetics [11]. A recently enhanced version of high viscosity glass ionomer cement, known as EQUIA Forte Fil (GC Corporation, Tokyo, Japan), was promoted for use as a bulk-fill restorative material in class I and II cavity design in the posterior region [12]. EQUIA Forte consists of higher molecular weight polyacrylic acid to create a high strength material, resulting in a bulk-fill glass hybrid restorative structure with improved aesthetics and physical properties [11]. While some research has been conducted to evaluate the suitability of new bulk-fill restorative materials for the posterior regions by quantifying their flexural strength, depth of cure and hardness, there are conflicting results on their recommendations. Ilie et al. and Moshaverinia et al. conducted research on the flexural strength of new bulk-fill materials and found that they possess satisfactory mechanical properties [11,13], and Leprince et al. and Guimaraes et al., found the satisfactory depth of cure [14,15]. Yap et al., on the other hand, found evidence that there is a risk of inadequate curing of bulk-fill materials [16]. These conflicting results and limited in-vitro studies evaluating the wear resistance and translucency support the need for more research to understand the viability of these new bulk-fill materials over traditional direct restorative materials. Thus, this research intends to compare the physio-mechanical properties of several bulk-fill materials and the depth of cure of bulk-fill resin materials to the conventional resin materials. The null hypotheses are that there are no significant differences among all materials investigated in both physio-mechanical properties and depth of cure.

2. Experimental Section

The materials used in this study are listed in Table 1. The glass ionomer cement materials, Fuji IX and EQUIA Forte (EF) (GC Corporation, Tokyo, Japan), were supplied in an encapsulated form. The capsules were activated and mixed according to their manufacturers’ instructions for clinical use, using a mechanical mixer (Silamat, Ivoclar-Vivadent, Schaan, Lichtenstein). The composite materials, Filtek Z350 and Filtek One Bulk Fill Restorative (3M ESPE, Seedfeld, Germany), were packaged in capsule form for BF and syringe form for CR. Other than when indicated in the method, composite resins specimens were light-cured for 20 s with an Elipar LED light cure (1200 mW/cm2, 3M ESPE) and glass ionomer cement were left in the mould until it is fully set according to the manufacturer instruction. All prepared specimens were stored in 37 °C distilled water for 24 h prior to all tests. A digital calliper was used to measure the specimen dimensions to an accuracy of ±0.1 mm before testing. Light intensity was verified by the manufacturer prior to use to ensure correct light output.

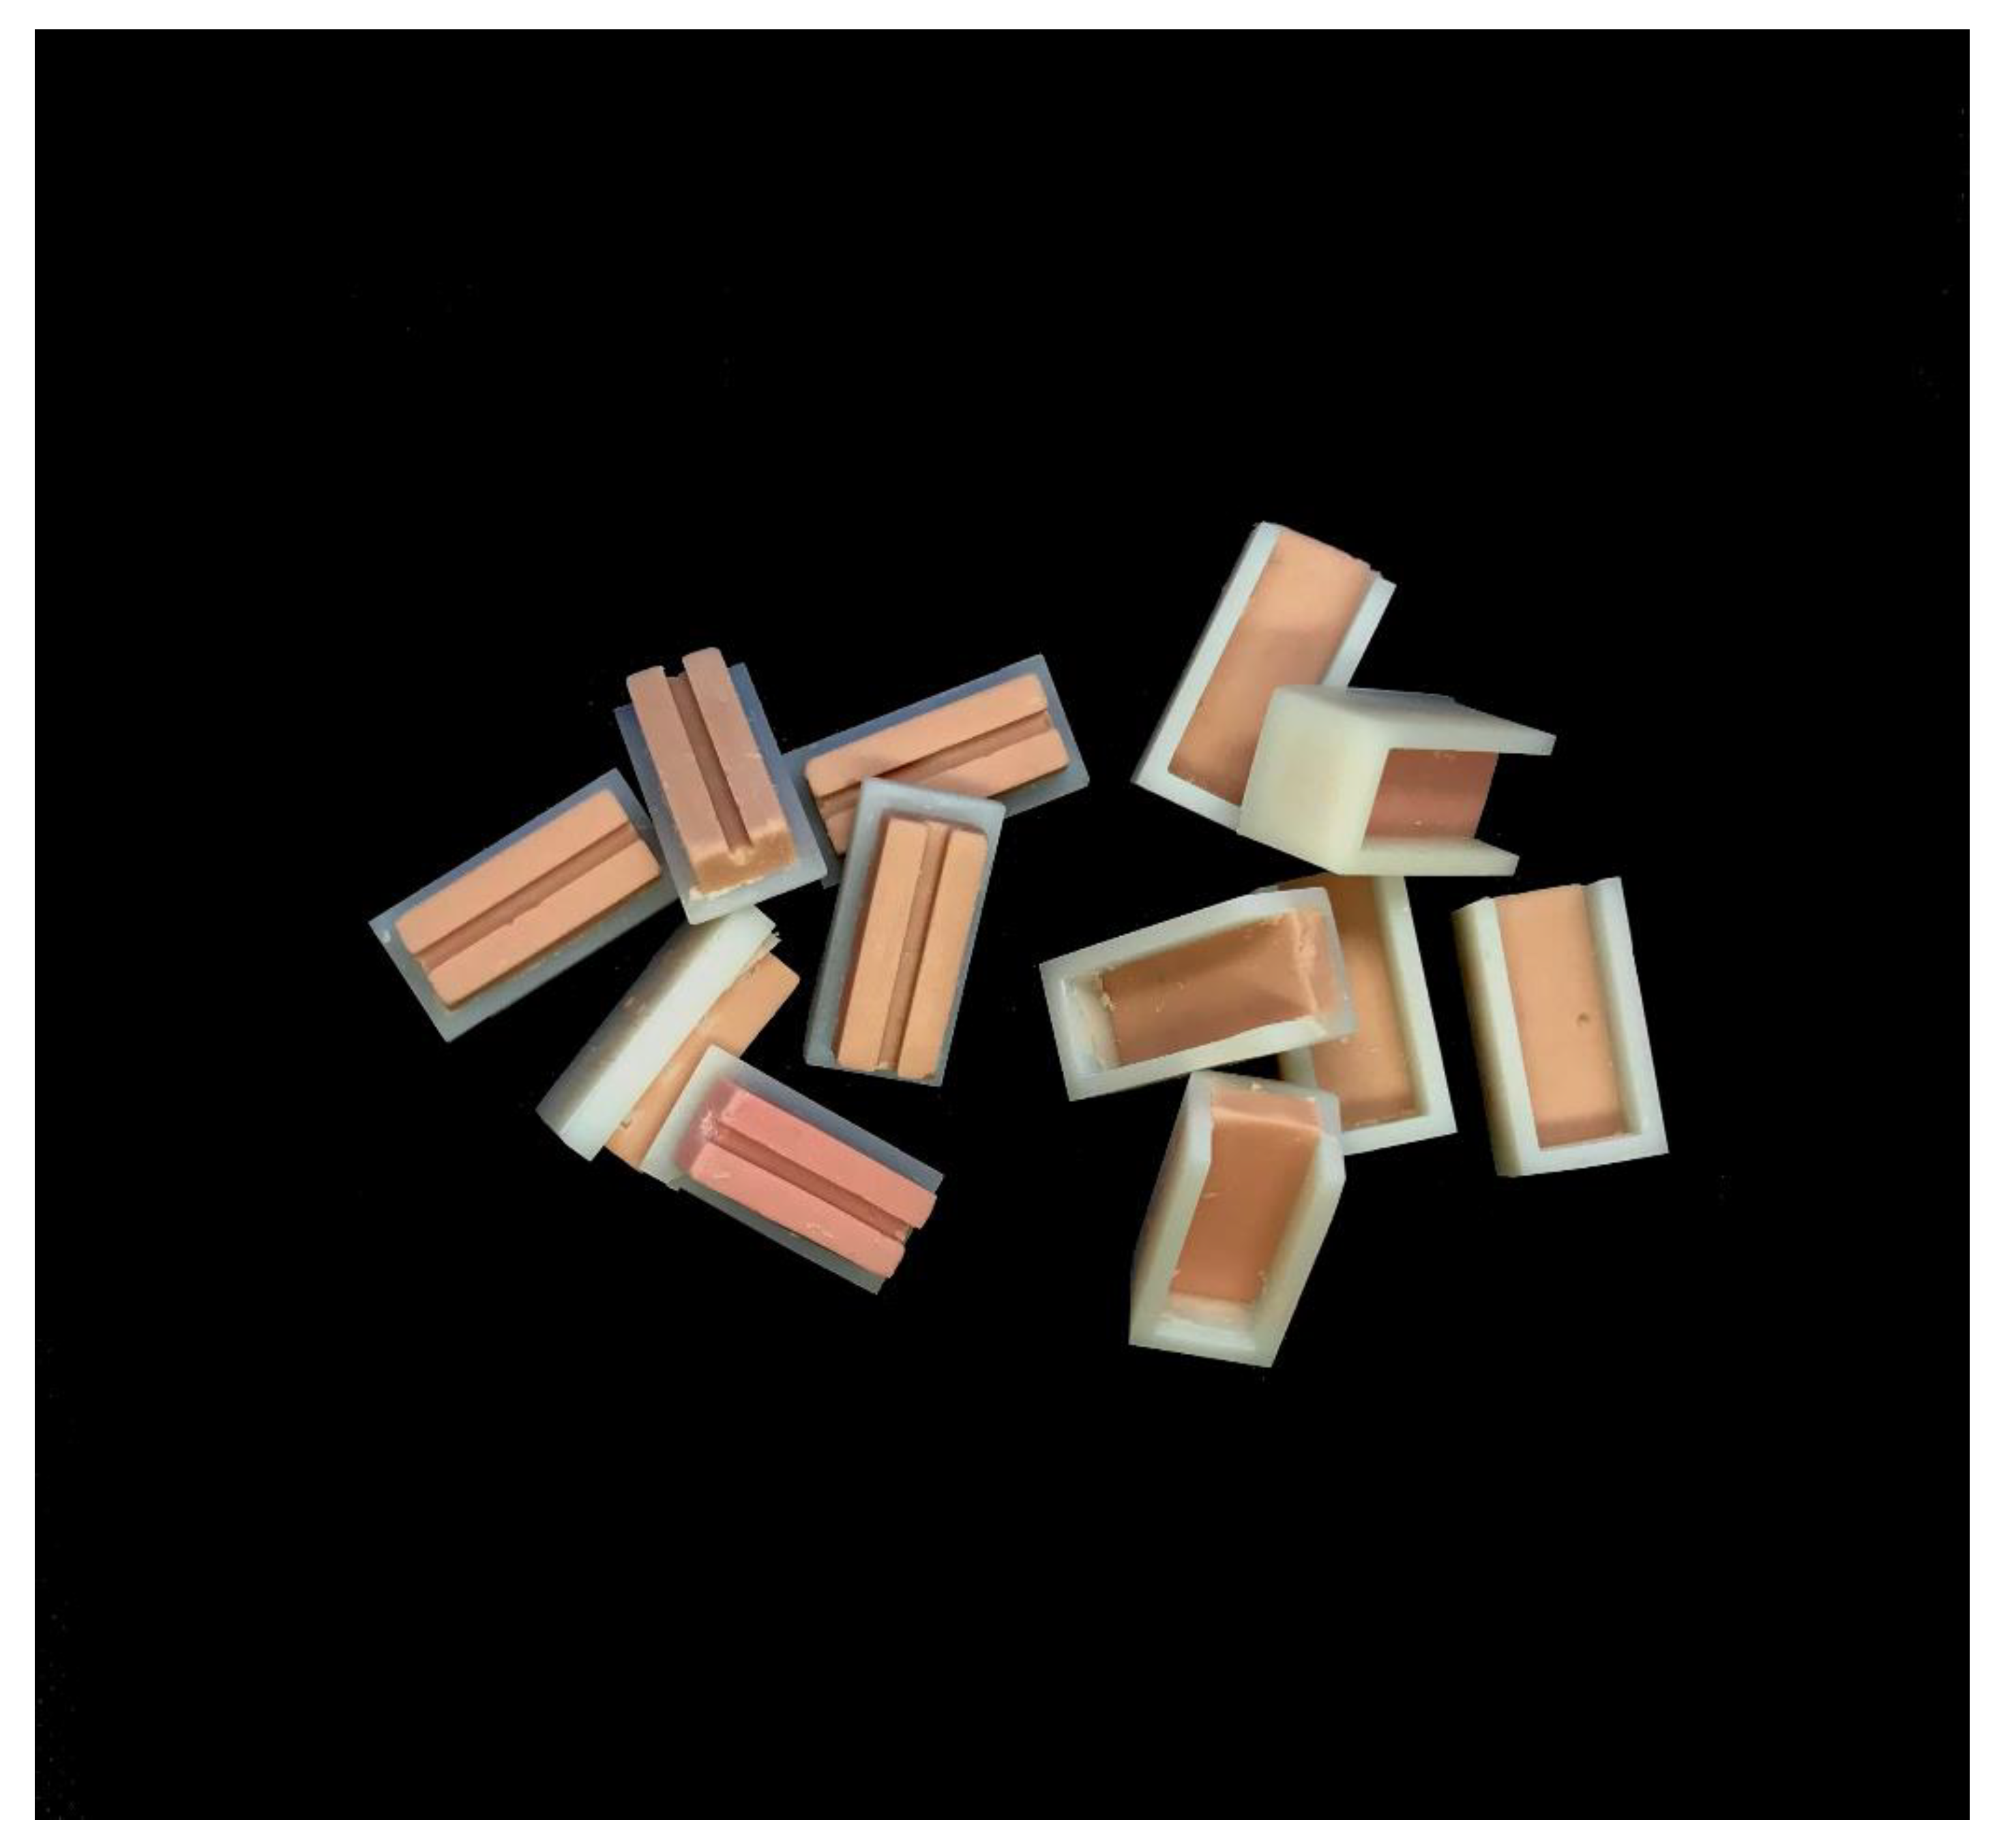
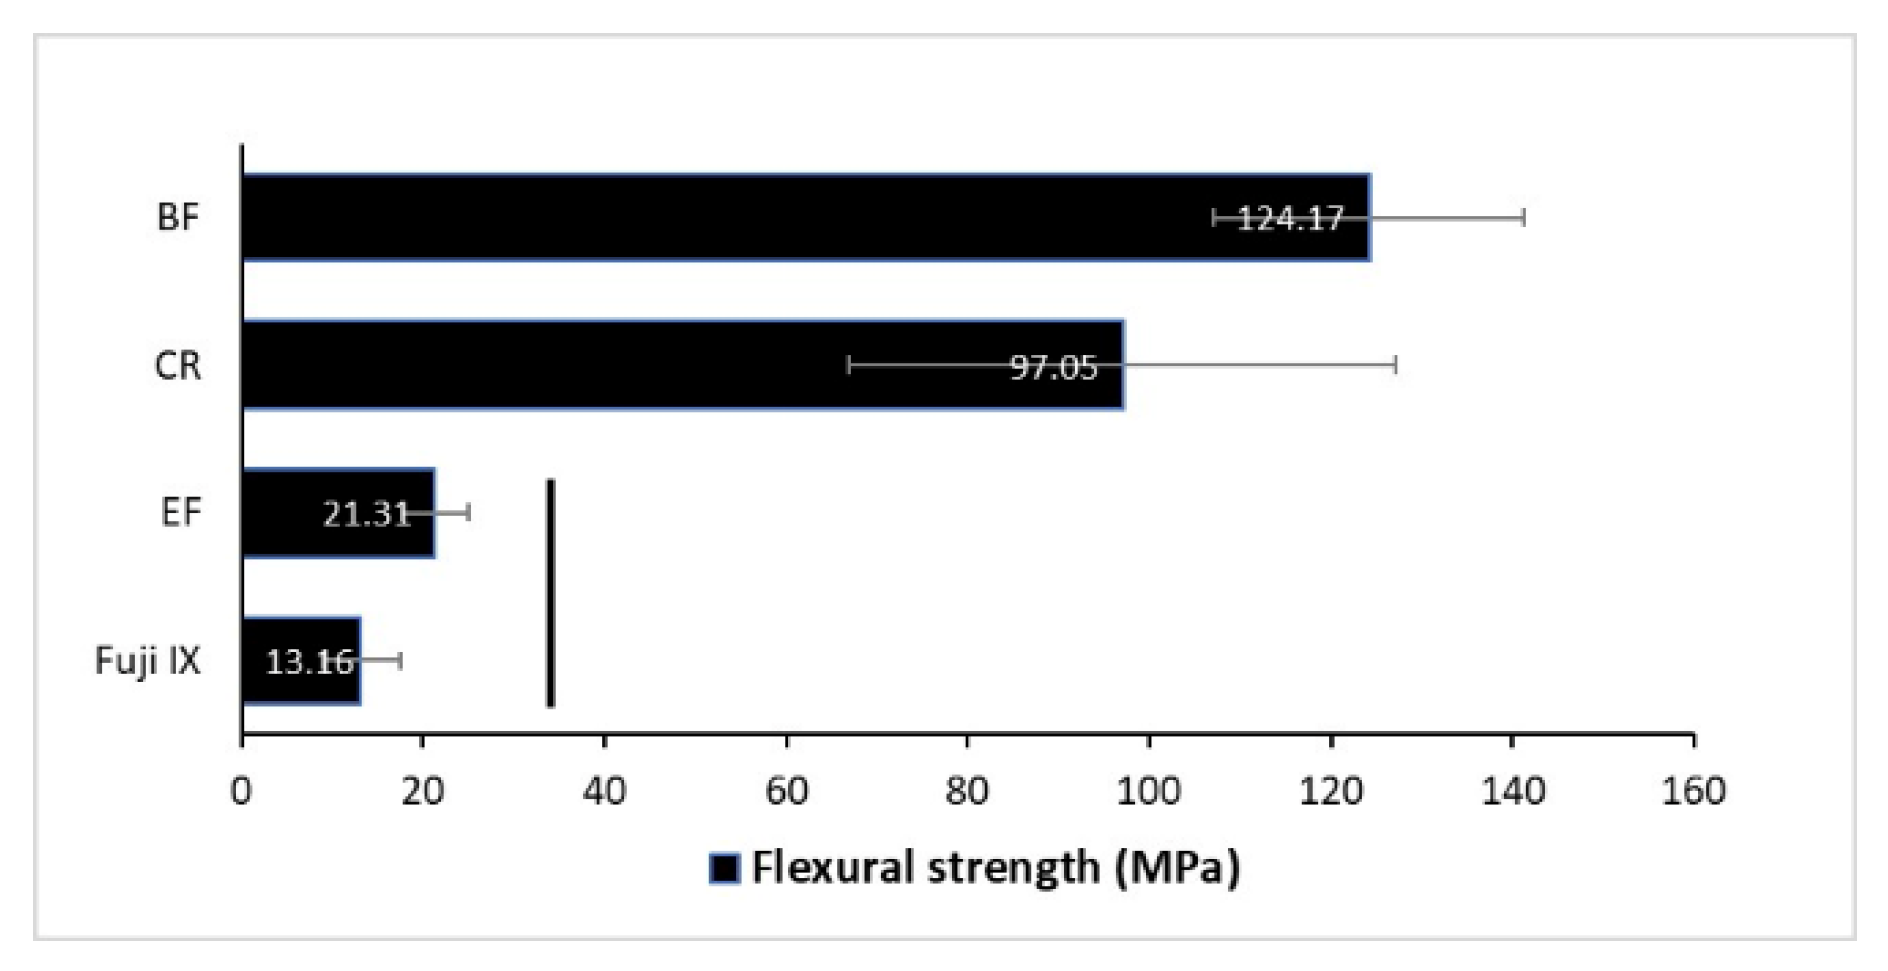
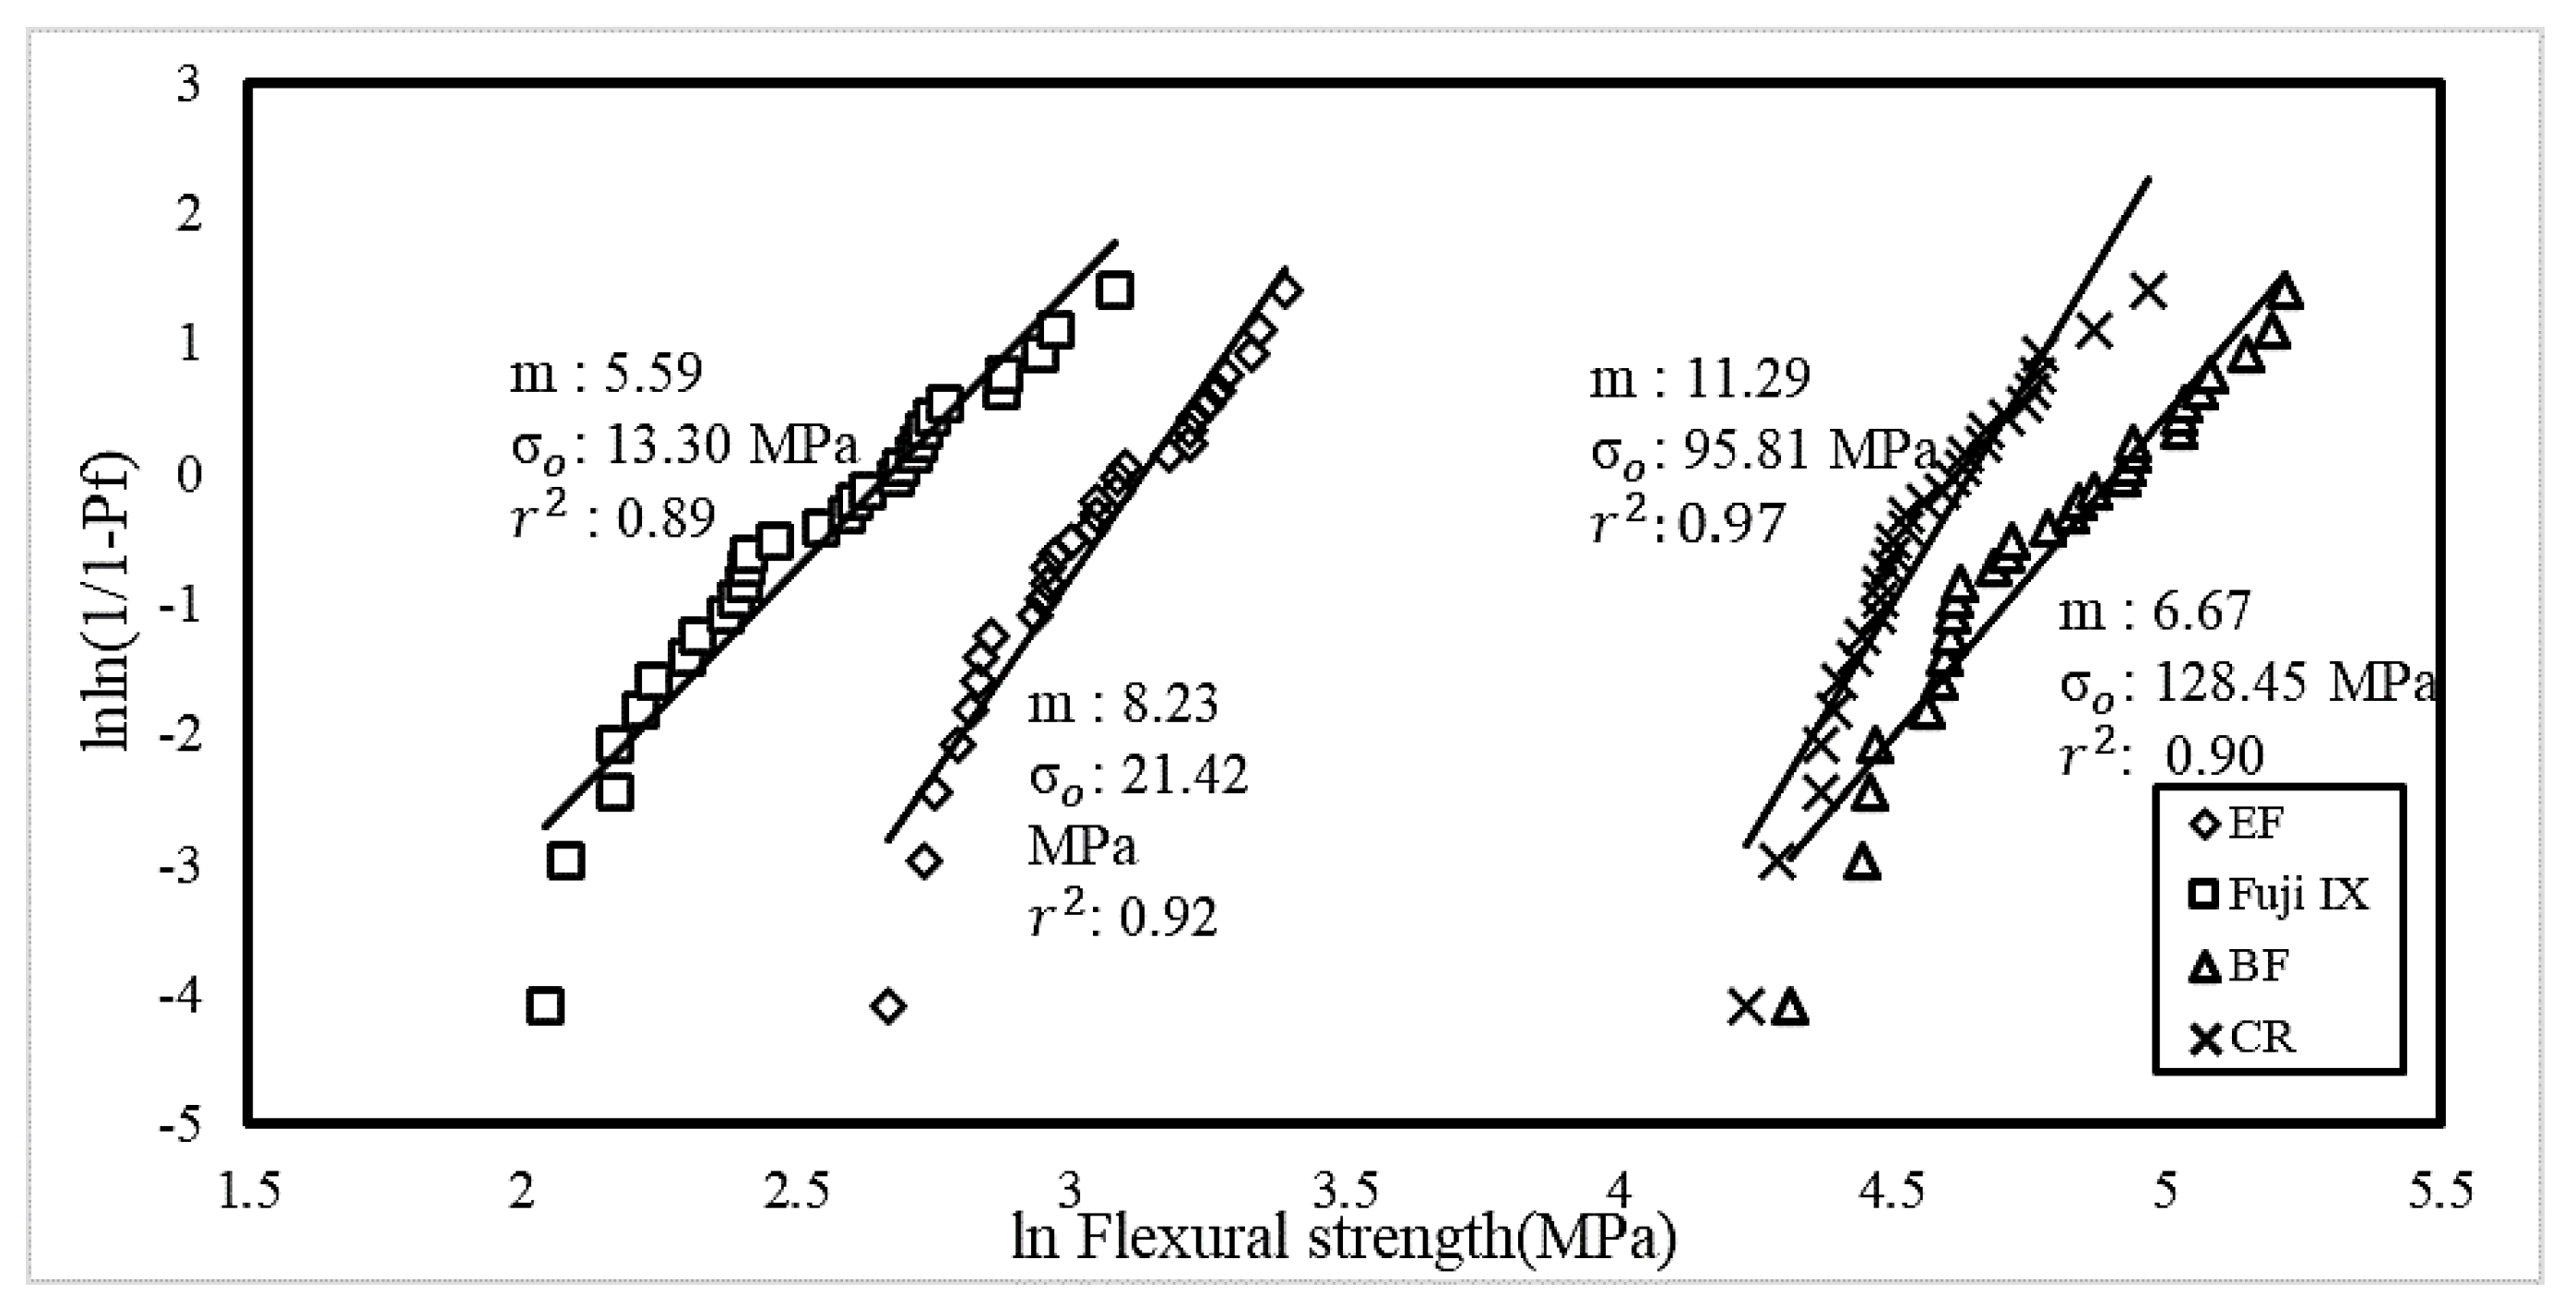
2.1. Flexural Strength Testing

As per ISO 4049 specifications, thirty samples were prepared using a 3D printed silicone mould (Figure 1) for each material with dimensions of 25 × 2 × 2 mm. Specimens were then removed from the mould and polished with 600 grit size silicone carbide paper (Riken Corundum Co., Ltd., Saitama, Japan). Three-point bending loads were applied using a universal testing machine (Instron 3369, Norwood, MA, USA) with a 20 mm outer roller distance between the supports at a crosshead speed of 1 mm/min. The flexural strength (σ) was obtained using the formula:
σ = 3 F L 2 w h 2
where F is the maximum load exerted on the specimen (N), L is the distance between the supports (20 mm), w is the width of the specimen (2 mm), and h is the height of the specimen (2 mm).

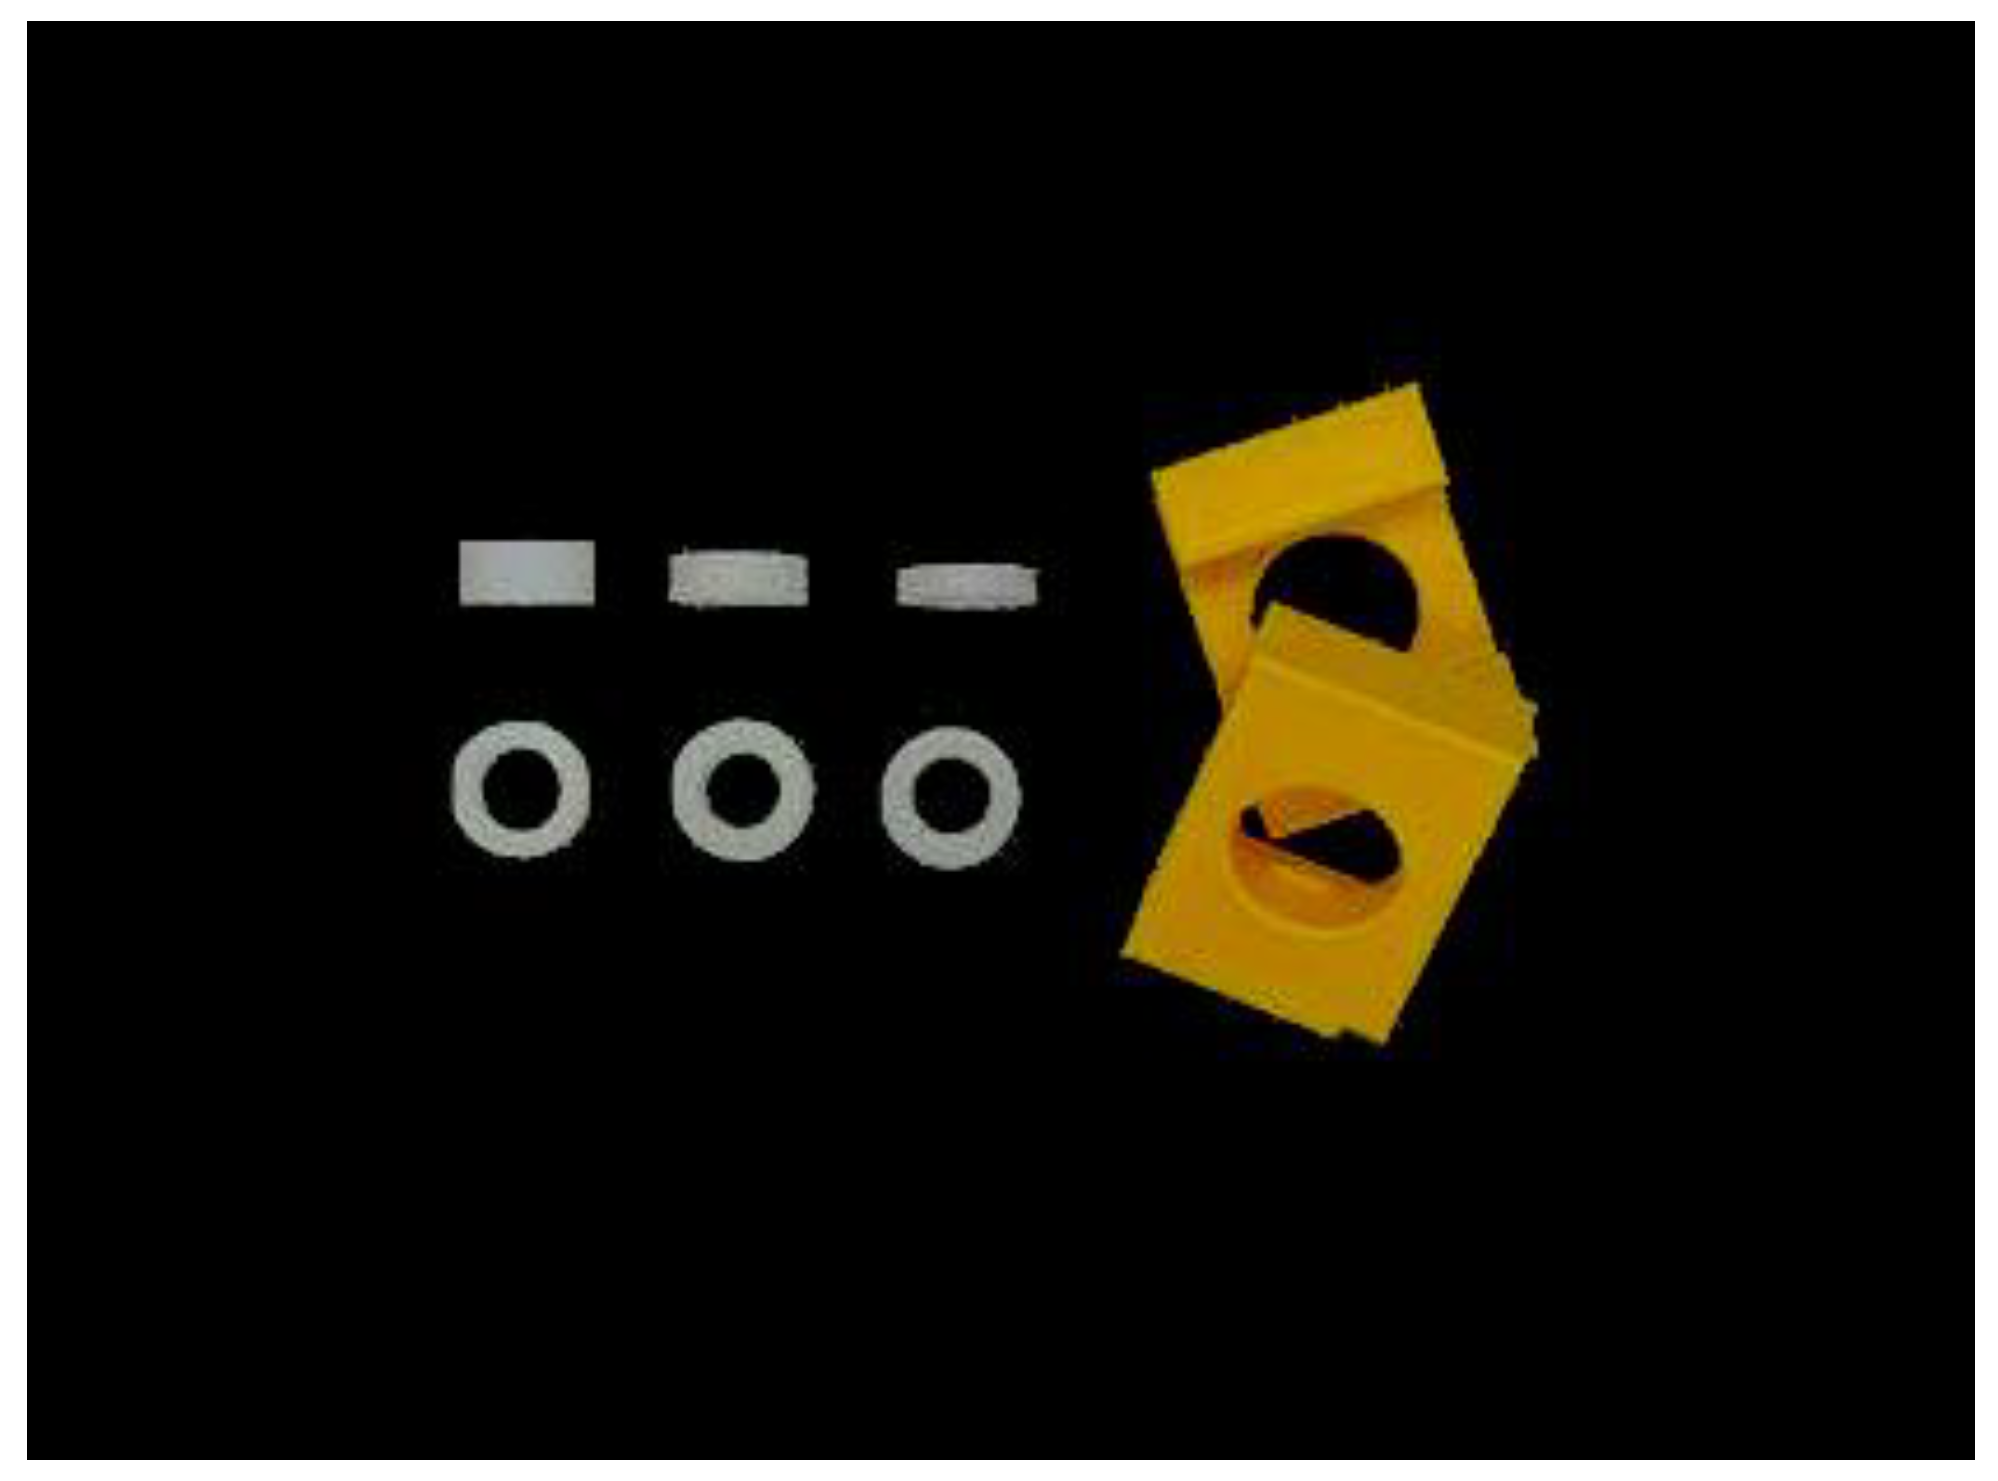
2.2. Elastic Modulus and Hardness

One specimen was prepared for each material in the 3D printed silicone mould (6 × 4 mm). Conventional composite was placed with two consecutive 2 mm thick increments. All other materials were dispensed in bulk into the mould. A glass slide and a mylar strip were placed on the top and bottom of the mould. Specimens were then polished with 1200 grit silicone carbide paper (Riken Corundum Co., Ltd., Saitama, Japan). Nanoindentations (UMIS2000, Semilabs, Hungary) were performed to calculate the elastic modulus and hardness using the Oliver and Pharr method for each restorative material using a Berkovich shaped indenter, at 60 mN maximum load held for 1 s. [17] A total of 20 indents were made onto each specimen, and the Poisson’s ratio was assumed to be ~0.3 for most polymer materials [18]. Post data analysis of the elastic modulus and hardness was performed using IBIS 2 software (Fischer-Cripps Laboratories, Forestville, NSW, Australia).

2.3. Depth of Cure

One specimen of composite resin was prepared into a 3D printed silicone mould (6 mm diameter) for each testing. Depth of cure (DC) was investigated by measuring surface hardness in clinically relevant filling depths of 2 mm, 3 mm and 4 mm (Figure 2). Conventional composite resin was filled in one increment of 2 mm height mould. The 2 mm, 3 mm and 4 mm high moulds were filled in bulk using bulk-fill composite. A Mylar strip was placed on the bottom of the mould with a glass slide as the base. The mould was overfilled with composite to ensure adequate specimen height, a Mylar strip and glass slide was subsequently pressed into position at the top. Samples were cured for 20 s and 40 s by using an Elipar LED Curing Light with a tip diameter of 9 mm and a jig stand of constant 0.5 mm away from the specimen. The excess material was removed from the top of the mould. Hardness value (HV) on the top surface (0 mm) and bottom surface (2 mm or 3 mm or 4 mm) were used to calculate the top to bottom ratio (HVBottom-Top Ratio) for DC.

2.4. Wearing Testing

Wear behaviour of each material were studied in a dry environment, via a rotational method using a ball-on-disc with a UFW 200 universal function wear test system (Neoplus INC, Daejeon, Korea) according to a modified ISO 14569. The specimens were prepared and packed into a silicone mould of size 30 × 10 mm in size. Prior to each wear experiment, a baseline mass was collected using a precision scale to an accuracy of ±0.001 g. A load of 50 N was applied onto the specimen, followed by a 6 mm diameter stainless steel ball antagonist, which is perpendicular to the specimen. A rotational speed of 60 rpm was used. The literature suggests that using an average tooth to tooth sliding distance of 1 mm per second equivalent to 250,000 mm for a year in vivo [19,20] Thus, a 62.5 m distance was used to stimulate the equivalent of 3 months, intraorally, followed by 125 m for 6 months and 250 m for 12 months in this pilot study. Each material was subjected to wear with a horizontal distance of 3 mm from the material’s centre. The mass of each specimen was recorded after being subjected to wear and air-dried for 1 min. Wear loss and frictional coefficient were assessed using UFW V1.0 software.

2.5. Translucency

Four 3D printed silicone moulds of 6 mm × 2 mm size were used to fabricate one specimen for each material. Each material was introduced into the mould followed by a clear matrix strip, and a glass slide pressed into the desired position. The specimen was then removed from the mould and polished using 600 grit silicone carbide paper. The colour of each specimen was measured using VITA Easyshade V digital spectrophotometer (VITA Zahnfabrik, Bad Säckingen, Germany) against a standard white and black background. The spectrophotometer has a measuring tip of 6 mm in diameter and was calibrated on the calibration block provided by the manufacturer prior to each use. The measurement tip of the dental spectrophotometer was held in tight contact with the surface of the disk, and three measurements were recorded for each disk. The translucency parameter was calculated by using the following formula:
TP = ( L W L b ) 2 + ( a W a B ) 2 + ( b W b B ) 2
The colour of each specimen was measured according to Commission Internationale de l’Eclairage (CIE) system based on three coordinates—L*a*b*.W refers to the values obtained when the specimen is against white background and B refers to the value obtained against a black background. Greater translucency is represented by higher values for translucency parameters.

2.6. Statistics

The data obtained in this study were calculated using computer software (IBM SPSS version 25, IBM Corp., Armonk, NY, USA) to verify the statistical significance (p < 0.05). The statistical normal distribution suitability of flexural strength, elastic modulus and DC were tested using the Shapiro-Wilk test method. One way ANOVA with post hoc Bonferroni test was carried out to verify the statistical significance of the flexural strength and DC for the normal data distribution. Kruskal-Wallis with post hoc Dunn Bonferroni test was used for elastic modulus, due to non-normal data distribution. Weibull analysis was done for flexural strength to obtain the Weibull modulus and normalising strength.

3. Results

The mean flexural strength values are shown in Figure 3, with statistical differences found between all groups except for EF and Fuji IX (p > 0.05). BF demonstrated the highest flexural strength among all materials, and the lowest reading was recorded for Fuji IX. Weibull modulus (m) and normalising strength (σ0) values were documented in Figure 4.
The highest m was found in CR with a value of 11.29, which is almost twice the value for BF. EF had a higher m of 8.23 as compared to Fuji IX. For elastic modulus and hardness, results were obtained for both with and without EQUIA Forte coating for EF, which were tabulated separately in Figure 5 and Table 2. Fuji IX presents a significantly higher elastic modulus of 27.5 Gpa than all materials.
Further, BF, CR and EF without coating had the same range of elastic modulus value with no significant differences noted (p > 0.05). For hardness values, the highest value of 1.05 Gpa was found in CR, which is double the value of EF with coating, and EF without coating had the lowest hardness value of 0.38 Gpa. DC is presented in Table 3 and Figure 6 with the range of 80–96.8%. All BF of different thicknesses had a higher DC value than CR at 2 mm.
A statistical difference (p < 0.05) was observed in DC of 4mm thickness with 40 s curing time as compared to 20 s and other thicknesses. No statistical differences (p > 0.05) were found in 20 s curing time for CR at 2mm and BF at 2 mm, 3 mm and 4 mm (Figure 6). Wear properties were calculated in three distinct aspects, which included wear coefficient, wear loss (mm) and mass loss (g) for 3 months, 6 months and 12 months for all materials, as shown in Table 4. At three months, both EF and CR had the highest wear coefficient of 0.010, and the highest wear loss was found in EF. No mass loss was recorded in both BF and CR at 3, 6 and 12 months. At 6 months, EF showed the highest wear coefficient of 0.024 and the highest mass loss of 0.10 g. A constant of 0.01 g mass loss was recorded for EF in 3, 6 and 12 months and Fuji IX in both 3 and 6 months. A mass loss of 0.02 g was the highest reading among all materials, which was tabulated in Fuji IX at 12 months.
The translucency parameter values are shown in Table 5. Translucency mean values were calculated, and found that CR had the highest translucency parameter of 16.03, where BF had a slightly lower reading of 15.73. Fuji IX had the lowest translucency reading of 3.22, followed by an EF of 5.30, which was only one-third of the translucency of both composites.

4. Discussion

This study aimed to evaluate the physio-mechanical properties of nano-filled conventional composite resin (CR), bulk-fill composite resin (BF), conventional glass ionomer cement Fuji IX (Fuji IX) and glass hybrid EQUIA Forte (EF). The results of tested materials were carried out in terms of flexural strength, elastic modulus, DC, wear resistance, and translucency. The null hypotheses of this study were rejected as statistical differences were found among the materials in most of the tests, and there was a statistical difference in DC among composite resin materials.
In vitro flexural testing has been shown to be an appropriate method to assess the strength of a restorative material as it is more sensitive to subtle changes and offer the most reliable estimate of flexural strength [21,22,23]. Ikejima et al. 2003 found that flexural strength and elastic modulus increases with filler fraction up to 60 vol% [24]. Filler fraction above this threshold showed no correlation with flexural strength and elastic modulus, indicating that other factors contributed to the physical and mechanical properties, such as the composition of the resin matrix [24,25]. In the present study, the comparison of flexural strength between composite materials showed a statistically significant difference (Figure 3). Although CR had a higher filler content of 63.3 vol% [26] compared to 58.4 vol% for BF [13], BF showed a higher flexural strength reading, but a slightly lower elastic modulus, similar to the findings of Illie et al. [13] with identical storage conditions. Both CR and BF contain inorganic zirconia and silica fillers with different vol%, which helps to improve their fracture toughness and flexural strength [7,27]. The main difference between both composites is the resin matrix components. While BF is made up of aromatic urethane dimethacrylate (AUDMA), AFM, urethane dimethacrylate (UDMA) and DDMA, and CR is made up of bisphenol-A-glycidyl dimethacrylate (Bis-GMA), ethoxylated bisphenol-A-dimethacrylate (Bis-EMA), UDMA, triethylene glycol dimethacrylate (TEGDMA) and a polyethylene glycol dimethacrylates (PEGDMA) resin matrix [7,13,27]. These high molecular weight monomers assist with the relaxation and reorganisation of the polymeric network to generate a better stress relief mechanism to reduce shrinkage during the polymerisation [7]. The addition of TEGDMA has been found to reduce the viscosity, resulting in a slight decrease in flexural strength [28], but also increasing the elastic modulus [24,25]. This is due to the characteristic flexibility of TEGDMA, which creates a dense and flexible polymer network that raises the composite elastic deformation [24]. Moreover, the addition of PEGDMA as a substitution for a portion of the TEGDMA resin to minimise polymerisation shrinkage could have led to lower flexural strength despite having higher filler content [13,29]. Furthermore, higher filler fraction and Bis-GMA concentration in CR increases the elastic modulus [30]. As a result, CR showed lower flexural strength, but a higher elastic modulus value. Weibull analysis can be used to predict the reliability of material, especially in mechanical testing. A higher Weibull modulus indicates a tighter scatter of the values with potentially better clinical reliability [31,32,33]. Although CR presented a lower flexural strength, a significantly higher m was found in CR as compared to BF, hence showing CR has better consistency in terms of flexural strength.
In this newly available EQUIA Forte restorative system, it comprises EQUIA Forte Fil glass ionomer and EQUIA Forte Coat [11,34,35]. The manufacturer claims that the material has higher fracture toughness, flexural strength and wear resistance [11,35]. However, studies on physio-mechanical properties of EF remain limited, with only a few studies evaluating the clinical performance of EF [34]. A recent six-year clinical study by Turkun et al. found better results with EF marketed for stress-bearing areas in terms of marginal adaptation and retention rates as compared to other GIC material [36]. In this study, flexural strength and wear resistance of EF were higher as compared to Fuji IX. This is most likely due to the introduction of ultrafine and highly reactive glass particles dispersed within the EF powder, and polyacrylic acid with optimised molecular weight [11,35]. These modification increases the ion availability that in turn, develops a more complete acid–base reaction, further enhance matrix formation, resulting in a stronger matrix [11].
Surface coating agents, such as Vaseline and cocoa butter, are recommended to be applied on glass ionomer cement (GIC) during the vulnerable setting stage as early moisture contamination attributed to reduced elastic modulus and fracture strength [21]. Among the coating strategies, Hotta et al. found that the application of light-polymerised bonding agents helped to limit water movement across cement surface, especially within the first month of maturation [21]. This clear, self-adhesive, light-cured resin EQUIA Forte coat has single dispersion nanofillers in the matrix and a new cross linking monomer chemistry, rendering improved polymerisation, producing a tougher resin matrix [12]. This coating is speculated to toughens and protects the EQUIA Forte restorative system by infiltrating the GIC surface, thus filling cracks and porosities [35]. This supports the findings from the present study, where higher flexural strength was observed in EF as compared to Fuji IX. Other studies have also observed similar improvements in the flexural strength with resin coating [11,21]. In addition, a higher Weibull modulus was documented in EF, which further supported the reliability of EF in comparison with Fuji IX.
Elastic modulus is a crucial factor in determining the ability of a material to resist elastic deformation when loaded [37]. The final clinical result will be related to the matching of elastic modulus values. Interfacial stress may induce from either mechanical, thermal or shrinkage strain in the restoration if the modulus discrepancy is too great. Hence, core build-up material should have an elastic modulus in the range equivalent to the dentine structure to withstand polymerisation shrinkage stresses and masticatory forces [37]. Elastic modulus results indicated CR, BF and EF without coating had elastic modulus values similar to dentine of ~20 Gpa [37]. Fuji IX showed the highest elastic modulus reading of 27.5 Gpa among all of the materials. This was likely due to higher filler content with a high powder to liquid ratio as compared to EF. Statistical differences were found between EF with and without coating in regard to the elastic modulus readings (Figure 5). Higher elastic modulus values were found in EF without coating, which corresponds to the findings of prior studies [38]. However, lower elastic modulus values for EF with coating were observed, which conflicts with previous studies where better physio-mechanical properties with resin coating had been reported [38]. This could be attributed to the fact that the resin coating was softer, and the nature of nanoindentation measurements only penetrated ~4 microns below the surface.
The DC of resins is a primary factor determining their bulk physical properties. The higher the conversion of dimethacrylates double bonds, the better the mechanical strength [39]. The DC of a resin relies on the chemical structure of the dimethacrylate monomer and the polymerisation conditions, which include the light intensity, atmosphere and photoinitiator concentration [39]. A variation of the resin matrix component can attribute to the DC of the materials with increasing order of Bis-GMA < Bis-EMA < UDMA < TEDGMA [38,39]. The DC values of several Bis-GMA based resin composites were found in the range of 52–75%, with most of the materials having a range of 55–60% [40]. In the present study, CR, which has a Bis-GMA polymer matrix, was found to have the lowest DC value of 80% at 2 mm with a 20 s curing time, as shown in Figure 6. The manufacturer claims that all shades of BF met the 4mm DC by using ISO 4049 standard. It involved scraping unset composite resin after irradiation, followed by dividing the remaining set specimen length by two [41]. Other techniques, such as using optical microscopy to visualise the boundary between cured and uncured material, can be used to determine the DC. Having said that, scraping methods and optical microscopy may overestimate the DC when compared with the hardness value technique as they include some partly cured material [30,41,42]. In this study, hardness values were measured for both composite, and the DC was calculated from the ratio of bottom surface hardness to top hardness. A ratio of at least 80% has been said to be the minimum acceptable threshold value for DC [40]. DC with a value below 55% is not recommended for use, at least as an occlusal restorative layer [43]. No statistical difference was found for 20 s curing time for BF at 4 mm thickness versus CR at 2 mm thickness. Nonetheless, all materials investigated had achieved the minimum 80% DC. By doubling the proposed curing times, the highest DC of 96.8% was recorded with a statistical difference in 4 mm thickness with 40 s curing time as compared to other groups (Figure 6). High DC in BF may be due to the matching refractive index between resin and filler, promoting improved light transmission [43]. Therefore, present results support the claim that BF can be used as a single-layer up to 4mm as it achieved more than 80% DC values.
Wear properties are important characteristic to ensure the longevity of restorative materials and occlusal stability [44]. As with other physical and mechanical properties, the wear resistance of restorative materials is influenced by the properties of filler particles and the structure of the surrounding matrix [8,45]. In this study, three methods of wear measurements, including mean coefficient of friction, amount of wear loss and mass loss, were used to identify the relative wear of BF, CR, Fuji IX and EF. The mean friction coefficient value of both BF and CR were relatively similar except in three months, but the amount of wear loss was varied among three different time periods. There were no changes in the mass loss for both CR and BF throughout all tested time periods. Their relatively similar wear results might be due to their similar filler shape, size and amount. According to Barkmeier et al. and Turssi et al., they suggest that filler features played a major role in the wear behaviours of resin-based material [46,47]. On the other hand, EF showed a higher mean coefficient value and wear loss as compared to Fuji IX [48]. The overlying nanofillers resin in the EF coat might have contributed to the higher wear loss in EF, due to its lower hardness value and elastic modulus found in the resin matrix [49,50]. The friction coefficient of all materials is comparatively similar, but the wear loss of both CR and BF is lower to Fuji IX and EF, which correspond to the results found in previous studies [48,51]. Nevertheless, wear is influenced by a range of conditions which include fatigue failure, cracks and voids on the surface, and properties of the material. Interestingly, the general trend for the coefficient of friction was highest in six months, as compared to three months and 12 months. Further studies evaluating the possible reason for this trend using an SEM and longer wear period might improve the understanding of wear characteristic of these materials.
The translucency characteristic of restoration is important for aesthetic purposes to mimic natural tooth structures [52,53]. As shown in Table 5, CR had the highest TP of 16.03, followed by BF at 15.73 and EF at 5.30. Fuji IX had the lowest TP of 5.3, which corresponds to its well-known opacity [52]. The incorporation of nano ytterbium trifluoride filler in BF to improve its radiopacity may have led to lower translucency reading [54]. TP of enamel was about 15 at the incisal, which decreased to approximately 5 at the cervical area [52]. This shows that the TP of both CR and BF are well sufficient to replace human enamel. On the other hand, Fuji IX and EF are more suitable to use in areas with less aesthetic consideration, such as posterior or cervical restoration.
For future studies, mechanical properties measured over a longer time period and evaluating other properties, such as fracture toughness, will provide more insight into the clinical performance of the material. Besides that, this study investigated the material’s vertical wear loss using UFW V1.0 software as compared to the more widely used non-contact profilometer to measure the materials’ mean volume loss. Additionally, clinical studies examining the long-term performance of these material are required to measure true performance in a clinical setting.

5. Conclusions

  • Bulk-fill composites were found to have significantly higher flexural strength compared to conventional composite resin, Fuji IX and EQUIA Forte.
  • Fuji IX had the highest elastic modulus follow by EF no coat, CR and BF.
  • Filtek bulk-fill has sufficient DC at 4 mm with both 20 s and 40 s light-curing time, but significantly improved DC at 40 s.
  • CR and BF had a TP value closest to that of enamel.
These results indicated that bulk-fill and conventional composites had improved properties when compared to Fuji IX and EF; however, more mechanical testing and clinical studies are required to further examine the performance of the material in a clinical setting.

Author Contributions

Conceptualization, A.B.; methodology, A.B., K.C.L. and J.J.E.C.; formal analysis, H.W.Y. and M.Y.L.; investigation, H.W.Y., M.Y.L. and M.A.; data curation, H.W.Y., M.Y.L. and M.A.; writing—original draft preparation, H.W.Y., M.Y.L. and M.A.; writing—review and editing, A.B., K.C.L. and J.J.E.C.; supervision, A.B., K.C.L. and J.J.E.C. All authors have read and agreed to the published version of the manuscript.

Funding

This research received no external funding.

Institutional Review Board Statement

Not applicable.

Informed Consent Statement

Not applicable.

Data Availability Statement

Data in FigShare. https://doi.org/10.6084/m9.figshare.14381150.v1 (accessed on 7 April 2021).

Acknowledgments

3M company for supplying Filtek Z350 and Filtek one bulk fill restorative; and GC company for supplying Fuji IX and Equia Forte.

Conflicts of Interest

The authors declare no conflict of interest.

References

  1. Chan, K.H.S.; Mai, Y.; Kim, H.; Tong, K.C.T.; Ng, D.; Hsiao, J.C.M. Review: Resin Composite Filling. Materials 2010, 3, 1228–1243. [Google Scholar] [CrossRef]
  2. AlShaafi, M.M. Factors affecting polymerization of resin-based composites: A literature review. Saudi Dent. J. 2017, 29, 48–58. [Google Scholar] [CrossRef]
  3. Yadav, K.D.; Prasad, R.S.; Chaganti, H.; Saleem, M.; Pai, A. Techniques in Direct Composite Restoration. Mod. Approaches Dent. Oral Heal. Care 2018, 3, 307–309. [Google Scholar] [CrossRef]
  4. Versluis, A.; Douglas, W.; Cross, M.; Sakaguchi, R. Does an Incremental Filling Technique Reduce Polymerization Shrinkage Stresses? J. Dent. Res. 1996, 75, 871–878. [Google Scholar] [CrossRef]
  5. Menees, T.S.; Lin, C.P.; Kojic, D.D.; Burgess, J.O.; Lawson, N.C. Depth of cure of bulk fill composites with monowave and polywave curing lights. Am. J. Dent. 2015, 28, 357–361. [Google Scholar]
  6. Ravi, R.; Mandava, J.; Vegesna, D.-P.; Uppalapati, L.-V.; Ghazanfaruddin, M.D.; Boddeda, M.-R. Microtensile bond strength of bulk-fill restorative composites to dentin. J. Clin. Exp. Dent. 2017, 9, e1023–e1028. [Google Scholar]
  7. 3M Dental Products, FiltekTM One Bulk Fill Restorative, Technical Product Profile. 2016. Available online: https://multimedia.3m.com/mws/media/1317671O/3m-filtek-one-bulk-fill-restorative-technical-product-profile.pdf (accessed on 20 August 2020).
  8. Mitra, S.B.; Wu, D.; Holmes, B.N. An application of nanotechnology in advanced dental materials. J. Am. Dent. Assoc. 2003, 134, 1382–1390. [Google Scholar] [CrossRef] [Green Version]
  9. Yazici, A.R.; Antonson, S.A.; Kutuk, Z.B.; Ergin, E. Thirty-Six-Month Clinical Comparison of Bulk Fill and Nanofill Composite Restorations. Oper. Dent. 2017, 42, 478–485. [Google Scholar] [CrossRef] [PubMed]
  10. Moshaverinia, M.; Navas, A.; Jahedmanesh, N.; Shah, K.C.; Moshaverinia, A.; Ansari, S. Comparative evaluation of the physical properties of a reinforced glass ionomer dental restorative material. J. Prosthet. Dent. 2019, 122, 154–159. [Google Scholar] [CrossRef] [PubMed]
  11. Ausiello, P.; Piva, A.D.; Borges, A.; Lanzotti, A.; Zamparini, F.; Epifania, E.; Tribst, J.M. Effect of Shrinking and No Shrinking Dentine and Enamel Replacing Materials in Posterior Restoration: A 3D-FEA Study. Appl. Sci. 2021, 11, 2215. [Google Scholar] [CrossRef]
  12. Fuhrmann, D.; Murchison, D.; Whipple, S.; Vandewalle, K. Properties of New Glass-Ionomer Restorative Systems Marketed for Stress-Bearing Areas. Oper. Dent. 2020, 45, 104–110. [Google Scholar] [CrossRef]
  13. Ilie, N.; Bucuta, S.; Draenert, M. Bulk-fill Resin-based Composites: An In Vitro Assessment of Their Mechanical Performance. Oper. Dent. 2013, 38, 618–625. [Google Scholar] [CrossRef]
  14. Leprince, J.G.; Palin, W.M.; Vanacker, J.; Sabbagh, J.; Devaux, J.; Leloup, G. Physico-mechanical characteristics of commercially available bulk-fill composites. J. Dent. 2014, 42, 993–1000. [Google Scholar] [CrossRef]
  15. Guimarães, T.; Gushiken, N.; Braga, R. Degree of conversion, flexural modulus and polymerization stress of “Bulk Fill” composites. Dent. Mater. 2013, 29, 43. [Google Scholar] [CrossRef]
  16. Yap, A.U.J.; Pandya, M.; Toh, W.S. Depth of cure of contemporary bulk-fill resin-based composites. Dent. Mater. J. 2016, 35, 503–510. [Google Scholar] [CrossRef] [Green Version]
  17. Oliver, W.; Pharr, G. An improved technique for determining hardness and elastic modulus using load and displacement sensing indentation experiments. J. Mater. Res. 1992, 7, 1564–1583. [Google Scholar] [CrossRef]
  18. Chung, S.M.; Yap, A.U.J.; Koh, W.K.; Tsai, K.T.; Lim, C.T. Measurement of Poisson’s ratio of dental composite restorative materials. Biomaterials 2004, 25, 2455–2460. [Google Scholar] [CrossRef]
  19. Suit, S.R.; Gibbs, C.H.; Benz, S.T. Study of Gliding Tooth Contacts during Mastication. J. Periodontol. 1976, 47, 331–334. [Google Scholar] [CrossRef]
  20. Heintze, S.D. How to qualify and validate wear simulation devices and methods. Dent. Mater. 2006, 22, 712–734. [Google Scholar] [CrossRef]
  21. Lohbauer, U. Dental Glass Ionomer Cements as Permanent Filling Materials?—Properties, Limitations and Future Trends. Materials 2009, 3, 76–96. [Google Scholar] [CrossRef]
  22. Prosser, H.; Powis, D.; Wilson, A. Glass-ionomer Cements of Improved Flexural Strength. J. Dent. Res. 1986, 65, 146–148. [Google Scholar] [CrossRef] [PubMed]
  23. Yap, A.U.J.; Teoh, S.H. Comparison of flexural properties of composite restoratives using the ISO and mini-flexural tests. J. Oral Rehabilitation 2003, 30, 171–177. [Google Scholar] [CrossRef] [PubMed]
  24. Junior, S.A.R.; Zanchi, C.H.; De Carvalho, R.V.; Demarco, F.F. Flexural strength and modulus of elasticity of different types of resin-based composites. Braz. Oral Res. 2007, 21, 16–21. [Google Scholar] [CrossRef] [PubMed] [Green Version]
  25. Asmussen, E.; Peutzfeldt, A. Influence of UEDMA, BisGMA and TEGDMA on selected mechanical properties of experimental resin composites. Dent. Mater. 1998, 14, 51–56. [Google Scholar] [CrossRef]
  26. Monteiro, G.Q.D.M.; Montes, M.A.J.R. Evaluation of linear polymerization shrinkage, flexural strength and modulus of elasticity of dental composites. Mater. Res. 2010, 13, 51–55. [Google Scholar] [CrossRef] [Green Version]
  27. 3M Dental Products, Filtek XTE Technical Product Profile. Available online: https://multimedia.3m.com/mws/media/922726O/filtek-supreme-xte-technical-product-profile-anz.pdf (accessed on 2 February 2021).
  28. Czasch, P.; Ilie, N. In vitro comparison of mechanical properties and degree of cure of bulk fill composites. Clin. Oral Investig. 2012, 17, 227–235. [Google Scholar] [CrossRef] [PubMed]
  29. Ilie, N.; Rencz, A.; Hickel, R. Investigations towards nano-hybrid resin-based composites. Clin. Oral Investig. 2012, 17, 185–193. [Google Scholar] [CrossRef] [PubMed]
  30. Zorzin, J.; Maier, E.; Harre, S.; Fey, T.; Belli, R.; Lohbauer, U.; Petschelt, A.; Taschner, M. Bulk-fill resin composites: Polymerization properties and extended light curing. Dent. Mater. 2015, 31, 293–301. [Google Scholar] [CrossRef]
  31. McCabe, J.; Carrick, T. A statistical approach to the mechanical testing of dental materials. Dent. Mater. 1986, 2, 139–142. [Google Scholar] [CrossRef]
  32. Della Bona, A.; Anusavice, K.J.; DeHoff, P.H. Weibull analysis and flexural strength of hot-pressed core and veneered ceramic structures. Dent. Mater. 2003, 19, 662–669. [Google Scholar] [CrossRef]
  33. Junior, S.A.R.; Ferracane, J.L.; Della Bona, Á. Flexural strength and Weibull analysis of a microhybrid and a nanofill composite evaluated by 3- and 4-point bending tests. Dent. Mater. 2008, 24, 426–431. [Google Scholar] [CrossRef]
  34. Gurgan, S.; Kutuk, Z.B.; Ergin, E.; Oztas, S.S.; Cakir, F.Y. Clinical performance of a glass ionomer restorative system: A 6-year evaluation. Clin. Oral Investig. 2016, 21, 2335–2343. [Google Scholar] [CrossRef]
  35. Diem, V.T.K.; Tyas, M.J.; Ngo, H.C.; Phuong, L.H.; Khanh, N.D. The effect of a nano-filled resin coating on the 3-year clinical performance of a conventional high-viscosity glass-ionomer cement. Clin. Oral Investig. 2013, 18, 753–759. [Google Scholar] [CrossRef]
  36. Türkün, L.S.; Kanik, Ö. A Prospective Six-Year Clinical Study Evaluating Reinforced Glass Ionomer Cements with Resin Coating on Posterior Teeth: Quo Vadis? Oper. Dent. 2016, 41, 587–598. [Google Scholar] [CrossRef] [PubMed]
  37. Combe, E.; Shaglouf, A.-M.; Watts, D.; Wilson, N. Mechanical properties of direct core build-up materials. Dent. Mater. 1999, 15, 158–165. [Google Scholar] [CrossRef]
  38. Ong, J.; Yap, A.U.; Hong, J.Y.; Eweis, A.H.; Yahya, N.A. Viscoelastic Properties of Contemporary Bulk-fill Restoratives: A Dynamic-mechanical Analysis. Oper. Dent. 2018, 43, 307–314. [Google Scholar] [CrossRef]
  39. Moore, B.K.; Platt, J.A.; Borges, G.; Chu, T.-M.G.; Katsilieri, I. Depth of Cure of Dental Resin Composites: ISO 4049 Depth and Microhardness of Types of Materials and Shades. Oper. Dent. 2008, 33, 408–412. [Google Scholar] [CrossRef] [Green Version]
  40. Sideridou, I.; Tserki, V.; Papanastasiou, G. Effect of chemical structure on degree of conversion in light-cured dimethacrylate-based dental resins. Biomaterials 2002, 23, 1819–1829. [Google Scholar] [CrossRef]
  41. Flury, S.; Hayoz, S.; Peutzfeldt, A.; Hüsler, J.; Lussi, A. Depth of cure of resin composites: Is the ISO 4049 method suitable for bulk fill materials? Dent. Mater. 2012, 28, 521–528. [Google Scholar] [CrossRef]
  42. Alrahlah, A.; Silikas, N.; Watts, D. Post-cure depth of cure of bulk fill dental resin-composites. Dent. Mater. 2014, 30, 149–154. [Google Scholar] [CrossRef]
  43. Alshali, R.Z.; Silikas, N.; Satterthwaite, J.D. Degree of conversion of bulk-fill compared to conventional resin-composites at two time intervals. Dent. Mater. 2013, 29, e213–e217. [Google Scholar] [CrossRef] [PubMed]
  44. Ogle, R.E.; Davis, E.L. Clinical wear study of three commercially available artificial tooth materials: Thirty-six month results. J. Prosthet. Dent. 1998, 79, 145–151. [Google Scholar] [CrossRef]
  45. Miličević, A.; Goršeta, K.; Van Duinen, R.N.; Glavina, D. Surface Roughness of Glass Ionomer Cements after Application of Different Polishing Techniques. Acta Stomatol. Croat. 2018, 52, 314–321. [Google Scholar] [CrossRef]
  46. Turssi, C.P.; Ferracane, J.L.; Vogel, K. Filler features and their effects on wear and degree of conversion of particulate dental resin composites. Biomaterials 2005, 26, 4932–4937. [Google Scholar] [CrossRef]
  47. Barkmeier, W.; Takamizawa, T.; Erickson, R.; Tsujimoto, A.; Latta, M.; Miyazaki, M. Localized and Generalized Simulated Wear of Resin Composites. Oper. Dent. 2015, 40, 322–335. [Google Scholar] [CrossRef] [Green Version]
  48. Lazaridou, D.; Belli, R.; Krämer, N.; Petschelt, A.; Lohbauer, U. Dental materials for primary dentition: Are they suitable for occlusal restorations? A two-body wear study. Eur. Arch. Paediatr. Dent. 2014, 16, 165–172. [Google Scholar] [CrossRef]
  49. Hotta, M.; Hirukawa, H. Abrasion Resistance of Restorative Glass-Ionomer Cements with a Light-cured Surface Coating. Oper. Dent. 1994, 19, 42–46. [Google Scholar]
  50. Arsecularatne, J.; Chung, N.; Hoffman, M. An in vitro study of the wear behaviour of dental composites. Biosurf. Biotribol. 2016, 2, 102–113. [Google Scholar] [CrossRef] [Green Version]
  51. Peutzfeldt, A.; García-Godoy, F.; Asmussen, E. Surface hardness and wear of glass ionomers and compomers. Am. J. Dent. 1997, 10, 15–17. [Google Scholar]
  52. Lee, Y.-K. Criteria for clinical translucency evaluation of direct esthetic restorative materials. Restor. Dent. Endod. 2016, 41, 159. [Google Scholar] [CrossRef] [Green Version]
  53. Villarroel, M.; Fahl, N.; De Sousa, A.M.; De Oliveira, O.B. Direct Esthetic Restorations Based on Translucency and Opacity of Composite Resins. J. Esthet. Restor. Dent. 2011, 23, 73–87. [Google Scholar] [CrossRef]
  54. Pekkan, G. Radiopacity of Dental Materials: An Overview. Avicenna J. Dent. Res. 2016, 8. [Google Scholar] [CrossRef] [Green Version]
Figure 1. 3D printed silicone moulds of 25 × 2 × 2 mm for flexural strength testing.
Oral 01 00008 g001
Figure 2. 3D printed silicone moulds of 4 mm, 3 mm and 2 mm depth with 6 mm diameter and 0.5 mm jig stand with 9 mm diameter for the depth of cure testing.
Oral 01 00008 g002
Figure 3. Flexural strength (MPa) measured by three-point bending. The materials are ranked in descending order according to their means (black horizontal bars), and the standard deviations are added in the form of error bars. Vertical bar connects materials that are not statistically different (p > 0.05) (n = 30).
Oral 01 00008 g003
Figure 4. Weibull probability plot obtained by three-point flexural testing (σ) in Mpa (n = 30).
Oral 01 00008 g004
Figure 5. Elastic modulus (Gpa) measured by nanoindentation testing. The materials are ranked in descending order according to their means (black horizontal bars) with error bars of 1 standard deviation. Vertical bars connect materials that are not statistically different (p > 0.05) (n = 20).
Oral 01 00008 g005
Figure 6. Depth of cure (%) measured by the ratio of bottom to top hardness from nanoindentation testing. The materials are ranked in descending order according to their means (black horizontal bars) with error bars of 1 standard deviation. Vertical bars connect materials that are not statistically different (p > 0.05) (n = 20).
Oral 01 00008 g006
Table 1. The materials and their composition, used in this study.
Material
(Manufecturer)
CompositionPowder to Liquid Ratio (g)Particle Size (µm)
Fuji IX
(GC, Tokyo, Japan)
Powder:
  • 95% FAS glass
  • 5% polyacrylic acid powder
Liquid:
  • 40% polyacrylic acid
  • 10% polybasic carboxylic acid
  • 50% distilled water
0.35:0.1010
EQUIA Forte Fil
(GC)
Powder:
  • 92–97% FAS glass
  • 3–8% polyacrylic acid powder
  • pigments trace
Liquid:
  • 34–45% polyacrylic acid
  • 5–10% polybasic carboxylic acid
  • 45–55% distilled water
0.40:0.1310
EQUIA
Coat
(GC)
  • 40–50% MMA
  • 5–15% silica
  • 35–45% multifunctional acrylate/methacrylate monomer
  • 1–5% phosphoric ester monomer
  • initiator trace
Resin matrix
(Photoinitiator)
FillerFiller fraction
(wt%/vol%)
Filtek One bulk fill restorative
(3M ESPE, Seedfeld, Germany)
UDMA, 1,12-DDMA, AFM, AUDMA
(CQ)
76.5/58.420 nm silica, 4–11 nm zirconia, ytterbium trifluoride filler consisting of agglomerate 100 nm particles
Filtek Z350 composite
(3M ESPE)
Bis-GMA, UDMA, TEGDMA, PEGDMA, Bis-EMA
(CQ)
78.5/63.320 nm silica, 4–11 nm zirconia, 0.6–10
microns cluster
Abbreviations: FAS, fluoro-alumino-silicate; MMA, methylmethacrylate; 1,12-DDMA, 1, 12-dodecanediol dimethacrylate; AFM, addition-fragmentation monomer; AUDMA, aromatic urethane dimethacrylate; CQ, camphorquinone; Bis-GMA, bisphenol-A-glycidyl dimethacrylate; UDMA, urethane dimethacrylate; TEGDMA, triethylene glycol dimethacrylate; PEGDMA, polyethylene glycol dimethacrylates; Bis-EMA, ethoxylated bisphenol-A-dimethacrylate; wt%, weight percentage; vol%, volume percentage.
Table 2. Summary of hardness (Gpa) of materials studied (EF, EQUIA Forte; BF, Filtek One Bulk Fill Restorative; CR, Filtek Z350).
MaterialMean Hardness Value (Gpa ± S.D)
EF0.47 ± 0.02
EF no coat0.38 ± 0.10
Fuji IX0.79 ± 0.13
BF0.85 ± 0.03
CR1.05 ± 0.05
Table 3. Summary of the depth of cure (DC) of materials studied (BF, Filtek One Bulk Fill Restorative; CR, Filtek Z350).
MaterialThickness (mm)Curing Time (s)Bottom Hardness (Gpa ± S.D)Top Hardness (Gpa ± S.D)Hardness Ratio (HVBottom-Top Ratio)%
BF4400.80 ± 0.050.83 ± 0.0896.8
4200.72 ± 0.020.85 ± 0.0385.0
3200.80 ± 0.040.90 ± 0.0488.3
2200.81 ± 0.050.89 ± 0.0390.3
CR2200.84 ± 0.071.05 ± 0.0580.0
Table 4. Summary of wear and mass loss, coefficient of friction of materials studied (EF, EQUIA Forte; BF, Filtek One Bulk Fill Restorative; CR, Filtek Z350).
MaterialMonth(s)Mass Loss (g)Coefficient of Friction (±S.D)Wear Loss (mm ± S.D)
Fuji IX30.010.002 ± 0.0010.045 ± 0.022
60.010.011 ± 0.0030.066 ± 0.019
120.020.003 ± 0.0030.167 ± 0.023
EF30.010.010 ± 0.0090.130 ± 0.014
60.010.024 ± 0.0010.100 ± 0.013
120.010.011 ± 0.0010.015 ± 0.009
BF300.003 ± 0.0020.020 ± 0.006
600.015 ± 0.0020.001 ± 0.007
1200.014 ± 0.0020.047 ± 0.006
CR300.010 ± 0.0090.013 ± 0.020
600.013 ± 0.0020.080 ± 0.009
1200.018 ± 0.0020.002 ± 0.007
Table 5. Summary of translucency parameter of materials studied (EF, EQUIA Forte; BF, Filtek One Bulk Fill Restorative; CR, Filtek Z350).
MaterialTranslucency Parameter
EF5.30
Fuji IX3.22
BF15.73
CR16.03
Publisher’s Note: MDPI stays neutral with regard to jurisdictional claims in published maps and institutional affiliations.

