Article

Bird Survival in Wind Farms by Monte-Carlo Simulation Modelling Based on Wide-Ranging Flight Tracking Data of Multiple Birds During Different Seasons

1
Institute of Biodiversity and Ecosystem Research at the Bulgarian Academy of Sciences, 1000 Sofia, Bulgaria
2
Independent Researcher, 1190 Vienna, Austria
*
Author to whom correspondence should be addressed.
Birds 2025, 6(3), 50; https://doi.org/10.3390/birds6030050
Submission received: 24 July 2025 / Revised: 17 September 2025 / Accepted: 18 September 2025 / Published: 22 September 2025

Simple Summary

Wind farms are growing fast, but their real impact on birds is still debated. We tracked eight Common Buzzards with high-precision Global Positioning System over several years in Northeast Bulgaria, where more than 200 wind turbines have operated for over 15 years. Using these flight-height data, we ran Monte-Carlo simulations based on the Band collision risk model to estimate how often Common Buzzards might collide with turbines of different sizes. We then checked our predictions against 18 years of systematic carcass searches under 114 turbines. Both the simulations and the field data point to a relatively low collision probability for Common Buzzards, and this probability varies with season: it is lowest during migration, when birds fly higher, and highest in winter and breeding, when they stay low. Our findings show that realistic flight-height distributions and seasonal behaviour must be included in Environmental Impact Assessments. Our results also suggest that Common Buzzards may quickly habituate to wind farms, although continued monitoring is essential.

Abstract

Wind energy development is a key component in the transition to sustainable clean energy. Collision probability depends on turbine dimensions and species-specific behaviour, and understanding these relationships is essential for effective Environmental Impact Assessment (EIA). We applied a simulation approach based on flight-height distributions of a medium-sized diurnal raptor, the Common Buzzard (Buteo buteo). Long-term Global Positioning System (GPS) tracking data from an area with over 200 operating wind turbines in Northeastern Bulgaria were combined with Monte Carlo simulations of the Band collision risk model, and the predictions were validated against 18 years of systematic carcass searches under 114 turbines. Importantly, collision probability of the Common Buzzard was season-dependent, being greater during breeding and wintering, when flights occurred at lower altitudes, and lower during migration, when birds flew higher. Both the simulations and the field data supported an overall relatively low collision probability, indicating a high avoidance rate in this species. These findings suggest that wind energy planning should account for seasonal variation in flight behaviour and community composition, while long-term monitoring remains essential to ensure that cumulative impacts are adequately assessed.

Graphical Abstract

1. Introduction

The dynamic changes in climate systems on the planet are obvious. One of the most efficient tools to mitigate these changes is the transition of energy production to renewable sources such as wind power. According to official information from the European Union, the installed wind power capacity by 2030 must be 510 GW [1]. This is more than twofold compared to 2022 [2]. While broad-scale analyses have not yet demonstrated global population declines attributable to wind power, there is growing evidence of negative impacts at local and regional scales, particularly for large raptors [3,4,5], but future expansion needs careful planning and effective Environmental Impact Assessment (EIA) tools.
The main impact is the collision of birds in some species sensitive to wind turbines and in badly sited wind farms. Several raptors and Old-World vultures appear to be especially vulnerable to collision with wind turbines [3,6,7,8,9,10,11,12,13]. Previous studies have documented high collision risks for upland raptors such as Hen Harriers (Circus cyaneus) and Golden Eagles (Aquila chrysaetos) in Scotland and the UK [6,7,11], for Griffon Vultures (Gyps fulvus) in Spain [9,10], and for White-tailed Eagles (Haliaeetus albicilla) in Norway [13]. More general assessments have summarized the broad-scale impacts of wind farms on birds in Europe and North America [3,8,12]. Habitat-related analyses show that turbine placement in or near key foraging areas strongly increases collision risk [14]. In addition, large soaring raptors often overlap with areas of high wind energy potential, leading to a systematic conflict between conservation and energy development [15,16,17,18]. Model-based approaches have demonstrated that Golden Eagles and other raptors select habitats and flight paths in ways that can significantly increase risk if turbines are not properly sited [19,20,21].
At least some other ‘soaring bird’ species do not appear to be similarly vulnerable. For example, while Old World vultures and their taxonomic relatives may have some difficulty in avoiding collisions [7,8,11,12,22,23], this difficulty does not seem to apply to New World vultures, as they are disproportionately unlikely to be killed at wind farms despite their frequent occurrence [3,24,25,26,27]. Another unrelated but predominantly scavenging species, the Common Raven (Corvus corax), is frequently recorded at wind farms but is rarely found as a victim of turbine collision [24,25]. Such species-specific differences underline that predictors of collision risk, such as flight type and seasonal movement strategies, must be taken into account [4]. This additional increase in selective pressure in the altered environment may impact local bird populations [28,29].
Mitigation measures are used to reduce the collision risk of birds with wind turbines in many regions of the world, including Northeastern Bulgaria. The most efficient are careful EIA-based selection of turbine locations and shutdown on demand during periods with increased collision risk [30]. More recent studies have highlighted that both turbine technical specifications and site-level factors strongly affect the probability of collision [21,31,32,33,34]. For example, rotor size and hub height determine the volume of airspace intersected, while maximum tip height and spacing influence the extent of overlap with flight paths [32,33,35]. Larger turbines may reduce overall collision numbers if fewer are installed, but they can also increase exposure for large soaring raptors flying at typical rotor heights [5].
There are two principal methods to evaluate collision probability. The first is direct carcass searches, and the second is simulation of collision probability using mathematical models. Carcass searches are limited by local land coverage and accessibility to the turbines. The models are often based on assumptions and cannot always be confirmed by direct evidence from real mortality, since long-term monitoring data are often lacking [31,36]. The rapid need to develop more wind energy projects requires information on the effects of turbine dimensions on collision risk for a range of bird species, especially species important for ecosystems and human life.
The best approach is to use carcass search results to validate collision risk estimated by models of flight behaviour, mainly with respect to flight height distributions [36,37]. The study of flight height is limited by the accuracy of altitude measurements and requires long-term data to account for variations related to changes in species ecology across the annual cycle. In this study, we used tracking data collected over several years to investigate the flight height distributions of eight Common Buzzards across migratory, breeding, and wintering periods in areas with operational wind turbines. The Common Buzzard is a model species of a medium-sized diurnal raptor (Accipitriformes). This ecological group of species is particularly exposed to potential collisions with wind turbines [38]. The low mortality rate found in our carcass monitoring for 18 years in the study area excludes a significant impact at the current moment [39,40]. Despite this, as raptors are long-lived, their populations are particularly sensitive to increased mortality [29,38].
Our study approach was based on a stochastic Monte Carlo adaptation of the Band collision risk model [5,19,41]. We considered the overlap of the wind turbines’ rotor height ranges with the birds’ flight height distributions as well as wind speed, operational periods, and turbine-specific technical parameters such as rotor diameter and rotation speed. Furthermore, we considered the increase in the rated power of wind turbines with larger rotor diameters to determine whether survival chances for Common Buzzards depend on many small turbines versus fewer large ones. Finally, we assessed the consistency of results between theoretical Monte Carlo simulations and real mortality of Common Buzzards found after 18 years of systematic carcass monitoring.
In this study, we hypothesized that collision risk for Common Buzzards would be season dependent. Specifically, we predicted that the probability of collisions would be higher during the breeding and wintering periods, when birds often fly at lower altitudes within the rotor-swept zone, and lower during migratory periods, when birds typically fly higher and are less exposed to turbine blades.

2. Materials and Methods

2.1. Study Area

The research was conducted in the Kaliakra region, Dobrich Province, Northeastern Bulgaria, part of the Dobruja Plateau and located within the Continental biogeographic region [20]. The area lies along the Via Pontica migration flyway, one of Europe’s most important routes for migratory birds, and includes breeding and wintering grounds for several raptor species of conservation concern. The climate is temperate-continental with maritime influence from the Black Sea; summers are hot, winters mild, and mean annual precipitation is ~450–500 mm [42]. Vegetation is dominated by steppe grasslands and arable farmland (wheat, maize, sunflower), with scattered shrublands and small woodland patches [20].
The study area (Figure 1) and its surroundings contain 114 operational wind turbines distributed across approximately 249 km2 (≈24,900 ha). Inter-turbine distances vary from ~115 m to ~11.8 km, reflecting multiple projects and layouts. Turbine models vary in hub height and rotor diameter, influencing the vertical extent of the rotor-swept zone. Most turbines are sited in open agricultural landscapes and on elevated plateaus to maximize wind exposure. The main technical specifications of the wind turbines in the study area are summarized in Table 1, and these parameters were used to define the vertical extent of the rotor-swept zone in the collision-risk modelling.
Habitats in the area provide suitable foraging grounds for Common Buzzards due to abundant prey, including small mammals such as common vole (Microtus arvalis) and wood mouse (Apodemus sylvaticus) [43], and reptiles such as the European green lizard (Lacerta viridis) [44], as well as the availability of perching and nesting sites.

2.2. Study Species

The Common Buzzard is a widespread, medium-sized diurnal raptor across Europe and parts of Asia. It is listed as Least Concern on the IUCN Red List [45], with a global population estimated at 3.6–6.0 million mature individuals, including ~2.0–3.7 million breeding pairs in Europe and ~12,000–18,000 breeding pairs in Bulgaria. The species typically breeds in forests, woodland edges, and agricultural mosaics, nesting in trees but occasionally also on cliffs or artificial structures [46]. Within our study area, suitable nesting conditions are present in small forest patches and shelterbelts, and several active nests have been confirmed, generally located at distances > 500 m from wind turbines. The number of breeding pairs varies between years in response to fluctuations in prey abundance, particularly of small mammals, which strongly influences Common Buzzards density and breeding success [47].
In Central and Western Europe populations are largely resident, while northern and eastern populations are migratory, moving south across Eastern Europe and the Balkans during autumn and returning north in spring [45]. The study area is situated along the Via Pontica flyway, one of the most important raptor migration corridors in Europe [20], where large numbers of Common Buzzards are recorded annually. Regional counts have documented tens of thousands of migrants at coastal sites [48], and vantage-point surveys in our study area between 2019 and 2023 recorded between 1169 and 4129 individuals per season crossing the area of a single turbine [40].
The diet of the Common Buzzard is opportunistic, including small mammals such as voles and mice [43], reptiles such as the European green lizard (Lacerta viridis) [44], as well as birds and carrion, reflecting the species’ considerable behavioural flexibility in foraging strategies. Key threats include habitat loss, illegal persecution, collisions with turbines and vehicles, and secondary poisoning from rodenticides [38].

2.3. Study Design and Concepts

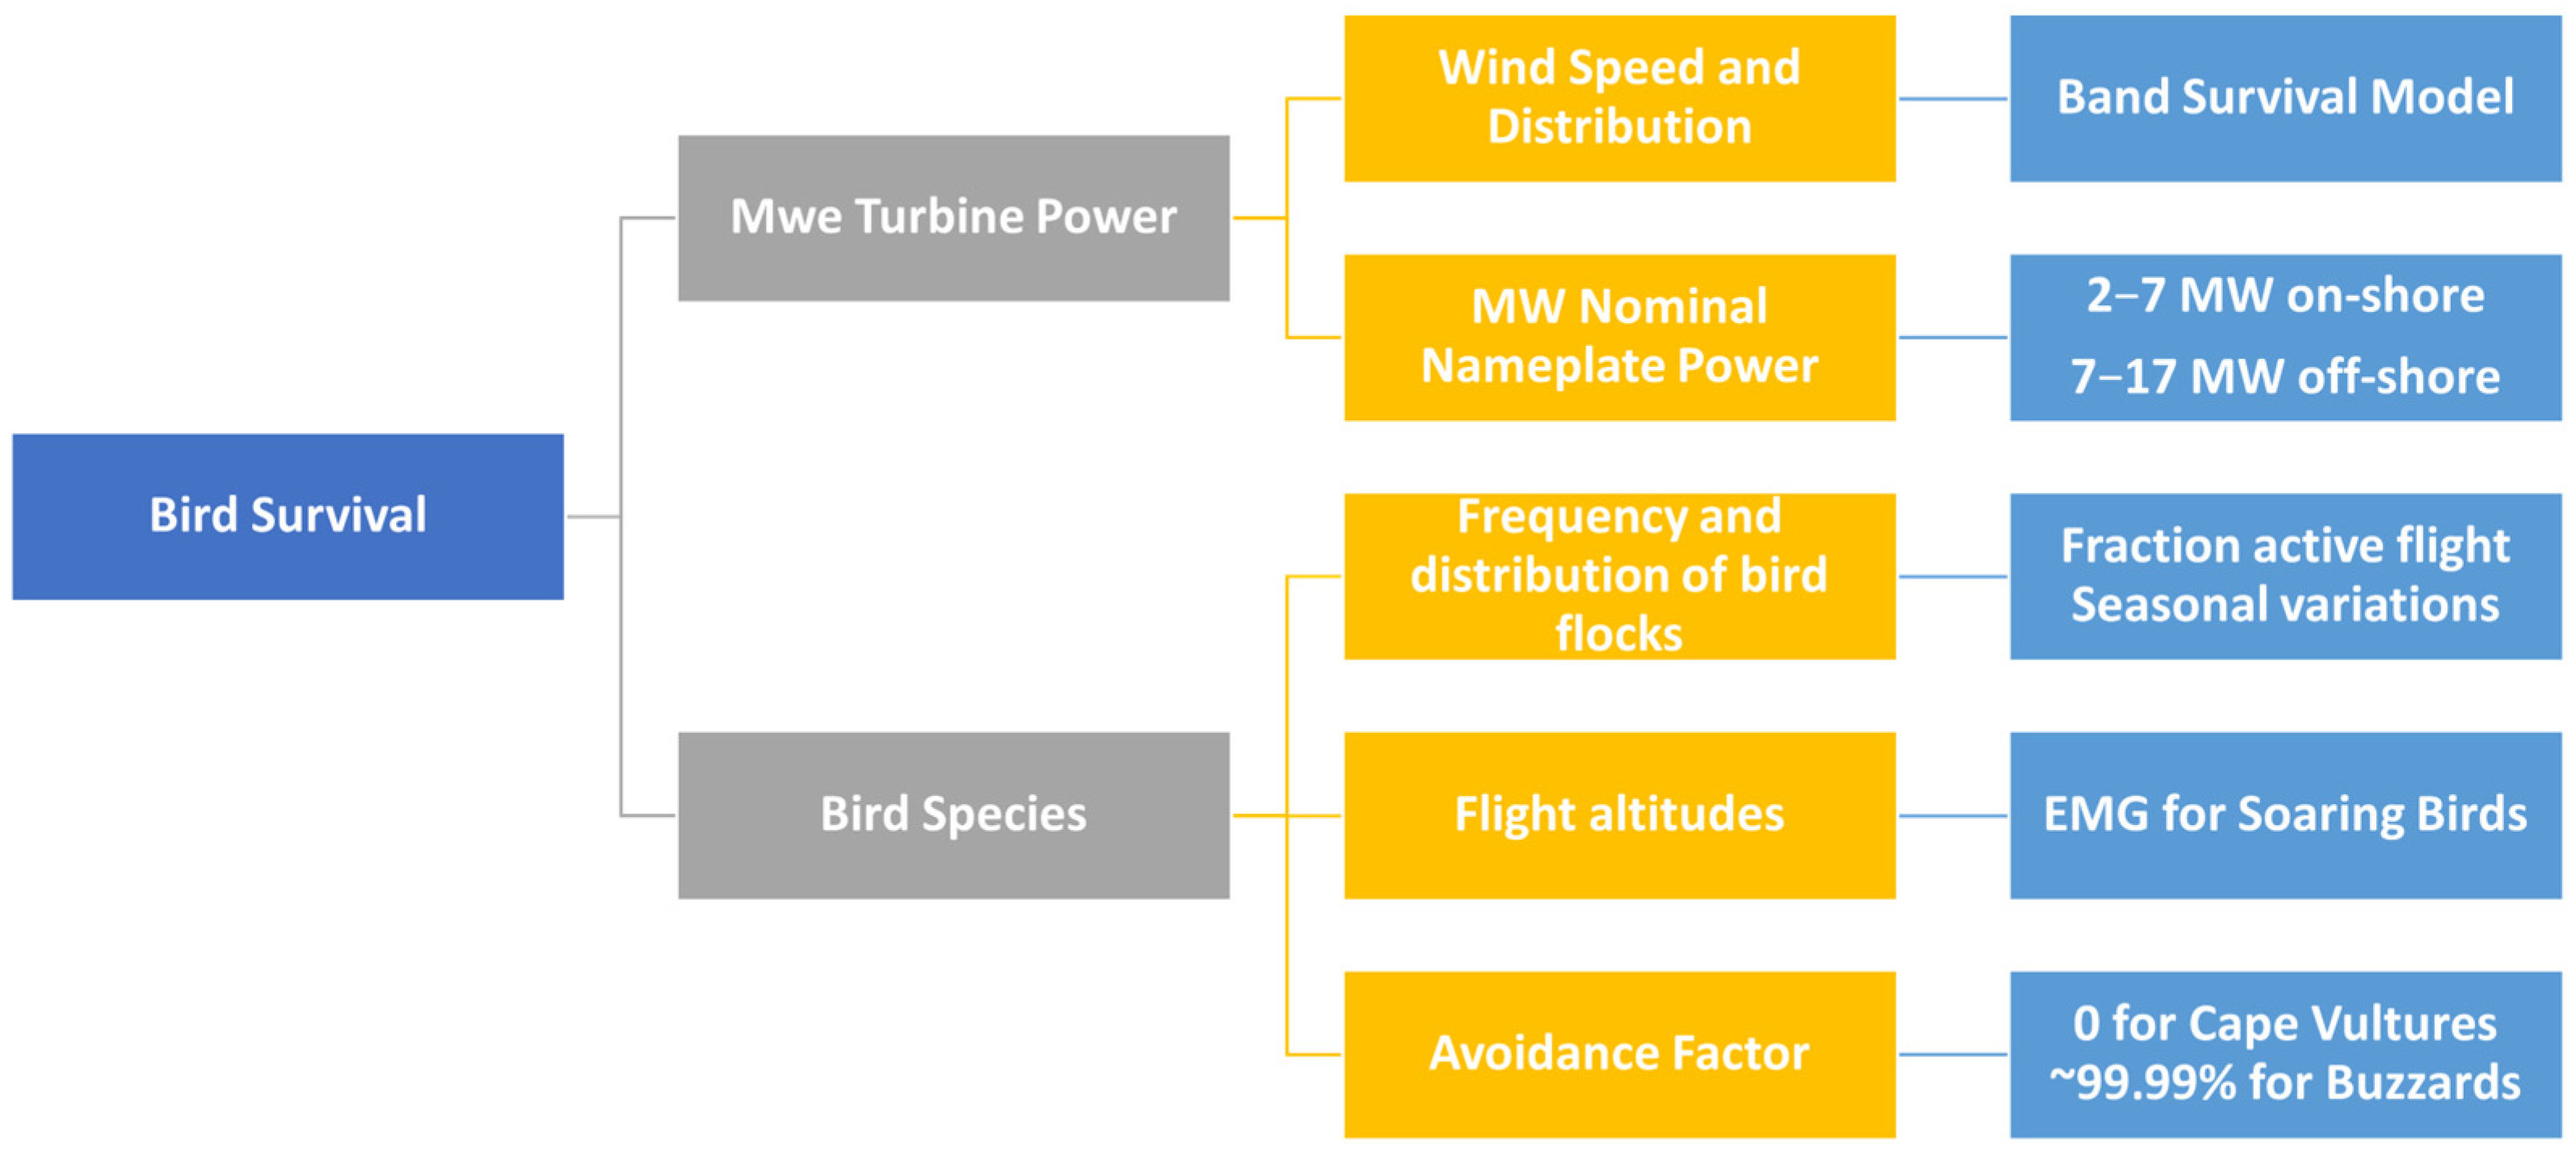
We investigated the theoretical survival probability of Common Buzzards passing through a wind farm area in Northeast Bulgaria. The study combined long-term GPS tracking data with systematic visual monitoring of raptor flights and carcass searches under operational turbines. We used seasonal flight-height distributions as inputs to a stochastic Monte Carlo implementation of the Band model [5,41] to estimate collision probability across turbine configurations. The study design is summarized in Figure 2.

2.4. Data Collection

2.4.1. GPS Tracking

We used solar-powered GPS/GSM tags (Druid LEGO 2G, weight 18.7 g) deployed on nine B. buteo individuals. Each device recorded location, orthometric and ellipsoid altitude, ground speed, and other telemetry parameters with spatial accuracy of ~5 m. Devices were powered by integrated solar panels, enabling up to 2000 fixes per day. Altitude values from ellipsoid measurements were converted to orthometric heights using the UNAVCO Geoid Height Calculator (EarthScope Consortium, Washington, DC, USA) [18,49]. Only GPS fixes with ground speed >0 were retained for flight-height analysis.

2.4.2. Visual Observations

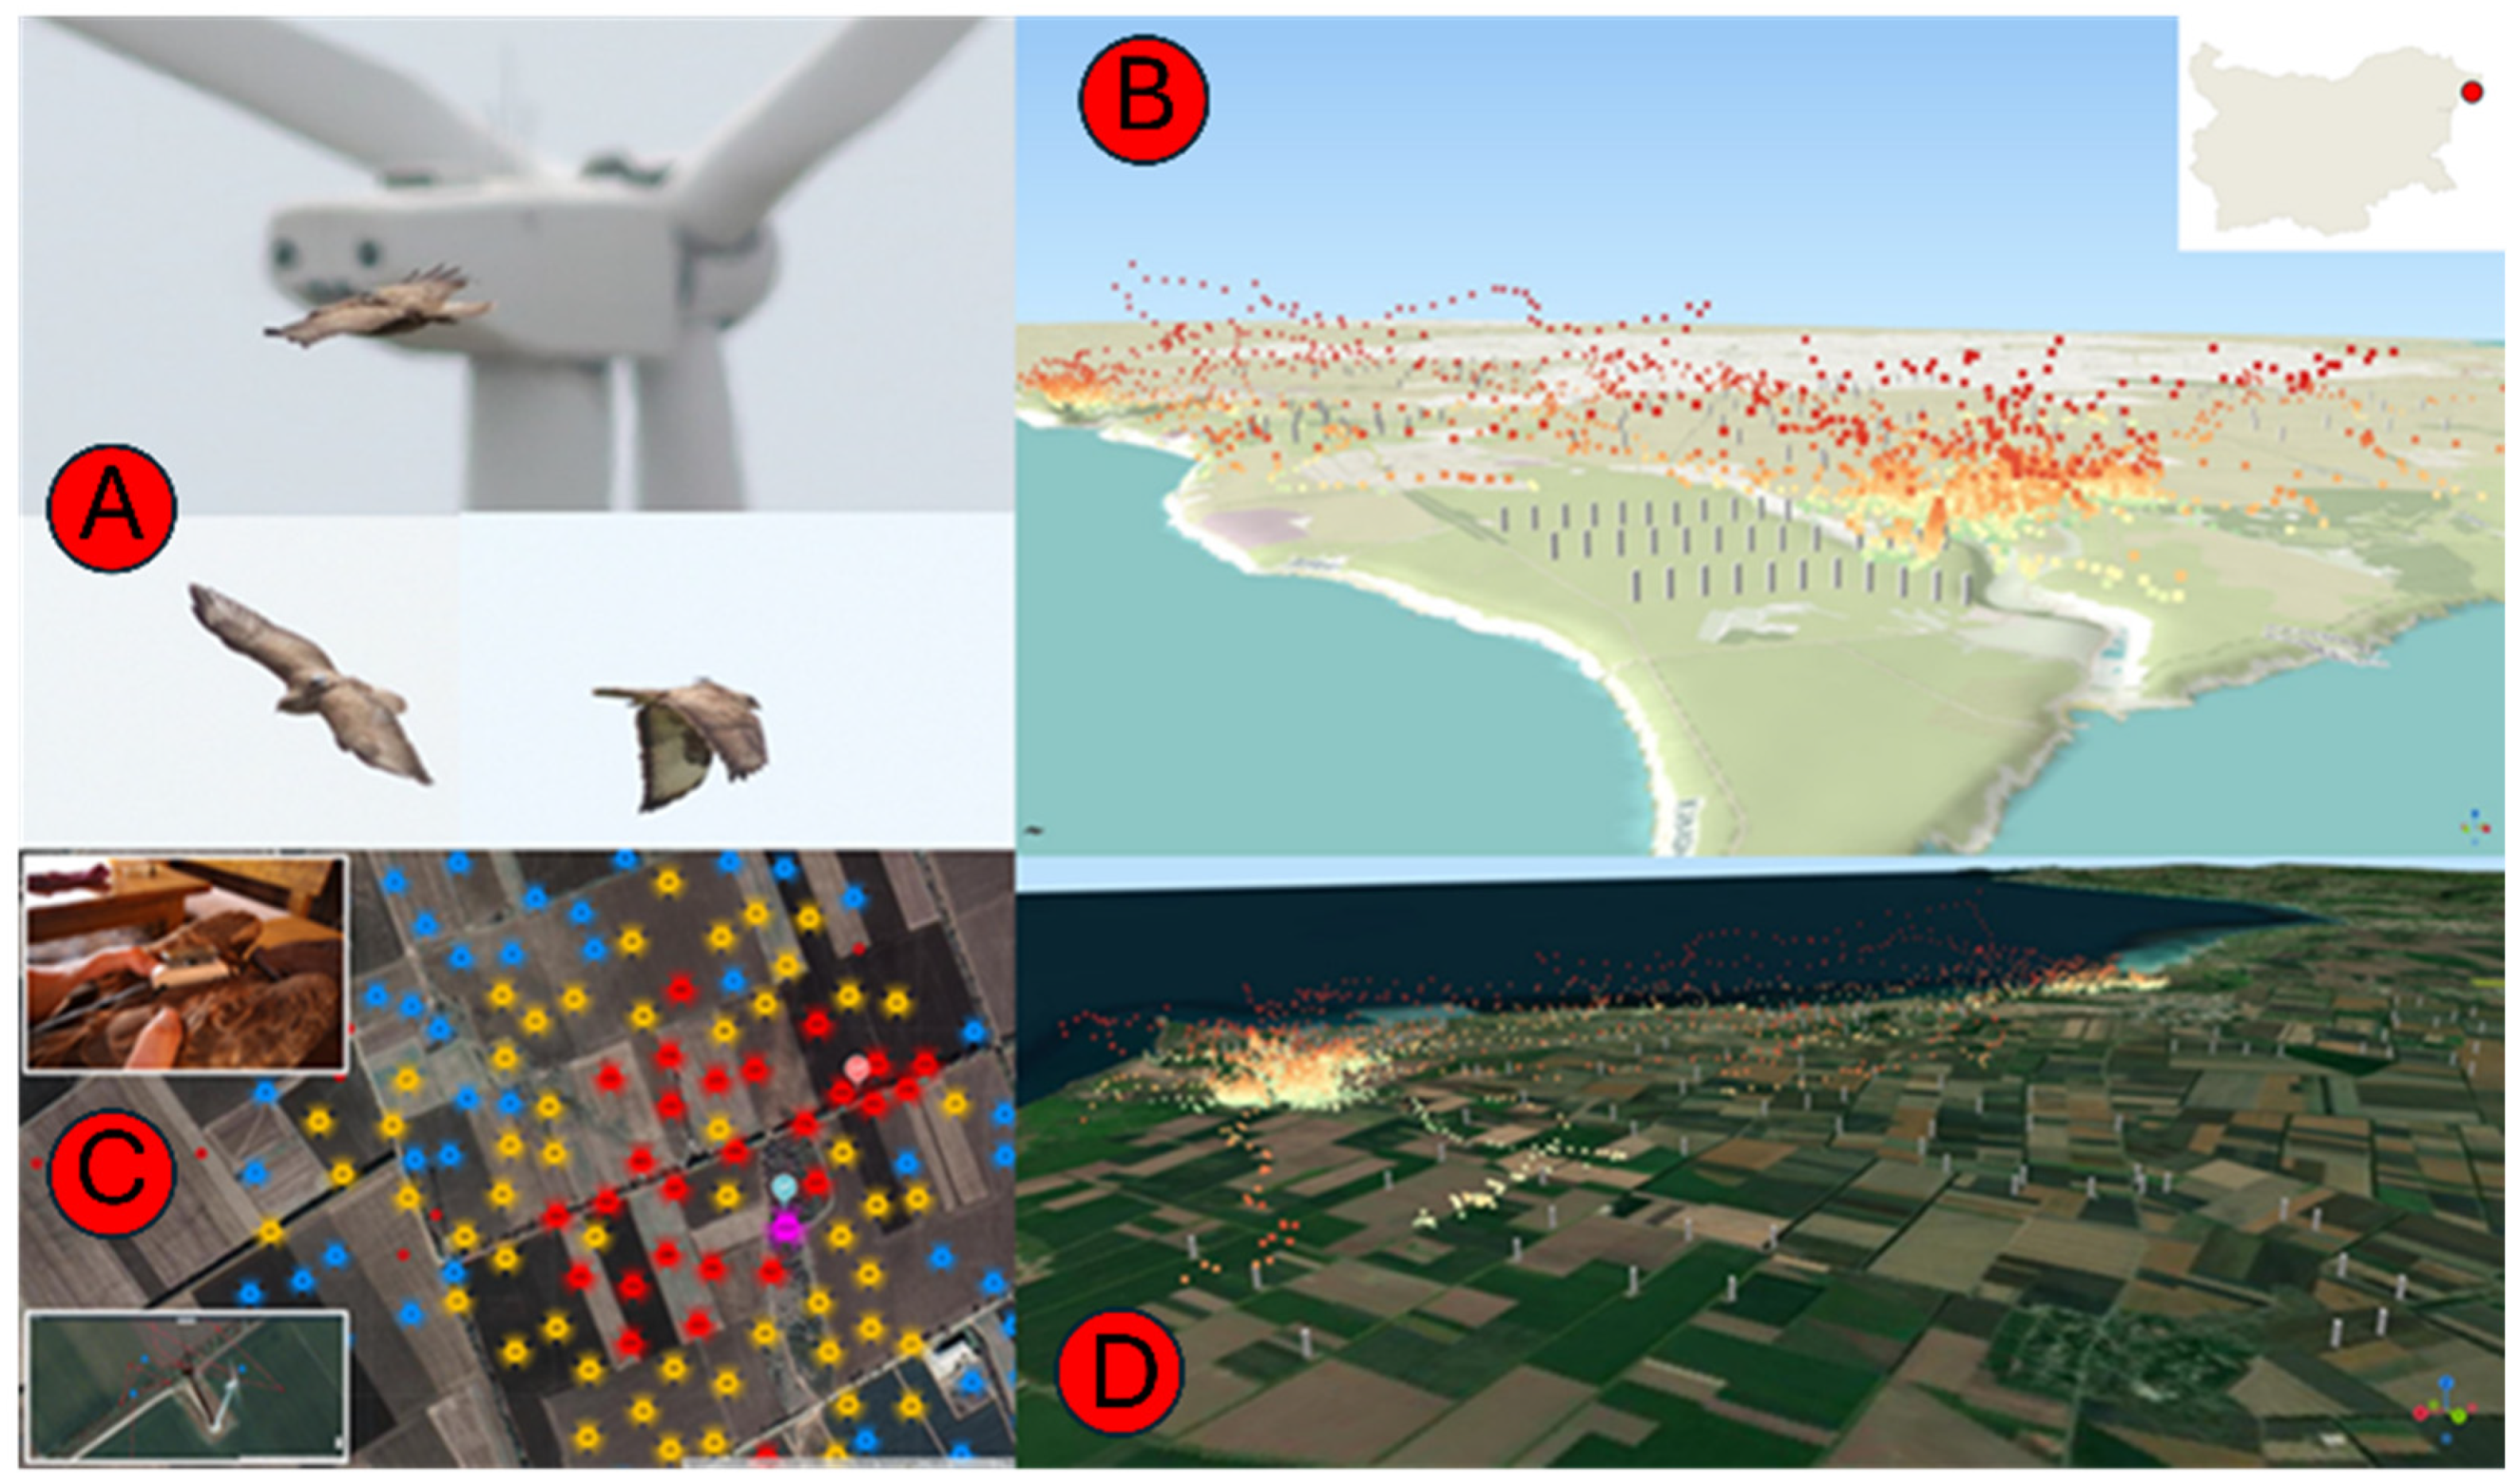
Standardized daytime vantage-point (VP) surveys followed the Ornithological Monitoring Plan developed for the Saint Nikola Wind Farm [39], which is consistent with international standards for raptor monitoring at wind facilities [14,50]. Fixed observation points were selected to cover turbine clusters and the main raptor flight corridors. At each of the six VP stations, one observer was continuously present, and an additional mobile observer assisted in tracking flocks across the wind farm area. Surveys were conducted during autumn migration (15 August–31 October), wintering (December–February), and spring migration (15 March–15 May) between 2019 and 2023 and the results were included in seasonal public reports [40]. Observations were carried out daily from sunrise to sunset under suitable weather conditions (no fog, heavy precipitation, or strong winds > 10 m/s). Each station was equipped with 10× binoculars, 20–60× spotting scopes, GPS, and compass. Experienced observers recorded, for each bird or flock, species (with age/sex where possible), number, flight direction and behaviour, as well as prevailing weather. Horizontal distance and flight altitude were estimated using calibrated landmarks and GPS-based trials, and flight heights were assigned to predefined 10 m bands (0–10 m, …, >500 m) for consistency and integration with the collision-risk model [30]. Routine VP surveys reported in the public monitoring database were conducted only during spring and autumn migration and wintering. Observations were also carried out during the breeding period (June–July), but these were not part of the standardized monitoring programme and were therefore not included in the publicly available reports. Seasonal flight-height patterns for this period were primarily derived from GPS tracking, complemented by these ad hoc field observations (Figure 3).
The total observation effort amounted to 21,840 h in autumn migration (2019–2023), 25,200 h in wintering, 17,360 h in spring migration, and 17,080 h in the breeding period. At each of the six fixed vantage points, one observer was continuously present, and an additional mobile observer assisted in tracking flocks across the wind farm area, consistent with the Saint Nikola Ornithological Monitoring Plan. A Kruskal–Wallis test showed significant differences in total observation effort among seasons (H = 19.0, df = 3, p < 0.001). Post hoc pairwise comparisons indicated that wintering and autumn migration had significantly higher observation effort than spring migration and the breeding period, while spring and breeding did not differ significantly from each other.

2.5. Carcass Searches

Systematic carcass searches followed the Ornithological Monitoring Plan for the Saint Nikola Wind Farm [39], which was adapted from the protocols described by Morrison et al. (2008) [39]. From 2018 to 2023, all 114 operational turbines in the study area were monitored. Searches were carried out in 200 × 200 m plots centred on each turbine, with parallel transects spaced 20 m apart; where vegetation reduced visibility (e.g., unharvested sunflower), transects were narrowed to increase detection probability. During autumn migration (15 August–31 October), wintering (December–February), and spring migration (15 March–15 May), turbines were searched once every seven days, and the results were included in seasonal public reports [40]. Outside these periods, including the breeding season (June–July), searches were performed every 14 days. Each search lasted approximately 30 min per turbine (park-wide 57 h per pass) and was conducted during daylight hours under suitable weather conditions.
This design resulted in total search efforts of 3135 h in autumn migration (2019–2023), 3705 h in wintering, 2565 h in spring migration, and 1140 h in the breeding period. A Kruskal–Wallis test confirmed significant differences in carcass-search effort among seasons (H = 19.0, df = 3, p < 0.001). Post hoc pairwise comparisons indicated that wintering and autumn migration had significantly higher effort than the breeding period, while spring and breeding did not differ significantly.
Observers documented every find with photographs, date and time, GPS coordinates, distance and bearing to the nearest turbine, carcass condition (intact, scavenged, or feather spot), and completed a written protocol. Each turbine check was supported by a GPS track. All carcasses were photographed and archived, and carcasses found during the breeding season are reflected in our dataset, even though this period was not covered by the standard seven-day monitoring scheme. Searcher-efficiency and carcass-persistence trials were carried out periodically throughout the study period, most recently in 2022, and the results are publicly available [40].
This monitoring design is consistent with international standards for collision fatality monitoring at wind facilities [32] but was adapted to local conditions in Northeastern Bulgaria, including extensive agricultural landscapes and seasonal changes in vegetation cover.

2.6. Data Processing and Modelling

Flight-height distributions were modelled using the Exponentially Modified Gaussian (EMG) distribution. Seasonal distributions derived from GPS and visual data were bootstrapped to account for inter-individual variation. These distributions were integrated into a stochastic Monte-Carlo implementation of the Band collision risk model [5,41] to estimate collision probability for different turbine configurations. Differences in seasonal flight altitudes were tested using the Kruskal–Wallis test, followed by post hoc pairwise comparisons with Bonferroni correction. All statistical analyses were performed in R version 4.3.2 [51]. In addition to the standardized carcass searches, systematic collision-victim monitoring was organized and performed by the Integrated System for Bird Protection (ISBP) in the Kaliakra SPA territory. These data provided an independent basis for comparison between the collision probabilities predicted by our model and the actual mortality recorded during six years of systematic searches. Mathematical details of the EMG (Figure 4) formulation are provided in the Supplementary Materials (Equations (S1)–(S3)). An illustrative example of the fitted distribution is shown in Supplementary Figure S1, and the SciLab script used for the simulations is available as Supplementary Code S1.

3. Results

3.1. Flight Height Distributions

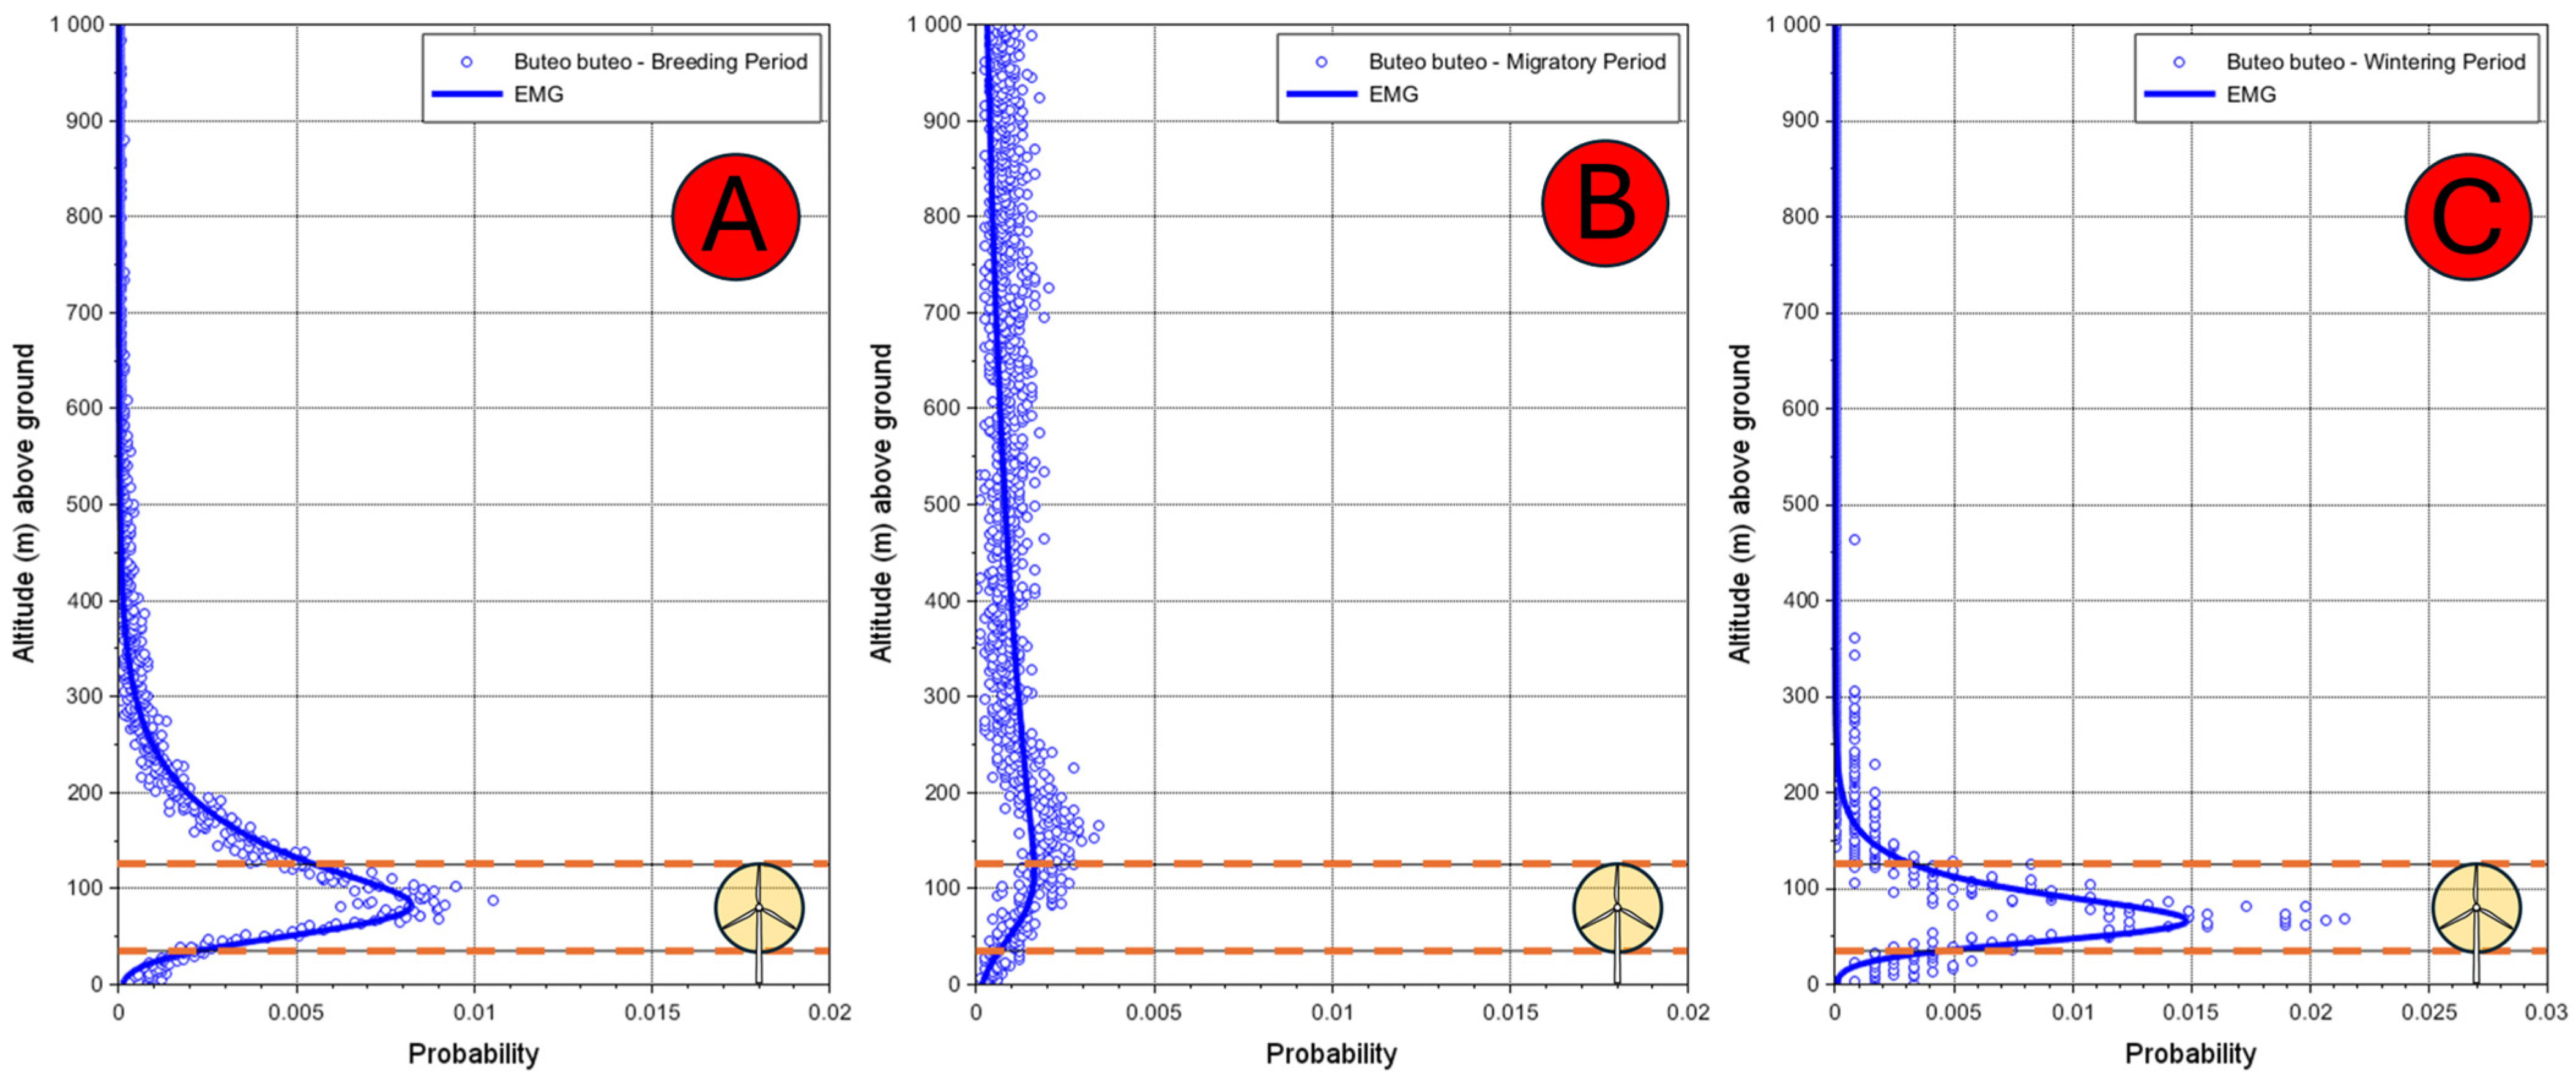
In periods of breeding and wintering, the flight height distributions were clearly unimodal (Figure 5). During the breeding season, Common Buzzards flew at mean altitudes of 68.2 ± 20.4 m (n = 13,047 GPS fixes), while in winter flight height was 68.0 ± 30.3 m (n = 247). In both cases, most flights were concentrated within the rotor-swept zone. By contrast, during migration the distribution shifted upward, with a mean flight altitude of 557.4 ± 372.3 m (n = 10,696), greatly reducing the overlap with turbine rotors. A Kruskal–Wallis test confirmed significant differences in flight altitude among seasons (H = 1138.4, df = 2, p < 0.001).
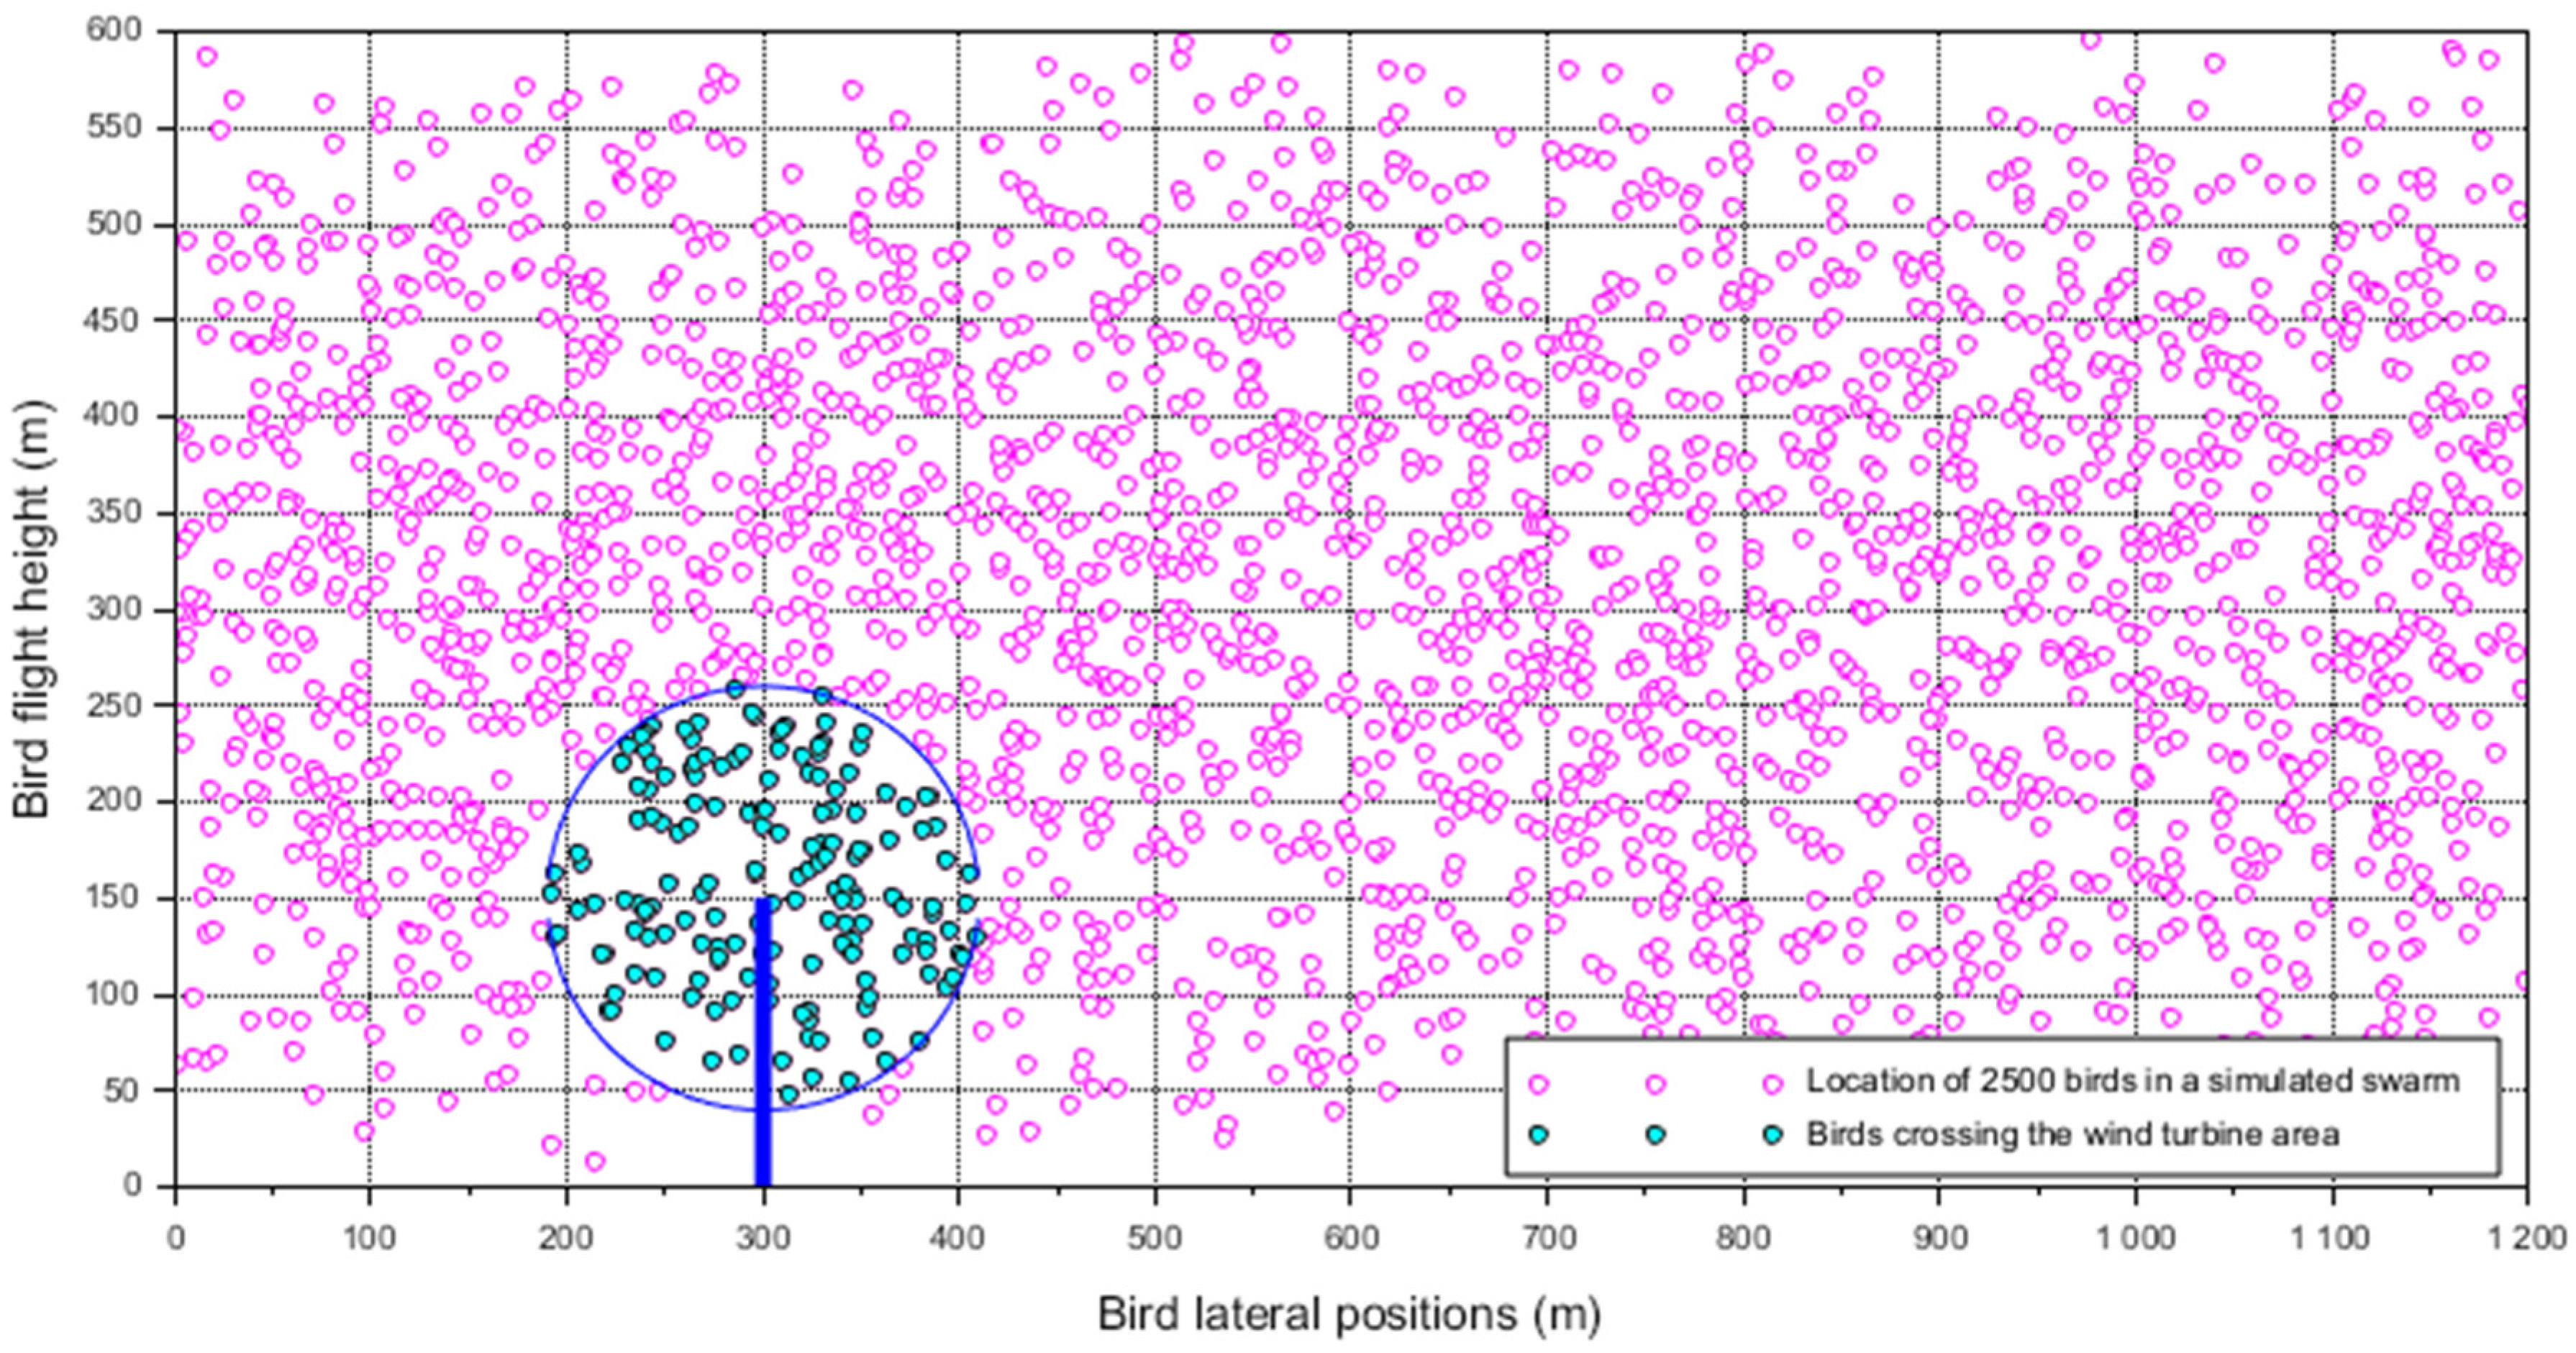
Seasonal differences in flight altitude were evident (Figure 5, Table 2). During wintering, Common Buzzards flew at low altitudes, with a mean of 68.0 ± 30.3 m (n = 247), reflecting short local flights between perches and feeding sites. In the breeding season, mean altitude was similar (68.2 ± 20.4 m, n = 13,047), but the overall flight activity was higher due to increased food requirements for growing offspring. In contrast, during migration Common Buzzards flew substantially higher, with a mean of 557.4 ± 372.3 m (n = 10,696), as birds undertook long-distance transit flights. A Kruskal–Wallis test confirmed significant differences in flight altitude among seasons (H = 1138.4, df = 2, p < 0.001). This seasonal pattern strongly influenced the probability of collision with wind turbines: risk was greatest in winter and breeding, when flights were concentrated within the rotor-swept zone, and lowest during migration, when most flights occurred above rotor height. Collision probability (CP) also varied between turbine models. Monte-Carlo simulations were run for each turbine type using observed flight-height distributions to quantify differences in CP associated with rotor diameter and hub height. An illustrative example of the simulated spatial distribution of bird positions around a turbine is shown in Figure 6.

3.2. Seasonal Variations in Number of Birds at the Risk Zone

For seasonal variation in the collision probability, we have applied data from a permanent Vantage Point (VP) used for monitoring of the birds in the study are in the middle of the area where 114 wind turbines operate in the moment. The data on the number of birds passing through the territory in different seasons, together with the timing, scope, and full details of the visual observation methodology, are available in the long-term monitoring database [40]. According to this data, the number of Common Buzzards passing the area of one single wind turbine with a range around the VP 4 km diameter varies between 1169 and 4129 Common Buzzards. in the period 2019–2023. For our model we have applied an average number of 2355 Common Buzzards passing per year the space of one turbine within an area with diameter 4 km.
Based on the data from permanent VP observations and data from GPS tracking of eight Common Buzzards in the last 3 years we have obtained numbers of Common Buzzards crossing the risky zone per every period of the life cycle of the species.
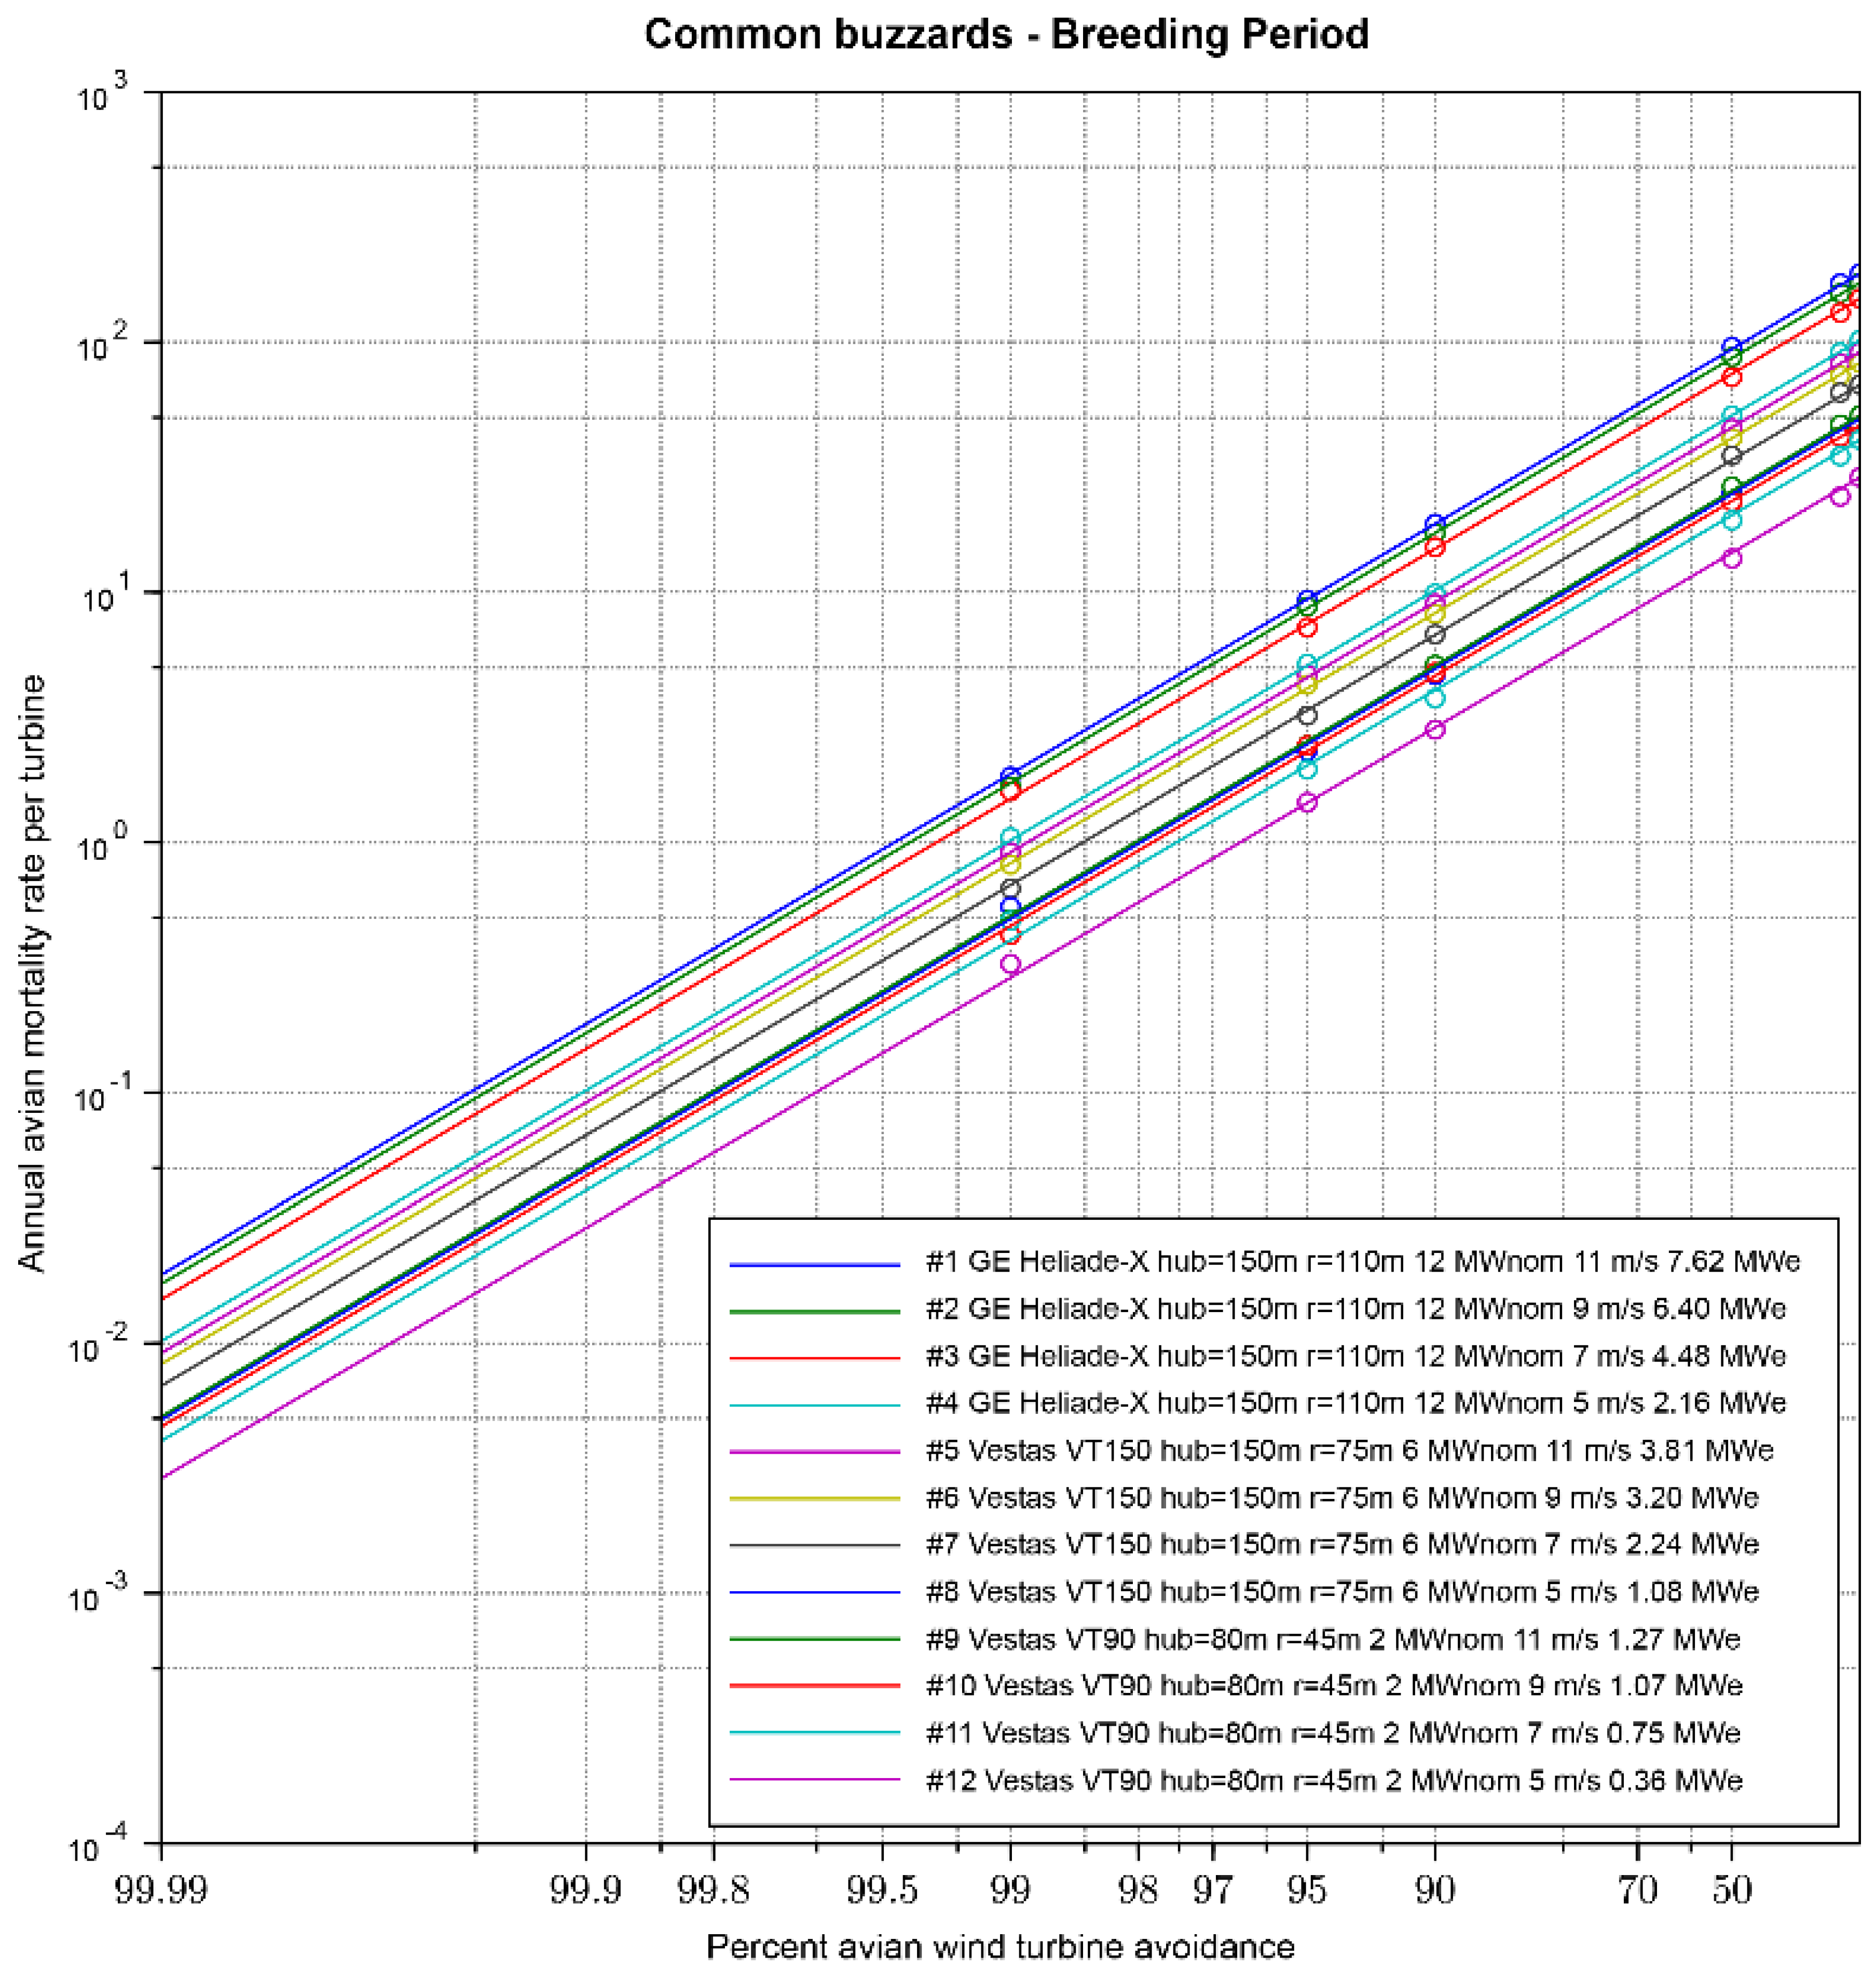
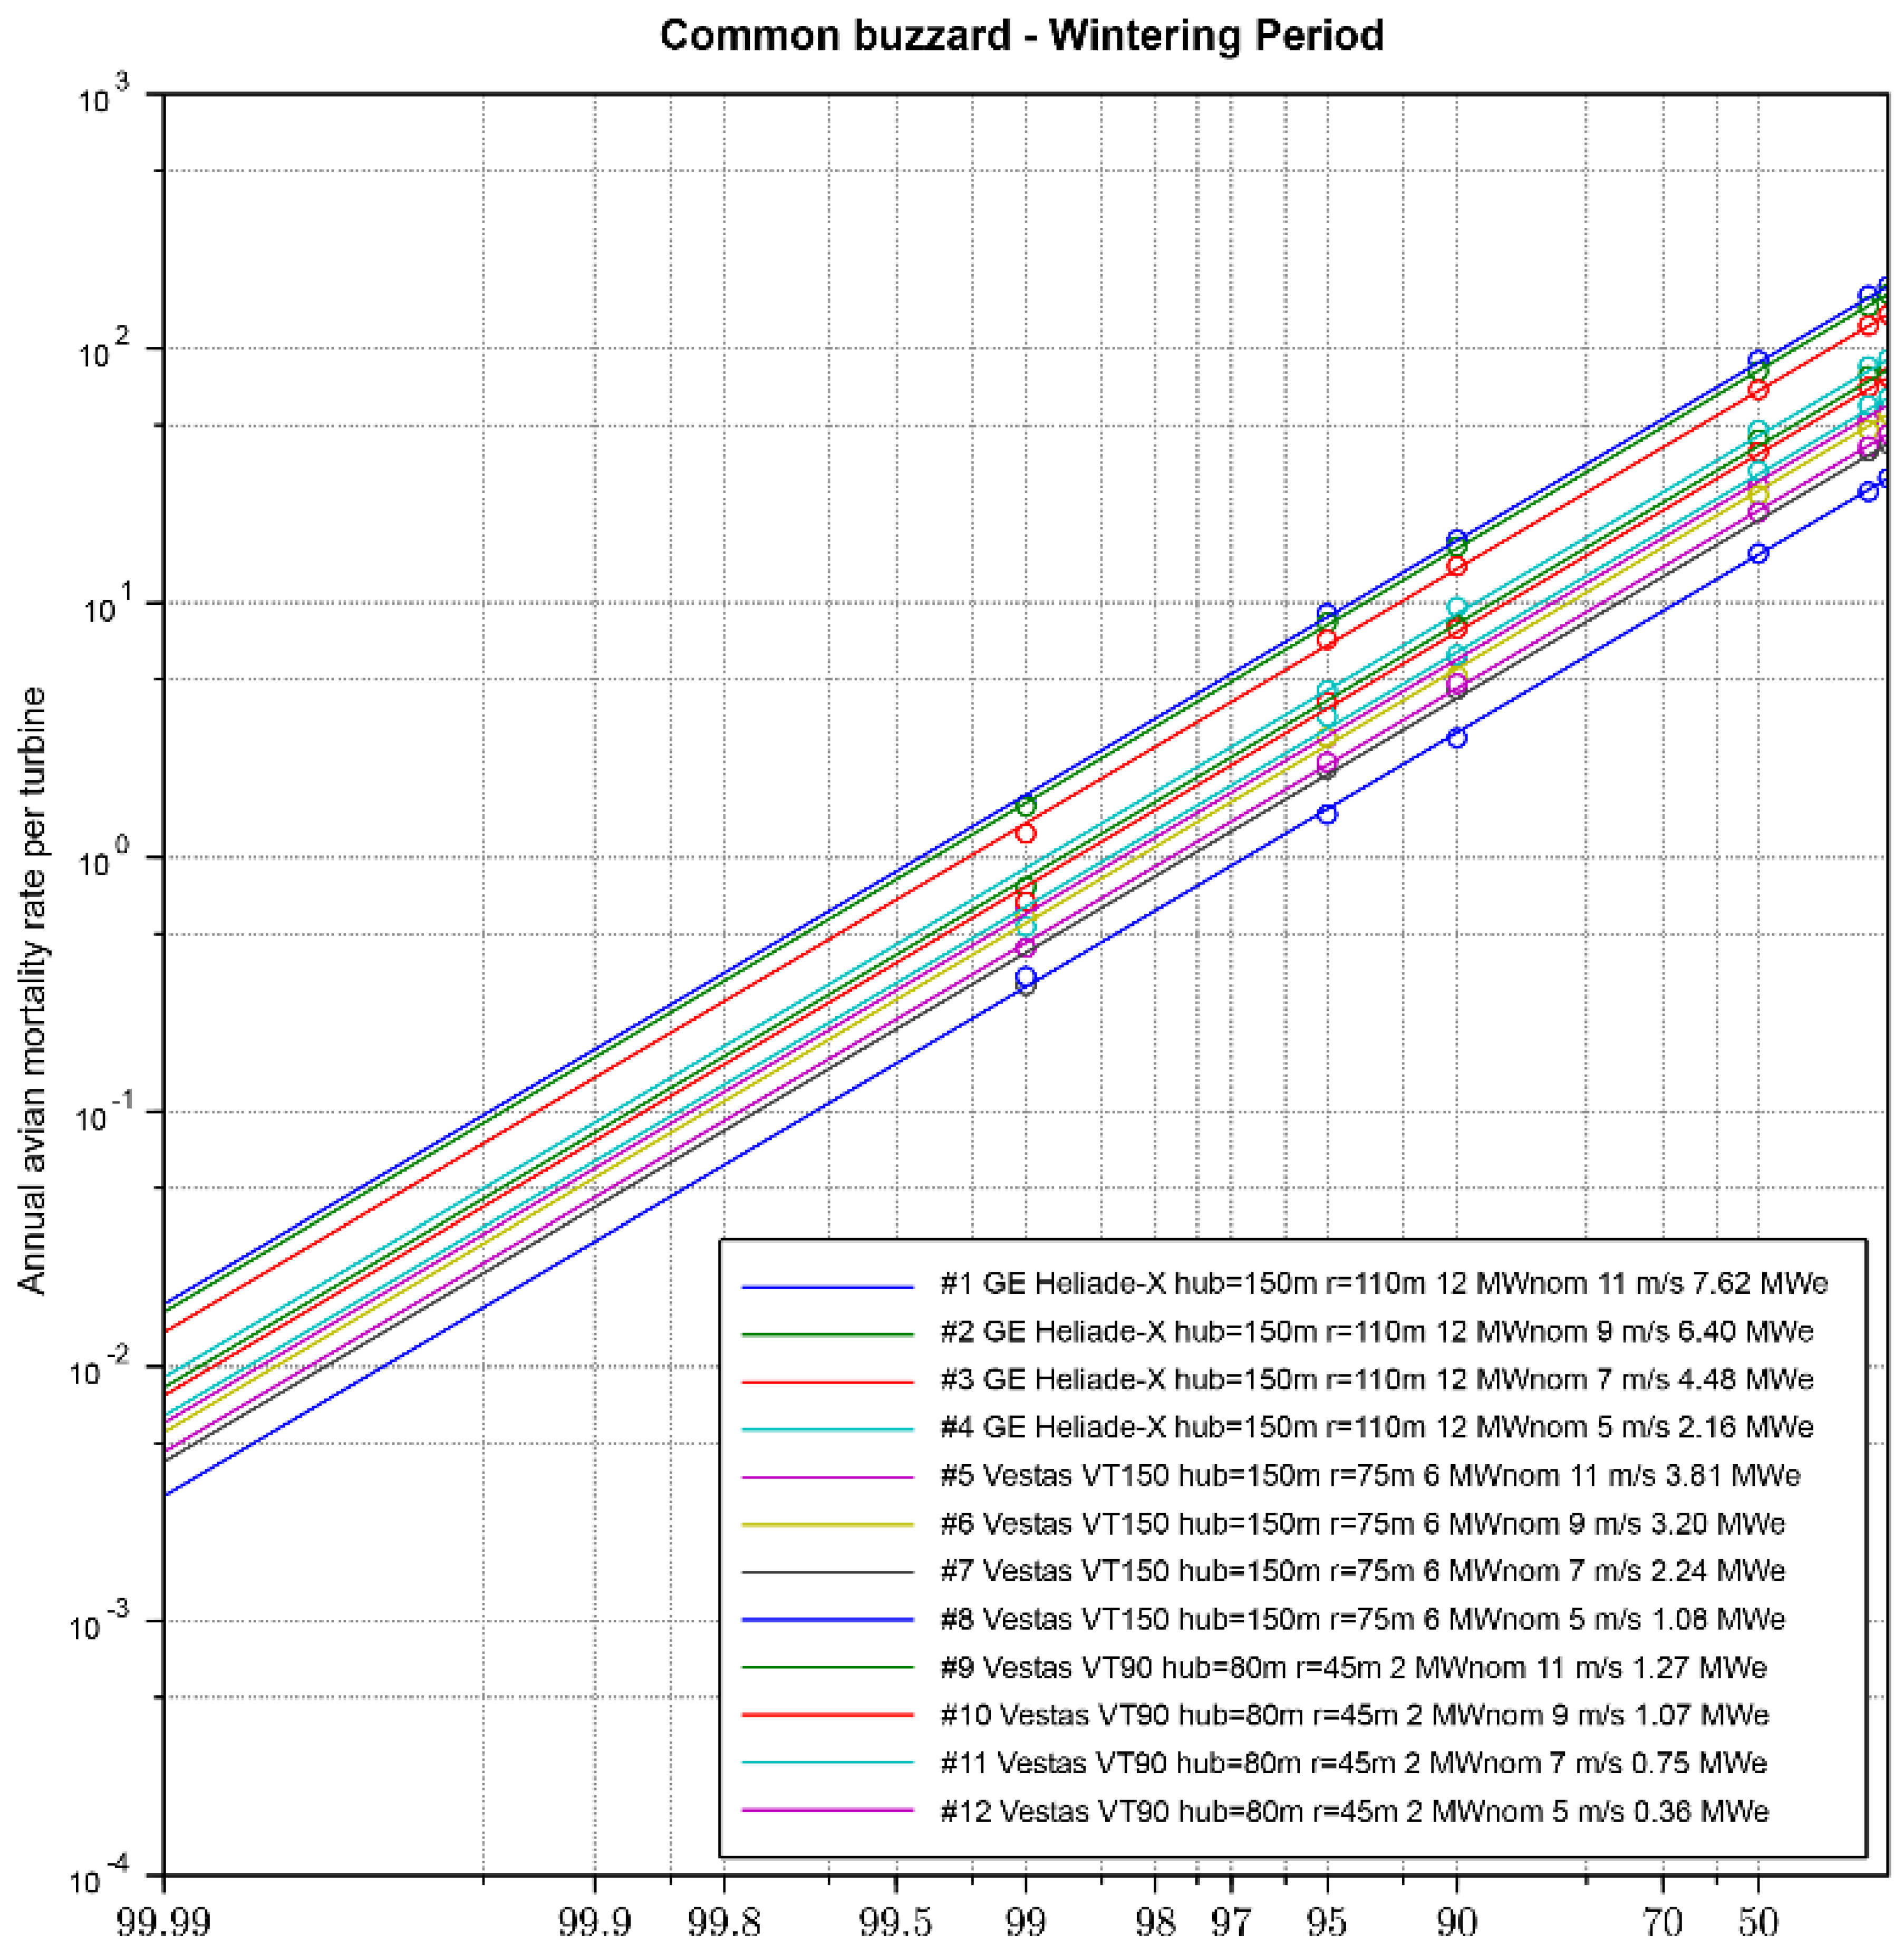
The model estimated the highest number of passing within the risky zone for wintering period when the number of Common Buzzards at risk are between 76 and 234 for turbines of 2, 6 and 12 MW, respectively. Similar values were estimated for Common Buzzards in the breeding season with variations between 64 and 236 (Figure 7).
The lowest number of birds at risky zones in the migratory season when 6 to 12 Common Buzzards were in the risky zone of a 2 MW turbine. For bigger turbines with bigger capacity this number increases and reaches 25 and 55 Common Buzzards per season, respectively, for 6 MW and 12 MW turbines (Figure 8, Figure 9 and Figure 10).
Collision probabilities are reported for avoidance levels of 95% and 99%, which are within the range commonly applied for raptors in collision risk modelling [7,27]. These scenarios represent realistic behavioural responses of Common Buzzards and correspond to predicted annual fatalities below 1 bird per turbine (Table 3).
The field data support the simulation results. The low mortality detected in carcass searches indicates a high avoidance rate in Common Buzzards (Table 4). In our analyses, the species consistently appeared among those with the lowest predicted collision probabilities (Figure 8, Figure 9 and Figure 10).

4. Discussion

We found that collision probability for Common Buzzards in the studied wind farm area was relatively low, with clear seasonal variation: the highest estimated risk occurred during wintering and breeding periods, when flights were more frequently within the rotor-swept zone, and the lowest during migration, when birds flew at higher altitudes. These modelled probabilities closely matched carcass search results from 114 turbines over multiple years, indicating a high avoidance rate in this species.
These findings contrast with the high vulnerability reported for Hen Harriers (Circus cyaneus) and Golden Eagles (Aquila chrysaetos) in Scotland [6,7,11], Griffon Vultures (Gyps fulvus) in Spain [9,10], and White-tailed Eagles (Haliaeetus albicilla) in Norway [13], where mortality rates have been substantially higher. The lower risk observed in our study species may be related to the greater behavioural flexibility and variable flight heights of Common Buzzards compared with these large soaring raptors and vultures.
Our results are consistent with the general pattern reported for Common Buzzards in Brandenburg, Germany, where collision risk was shown to be influenced by proximity to open habitats and specific landscape features [18]. In both cases, Common Buzzards were more exposed when flying low over open farmland, particularly outside migration periods. However, the absolute mortality rates in our study area were lower than those extrapolated in the PROGRESS study [52]. One reason for this difference may be the more dispersed turbine placement in our site, with average inter-turbine distances exceeding 5 km, reducing cumulative risk.
Comparisons with Finnish studies on Golden Eagles (Aquila chrysaetos) [19,20] reveal differences in species-specific responses. While Golden Eagles generally avoid turbines and maintain high survival in turbine-free areas, they may experience population-level impacts when mortality increases even slightly, due to their low reproductive rate. Common Buzzards, with higher reproductive potential and greater habitat flexibility, may adapt their flight behaviour seasonally to minimize collision risk, as indicated by our observed migration altitudes. This aligns with broader analyses that identify life-history traits such as flight type and reproductive rate as key predictors of species’ sensitivity to wind farms [4,5,35].
Evidence from modelling studies in the UK and Scotland [45,49] shows that spatial planning can significantly reduce collision risk for large raptors by identifying high-use flight paths and avoiding turbine placement in these areas. Similar model-based approaches in Finland and Spain have highlighted how habitat selection by Golden Eagles and subadult White-tailed Eagles can guide safer siting of turbines [21,53], while predictive models for large soaring raptors confirm that local topography and turbine placement strongly influence risk [42]. More recent studies also demonstrate that turbine dimensions, particularly the hub height and rotor diameter, can alter exposure probabilities in ways that must be accounted for in risk assessments [54].
In addition to direct mortality, displacement effects may also play an important role in shaping the impact of wind farms on raptor populations. Several studies have indicated that displacement, through reduced use of habitats near turbines, can sometimes exceed the demographic consequences of collision mortality [4]. We did not find evidence of such effects in Common Buzzards in our study area, but acknowledging their potential importance is necessary for comprehensive impact assessment and for guiding future monitoring programmes.
Our study has several limitations that should be acknowledged. Increasing the number of GPS-tracked Common Buzzards would provide a larger sample size and allow even more precise estimates of seasonal flight-height distributions. GPS altitude measurements, although corrected, remain subject to errors inherent to all GPS devices, which may affect the precision of flight-height estimates. Vantage-point surveys and carcass searches were conducted only during daylight hours, and results may therefore not fully capture potential differences in bird activity and carcass detectability between morning, daytime, and evening periods. Carcass searches are further constrained by detection probability, scavenger removal, and habitat conditions, while collision-risk models rely on assumptions that inevitably simplify bird behaviour and turbine operation. These limitations are common to all studies assessing wind farm impacts on birds and highlight the need for cautious interpretation of absolute risk estimates. From a management perspective, several mitigation measures have been proposed to reduce collision risk. Field trials in Norway demonstrated that painting a single rotor blade in black reduced bird mortality by more than 70% compared with unpainted turbines [34]. Other approaches include the use of bioacoustic deterrents, such as playback of predator and alarm calls combined with visual models, which displaced small birds in short-term trials in Nova Scotia [55]. Future research should aim to expand the sample size of tracked individuals and to include additional species, thereby improving the generality of impact assessments and providing stronger guidance for conservation-oriented planning of wind energy developments.

5. Conclusions

Our study demonstrates that the collision risk for Common Buzzards in the investigated wind farm area is low, with marked seasonal variation driven by flight-height behaviour. The highest potential risk occurs during wintering and breeding seasons, when birds more often enter the rotor-swept zone, while migration periods pose the lowest risk due to higher flight altitudes.
The strong agreement between the modelled probabilities and observed carcass data confirms that integrating high-resolution GPS tracking with systematic mortality monitoring can produce reliable collision risk estimates. This approach enables more precise, species-specific EIA and can inform targeted mitigation, such as seasonal turbine shutdowns that balance renewable energy development with raptor conservation.
Our findings underline the importance of tailoring wind farm planning and mitigation measures to the ecology and seasonal behaviour of focal species, and of validating predictive models with long-term field data.

Supplementary Materials

The following supporting information can be downloaded at: https://www.mdpi.com/article/10.3390/birds6030050/s1, Equations (S1)–(S3): EMG formulation and simulation procedure. Figure S1: Example of the Exponentially Modified Gaussian (EMG) in Monte Carlo simulation and analytical prediction. Code S1: SciLab script used for the Monte Carlo simulation.

Author Contributions

Conceptualization, P.Z. and H.N.; methodology, N.Y. and H.N.; software, N.Y.; validation, H.N., P.Z. and N.Y.; field work and data collection, N.Y. and K.B.; writing—original draft, N.Y. and H.N.; writing—review and editing, N.Y.; visualization, N.Y.; supervision, P.Z.; project administration, P.Z.; funding acquisition, P.Z. All authors have read and agreed to the published version of the manuscript.

Funding

This research received no external funding.

Institutional Review Board Statement

The study was performed in accordance with the legal requirements of the Bulgarian Ministry of Environment and Waters for catching and marking birds. All field procedures, including the tagging of Common Buzzards with GPS devices, were authorized under permits issued by the Ministry: Approval Codes 731/05.02.2018, 832/25.03.2020, 852/27.08.2020, 934/19.04.2022, and 1041/30.05.2024.

Data Availability Statement

The data presented in this study are available on request from the corresponding author. The data are stored in a shared Movebank project and are not publicly available due to restrictions related to sensitive species location information.

Acknowledgments

We are grateful to Integrated System for Protection of Birds in Kaliakra SPA https://kaliakrabirdmonitoring.eu/ (accessed on 16 September 2025) for the support and long-term monitoring data provided for our analysis. We would like to acknowledge Ekoznanie https://eko-znanie.eu/ (accessed on 16 September 2025). The study is a part of the PhD project of Nikolay Yordanov.

Conflicts of Interest

The authors declare no conflicts of interest. The funders had no role in the design of the study; in the collection, analyses, or interpretation of data; in the writing of the manuscript; or in the decision to publish the results.

References

  1. Plan, B.A. Commission Staff Working Document. In Implementing the REPower EU Action Plan: Investment Needs, Hydrogen Accelerator and Achieving the Bio-Methane Targets; European Commission: Brussels, Belgium, 2022. [Google Scholar]
  2. Europe, W. Wind Energy in Europe: 2022 Statistics and the Outlook for 2023–2027; WindEurope: Brussels, Belgium, 2023. [Google Scholar]
  3. Erickson, W.P.; Johnson, G.D.; Strickland, D.M.; Young, D.P., Jr.; Sernka, K.J.; Good, R.E. Avian Collisions with Wind Turbines: A Summary of Existing Studies and Comparisons to Other Sources of Avian Collision Mortality in the United States; Western EcoSystems Technology, Inc.: Cheyenne, WY, USA, 2001. [Google Scholar]
  4. Marques, A.T.; Batalha, H.; Bernardino, J. Bird Displacement by Wind Turbines: Assessing Current Knowledge and Recommendations for Future Studies. Birds 2021, 2, 460–475. [Google Scholar] [CrossRef]
  5. NatureScot Research Report 909-Using a Collision Risk Model to Assess Bird Collision Risks for Onshore Wind Farms | NatureScot. Available online: https://www.nature.scot/doc/naturescot-research-report-909-using-collision-risk-model-assess-bird-collision-risks-onshore-wind (accessed on 16 September 2025).
  6. Madders, M.; Whitfield, D.P. Upland Raptors and the Assessment of Wind Farm Impacts. Ibis 2006, 148, 43–56. [Google Scholar] [CrossRef]
  7. Whitfield, D.P.; Madders, M. A Review of the Impacts of Wind Farms on Hen Harriers Circus Cyaneus and an Estimation of Collision Avoidance Rates. Natural Research Information Note 1 (revised); Natural Research Ltd: Banchory, UK, 2006. [Google Scholar]
  8. de Lucas, M.; Janss, G.F.; Ferrer, M. Birds and Wind Farms: Risk Assessment and Mitigation; Quercus/Libreria Linneo: Madrid, Spain, 2007. [Google Scholar]
  9. De Lucas, M.; Ferrer, M.; Bechard, M.J.; Muñoz, A.R. Griffon Vulture Mortality at Wind Farms in Southern Spain: Distribution of Fatalities and Active Mitigation Measures. Biol. Conserv. 2012, 147, 184–189. [Google Scholar] [CrossRef]
  10. de Lucas, M.; Ferrer, M.; Janss, G.F. Using Wind Tunnels to Predict Bird Mortality in Wind Farms: The Case of Griffon Vultures. PLoS ONE 2012, 7, e48092. [Google Scholar] [CrossRef] [PubMed]
  11. Whitfield, D.P. Collision Avoidance of Golden Eagles at Wind Farms under the ‘Band’Collision Risk Model; Natural Research Ltd.: Banchory, UK, 2009. [Google Scholar]
  12. Ferrer, M.; De Lucas, M.; Janss, G.F.E.; Casado, E.; Muñoz, A.R.; Bechard, M.J.; Calabuig, C.P. Weak Relationship between Risk Assessment Studies and Recorded Mortality in Wind Farms. J. Appl. Ecol. 2012, 49, 38–46. [Google Scholar] [CrossRef]
  13. Dahl, E.L.; May, R.; Hoel, P.L.; Bevanger, K.; Pedersen, H.C.; Røskaft, E.; Stokke, B.G. White-tailed Eagles (Haliaeetus Albicilla) at the Smøla Wind-power Plant, Central Norway, Lack Behavioral Flight Responses to Wind Turbines. Wildl. Soc. Bull. 2013, 37, 66–74. [Google Scholar] [CrossRef]
  14. Thaxter, C.B.; Buchanan, G.M.; Carr, J.; Butchart, S.H.M.; Newbold, T.; Green, R.E.; Tobias, J.A.; Foden, W.B.; O’Brien, S.; Pearce-Higgins, J.W. Bird and Bat Species’ Global Vulnerability to Collision Mortality at Wind Farms Revealed through a Trait-Based Assessment. Proc. R. Soc. B Biol. Sci. 2017, 284, 20170829. [Google Scholar] [CrossRef]
  15. Katzner, T.; Smith, B.W.; Miller, T.A.; Brandes, D.; Cooper, J.; Lanzone, M.; Brauning, D.; Farmer, C.; Harding, S.; Kramar, D.E. Status, Biology, and Conservation Priorities for North America’s Eastern Golden Eagle (Aquila Chrysaetos) Population. Auk 2012, 129, 168–176. [Google Scholar]
  16. Watson, J.W.; Duff, A.A.; Davies, R.W. Home Range and Resource Selection by GPS-Monitored Adult Golden Eagles in the Columbia Plateau Ecoregion: Implications for Wind Power Development: Golden Eagle Range and Resource Selection. J. Wildl. Manag. 2014, 78, 1012–1021. [Google Scholar] [CrossRef]
  17. Reid, T.; Krüger, S.; Whitfield, D.P.; Amar, A. Using Spatial Analyses of Bearded Vulture Movements in Southern Africa to Inform Wind Turbine Placement. J. Appl. Ecol. 2015, 52, 881–892. [Google Scholar] [CrossRef]
  18. GeographicLib: GeographicLib Library. Available online: https://geographiclib.sourceforge.io/1.51/ (accessed on 16 September 2025).
  19. Tikkanen, H.; Pakanen, V.-M.; Karlin, O.-P.; Lamminmäki, J. Survival Estimates of GPS-Tagged Adult Golden Eagles (Aquila Chrysaetos) Breeding in Finland. Ornis Fenn. 2024, 101, 91–100. [Google Scholar] [CrossRef]
  20. Cervellini, M.; Zannini, P.; Di Musciano, M.; Fattorini, S.; Jiménez-Alfaro, B.; Rocchini, D.; Field, R.; Vetaas, O.R.; Irl, S.D.; Beierkuhnlein, C. A Grid-Based Map for the Biogeographical Regions of Europe. Biodivers. Data J. 2020, 8, e53720. [Google Scholar] [CrossRef]
  21. Tikkanen, H.; Rytkönen, S.; Karlin, O.-P.; Ollila, T.; Pakanen, V.-M.; Tuohimaa, H.; Orell, M. Modelling Golden Eagle Habitat Selection and Flight Activity in Their Home Ranges for Safer Wind Farm Planning. Environ. Impact Assess. Rev. 2018, 71, 120–131. [Google Scholar] [CrossRef]
  22. Vasilakis, D.P.; Whitfield, D.P.; Schindler, S.; Poirazidis, K.S.; Kati, V. Reconciling Endangered Species Conservation with Wind Farm Development: Cinereous Vultures (Aegypius Monachus) in South-Eastern Europe. Biol. Conserv. 2016, 196, 10–17. [Google Scholar] [CrossRef]
  23. Barrios, L.; Rodríguez, A. Behavioural and Environmental Correlates of Soaring-bird Mortality at On-shore Wind Turbines. J. Appl. Ecol. 2004, 41, 72–81. [Google Scholar] [CrossRef]
  24. Dürr, T. “Vogelverluste an Windenergieanlagen in Deutschland. Daten aus der Zentralen Fundkartei der Staatlichen Vogelschutzwarte. Landesamt für Umwelt, Gesundheit und Verbraucherschutz Brandenburg 2014”. 2019. Available online: https://scholar.google.com/scholar?hl=bg&as_sdt=0%2C5&q=21.%09D%C3%BCrr%2C+T.+Vogelverluste%E2%80%A6 (accessed on 16 September 2025).
  25. Smallwood, K.S.; Thelander, C. Bird Mortality in the Altamont Pass Wind Resource Area, California. J. Wildl. Manag. 2008, 72, 215–223. [Google Scholar] [CrossRef]
  26. Loss, S.R.; Will, T.; Marra, P.P. Estimates of Bird Collision Mortality at Wind Facilities in the Contiguous United States. Biol. Conserv. 2013, 168, 201–209. [Google Scholar] [CrossRef]
  27. Whitfield, D.P.; Madders, M. Deriving Collision Avoidance Rates for Red Kites Milvus Milvus. Nat. Res. Inf. Note 2006, 3, 1–14. [Google Scholar]
  28. Whitfield, D.P. Turbine Shutdown Systems for Birds at Wind Farms: A Review and Application at the St. Nikola Wind Farm, Kaliakra, Bulgaria; AES Geo Energy OOD: Sofia, Bulgaria, 2018. [Google Scholar]
  29. McGregor, R.M.; King, S.; Donovan, C.R.; Caneco, B.; Webb, A. A Stochastic Collision Risk Model for Seabirds in Flight; Marine Scotland Science Report. HC0010–400–001; HiDef: Cumbria, UK, 2018. [Google Scholar]
  30. Ross-Smith, V.H.; Thaxter, C.B.; Masden, E.A.; Shamoun-Baranes, J.; Burton, N.H.K.; Wright, L.J.; Rehfisch, M.M.; Johnston, A. Modelling Flight Heights of Lesser Black-backed Gulls and Great Skuas from GPS: A Bayesian Approach. J. Appl. Ecol. 2016, 53, 1676–1685. [Google Scholar] [CrossRef]
  31. Garvin, J.C.; Simonis, J.L.; Taylor, J.L. Does Size Matter? Investigation of the Effect of Wind Turbine Size on Bird and Bat Mortality. Biol. Conserv. 2024, 291, 110474. [Google Scholar] [CrossRef]
  32. Huso, M.; Conkling, T.; Dalthorp, D.; Davis, M.; Smith, H.; Fesnock, A.; Katzner, T. Relative Energy Production Determines Effect of Repowering on Wildlife Mortality at Wind Energy Facilities. J. Appl. Ecol. 2021, 58, 1284–1290. [Google Scholar] [CrossRef]
  33. Johnston, A.; Cook, A.S.C.P.; Wright, L.J.; Humphreys, E.M.; Burton, N.H.K. Modelling Flight Heights of Marine Birds to More Accurately Assess Collision Risk with Offshore Wind Turbines. J. Appl. Ecol. 2014, 51, 31–41. [Google Scholar] [CrossRef]
  34. Paint It Black: Efficacy of Increased Wind Turbine Rotor Blade Visibility to Reduce Avian Fatalities-May-2020-Ecology and Evolution-Wiley Online Library. Available online: https://onlinelibrary.wiley.com/doi/10.1002/ece3.6592 (accessed on 16 September 2025).
  35. Balmori-de la Puente, A.; Balmori, A. Flight Type and Seasonal Movements Are Important Predictors for Avian Collisions in Wind Farms. Birds 2023, 4, 85–100. [Google Scholar] [CrossRef]
  36. Beston, J.A.; Diffendorfer, J.E.; Loss, S.R.; Johnson, D.H. Prioritizing Avian Species for Their Risk of Population-Level Consequences from Wind Energy Development. PLoS ONE 2016, 11, e0150813. [Google Scholar] [CrossRef]
  37. Schaub, T.; Klaassen, R.H.G.; Bouten, W.; Schlaich, A.E.; Koks, B.J. Collision Risk of Montagu’s Harriers Circus Pygargus with Wind Turbines Derived from High-resolution GPS Tracking. Ibis 2020, 162, 520–534. [Google Scholar] [CrossRef]
  38. Bellebaum, J.; Korner-Nievergelt, F.; Dürr, T.; Mammen, U. Wind Turbine Fatalities Approach a Level of Concern in a Raptor Population. J. Nat. Conserv. 2013, 21, 394–400. [Google Scholar] [CrossRef]
  39. AES Geo Energy. Available online: https://www.aesgeoenergy.com/ (accessed on 16 September 2025).
  40. Kaliakra Bird Monitoring-Home. Available online: https://kaliakrabirdmonitoring.eu/ (accessed on 16 September 2025).
  41. Band, W. Windfarms and Birds: Calculating a Theoretical Collision Risk Assuming No Avoiding Action. In Scottish Natural Heritage Guidance Note 2000; Scottish Natural Heritage: Inverness, UK, 2000. [Google Scholar]
  42. Marinova, T.; Malcheva, K.; Bocheva, L.; Trifonova, L. Climate Profile of Bulgaria in the Period 1988–2016 and Brief. Bulg. J. Meteorol. Hydrol. 2017, 22, 2–25. [Google Scholar]
  43. Popov, V. Terrestrial Mammals of Bulgaria: Zoogeographical and Ecological Patterns of Distribution. In Biogeography and Ecology of Bulgaria; Fet, V., Popov, A., Eds.; Springer: Dordrecht, The Netherlands, 2007; pp. 9–37. ISBN 978-1-4020-5781-6. [Google Scholar]
  44. Stoyanov, A.; Tzankov, N.; Naumov, B. Die Amphiben Und Reptilien Bulgariens. Chimaira, Frankfurt Am Main; 2011; p. 588. Available online: https://www.researchgate.net/publication/260246052_Stoyanov_A_N_Tzankov_B_Naumov_2011_Die_Amphiben_und_Reptilien_Bulgariens_Chimaira_Frankfurt_am_Main_588_p (accessed on 16 September 2025).
  45. Eurasian Buzzard Buteo Buteo Species Factsheet. Available online: https://datazone.birdlife.org/species/factsheet/eurasian-buzzard-buteo-buteo (accessed on 16 September 2025).
  46. Simmons, K.E.L. Handbook of the Birds of Europe, the Middle East and North Africa. The Birds of the Western Palearctic. Volume II-Hawks to Bustards; Oxford University Press: Oxford, UK, 1980. [Google Scholar]
  47. Gryz, J.; Krauze-Gryz, D. The Common Buzzard Buteo Buteo Population in a Changing Environment, Central Poland as a Case Study. Diversity 2019, 11, 35. [Google Scholar] [CrossRef]
  48. Michev, T.M.; Proirov, L.A.; Karaivanov, N.P.; Michev, B.T. Migration of Soaring Birds over Bulgaria. Acta Zool. Bulg. 2012, 64, 33–41. [Google Scholar]
  49. Smith, D.A. There Is No Such Thing as “The” EGM96 Geoid: Subtle Points on the Use of a Global Geopotential Model. IGeS Bull. 1998, 8, 17–28. [Google Scholar]
  50. Morrison, M.L.; Block, W.M.; Strickland, M.D.; Collier, B.A.; Peterson, M.J. Experimental Designs. In Wildlife Study Design; Springer Series on Environmental Management; Springer New York: New York, NY, USA, 2008; pp. 77–135. ISBN 978-0-387-75527-4. [Google Scholar]
  51. R: The R Project for Statistical Computing. Available online: https://www.r-project.org/ (accessed on 16 September 2025).
  52. Rapp, R.H. Use of Potential Coefficient Models for Geoid Undulation Determinations Using a Spherical Harmonic Representation of the Height Anomaly/Geoid Undulation Difference. J. Geod. 1997, 71, 282–289. [Google Scholar] [CrossRef]
  53. Tikkanen, H.; Balotari-Chiebao, F.; Laaksonen, T.; Pakanen, V.-M.; Rytkönen, S. Habitat Use of Flying Subadult White-Tailed Eagles (Haliaeetus Albicilla): Implications for Land Use and Wind Power Plant Planning. Ornis Fenn. 2018, 95, 137–150. [Google Scholar] [CrossRef]
  54. Schaub, T.; Klaassen, R.H.G.; De Zutter, C.; Albert, P.; Bedotti, O.; Bourrioux, J.-L.; Buij, R.; Chadœuf, J.; Grande, C.; Illner, H.; et al. Effects of Wind Turbine Dimensions on the Collision Risk of Raptors: A Simulation Approach Based on Flight Height Distributions. Sci. Total Environ. 2024, 954, 176551. [Google Scholar] [CrossRef]
  55. Dorey, K.; Dickey, S.; Walker, T.R. Testing Efficacy of Bird Deterrents at Wind Turbine Facilities: A Pilot Study in Nova Scotia, Canada. Proc. Nova Scotian Inst. Sci. NSIS 2019, 50, 91–108. [Google Scholar] [CrossRef]
Figure 1. Location and spatial context of the study area in Northeastern Bulgaria. (A) Map of Europe showing the location of Bulgaria. (B) Map of Bulgaria with the study area in the Northeast highlighted. (C) Distribution of wind farms in the northeastern region of Bulgaria. (D) Detailed map of the study area with the locations of individual wind turbines.
Birds 06 00050 g001
Figure 2. Schematic of study design and data flow.
Birds 06 00050 g002
Figure 3. Study area, field methods, and spatial distribution of bird tracking data. (A) Common Buzzards flying near a wind turbine within the study area in NE Bulgaria. (B) 3D visualization of GPS tracking data showing bird flight altitude and density across the coastal wind farm landscape. (C) Clustered GPS locations of a tagged Common Buzzard in the core wind farm area, with inset photo taken during the tagging procedure. (D) 3D spatial overview of Common Buzzard movements and wind turbine positions across the agricultural landscape.
Birds 06 00050 g003
Figure 4. Example of the Exponentially Modified Gaussian EMG in Monte-Carlo simulation and analytical prediction.
Birds 06 00050 g004
Figure 5. Seasonal variation in flight height distributions of Common Buzzards in relation to wind turbine rotor-swept zones. (A) Breeding period: probability distribution of flight altitude above ground with observed data and fitted Exponentially Modified Gaussian (EMG) model. (B) Migration period: probability distribution of flight altitude with observed data and fitted EMG model. (C) Wintering period: probability distribution of flight altitude with observed data and fitted EMG model. The orange dashed lines represent the lower and upper limits of rotor height for typical turbines in the study area. The rotor icon in the bottom-right corner of each panel visualizes this range.
Birds 06 00050 g005
Figure 6. Stochastic model by Monte-Carlo simulations of 2500 birds’ distribution in air volume around a wind turbine used in our model.
Birds 06 00050 g006
Figure 7. Predicted number of Common Buzzards entering the rotor-swept zone of wind turbines with different rated capacities during (A) breeding, (B) migration, and (C) wintering periods, based on Monte Carlo simulations using seasonal flight-height distributions. Horizontal lines show mean ± SD annual crossings; open squares indicate non-avoidance fatality rates; dashed line represents the approximate prediction curve.
Birds 06 00050 g007
Figure 8. Predicted number of Common Buzzards entering the rotor-swept zone during the breeding season (2, 6 and 12 MW turbines; Monte Carlo estimates; mean ± SD).
Birds 06 00050 g008
Figure 9. Predicted number of Common Buzzards entering the rotor-swept zone during the migration season (2, 6 and 12 MW turbines; Monte Carlo estimates; mean ± SD).
Birds 06 00050 g009
Figure 10. Predicted number of Common Buzzards entering the rotor-swept zone during the wintering season (2, 6 and 12 MW turbines; Monte Carlo estimates; mean ± SD).
Birds 06 00050 g010
Table 1. Basic technical specifications of the wind turbines operating in the study area.
ModelNumber of TurbinesRotor Diameter (m)Hub Height (m)
Mitsubishi MWT-1000A3561.469
Vestas V907390.0105
HSW 250 T628.550
Table 2. Characteristic data of Common Buzzard GPS tracking in Bulgaria.
Bird Flight TypeNumber of GPSData Collection PeriodEMG * Gaussian Mean and Standard DeviationEMG * Exponential
Decay
Tracking PositionsFromToμ (m)±σ (m)τ (m)
Breeding13,0476 November 202129 June 202268.2±20.486.2
Migratory10,69624 March 202320 November 2023557.4±372.3184.3
Wintering24718 January 202224 January 202268.0±30.333.7
Note: “Data collection period” refers to the range of GPS tracking dates used for seasonal analyses. Seasonal assignments (Breeding, Wintering, Migratory) follow the species’ known annual cycle and were defined based on calendar periods (Breeding: April–June; Wintering: December–February; Migration: March–May and August–October). EMG = Exponentially Modified Gaussian distribution, with μ representing the Gaussian mean, σ the standard deviation, and τ the exponential decay parameter.
Table 3. Modelled annual collision risk per turbine for Common Buzzards at avoidance levels of 50%, 90%, 95% and 99% across seasons. Values are approximate ranges across turbine configurations.
SeasonAvoidance (%)Min Mortality/TurbineMax Mortality/Turbine
Wintering90212
950.32.5
990.010.25
Migratory9016
950.11.2
990.0050.1
Breeding901.58
950.252
990.010.15
Table 4. Data from systematic collision monitoring in 114 wind turbines in the study territory in the period 2018–2023.
Period of Annual CycleNumber of Collision VictimsNumber Per Year in 114 TurbinesNumber Per Year Per Turbine
Breeding period 30.50.004386
Migratory period 20.30.002632
Wintering period50.80.007018
Total 2018–2023101.60.014035
Disclaimer/Publisher’s Note: The statements, opinions and data contained in all publications are solely those of the individual author(s) and contributor(s) and not of MDPI and/or the editor(s). MDPI and/or the editor(s) disclaim responsibility for any injury to people or property resulting from any ideas, methods, instructions or products referred to in the content.