Article

The Effects of Disturbance Intensity on Tropical Forest Bird Communities and Vegetation Structure after Two Decades of Recovery

1
International Bird Conservation Partnership, 225 Crossroads Blvd. 275, Carmel, CA 93923, USA
2
Wildlife Biology Program, Lees-McRae College, 191 Main Str W, Banner Elk, NC 28604, USA
3
Center for Great Plains Studies, University of Nebraska-Lincoln, 1155 Q Str., Lincoln, NE 68588, USA
*
Author to whom correspondence should be addressed.
Birds 2024, 5(3), 388-403; https://doi.org/10.3390/birds5030026
Submission received: 21 June 2024 / Revised: 19 July 2024 / Accepted: 22 July 2024 / Published: 25 July 2024

Abstract

:

Simple Summary

A large portion of tropical forests around the world have been impacted by human disturbances such as clearcutting or selective logging. Impacts from these disturbances may remain long after the trees grow back, as other aspects of forest structure may have changed. Forests that are recovering from disturbances still play an important role for wildlife, though their conservation value compared to undisturbed forests is not well understood. To examine how different types of human disturbance impact tropical forest birds, we surveyed and compared bird communities in three different forest habitats: undisturbed primary forest, selectively logged forest (low disturbance), and forest replanted on abandoned agricultural fields (high disturbance). Our surveys occurred 19 years after any logging or agriculture, allowing our forest sites time to regrow. We found that while bird communities at low-disturbance sites were similar to undisturbed sites, high-disturbance sites had fewer bird species, with ant-following birds being particularly underrepresented. We related these results to vegetation structure measurements, which suggested that reducing tree density and vegetation ground cover in high-disturbance forests may improve these areas as tropical forest bird habitats.

Abstract

As tropical forests are frequently impacted by human disturbance, forests in various stages of disturbance recovery are increasingly important for maintaining biodiversity. However, much remains unclear regarding the impacts of prior disturbance intensity on wildlife in regenerating forests. Here, we used mist net capture data to compare bird communities in three tropical forest habitats representing various disturbance intensities: undisturbed primary forest, selectively logged forest (low disturbance), and secondary forest regenerating on abandoned agricultural fields (high disturbance). We found that after a 19-year recovery period, low-disturbance sites contained similar bird communities to undisturbed sites. High-disturbance sites, however, had lower species richness and distinct bird communities, with fewer insectivores and more nectarivores than other sites. Structural equation models revealed that the impacts of disturbance intensity on bird communities were partially explained by changes in vegetation structure: ant-following insectivore abundance declined with disturbance intensity as ground cover vegetation increased, and nectarivore abundance increased with disturbance intensity as tree density decreased. Our results suggest that selectively logged forests can regain pre-disturbance bird diversity and vegetation structure within two decades, provided that they are protected from further disturbance and located near source species pools. Increasing tree density and decreasing ground-level vegetation in secondary forests may improve these areas as habitats for forest-interior birds.

1. Introduction

Tropical forests are crucial for maintaining global biodiversity [1], as they provide habitats for the majority of the world’s bird, amphibian, terrestrial mammal, and flowering plant species [2]. However, habitat loss, fragmentation, and degradation due to anthropogenic activities have negatively impacted tropical forests around the world [3,4]. In western Amazonia, extensive loss of primary forests from logging, mining, agriculture, and the expansion of human settlements [5,6] has been taking place for the past several decades. As a result, regenerating forests, including forests that have been selectively logged for timber and secondary forests re-establishing on previously deforested land, play an increasingly important role in maintaining regional biodiversity and ecosystem function. Although logged and secondary forests likely cannot fully replace the biodiversity value of undisturbed primary forests [1], they may still make a significant contribution to forest conservation efforts [7,8,9], especially when protected from further disturbance [10]. However, predicting the conservation value of regenerating forests remains a challenge, as forest function changes with disturbance intensity and the length of the disturbance recovery period [9,11,12,13,14]. Despite the existence of a substantial body of research into the consequences of human impacts on forests [5,7,8,10,12,13,14], many studies do not consider logged or secondary forests after sufficiently long (>15 years) regeneration periods [15,16] or multiple disturbance types within the same forest system [17]. Additionally, human impacts on wildlife in tropical forests stem in part from changes in forest structure, a major determinant of bird community composition [18,19,20,21]. Many studies, however, fail to explicitly consider the effects of human disturbance on wildlife as mediated through changes in forest structure. Investigating such factors that influence the conservation value of regenerating logged and secondary forests is critical for improving the effectiveness of forest management efforts.
Improving bird diversity is crucial to forest management and conservation efforts, as birds are useful indicators of forest system integrity [22,23,24,25] and broad biodiversity trends [19]. Additionally, many forest-dependent tropical bird species appear to be heavily affected by habitat degradation from anthropogenic stressors such as logging [12,13,14,26,27], though the relationship between disturbance and forest generalist species is less understood [28]. Here, we used mist net capture data to examine the impacts of disturbance intensity and subsequent changes in vegetation structure on understory bird communities in the Allpahuayo-Mishana National Reserve (Reserva Nacional Allpahuayo-Mishana, RNAM), a federally protected tropical forest reserve in northeast Peru, approximately 19 years after regeneration following logging and conversion to agriculture. Birds are a particularly important taxon in RNAM, as this protected area was established following the discovery of endemic and threatened species that are especially sensitive to habitat loss and degradation [29,30,31].
Our study sites in RNAM comprised three forest habitat types: (1) primary (undisturbed) forests, (2) forests recovering after selective logging (low disturbance), and (3) secondary forests that were regenerating on abandoned crop fields (high disturbance). Logging and agricultural activity in our study area ceased with the establishment of the reserve in 2004, so the selectively logged and secondary forest sites were at least 19 years removed from their respective disturbances when fieldwork for this study occurred. Our objectives were to (1) examine differences in bird community composition between undisturbed, low-disturbance, and high-disturbance forest sites after allowing for a recovery period and (2) identify any changes in habitat structure that were related to observed differences in bird community composition. We predicted that avian diversity would be highest in undisturbed forest sites and would decrease with disturbance intensity. Additionally, we expected that responses to disturbance intensity would differ among bird dietary guilds [12,32] and that ant-followers and other insectivores would be the most negatively affected by past forest disturbance [23,33,34].

2. Materials and Methods

2.1. Study Area and Study Design

Data collection occurred at the Allpahuayo-Mishana National Reserve (RNAM, 03°58′ S, 73°25′ W), a state-protected tropical forest system that comprises 58,070 ha in the department of Loreto, northeastern Peru. RNAM was established in 2004 primarily to protect the white-sand forests, known locally as varillal, that are rare in Amazonia but locally common [30]. Varillal forests are distinguished by nutrient-poor sandy soils, high densities of straight, uniform trees with few major branches, and relatively low plant diversity [30,35,36,37]. Dominant plants include the canopy trees Caraipa tereticaulis and Caraipa utilis and the subcanopy tree Pachira brevipes [36]. Varillal forests are important contributors to Amazonian biodiversity as they shelter a high number of endemic bird species [31], such as the Allpahuayo Antbird (Percnostola arenarum; IUCN Vulnerable), White-masked Antbird (Pithys castaneus; IUCN Near Threatened), Iquitos Gnatcatcher (Polioptila clementsi), and Mishana Tyrannulet (Zimmerius villarejoi). Other habitat types within RNAM include forests supported by the more common nutrient-rich clay soils (known locally as arcilla) of western Amazonia and seasonally flooded forests along the banks of the Nanay River.
Beginning in the 1980s, human activities started to encroach on the study area as part of state-sponsored efforts to encourage human settlement in this region [38]. Specifically, these activities consisted of clearing forested land and establishing sugarcane crop fields in arcilla forests, as well as non-mechanized selective logging of C. utilis trees in varillal forests. No quantifiable logging intensity estimates are available from the selective logging in our study area, as logging was performed in an informal manner, and no records were kept. These efforts were then halted after the discovery of new bird species that resulted in the designation of RNAM in 2004. To examine the extent to which bird communities and forest structure remain affected by human impacts, we selected 12 sampling areas (hereafter sites) in the southeast portion of RNAM (Figure 1): three sites that had been selectively logged between 1996 and 2000 (hereafter low-disturbance sites); three sites that were cleared in the mid-1980s and used as sugarcane crop fields until the establishment of the reserve (hereafter high-disturbance sites), at which time they were replanted with a variety of native fruit trees; and six undisturbed primary forest sites. Low- and high-disturbance sites were selected based on current and former RNAM employees’ knowledge of where the disturbances had occurred. Three selectively logged sites were located in the area, as were four former crop fields. However, one of the former crop fields was in close proximity to a major road (<100 m); thus, it was not included in this study. Undisturbed sites were established in primary forest habitats that were accessible to researchers and allowed for the creation of net lanes with minimal disturbance to vegetation while also being an appropriate distance away from other sites. All sites were at least 400 m apart (range to nearest neighbor = 404–845 m, mean = 555 m) and at least 250 m from roads (range = 250–1823 m, mean = 827 m). Our study design was constrained by the layout of the study area, which resulted in our low-disturbance sites being spatially clustered, and a correlation between disturbance history and soil type: all low-disturbance sites occurred in varillal forests, and all high-disturbance sites occurred in arcilla forests. We investigated six undisturbed forest sites, including three in varillal and three in arcilla.

2.2. Bird Sampling

Fieldwork for this study took place from 11 March to 24 May 2023. This timeframe corresponds with the local rainy season, which is the breeding period for most tropical birds in the area. At each site, we established a network of 10 mist nets (2.6 m × 12 m, 36 mm mesh size) to sample the understory bird community. Nets were generally set up in an L formation, with two straight lines of five nets established at a 90° angle, though the exact formation depended on the presence and avoidance of natural obstacles such as slopes, streams, and large trees at each site. The size of each net array was approximately 70 m × 70 m. Mist nets were opened at dawn and operated for approximately 8 h each day, except during periods of inclement weather such as rain or strong wind, and were checked for birds every 15–20 min. No speakers or callback devices were used to attract birds to nets. All captured birds were identified as species using the field guide Birds of Peru [39] and then released at the location of their capture. To distinguish new captures from recaptures, we snipped approximately 1 cm from the farthest right tail feather of each newly captured bird. We did not band birds because the vast majority of the region’s birds are nonmigratory, and all sampling at a given site occurred within 2–3 consecutive days. We operated nets for 2–3 consecutive days at each site until completing 160 net hours (where 1 net hour is the equivalent of 1 mist net being open for 1 h). Sites of different forest types were sampled on a rotating basis in an effort to reduce temporal pseudoreplication by minimizing successive sampling of sites with the same disturbance history. However, back-to-back sampling of sites with the same disturbance history did occasionally occur due to logistic constraints. To verify that sampling date was independent of disturbance history in our dataset, we used an ANOVA to test for a significant relationship (p < 0.1) between sampling date and disturbance history. All mist netting and fieldwork activities were approved by the Servicio Nacional de Áreas Naturales Protegidas por el Estado (SERNANP) of Peru and carried out under SERNANP Permit # 003-2023-SERNANP-JEF.

2.3. Vegetation Sampling

We characterized the vegetation structure of each site by quantifying the following seven vegetation variables: tree density, average tree diameter, liana density, average liana diameter, canopy cover, understory vegetation density, and ground cover vegetation density. To this end, we performed vegetation surveys in three 10 m × 10 m plots at each site. Each plot contained five discreet sampling points: one in each of the four corners and one in the middle of the plot. We established the first plot one m to the right (from the perspective of a researcher facing down the net formation) of the beginning of the first net lane, the second plot one m to the left of the beginning of the sixth net lane, and the third plot one m to the right of the end of the tenth net lane. Within each 10 m × 10 m plot, we counted and measured dbh (cm) of each tree > 10 cm and each liana > 2.5 cm. At each of the five sampling points within a plot, we estimated the percent cover of understory vegetation (within 0.5 and 3 m height), ground cover vegetation (>0.5 m), and bare ground within a 1 m × 1 m frame. At the center sampling point of each plot, we estimated percent canopy cover using a spherical densitometer (Forestry Suppliers, convex model A). Measurements of each variable were averaged within a site to estimate site-scale vegetation structure.

2.4. Statistical Analyses

All analyses were performed in R version 4.2.1 [40]. Because bird community composition may exhibit spatial autocorrelation (e.g., [41]), and the low-disturbance sites at RNAM were spatially clustered (Figure 1), we used a Moran’s I test with observed species richness and bird abundance as response variables to examine whether our bird community data were spatially autocorrelated. Moran’s I generates a p value used to accept or reject the null hypothesis that the response variable is randomly distributed across the study area. Here, and throughout this study, we considered p < 0.1 to be statistically significant. The Moran’s I test was run using the Moran. I function in the ape package version 5.0 [42] based on an inverse distance matrix of sampling site locations.
As two distinct soil types were present among our sites, which may influence faunal communities in Amazonian forests [35,37], we tested whether the understory bird communities of undisturbed varillal sites (N = 3) and undisturbed arcilla sites (N = 3) were significantly different by performing a permutational multivariate analysis of variance (PERMANOVA) with 9999 permutations. The PERMANOVA was based on a dissimilarity matrix calculated using the Bray–Curtis dissimilarity measurement, as our data included a relative abundance of species. We square root-transformed bird abundance counts prior to calculating the dissimilarity matrices to reduce the influence of overabundant bird groups and increase the contributions of rare groups. Prior to analysis, we tested for homogeneity of dispersion of the dissimilarity matrices, an important PERMANOVA assumption [43]. We also examined differences in species richness between undisturbed varillal and arcilla sites using both the Chao1 and 1st-order jackknife estimators and estimated compositional similarity between the two communities using the Morisita–Horn index [44] based on relative abundance. We calculated species richness and community similarity in the R package SpadeR version 0.1.1 [45].
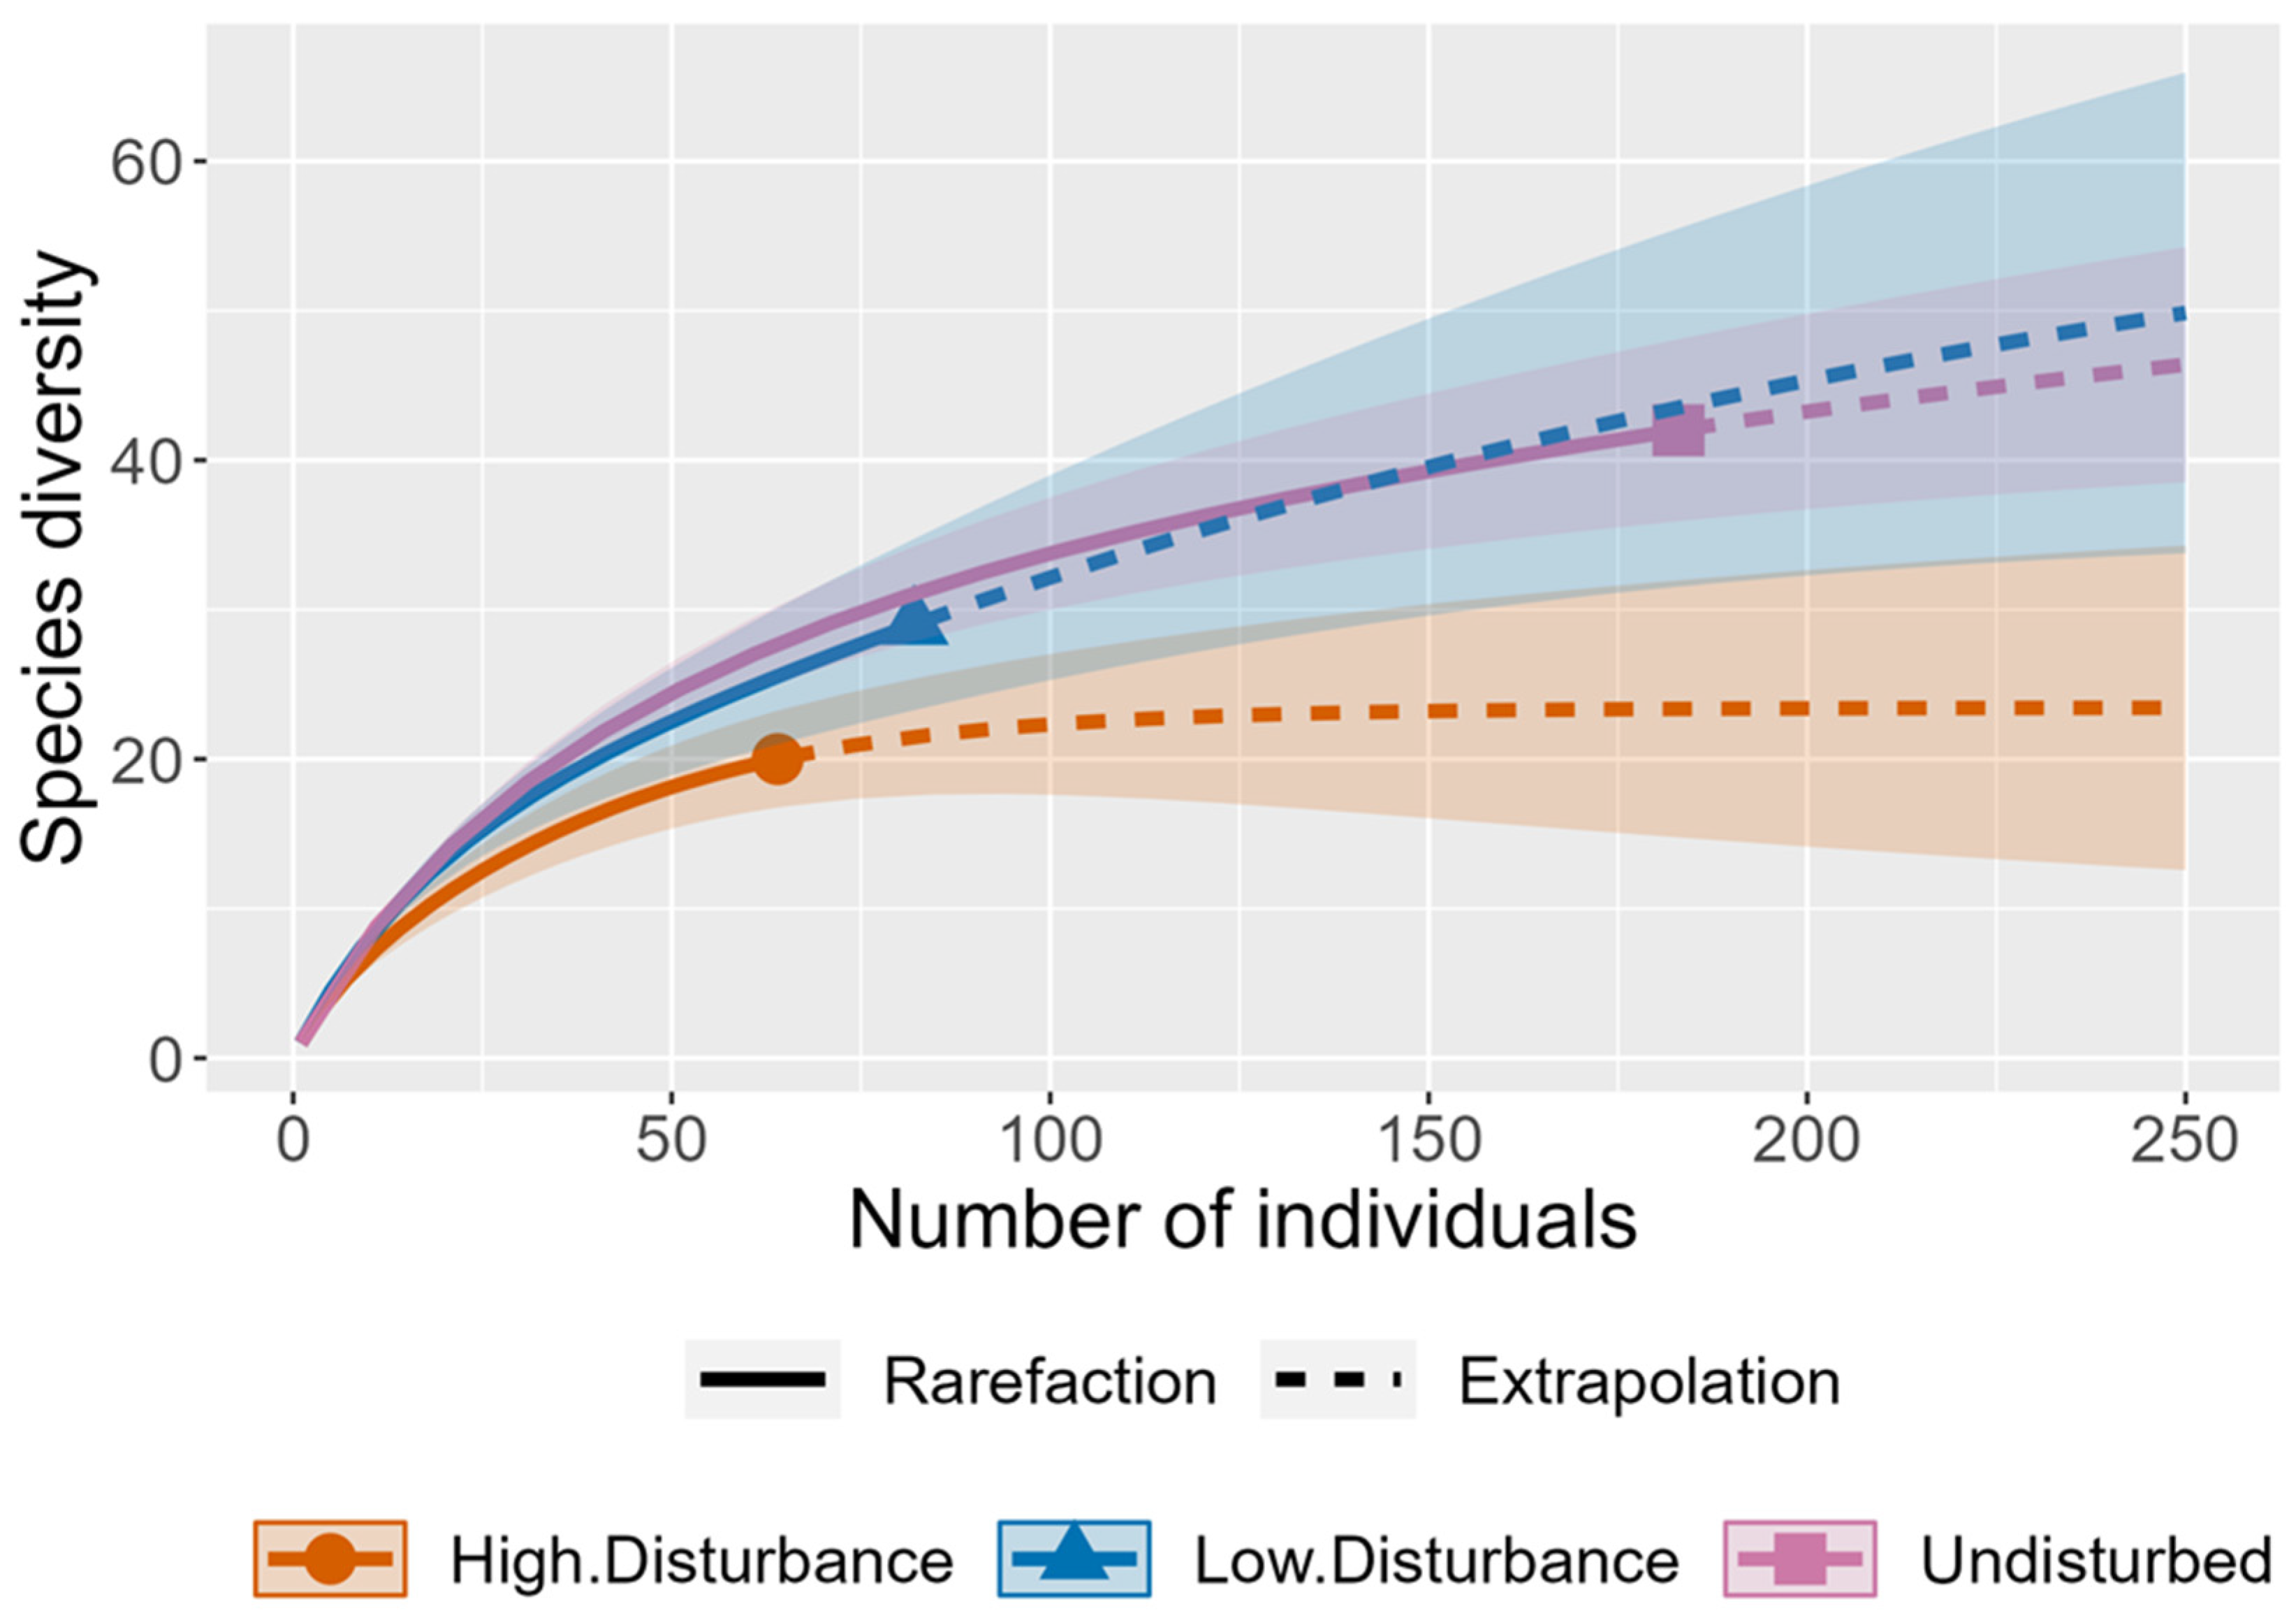
We estimated differences in bird species richness between forest types (low-disturbance, high-disturbance, or undisturbed forests) by combining bird capture data among sites within each forest type and constructing species accumulation curves (SACs) using the iNEXT package version 3.0.0 [46]. SACs in iNEXT use rarefaction and extrapolation of observed capture data to predict the growth of species richness as sample size increases. We chose this method instead of the species richness estimators in SpadeR because SACs are more appropriate for unbalanced study designs, as the rarefaction and extrapolation process effectively standardizes sample size across treatments.
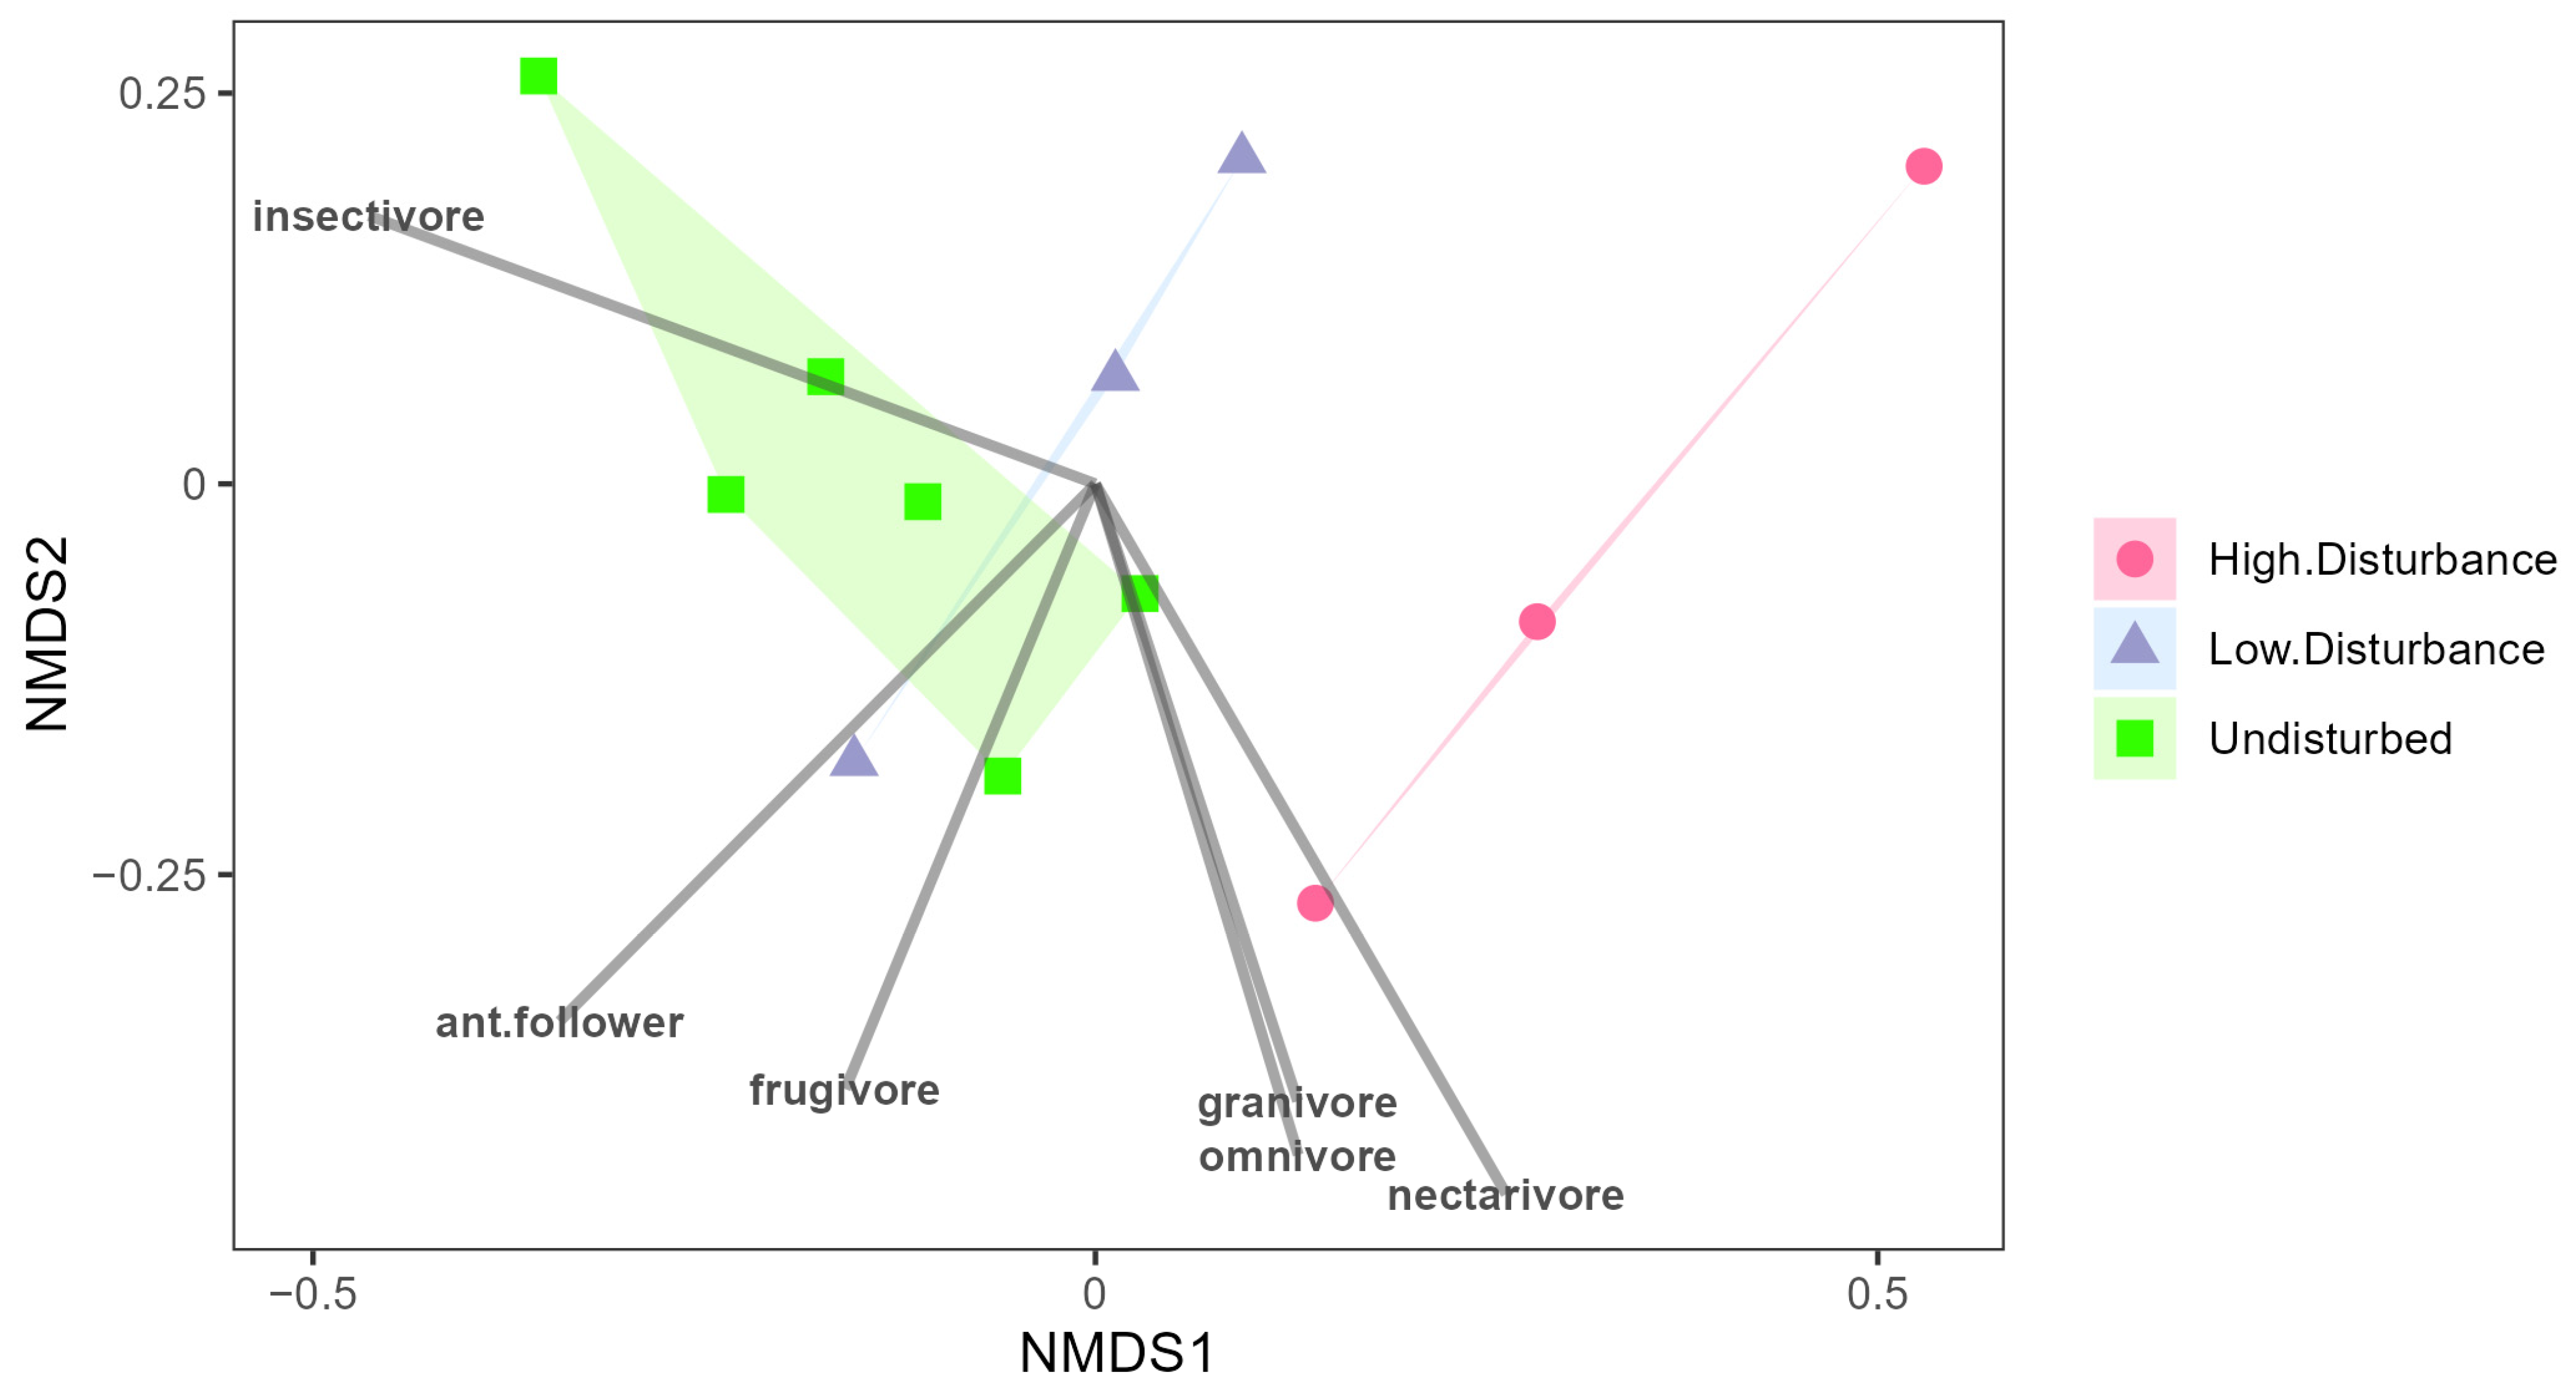
To test whether disturbance intensity significantly explains variation in understory forest bird communities, we performed two PERMANOVAs, grouping bird data first by species and then by dietary guild. The guild of each bird species was determined based on life history information from Birds of the World [47]. We ran each PERMANOVA with 9999 permutations, using a dissimilarity matrix based on the Bray–Curtis dissimilarity measurement. As with the previous PERMANOVA, we square root-transformed bird abundance counts prior to calculating the dissimilarity matrices, and we tested for homogeneity of dispersion of the dissimilarity matrices prior to running the PERMANOVAs. We visualized the differences in bird community composition across sites using non-metric multidimensional scaling (NMDS) based on the Bray–Curtis dissimilarity matrix. The NMDS was run with the metaMDS function in the vegan package version 2.5-6 [48].
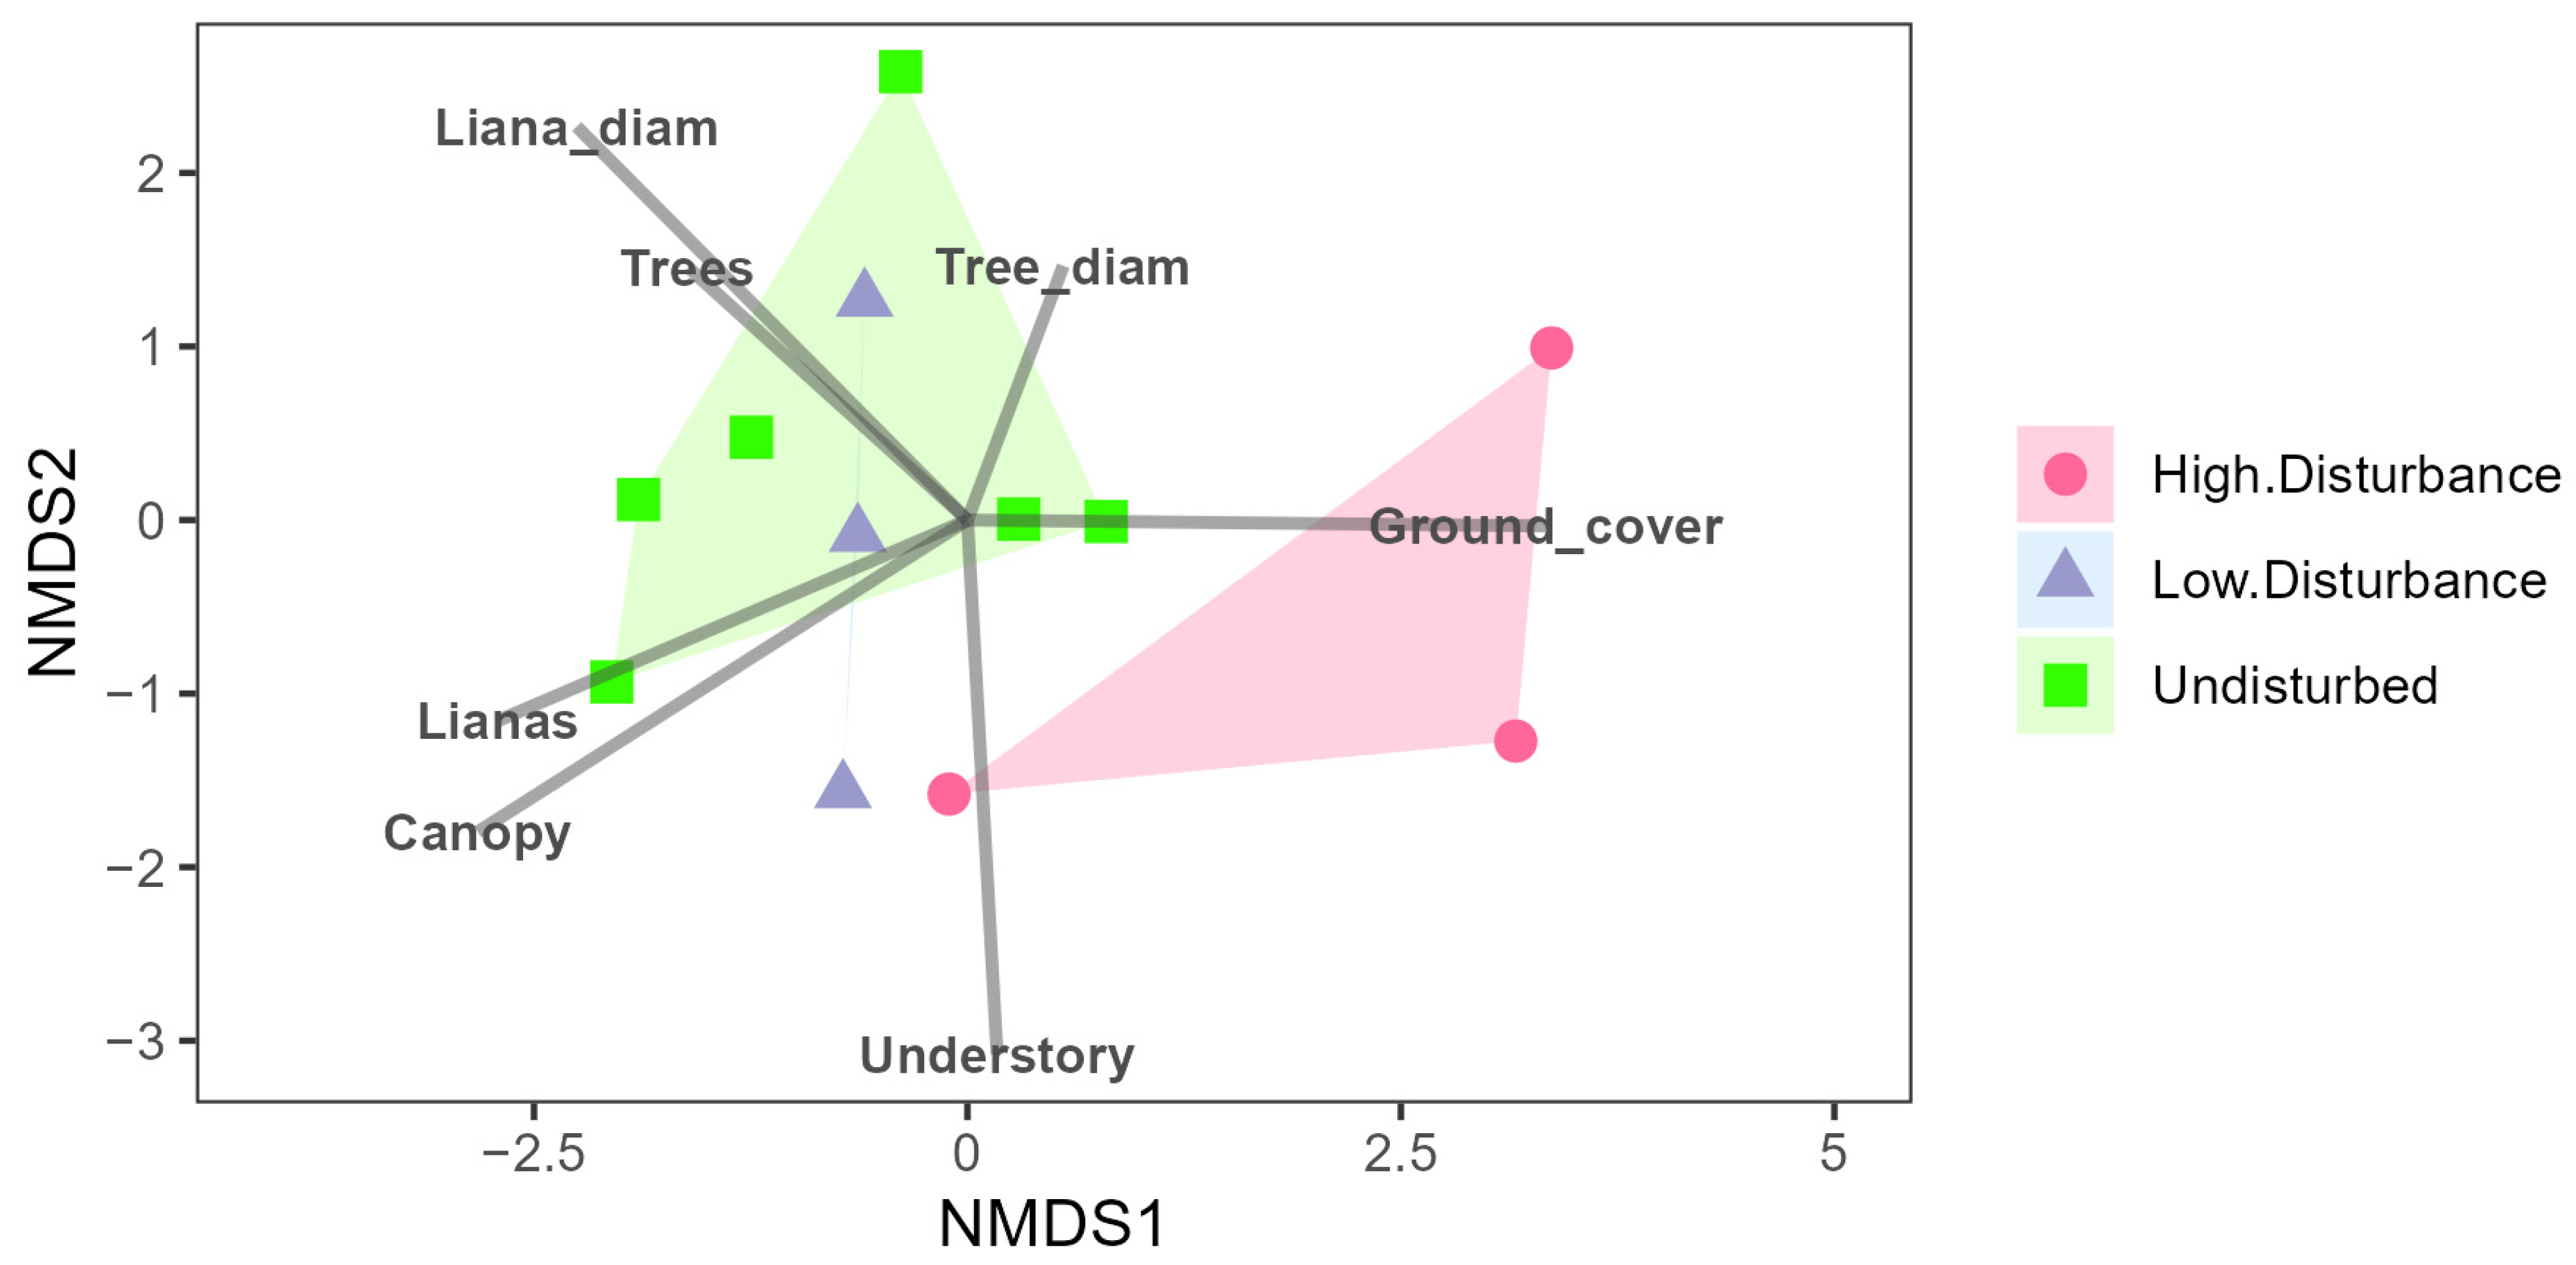
Additionally, we used a PERMANOVA with 9999 permutations to estimate whether sites with different disturbance intensities displayed differences in vegetation structure and visualized results using NMDS. For vegetation data, we calculated the dissimilarity matrix using Euclidean distances after scaling and centering the data so each variable had a mean of 0 and standard deviation of 1.
We used structural equation models (SEMs) constructed using the piecewiseSEM package version 2.3.0 [46] to determine whether the impacts of disturbance intensity on bird guild abundance were mediated through changes in vegetation structure. SEMs are a form of path analysis that combines multiple predictor and response variables into a single causal network, allowing researchers to create models representing hypothetical direct and indirect relationships in a natural system [49,50]. Relationships between variables are represented by linear models, known as paths, nested within the larger SEM. We limited this analysis to guilds with >50 individual captures, which included the following guilds: ant-followers (N = 85), non-ant-following insectivores (N = 108), and nectarivores (N = 62). We created three SEMs, with observed abundance of one of the three aforementioned guilds as the response variable. For each SEM, we began with a global model that contained all predicted relationships (Figure A1): a direct effect of disturbance intensity on all vegetation variables and bird guild abundance and a direct effect of each vegetation variable on bird guild abundance. We also included sampling date as a fixed effect in each global model to account for any seasonal effects on our capture data. Each path was fit to a Gaussian distribution after determining that abundance data of each guild met the assumptions of normality using a Shapiro–Wilk test and homogeneity of variance using Levene’s test. We removed nonsignificant paths in a stepwise fashion, beginning with the least significant path, until all remaining paths were significant (p > 0.1). We then compared nested models using AIC to arrive at the most highly supported model for each response variable. Throughout this process, we limited candidate models to those that described a direct effect of disturbance intensity on guild abundance and/or an indirect effect of disturbance intensity on guild abundance mediated through vegetation structure. We assessed model fit using a Chi-square GOF test, with p > 0.1 indicating good model fit.

3. Results

We operated mist nets for a total of 1920 net hours, during which we captured 329 individuals of 55 species (Table A1). Six guilds were represented in our dataset, including ant-followers (N = 85), other insectivores (N = 108, hereafter insectivores), nectarivores (N = 62), omnivores (N = 37), frugivores (N = 33), and granivores (N = 3). We captured one carnivore, a Slaty-backed Forest Falcon (Micrastur mirandollei). We retained this species when calculating species accumulation curves but removed it from the dataset for the PERMANOVA and NMDS analyses, as we considered it an outlier from a guild composition perspective. The Moran’s I test detected no evidence of spatial autocorrelation for observed species richness (p = 0.67) or bird abundance (p = 0.91). Sampling date and disturbance intensity were not significantly related based on ANOVA results (F2,9 = 1.10, p = 0.37). Table S1 shows the mean and SD of foraging guild abundance for each disturbance intensity.
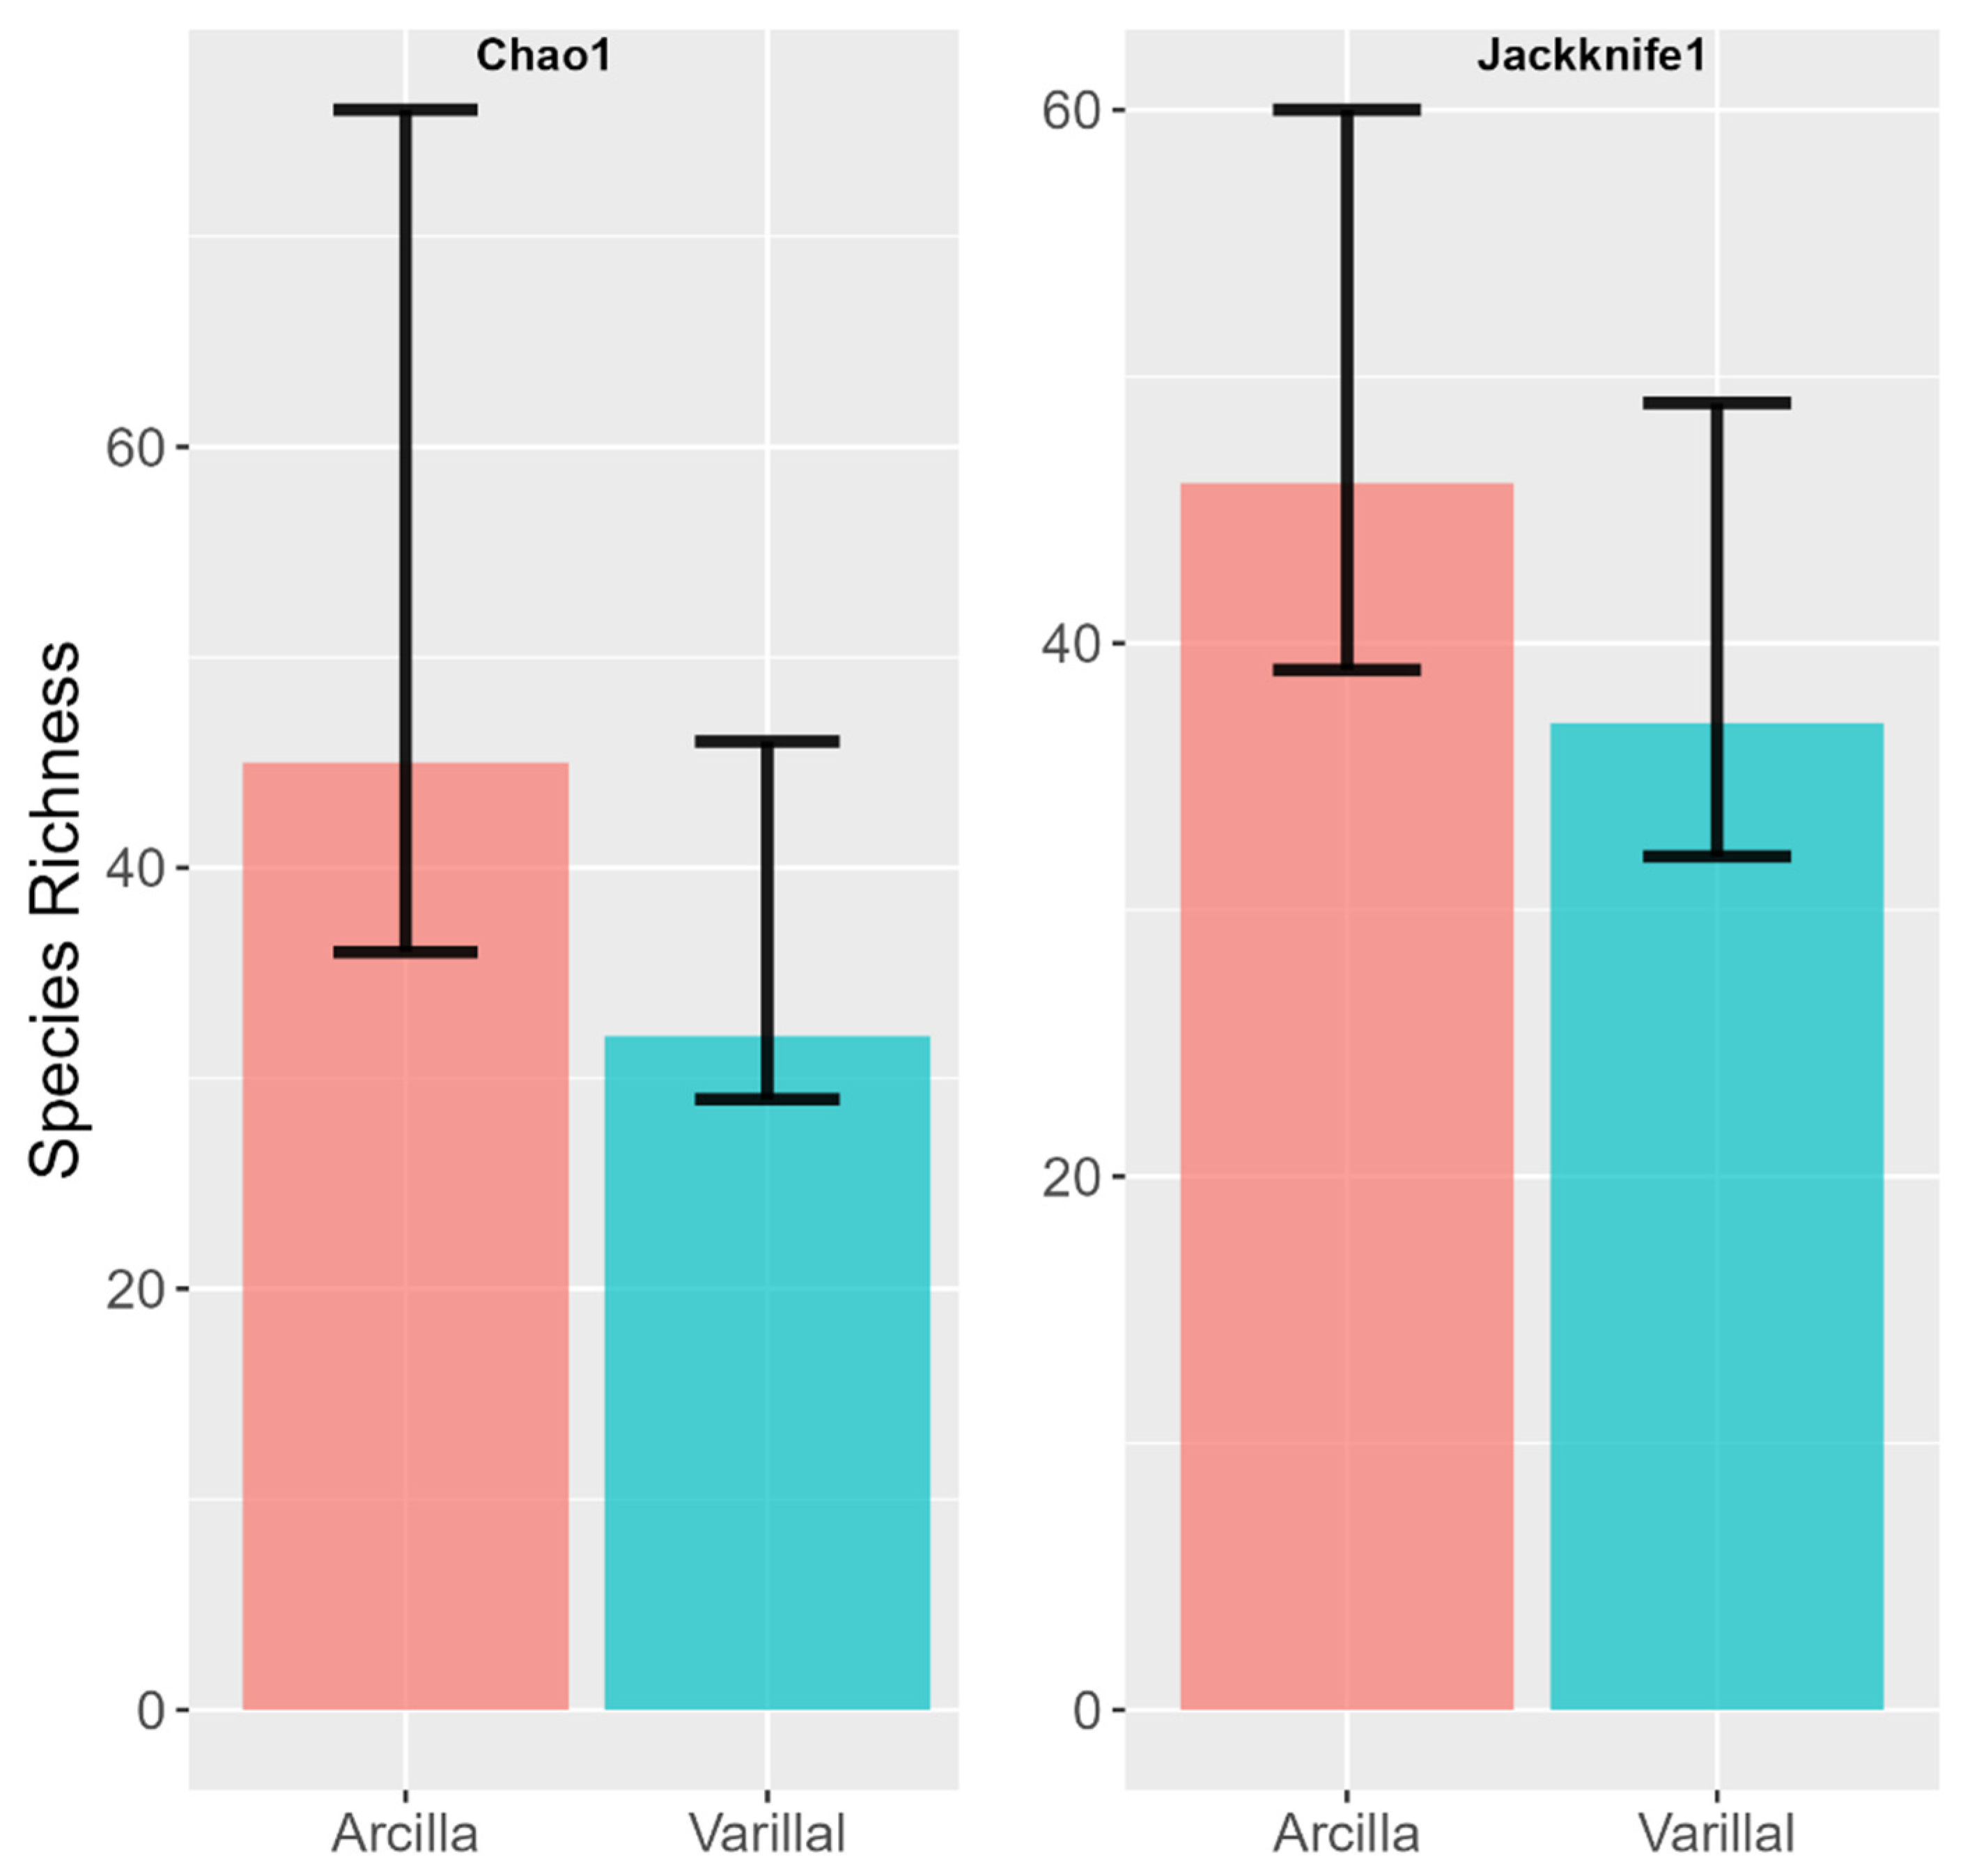
Our PERMANOVA results for undisturbed arcilla and varillal sites determined that bird species composition did not differ significantly between the two soil types (F1,4 = 1.14, p = 0.5). Species richness estimates were higher for arcilla sites, but 95% confidence intervals for both the Chao1 and jackknife estimators overlapped substantially between arcilla and varillal (Figure A2), which we interpret to suggest that species richness between the two soil types was not significantly different. The Morisita–Horn index indicated a high degree of similarity (0.86, 95% LCI = 0.65, UCI = 1.0) between bird communities in undisturbed arcilla and varillal forests. We, therefore, combined undisturbed arcilla and undisturbed varillal sites into one undisturbed forest group for the remaining analyses.
Species accumulation curves calculated for the three disturbance intensities indicated that low-disturbance and undisturbed forest sites had similar species richness, though the species richness of high-disturbance sites was significantly lower (Figure 2). The PERMANOVA analyses confirmed that bird communities differed significantly between disturbance intensities, both when examining bird communities at the species level (F2,9 = 2.42, p < 0.01, R2 = 0.35) and at the guild level (F2,9 = 2.59, p = 0.025, R2 = 0.37). Both PERMANOVAs met the assumption of homogeneity of dispersion (species: F2,9 = 0.19, p = 0.84; guild: F2,9 = 0.15, p = 0.86). The NMDS revealed that differences in community composition among groups were primarily driven by the high-disturbance sites, which contained relatively more nectarivores and fewer insectivores and ant-followers than low-disturbance or undisturbed forest sites (Figure 3).
Vegetation structure also differed significantly among disturbance intensities, according to the PERMANOVA analysis of our vegetation data (F2,9 = 1.88, p = 0.048, R2 = 0.29). The assumption of homogeneity of dispersion was met for this analysis (F2,9 = 0.61, p = 0.58). The NMDS suggested that, as with bird community composition, differences in vegetation structure between forest types were driven by the high-disturbance sites, whereas low-disturbance and undisturbed sites were similar (Figure 4). High-disturbance sites generally contained denser ground cover vegetation, fewer lianas and trees, and less canopy cover than low-disturbance and undisturbed sites. Table S2 displays the means and standard deviations of each vegetation variable across different forest types.
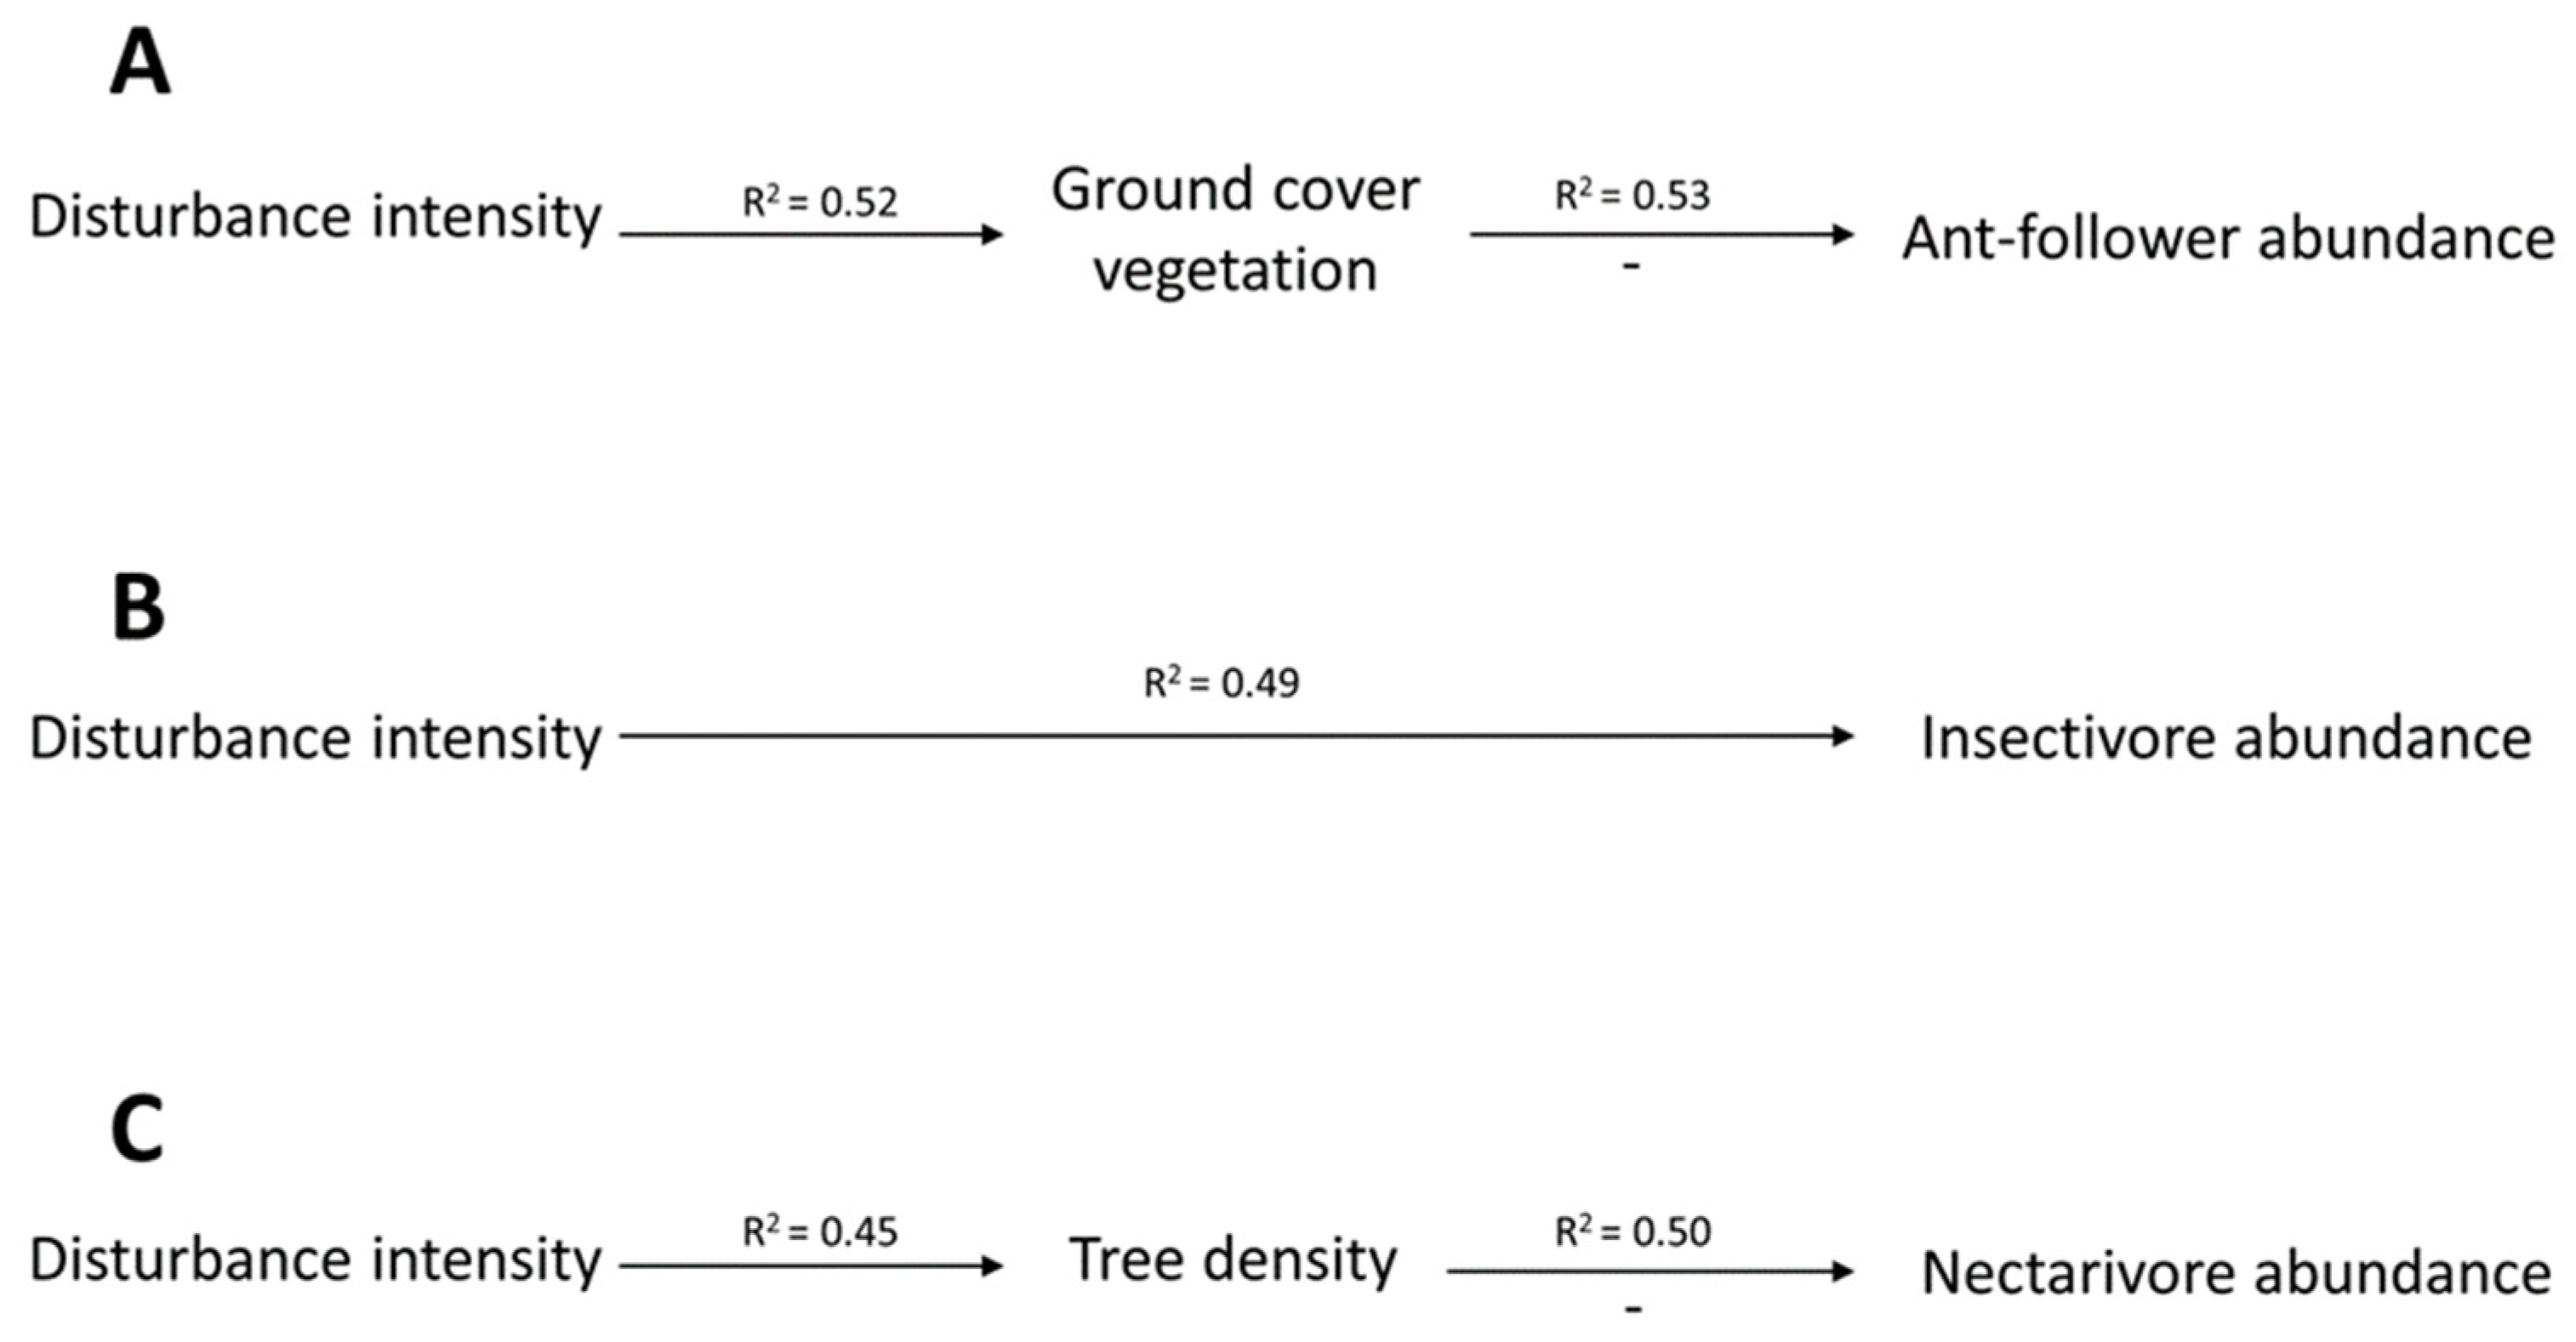
We used structural equation models to examine whether the impacts of disturbance intensity on bird community composition (represented by guild abundance) were mediated through changes in vegetation structure. The ant-follower model described the effects of disturbance intensity on ant-followers as fully mediated by changes in ground cover vegetation (Figure 5A), which was negatively related to ant-follower abundance (β = −0.73). The insectivore model suggested that the effects of disturbance intensity on insectivores were not mediated through any vegetation structure variable that we considered (Figure 5B), and the nectarivore model indicated that the effects of disturbance intensity on nectarivores were fully mediated through changes in tree density (Figure 5C). Tree density was negatively related to nectarivore abundance (β = −0.71). All three final SEMs displayed appropriate goodness-of-fit (p > 0.1 for all models).

4. Discussion

Tropical forests are heavily impacted by a variety of anthropogenic disturbances [5,6,8], and previous studies have shown that even relatively mild disturbances, such as selective logging, can have long-lasting negative impacts on biodiversity and forest structure [10,12,14,51]. Our results suggest that after 20 to 26 years, selectively logged forest sites had recovered sufficiently to display similar bird communities and vegetation structures as nearby undisturbed primary forest sites. This is an especially encouraging finding given that the low-disturbance sites all occurred in varillal forests, which are generally slow to recover from disturbance due to the slow growth rate of vegetation caused by nutrient-poor soil [37]. The recovery of these sites within this timeframe was likely enabled by several factors: the relatively low impact of selective logging compared to activities such as deforestation [1,8,12,17], the protection of these sites from post-logging human impacts, and their locations within a primary forest landscape [10]. Because these selectively logged sites were located within a matrix of mostly undisturbed primary forest, interior-adapted birds could more quickly recolonize post-disturbance than if the logged sites had been more isolated or in a fragmented forest matrix [9,19,28,52].
In contrast, regenerating secondary forest (high disturbance) sites supported fewer bird species and exhibited distinct avian communities and forest structure compared to the low-disturbance and undisturbed sites after a 19-year regeneration period. This result is consistent with other studies that have shown that the biodiversity recovery of high-disturbance secondary forests lags behind that of selectively logged forests [1,9,17,19]. Because forest recovery may be heavily impacted by the level of forest connectivity in the surrounding landscape [9,28] and the amount of ongoing human disturbance [10,53], our results may represent a realistic “best-case” scenario, as the high-disturbance forest patches are relatively small (1–5 ha), surrounded by primary forest, and generally protected from illegal logging or hunting activities by the presence of park staff. Although some studies have suggested that recovery periods of 20–40 years may be sufficient for secondary forests to biodiversity levels comparable with primary forests in optimal conditions [11,16], our results contrast with the low end of this estimate. Instead, they are consistent with reviews of secondary forests in a variety of conditions and landscape contexts that found species richness and composition lagged behind pre-disturbance levels even after a 40-year recovery period [9,13], suggesting that full recovery may take much longer. Relatedly, a meta-analysis [54] provided evidence that species composition for a variety of vertebrate guilds recovers slowly in regenerating forests compared to species richness, primarily due to the slow rate (>40 years) at which many forest-interior specialists, including insectivorous birds, recolonize these habitats. Birds with limited dispersal abilities may also be much slower to recolonize habitats after a disturbance than long-distance dispersers [55].
As expected, bird foraging guilds were differentially affected by forest disturbance. Insectivores were the most negatively impacted, followed by ant-followers and frugivores, as these guilds were associated with low-disturbance and undisturbed forest sites (Figure 1). Nectarivores, meanwhile, were more frequently associated with high-disturbance sites. These patterns are consistent with previous studies [8,12,13,14,54], which indicate that insectivorous and frugivorous bird species are generally more sensitive to logging as they tend to be forest interior specialists, whereas nectarivores frequently associate with disturbed open-canopy habitats where flowering plants are more abundant. Frugivorous birds are important seed dispersers [56], and insectivores play a crucial role in limiting forest herbivory via the consumption of herbivorous arthropods [57]. Thus, the loss of insectivorous and frugivorous bird species in secondary forests can contribute to ongoing impacts on ecosystem structure [8], further slowing the disturbance recovery process and reducing the functional value of the forest.
The results of our SEMs suggest that changes in vegetation structure are responsible for some, but not all, of the impacts of disturbance intensity on bird communities. Vegetation structure is known to be an important predictor of bird species occupancy [18,19,21], although human disturbances can affect birds in other ways, such as changing food supplies and trophic interactions that scale up to impact avian community composition [32,58]. Our models suggest that the negative impact of disturbance on ant-followers was primarily due to the increase in ground cover vegetation in high-disturbance sites, which were likely aided by canopy gaps allowing more light to reach the forest floor. The dense ground cover vegetation may have inhibited ant-followers by limiting the presence of army ant colonies, making colonies harder to find and follow, or obstructing ant-followers’ movements across the forest floor. The positive association of nectarivores with high-disturbance sites was attributed to a decrease in tree density, which may have allowed more room for flowering plants [13,14]. For insectivores, the most abundant guild in our dataset, we found no evidence of the effects of disturbance intensity being mediated through changes in vegetation structure. This suggests that other factors, such as changing food resources [32,59], were primarily responsible for the negative impact of disturbance intensity on insectivores.
Our use of mist net sampling for this study introduces the possibility of bias via net avoidance behavior by certain individuals and species abundance [60], which may have impacted our estimates of species diversity and relative foraging guild. Additionally, using mist nets excludes overstory and canopy-dwelling birds to a large degree [61]. These factors, compounded by the small timeframe of our study, result in a dataset of limited scope. Although mist-netting has an important advantage over other survey methods in reducing the risk of misidentifying birds, other survey methods may document a larger proportion of the forest bird community. For example, data from [62] suggest that mist-netting methods documented 37.5% of bird species in a tropical montane cloud forest, while point counts documented 59.3% of species. To gather a dataset more representative of the entire forest bird community, future studies should consider supplementing mist netting efforts with point counts [62,63] and passive acoustic monitoring surveys [64].
As the amount of disturbed forest in tropical forest landscapes continues to grow, it becomes increasingly important to understand the potential conservation costs and benefits of these forests and how they can best be managed to maximize biodiversity and conservation value. Our results suggest that maintaining high tree density and a low proportion of ground cover vegetation are important for conserving forest-dependent bird communities, so these structural traits should be encouraged in regenerating forests to provide habitat for vulnerable forest bird species. Results from this study also indicate that selectively logged sites can recover pre-disturbance bird communities and forest structure after approximately two decades, even in nutrient-poor soils, provided that they are situated in a favorable forest matrix with high connectivity to source populations and protection from further anthropogenic disturbance. However, high-disturbance sites may take much longer to fully recover. While the high-disturbance forests in this study had lower biodiversity and distinct bird communities compared to low-disturbance and undisturbed sites, they still contained several well-known forest-associated species including antbirds (Black-faced Antibird [Myrmoborus myotherinus], Spot-winged Antbird [Myrmelastes leucostigma]) and manakins (Blue-capped Manakin [Lepidothrix coronate], White-bearded Manakin [Manacus manacus]). Despite their reduced species richness compared to primary forests, regenerating secondary forests such as the high-disturbance sites in this study remain an improvement over other land use types such as agriculture or tree plantations [1,19,65], as they can improve large-scale forest connectivity and provide important habitat for forest-associated species with broad ecological niches.

Supplementary Materials

The following supporting information can be downloaded at: https://www.mdpi.com/article/10.3390/birds5030026/s1, Table S1: Mean and SD of observed individual abundance for each foraging guild across different forest types (undisturbed, low disturbance, and high disturbance) after an approximately 20-year recovery period. An asterisk by a foraging guild signifies that differences in abundance across forest types were statistically significant (p < 0.1) according to a Kruskal-Wallis nonparametric test. The Dunn’s Test column displays results from a post hoc Dunn’s Test with a Bonferroni correction to determine which forest types displayed significant differences in guild abundance for a given foraging guild; Table S2: Mean and SD of vegetation structure variables across different forest types (undisturbed, low disturbance, and high disturbance) after an approximately 20-year recovery period. An asterisk by a variable signifies that measurements for this variable were statistically significant (p < 0.1) across different forest types according to a Kruskal-Wallis nonparametric test. The Dunn’s Test column displays results from a post hoc Dunn’s Test with a Bonferroni correction to determine which forest types displayed significant differences for a given variable.

Author Contributions

Conceptualization, A.G. and N.A.; methodology, A.G. and N.A.; fieldwork, A.G. and N.A.; formal analysis, A.G.; writing—original draft preparation, A.G.; writing—review and editing, N.A. All authors have read and agreed to the published version of the manuscript.

Funding

Funding for this research was fully provided by the International Bird Conservation Partnership, via private donors.

Institutional Review Board Statement

This study was conducted according to the guidelines of the Declaration of Helsinki and approved by the Institutional Review Board of Servicio Nacional de Áreas Naturales Protegidas por el Estado (SERNANP) of Peru, Permit # 003-2023-SERNANP-JEF, approval date 2 February 2023.

Data Availability Statement

The data and code from this study are available on Dryad, doi: 10.5061/dryad.z612jm6mh.

Acknowledgments

Our sincerest thanks to Karen Rios Torres, Katterine Garly Aliaga Pashanaste, Julio Yaicate Arirama, Scarlet Medina Ahuite, and Josue Manuel Lopez Sisley for their tireless work in helping establish the study sites and collect field data. We would also like to thank Fredy Árevalo Dávila, Fernando Angulo, and Maria Torres Vasquez for their assistance with field logistics and permitting. Finally, we thank the supporters of the International Bird Conservation Partnership for making this research possible.

Conflicts of Interest

The authors declare no conflicts of interest.

Appendix A

Figure A1. Hypothetical direct and indirect effects of disturbance intensity on bird guild abundance. Arrows represent direct relationships between variables. Indirect relationships are represented by disturbance intensity directly affecting one or more vegetation structure variables, which in turn directly affect bird guild abundance.
Birds 05 00026 g0a1

Appendix B

Table A1. List of birds captured in mist nets across 12 forest sites in Allpahuayo-Mishana National Reserve, Peru. Fieldwork occurred from 11 March to 24 May 2023. Guilds were assigned for each species based on life history information from Birds of the World [47]. All birds captured during this study are listed as being of least concern, according to the IUCN.
SpeciesScientific NameGuildCount
Amazonian GrosbeakCyanoloxia rothschildiiGranivore3
American Pygmy KingfisherChloroceryle aeneaOmnivore2
Ash-throated GnateaterConopophaga peruvianaInsectivore1
Black and White Tody-flycatcherPoecilotriccus capitalisInsectivore1
Black-faced AntbirdMyrmoborus myotherinusInsectivore17
Blue-capped ManakinLepidothrix coronataFrugivore19
Chestnut WoodpeckerCeleus elegansOmnivore1
Cinereous AntshrikeThamnomanes caesiusInsectivore4
Collared PuffbirdBucco capensisOmnivore2
Common Scale-backed AntbirdWillisornis poecilinotusInsectivore11
Double-banded Pygmy-tyrantLophotriccus vitiosusInsectivore2
Dusky-throated AntshrikeThamnomanes ardesiacusInsectivore5
Elegant WoodcreeperXiphorhynchus elegansInsectivore4
Fork-tailed WoodnymphThalurania furcataNectarivore1
Golden-headed ManakinCeratopipra erythrocephalaFrugivore3
Gould’s JewelfrontHeliodoxa aurescensNectarivore1
Gray AntwrenMyrmotherula menetriesiiInsectivore1
Great-billed HermitPhaethornis malarisNectarivore38
Ivory-billed AracariPteroglossus azaraFrugivore1
Lunulated AntbirdOneillornis lunulatusInsectivore1
Ocellated WoodcreeperXiphorhynchus ocellatusInsectivore3
Ochre-bellied FlycatcherMionectes oleagineusOmnivore13
Orange-bellied EuphoniaEuphonia xanthogasterFrugivore1
Pale-tailed BarbthroatThrenetes leucurusNectarivore1
Pearly AntshrikeMegastictus margaritatusInsectivore10
Peruvian Warbling-antbirdHypocnemis peruvianaInsectivore2
Plain XenopsXenops minutusInsectivore8
Plain-brown WoodcreeperDendrocincla fuliginosaInsectivore6
Plain-throated AntwrenIsleria hauxwelliInsectivore14
Purple HoneycreeperCyanerpes caeruleusOmnivore1
Royal FlycatcherOnychorhynchus coronatusInsectivore2
Ruddy Foliage-gleanerClibanornis rubiginosusOmnivore1
Ruddy Quail-doveGeotrygon montanaOmnivore3
Ruddy SpinetailSynallaxis rutilansInsectivore4
Ruddy-tailed FlycatcherTerenotriccus erythrurusInsectivore5
Rufous-backed StipplethroatEpinecrophylla haematonotaInsectivore5
Rufous-breasted HermitGlaucis hirsutusNectarivore4
Scaly-breasted WrenMicrocerculus marginatusInsectivore3
Slate-colored GrosbeakSaltator grossusOmnivore1
Slaty-backed Forest-falconMicrastur mirandolleiCarnivore1
Slender-footed TyrannuletZimmerius gracilipesInsectivore1
Sooty AntbirdHafferia fortisInsectivore1
Spot-winged AntbirdMyrmelastes leucostigmaInsectivore3
Straight-billed HermitPhaethornis bourcieriNectarivore13
Swainson’s ThrushCatharus ustulatusOmnivore1
Undulated AntshrikeFrederickena unduligerInsectivore1
Wedge-billed WoodcreeperGlyphorynchus spirurusInsectivore49
White-bearded HermitPhaethornis hispidusNectarivore4
White-bearded ManakinManacus manacusOmnivore11
White-cheeked AntbirdGymnopithys leucaspisInsectivore12
White-crowned ManakinPseudopipra pipraFrugivore9
White-flanked AntwrenMyrmotherula axillarisInsectivore6
White-necked ThrushTurdus albicollisOmnivore1
White-plumed AntbirdPithys albifronsInsectivore9
Yellow-margined FlycatcherTolmomyias assimilisInsectivore2

Appendix C

Figure A2. Understory bird species richness estimates and 95% confidence intervals between arcilla (clay soil, N = 3) and varillal (white sand, N = 3) undisturbed primary forest sites according to the Chao1 and first-order jackknife estimators. Species richness estimates are based on mist net data that were collected at Allpahuayo-Mishana National Reserve, Peru, between 11 March and 24 May 2023.
Birds 05 00026 g0a2

References

  1. Gibson, L.; Lee, T.M.; Pin Koh, L.; Brook, B.W.; Gardner, T.A.; Barlow, J.; Peres, C.A.; Bradshaw, C.J.A.; Laurance, W.F.; Lovejoy, T.E.; et al. Primary forests are irreplaceable for sustaining tropical biodiversity. Nature 2011, 478, 378–381. [Google Scholar] [CrossRef]
  2. Barlow, J.; Franca, F.; Gardner, T.A.; Hicks, C.C.; Lennox, G.D.; Berenguer, E.; Castello, L.; Economo, E.P.; Ferriera, J.; Guenard, B.; et al. The future of hyperdiverse tropical ecosystems. Nature 2018, 559, 517–526. [Google Scholar] [CrossRef]
  3. Gardner, T. Monitoring Forest Biodiversity: Improving Conservation through Ecologically-Responsible Management, 1st ed.; Earthscan: Washington, DC, USA; London, UK, 2010. [Google Scholar] [CrossRef]
  4. Hansen, M.C.; Potapov, P.V.; Moore, R.; Hancher, M.; Turubanova, S.A.; Tyukavina, A.; Thau, D.; Stehman, S.V.; Goetz, S.J.; Loveland, T.R.; et al. High-resolution global maps of 21st-century forest cover change. Science 2013, 342, 850–853. [Google Scholar] [CrossRef]
  5. Barreto, P.; Souza, C., Jr.; Noguerón, R.; Anderson, A.; Salomão, R. Human Pressure on the Brazilian Amazon Forests; World Resources Institute: Washington, DC, USA, 2006. [Google Scholar]
  6. Bax, V.; Francesconi, W.; Quintero, M. Spatial modeling of deforestation processes in the Central Peruvian Amazon. J. Nat. Conserv. 2016, 29, 79–88. [Google Scholar] [CrossRef]
  7. Dent, D.H.; Wright, S.J. The future of tropical species in secondary forests: A quantitative review. Biol. Conserv. 2009, 142, 2833–2843. [Google Scholar] [CrossRef]
  8. Edwards, D.P.; Tobias, J.A.; Sheil, D.; Meijaard, E.; Laurance, W.F. Maintaining ecosystem function and services in logged tropical forests. Trends Ecol. Evol. 2014, 29, 511–520. [Google Scholar] [CrossRef]
  9. Lennox, G.D.; Gardner, T.A.; Thomson, J.R.; Ferreira, J.; Berenguer, E.; Lees, A.C.; Mac Nally, R.; Aragão, L.E.; Ferraz, S.F.; Louzada, J.; et al. Second rate or a second chance? Assessing biomass and biodiversity recovery in regenerating Amazonian forests. Glob. Chang. Biol. 2018, 24, 5680–5694. [Google Scholar] [CrossRef]
  10. Arcilla, N.; Strazds, M. Ten principles for bird-friendly forestry: Conservation approaches in natural forests used for timber production. Birds 2023, 4, 245–261. [Google Scholar] [CrossRef]
  11. Dunn, R.R. Recovery of faunal communities during tropical forest regeneration. Conserv. Biol. 2004, 18, 302–309. [Google Scholar] [CrossRef]
  12. Barlow, J.; Peres, C.A.; Henriques, L.M.P.; Stouffer, P.C.; Wunderle, J.M. The responses of understorey birds to forest fragmentation, logging and wildfires: An Amazonian synthesis. Biol. Conserv. 2006, 128, 182–192. [Google Scholar] [CrossRef]
  13. Burivalova, Z.; Lee, T.M.; Giam, X.; Şekercioğlu, Ç.H.; Wilcove, D.S.; Koh, L.P. Avian responses to selective logging shaped by species traits and logging practices. Proc. R. Soc. B 2015, 282, 20150164. [Google Scholar] [CrossRef]
  14. Tobias, J.A. Hidden impacts of logging. Nature 2015, 523, 163–164. [Google Scholar] [CrossRef]
  15. Chazdon, R.L.; Peres, C.A.; Dent, D.; Sheil, D.; Lugo, A.E.; Lamb, D.; Miller, S.E. The potential for species conservation in tropical secondary forests. Conserv. Biol. 2009, 23, 1406–1417. [Google Scholar] [CrossRef]
  16. Whitworth, A.; Downie, R.; von May, R.; Villacampa, J.; MacLeod, R. How much potential biodiversity and conservation value can a regenerating rainforest provide? A ‘best-case scenario’ approach from the Peruvian Amazon. Trop. Conserv. Sci. 2016, 9, 224–245. [Google Scholar] [CrossRef]
  17. Whitworth, A.; Pillco-Huarcaya, R.; Downie, R.; Villacampa, J.; Braunholtz, L.D.; MacLeod, R. Long lasting impressions: After decades of regeneration rainforest biodiversity remains differentially affected following selective logging and clearance for agriculture. Glob. Ecol. Conserv. 2018, 13, e00375. [Google Scholar] [CrossRef]
  18. Terborgh, J. Habitat selection in Amazonian birds. In Habitat Selection in Birds; Cody, M.L., Ed.; Academic Press Inc.: New York, NY, USA, 1985; pp. 311–338. [Google Scholar]
  19. Barlow, J.; Gardner, T.A.; Araújo, I.S.; Ávila-Pire, T.C.; Bonaldo, A.B.; Costa, J.E.; Espósito, M.C.; Ferreira, L.V.; Hawes, J.; Hernández, M.I.; et al. Quantifying the biodiversity value of tropical primary, secondary, and plantation forest. Proc. Natl. Acad. Sci. USA 2007, 105, 18555–18560. [Google Scholar] [CrossRef]
  20. Castaño-Villa, G.J.; Ramos-Valencia, S.A.; Fontúrbel, F.E. Fine-scale habitat structure complexity determines insectivorous bird diversity in a tropical forest. Acta Oecol. 2014, 61, 19–23. [Google Scholar] [CrossRef]
  21. Atikah, S.N.; Yahya, M.S.; Norhisham, A.R.; Kamarudin, N.; Sanusi, R.; Azhar, B. Effects of vegetation structure on avian biodiversity in a selectively logged hill dipterocarp forest. Glob. Ecol. Conserv. 2021, 28, e01660. [Google Scholar] [CrossRef]
  22. Corlett, R.; Primack, R. Tropical Rain Forests: An Ecological and Biogeographical Comparison, 2nd ed.; Wiley-Blackwell: West Sussex, UK, 2011. [Google Scholar] [CrossRef]
  23. Sodhi, N.S.; Sekercioglu, C.H.; Barlow, J.; Robinson, S.K. Conservation of Tropical Birds, 1st ed.; Wiley-Blackwell: West Sussex, UK, 2011. [Google Scholar]
  24. Venier, L.A.; Pearce, J.L. Boreal forest landbirds in relation to forest composition, structure, and landscape: Implications for forest management. Can. J. For. Res. 2007, 37, 1214–1226. [Google Scholar] [CrossRef]
  25. Jokimäki, J.; Solonen, T. Habitat associations of old forest bird species in managed boreal forests characterized by forest inventory data. Ornis Fenn. 2011, 88, 57–70. [Google Scholar] [CrossRef]
  26. Moura, N.G.; Lees, A.C.; Andretti, C.B.; Davis, B.J.; Solar, R.R.; Aleixo, A.; Barlow, J.; Ferreira, J.; Gardner, T.A. Avian biodiversity in multiple-use landscapes of the Brazilian Amazon. Biol. Conserv. 2013, 167, 339–348. [Google Scholar] [CrossRef]
  27. Tobias, J.A.; Şekercioğlu, Ç.H.; Vargas, F.H. Bird conservation in tropical ecosystems: Challenges and opportunities. Key Top. Conserv. Biol. 2013, 2, 258–276. [Google Scholar] [CrossRef]
  28. Durães, R.; Carrasco, L.; Smith, T.B.; Karubian, J. Effects of forest disturbance and habitat loss on avian communities in a Neotropical biodiversity hotspot. Biol. Conserv. 2013, 166, 203–211. [Google Scholar] [CrossRef]
  29. Álvarez Alonso, J.; Whitney, B.M. New distributional records of birds from white-sand forests of the northern Peruvian Amazon, with Implications for biogeography of northern South America. Ornithol. Appl. 2003, 105, 552–566. [Google Scholar] [CrossRef]
  30. Shany, N.; Díaz Alván, J.; Álvarez Alonso, J. Finding white-sand forest specialists in Allpahuayo-Mishana Reserve, Peru. Neotrop. Bird. 2007, 2, 60–68. [Google Scholar]
  31. Álvarez Alonso, J.; Díaz Alván, J.; Shany, N. Avifauna de la Reserva Nacional Allpahuayo Mishana, Loreto, Perú. Cotinga 2012, 34, 132–152. [Google Scholar]
  32. Edwards, D.P.; Woodcock, P.; Newton, R.J.; Edwards, F.A.; Andrews, D.J.; Docherty, T.D.; Mitchell, S.L.; Ota, T.; Benedick, S.; Bottrell, S.H.; et al. Trophic flexibility and the persistence of understory birds in intensively logged rainforest. Conserv. Biol. 2013, 27, 1079–1086. [Google Scholar] [CrossRef]
  33. Arcilla, N.; Holbech, L.H.; O’Donnell, S. Severe declines of understory birds follow illegal logging in Upper Guinea forests of Ghana, West Africa. Biol. Conserv. 2015, 188, 41–49. [Google Scholar] [CrossRef]
  34. Powell, L.L.; Cordeiro, N.J.; Stratford, J.A. Ecology and conservation of avian insectivores of the rainforest understory: A pantropical perspective. Biol. Conserv. 2015, 188, 1–10. [Google Scholar] [CrossRef]
  35. Vitousek, P.M.; Sanford, R.L. Nutrient cycling in moist tropical forest. Annu. Rev. Ecol. Evol. Syst. 1986, 17, 137–167. [Google Scholar] [CrossRef]
  36. Garcia-Villacorta, R.; Ahuite-Reátegui, M.; Olortegui-Zumaeta, M. Clasificación de bosques sobre arena blanca de la Zona Reservada Allpahuayo-Mishana. Folia Amazón. 2003, 14, 17–33. [Google Scholar] [CrossRef]
  37. Adeney, J.M.; Christensen, N.L.; Vicentini, A.; Cohn-Haft, M. White-sand ecosystems in Amazonia. Biotropica 2016, 48, 7–23. [Google Scholar] [CrossRef]
  38. Salo, M.; Pyhälä, A. Exploring the gap between conservation science and protected area establishment in the Allpahuayo-Mishana National Reserve (Peruvian Amazonia). Environ. Conserv. 2007, 34, 23–32. [Google Scholar] [CrossRef]
  39. Schulenberg, T.S.; Stotz, D.F.; Lane, D.F.; O’Niell, J.P.; Parker, T.A., III. Birds of Peru, 2nd ed.; Princeton University Press: Princeton, NJ, USA, 2010. [Google Scholar]
  40. R Core Team. R: A Language and Environment for Statistical Computing; R Foundation for Statistical Computing: Vienna, Austria, 2022; Available online: https://www.R-project.org (accessed on 20 June 2023).
  41. Mattsson, B.J.; Zipkin, E.F.; Gardner, B.; Blank, P.J.; Sauer, J.R.; Royle, J.A. Explaining local-scale species distributions: Relative contributions of spatial autocorrelation and landscape heterogeneity for an avian assemblage. PLoS ONE 2013, 8, e55097. [Google Scholar] [CrossRef]
  42. Paradis, E.; Schliep, K. ape 5.0: An environment for modern phylogenetics and evolutionary analyses in R. Bioinformatics 2019, 35, 526–528. [Google Scholar] [CrossRef]
  43. Staudhammer, C.L.; Escobedo, F.J.; Blood, A. Assessing methods for comparing species diversity from disparate data sources: The case of urban and peri-urban forests. Ecosphere 2018, 9, e02450. [Google Scholar] [CrossRef]
  44. Horn, H.S. Measurement of “overlap” in comparative ecological studies. Am. Nat. 1966, 100, 419–424. [Google Scholar] [CrossRef]
  45. Chao, A.; Ma, K.H.; Hsieh, T.C.; Chiu, C. SpadeR: Species-Richness Prediction and Diversity Estimation with R. R Package Version 0.1.1. 2016. Available online: https://cran.r-project.org/web/packages/SpadeR/index.html (accessed on 20 June 2023).
  46. Hsieh, T.C.; Ma, K.H.; Chao, A. iNEXT: iNterpolation and EXTrapolation for Species Diversity. R Package Version 3.0.0. 2022. Available online: https://cran.r-project.org/web/packages/iNEXT/index.html (accessed on 20 June 2023).
  47. Billerman, S.M.; Keeney, B.K.; Rodewald, P.G.; Schulenberg, T.S. (Eds.) Birds of the World; Cornell Laboratory of Ornithology: Ithaca, NY, USA, 2022; Available online: https://birdsoftheworld.org/bow/home (accessed on 15 June 2023).
  48. Oksanen, J.; Blanchet, F.G.; Kindt, R.; Legendre, P.; Minchin, P.R.; O’Hara, R.B.; Simpson, G.L.; Solymos, P.; Stevens, M.H.H.; Wagner, H.; et al. Vegan: Community Ecology Package. R Package Version 2.5-6. 2019. Available online: https://CRAN.R-project.org/package=vegan (accessed on 20 June 2023).
  49. Lefcheck, J.S. piecewiseSEM: Piecewise structural equation modeling in R for ecology, evolution, and systematics. Methods Ecol. Evol. 2016, 7, 573–579. [Google Scholar] [CrossRef]
  50. Grace, J.B.; Schoolmaster, D.R., Jr.; Guntenspergen, G.R.; Little, A.M.; Mitchell, B.R.; Miller, K.M.; Schweiger, E.W. Guidelines for a graph-theoretic implementation of structural equation modeling. Ecosphere 2012, 3, 73. [Google Scholar] [CrossRef]
  51. Mestre, L.A.M.; Cosset, C.C.P.; Nienow, S.S.; Krul, R.; Rechetelo, J.; Festti, L.; Edwards, D.P. Impacts of selective logging on avian phylogenetic and functional diversity in the Amazon. Anim. Conserv. 2020, 23, 725–740. [Google Scholar] [CrossRef]
  52. Chazdon, R.L. Chance and determinism in tropical forest succession. In Tropical Forest Community Ecology; Carson, W.P., Schnitzer, S.A., Eds.; Blackwell: Malden, MA, USA, 2008; pp. 384–408. [Google Scholar]
  53. Laurance, W.F.; Useche, D.C.; Rendeiro, J.; Kalka, M.; Bradshaw, C.J.; Sloan, S.P.; Plumptre, A. Averting biodiversity collapse in tropical forest protected areas. Nature 2012, 489, 290–294. [Google Scholar] [CrossRef]
  54. Acevedo-Charry, O.; Aide, T.M. Recovery of amphibian, reptile, bird and mammal diversity during secondary forest succession in the tropics. Oikos 2019, 128, 1065–1078. [Google Scholar] [CrossRef]
  55. Brotons, L.; Pons, P.; Herrando, S. Colonization of dynamic Mediterranean landscapes: Where do birds come from after fire? J. Biogeogr. 2005, 32, 789–798. [Google Scholar] [CrossRef]
  56. Markl, J.S.; Schleuning, M.; Forget, P.M.; Jordano, P.; Lambert, J.E.; Traveset, A.; Wright, S.J.; Bohning-Gaese, K. Meta-analysis of the effects of human disturbance on seed dispersal by animals. Conserv. Biol. 2012, 26, 1072–1081. [Google Scholar] [CrossRef]
  57. Van Bael, S.A.; Brawn, J.D.; Robinson, S.K. Birds defend trees from herbivores in a Neotropical forest canopy. Proc. Natl. Acad. Sci. USA 2003, 100, 8304–8307. [Google Scholar] [CrossRef]
  58. Hamer, K.C.; Newton, R.J.; Edwards, F.A.; Denedick, S.; Bottrell, S.H.; Edwards, D.P. Impacts of selective logging on insectivorous birds in Borneo: The importance of trophic position, body size and foraging height. Biol. Conserv. 2015, 188, 82–88. [Google Scholar] [CrossRef]
  59. Cleary, D.F.; Boyle, T.J.; Setyawati, T.; Anggraeni, C.D.; Loon, E.E.V.; Menken, S.B. Bird species and traits associated with logged and unlogged forest in Borneo. Ecol. Appl. 2007, 17, 1184–1197. [Google Scholar] [CrossRef]
  60. Marques, J.T.; Ramos Periera, M.J.; Marques, T.A.; Santos, C.D.; Santana, J.; Beja, P.; Palmeirim, J.M. Optimizing sampling design to deal with mist-net avoidance in Amazonian birds and bats. PLoS ONE 2013, 8, e74505. [Google Scholar] [CrossRef]
  61. Wang, Y.; Finch, D.M. Consistency of mist netting and point counts in assessing landbird species richness and relative abundance during migration. Ornithol. Appl. 2002, 104, 59–72. [Google Scholar] [CrossRef]
  62. Martin, T.E.; Blackburn, G.A.; Simcox, W. An assessment of the effectiveness of two methods in describing a neotropical cloud forest bird community. Ornitol. Neotrop. 2010, 21, 131–147. [Google Scholar]
  63. Dunn, E.H.; Ralph, C.J. Use of mist nets as a tool for bird population monitoring. Stud. Avian Biol. 2004, 29, 1–6. [Google Scholar]
  64. Pérez-Granados, C.; Traba, J. Estimating bird density using passive acoustic monitoring: A review of methods and suggestions for further research. IBIS 2021, 163, 765–783. [Google Scholar] [CrossRef]
  65. Tito, R.; Salinas, N.; Cosio, E.G.; Boza Espinoza, T.E.; Muñiz, J.G.; Aragón, S.; Nina, A.; Roman-Cuesta, R. Secondary forests in Peru: Differential provision of ecosystem services compared to other post-deforestation forest transitions. Ecol. Soc. 2022, 27, 12. [Google Scholar] [CrossRef]
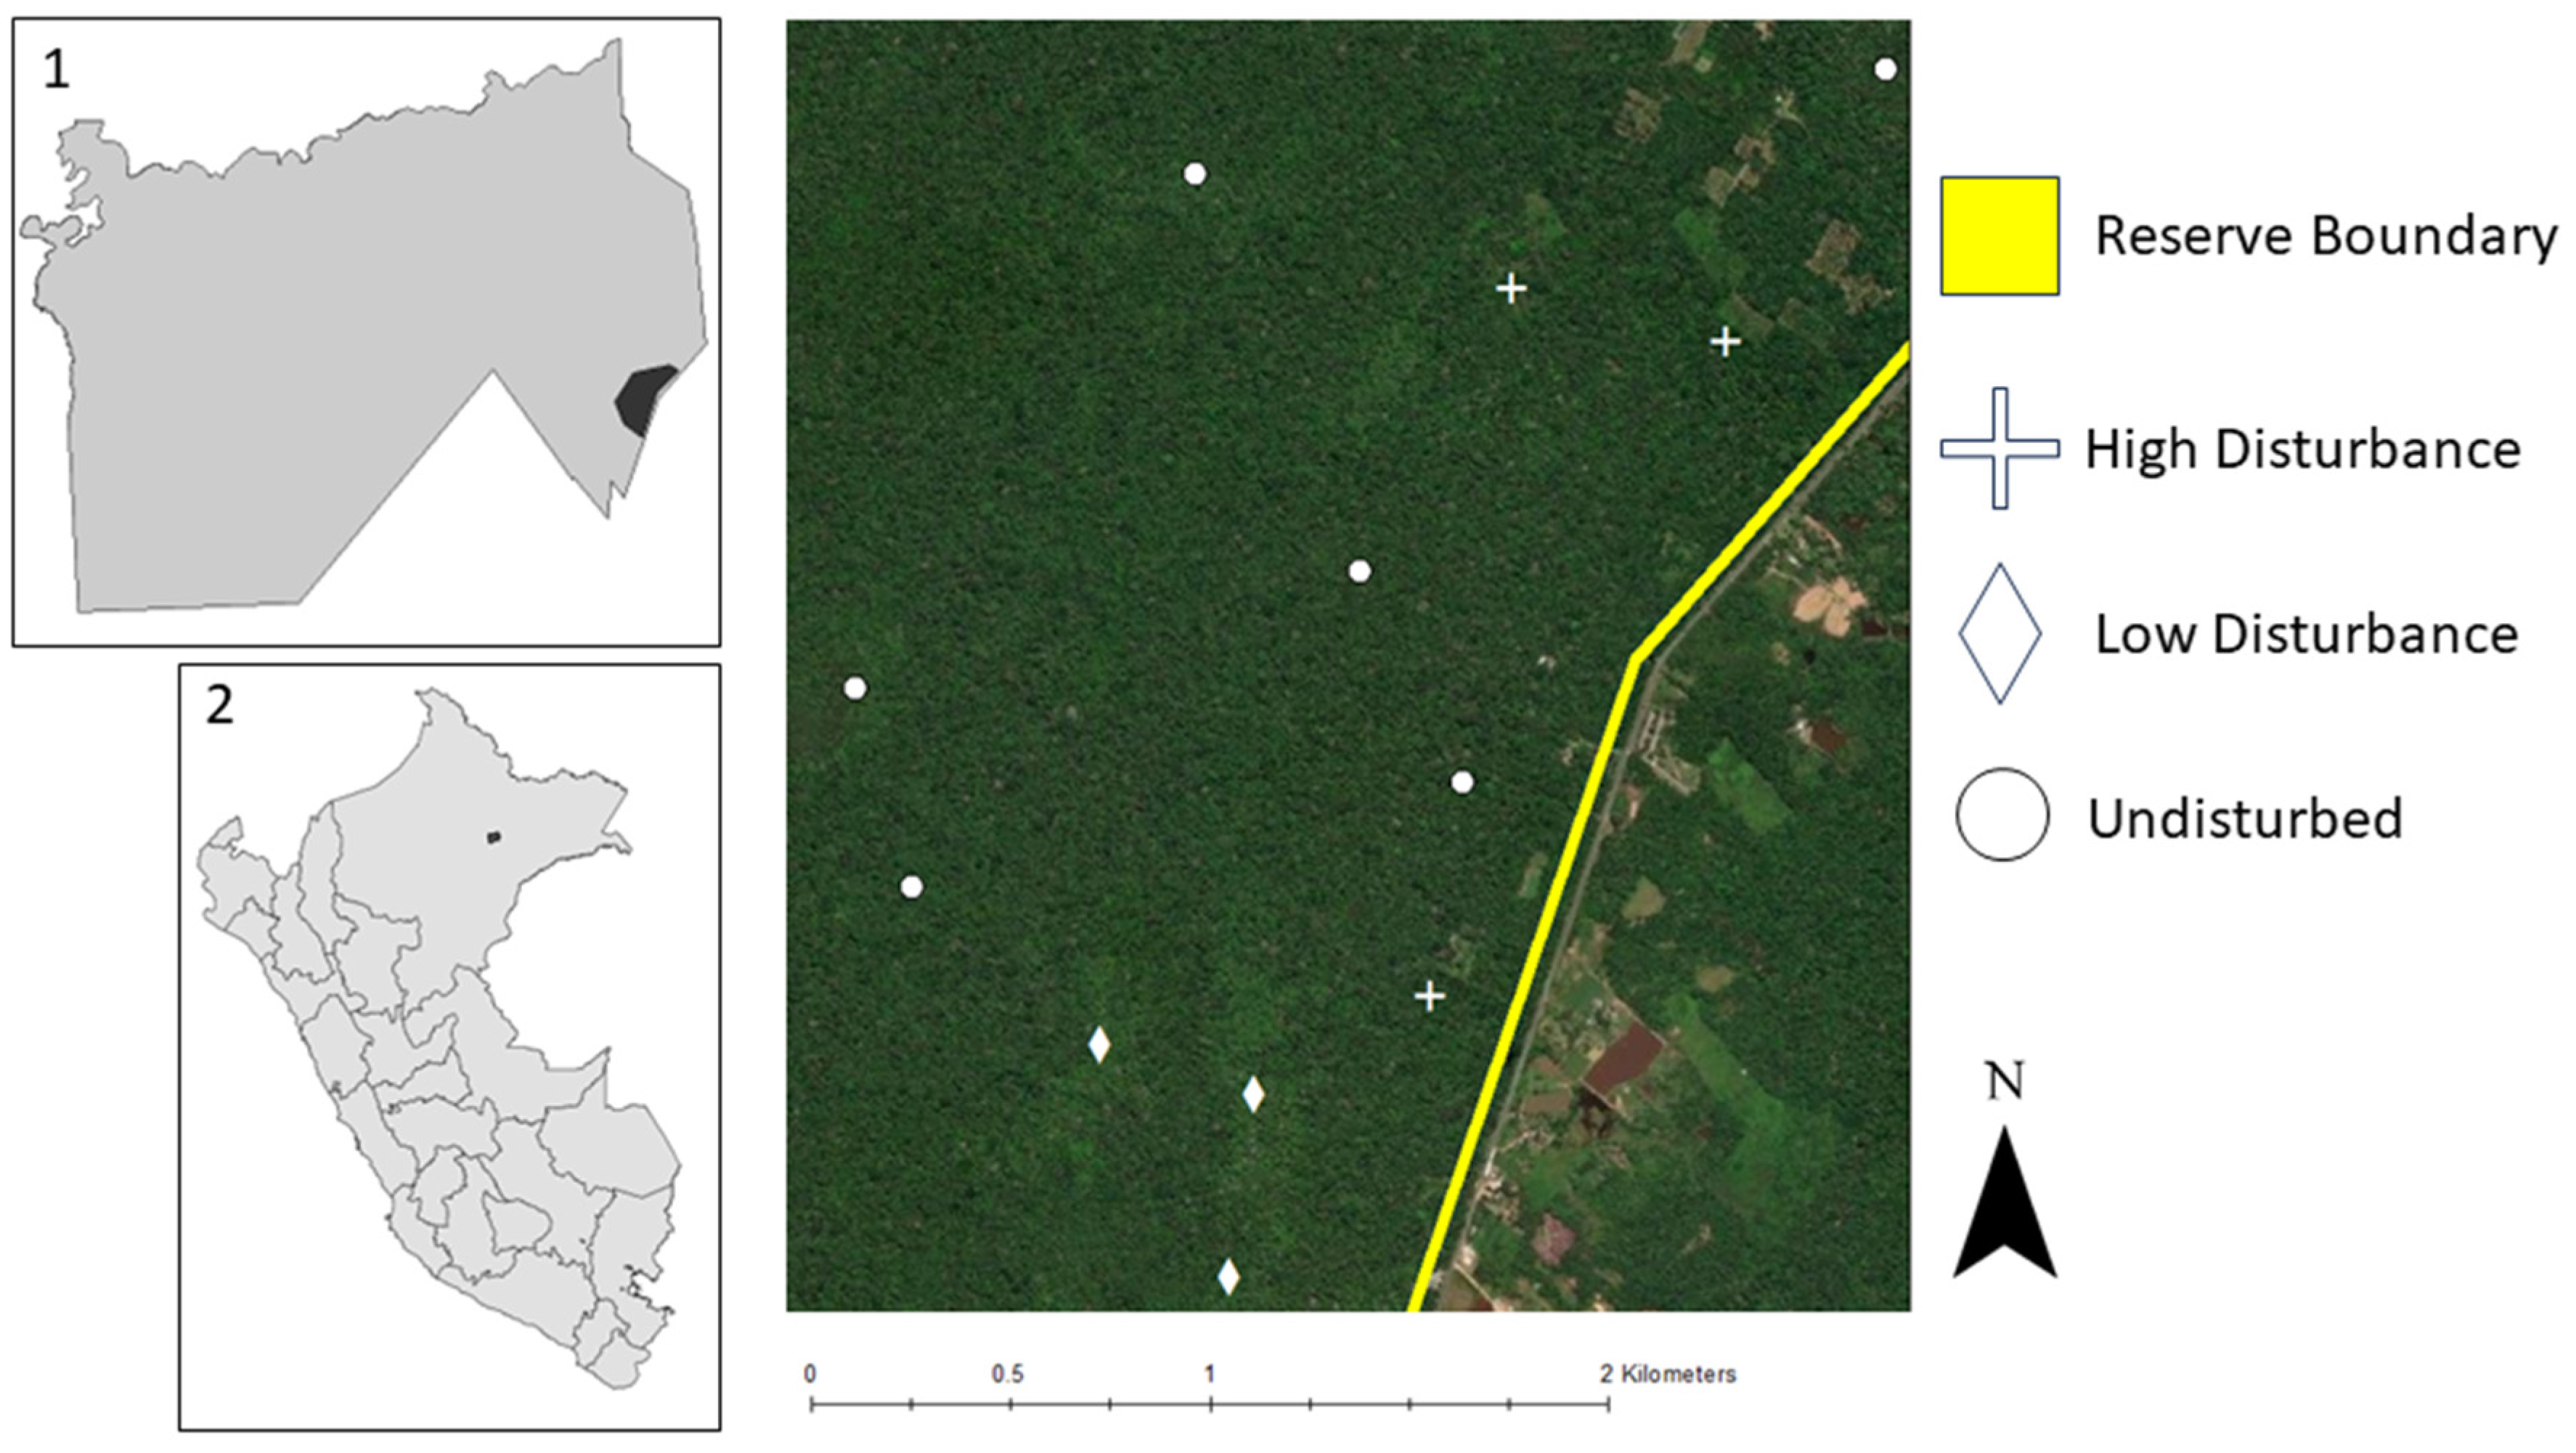
Figure 1. The location of the study sites in Allpahuayo-Mishana National Reserve, where data were collected from March to May 2023. The study sites included 3 low-disturbance (selectively logged) areas, three high-disturbance (former agriculture) areas, and six undisturbed primary forest sites. Inset 1 shows the location of the study area in Allpahuayo-Mishana National Reserve. Inset 2 shows the location of Allpahuayo-Mishana National Reserve in Peru. Imagery source: ESRI/Maxar; imagery date: 6 September 2018.
Birds 05 00026 g001
Figure 2. Species accumulation curves comparing species richness between high-disturbance, low-disturbance, and undisturbed forest sites in Allpahuayo-Mishana National Reserve, Peru. Species accumulation curves use rarefaction and extrapolation of bird capture data to predict the number of species present among a pool of 250 individuals.
Birds 05 00026 g002
Figure 3. Non-metric multidimensional scaling (NMDS) plot showing differences in bird community composition between high-disturbance, low-disturbance, and undisturbed forest sites in Allpahuayo-Mishana National Reserve, Peru. Each site is represented by a point on the plot. The farther apart points are on the plot, the more distinct their bird communities are. The gray lines show the relationship between bird dietary guilds and the two NMDS axes.
Birds 05 00026 g003
Figure 4. Non-metric multidimensional scaling (NMDS) plot showing differences in forest vegetation structure between high-disturbance, low-disturbance, and undisturbed forest sites in Allpahuayo-Mishana National Reserve, Peru. Each site is represented by a point on the plot, with closer points being more similar in forest structure. The gray lines show the relationship between vegetation structure variables and the two NMDS axes.
Birds 05 00026 g004
Figure 5. Structural equation models that best represent the direct and indirect effects of disturbance intensity on abundance of the following avian dietary guilds in Allpahuayo-Mishana National Reserve, Peru: (A) ant-followers, (B) non-ant-following insectivores, and (C) nectarivores. Arrows represent direct relationships between variables.
Birds 05 00026 g005
Disclaimer/Publisher’s Note: The statements, opinions and data contained in all publications are solely those of the individual author(s) and contributor(s) and not of MDPI and/or the editor(s). MDPI and/or the editor(s) disclaim responsibility for any injury to people or property resulting from any ideas, methods, instructions or products referred to in the content.