Simple Summary
The eye in birds has evolved through time to facilitate foraging and detect potential threats, such as predators. The size of the eye affects how much light is captured and image resolution. Eye size varies across species, and this variation is typically associated with the availability of light in the environment and the foraging needs of each species. Larger eyes could also allow species to detect distant predators more easily, but this has not been tested across species. I predicted that species that are averse to risk and those exposed to high predation risk benefit from larger eyes to enhance the detection of predators. I performed an analysis using 660 different species of birds with various foraging needs and life histories. Controlling for relatedness among species and known correlates of eye size in birds, I found that species that emphasize survival over reproduction, which are expected to be risk-averse, have larger eyes relative to their body size. In addition, species that live alone and cannot rely on others in their groups to decrease the risk of predation also have larger eyes. The results show that the risk of predation through its association with life history and sociality can shape variations in eye size across species of birds.
Abstract
Over evolutionary times, the eye has acquired several adaptations to improve feeding efficiency and reduce predation pressure. Eye size, in particular, represents a target for selection, as it affects light capture and image resolution. Previous research on variation in eye size across species has focused on ecological factors related to light availability and foraging needs. Larger eyes are also thought to allow species to detect distant predators more easily, but this conjecture has not been examined across species. I predicted that risk-averse species or those exposed to high predation risk benefit from relatively larger eyes to enhance predator detection. To test the prediction, I performed a comparative analysis involving 660 species of birds while controlling for phylogeny, body size and other known ecological correlates of eye size. The results show that species at the slow end of the life history continuum, which emphasize survival over reproduction and are expected to be risk-averse, have evolved relatively larger eyes. In addition, solitary species, which cannot rely on others in their groups to decrease predation risk, are also characterized by relatively larger eyes. The results indicate that predation risk, through its association with life history and sociality, is an important ecological factor in the evolution of eye size across species.
1. Introduction
Through evolutionary times, the eye has acquired several adaptations to allow birds to detect food and predators more efficiently. Variations in retinal anatomy, for instance, allow birds to forage at low light levels [1] or in aquatic environments [2] to monitor threats on the horizon [3] and to track and capture fast-moving prey [4]. The size of the eye also represents a target for selection, as it affects focal length and image resolution. Indeed, larger eyes by themselves or in relation to body size can collect more light and allow better resolution of farther objects, such as approaching predators [5,6]. Evolving larger eyes, however, is costly, as visual processing in the brain can compete for limited space with other neural processes [7]. Larger eyes are also metabolically more costly to maintain [8]. Eye size, after accounting for allometric scaling with body size, is thus viewed as an evolutionary compromise reflecting the ecology and visual needs of each species.
Comparative analyses have highlighted several ecological predictors of variation in eye size across birds. For instance, birds that forage at low light levels tend to have relatively larger eyes to better capture elusive light. This is the case for nocturnal species and those that occupy more visually cluttered habitats [9]. Birds that feed on moving prey also tend to have relatively larger eyes [10,11], which might provide the necessary acuity to track and capture distant prey.
Relatively larger eyes might also allow species to detect threats earlier, suggesting that predation risk can also alter eye size [12,13,14]. In contrast to research on other senses, such as hearing [15], comparative analyses on eye size have surprisingly paid little attention to ecological factors associated with predation risk. The general hypothesis is that species that are risk-averse or that are exposed to high predation risk benefit from relatively larger eyes to enhance predator detection. Here, I explored whether two factors related to predation risk, namely life history and sociality, influence eye size across birds.
Life history is often viewed as a continuum of strategies involving reproduction and survival [16]. Species at the slow end produce fewer offspring and tend to live longer, whereas species at the fast end have shorter lives but reproduce more. Due to the emphasis on adult survival, species at the slow end of the continuum are considered less likely to accept risk on themselves to ensure their own survival and future reproduction. By contrast, species at the fast end of the continuum might accept more risk on themselves, as their probability of breeding again is low. In general, species that emphasize adult survival and future reproduction are expected to be more cautious [17], which favors the evolution of traits that reduce predation risk. The evidence thus far supports an association between life history and risk taking. For instance, species at the slow end of the continuum tend to flee sooner when predators approach [18,19,20], have higher levels of hormones involved in reducing risk [21] and take fewer risks when raising their young [22]. Therefore, I predicted that species at the slow end of the life history continuum benefit from relatively larger eyes to reduce predation risk.
Species also vary in their sociality. Some species are strictly solitary and seek others only during reproduction, whereas others occur in groups throughout their lives. Living in groups has long been viewed as an anti-predator adaptation [23]. In particular, the presence of companions can increase the ability to detect approaching predators at the group level and dilute risk among all group members. Empirical research suggests that sociality through such mechanisms can reduce predation risk. Mortality for some species tends to be lower in groups with more individuals [24,25,26,27]. Across species, mortality often decreases in species that feed in flocks rather than alone [28,29,30,31]. Mortality through predation only is also lower in species forming larger groups [32,33]. As solitary species cannot rely on others to decrease predation risk, I predicted that they benefit from relatively larger eyes to increase predator detection.
I tested these two predictions using a large number of avian species. Eye size has a strong phylogenetic signal [9], indicating that sister species tend to have similar eye sizes. In addition, eye size increases allometrically with body size [9,10,11,34,35]. Therefore, I used a phylogenetic framework to examine ecological predictors of eye size across birds while controlling for body size. I also included in the model other known correlates of eye size, such as diet and foraging substrate, as many of these factors are also associated with sociality [36] and could act as confounders.
In addition to body size, I considered the following correlates of eye size. Relative eye size varies with habitat type. In particular, closed or semi-open habitats characterized by low light levels favor relatively larger eyes [9,11]. Diet can also influence eye size through prey characteristics. For instance, relative eye size is typically larger for species that feed on mobile prey, such as insects or vertebrates, rather than immobile items such as fruits or nectar [9,10,11]. Species that forage on distant prey (hyperopic species) are expected to have relatively larger eyes than those that forage on nearby food items (myopic species) to increase focal length [9]. The substrate for foraging can influence eye size by changing the amount of light available. Low light for aquatic foragers or those foraging closer to the ground in terrestrial habitats favors relatively larger eyes [9,37]. The timing of activity is thought to influence eye size again through the amount of light available for crepuscular species and those foraging at night, having relatively larger eyes to capture elusive light [10,11,35,38]. Species that migrate might have relatively smaller eyes for energy saving in the face of costly movements [9,11]. Areas closer to the tropics are thought to have darker forests and dimmer light, which might favor the evolution of larger eyes closer to the equator [9].
2. Materials and Methods
2.1. Data Collection
For eye size, I obtained vertical (V) and horizontal (H) transverse diameters for one or more preserved eye specimens from one study of a large number of avian species [34]. Assuming a spheroid shape [10], I calculated mean eye size as a volume (cc) for each species using the above two transverse diameters with the following formula: 4/3 × π × H2 × V. As an additional measure of eye size, I used axial length, which was also measured for the same specimens by Ritland. Axial length represents the distance between the anterior (surface of the cornea) and the posterior poles (surface of the retina) of the eye. Ritland also provided estimates of body mass for each species with eye measurements.
I relied on a published dataset for information on sociality [36]. The sociality index is the occurrence of flocks during foraging. A flock is defined as any roving group with more than two adults searching for food, excluding family parties. The classification for flocking distinguishes between species that form flocks on a regular basis (flocking) versus those that flock irregularly (occasional) or not at all (solitary). Pooling the two datasets yielded species with full information on sociality and two measurements of eye size, namely eye volume and axial length.
For each included species, I extracted from the literature additional information for other variables (Table 1). From Beauchamp (2022) [36], I obtained data for annual adult survival, the latitude of the study site where adult survival was estimated, the timing of activity, migration and clutch size. I used a published standardized classification for diet (the main food items in the diet) and foraging substrate (where foraging occurs) [39]. For terrestrial species, I also considered whether foraging occurs mostly on the ground (50% of the time or more) or above the ground in the under-story, the mid-story or the canopy. I used another published classification for habitat, as it relates to light availability [40]. For foraging maneuvers, I used a published classification that distinguishes between myopic species, which target food items in the immediate vicinity, and hyperopic species, which target food at a distance [9].

Table 1.
Definition of variables potentially associated with eye size across birds.
2.2. Data Analysis
As annual adult survival, body mass and clutch size are strongly correlated, I used a phylogenetic PCA to extract independent components [43]. The first component had a strong negative load for annual adult survival (−0.77) and a strong positive load for clutch size in the log10 scale (0.77), suggesting that larger values on this axis represent faster life histories. The second component had a strong positive load for body mass in the log10 scale (0.90) and was interpreted as a body mass axis. The correlation between the second component and body mass in the log10 scale was high (r = 0.97), so I used this component for allometric purposes.
I used a phylogenetic regression model from the phylolm package [44]. The dependent variable was eye volume in the log10 scale in one model and axial length in the log10 scale in the other. The set of independent variables included the two PCA components, diet, foraging substrate, foraging maneuver, timing of activity, habitat, migration, absolute latitude, and sociality. For phylogenetic relatedness, I included the variance–covariance distance matrix for the included species. The distance matrix was obtained from a 50% majority consensus tree constructed from a set of 1000 phylogenetic trees [45]. The consensus tree and branch lengths were obtained from the ape package [46]. The phylogenetic model was run under three different evolutionary scenarios (Brownian motion, Pagel’s lambda and Orhstein–Uhlenbeck) available in the phylolm package. I used AIC to determine the model with the best fit. For eye volume and axial length, the model with the smallest AIC was Pagel’s lambda, which was used subsequently for statistical inference (Figure 1).
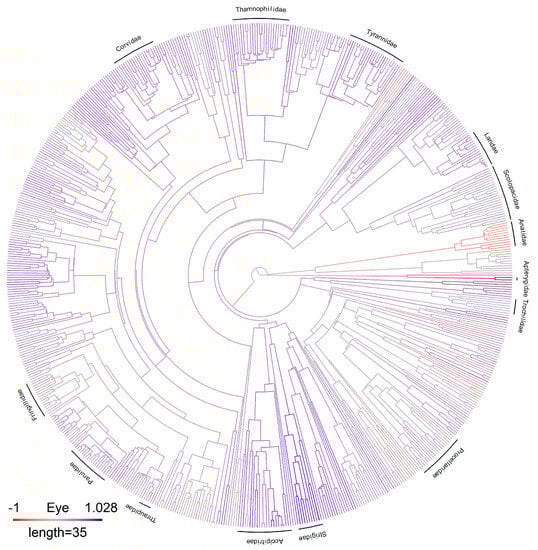
Figure 1.
The phylogeny used for the analysis is based on a consensus tree. Residuals from a log–log phylogenetic regression of eye volume against body mass are shown for each species. Species with relatively larger eyes than expected from their body size are shown in blue shades, and those with relatively smaller eyes than expected from their body size are shown in red shades. The position of selected families is shown.
The assessment of multicollinearity was performed using variance inflating factors for the independent variables included in the phylogenetic regression model. All VIFs were below 5, indicating, at most, moderate multicollinearity (Table S1). A threshold of 5 is often used to indicate serious issues with multicollinearity [47]. The assessment of the normality of residual values for the phylogenetic regression model was performed with quantile–quantile plots. The residual plots showed a good general fit to the normal distribution but revealed two outliers. The outliers turned out to be two kiwi species (Apteryx spp.), which are large, nocturnal birds with very small eyes for their size [35].
For each model, I used the rr2 package to calculate the R2 for the full models, including the phylogenetic signal and ecological variables as well as the partial models including only the phylogenetic signal [48]. The difference between the two R2 provides the percentage of variation explained by the other independent variables.
3. Results
The dataset consisted of 660 species belonging to 136 families (Table S2). Species ranged in size from 3 to 75,000 g with varied life histories, diets, foraging substrates and sociality. Eye volume exhibited a strong phylogenetic signal (λ = 0.96). The R2 for the full model was 0.94, and the ecological variables in the phylogenetic linear model explained 19.4% of the variation in eye volume across birds (Table 2).
Table 2.
Results from a phylogenetic linear model for the effect of habitat, diet, foraging substrate, sociality, timing of activity, migration, latitude, foraging, body mass and life history on eye size in birds (n = 660 species).
Eye volume increased in species with a larger body mass index and decreased for species with faster life histories (Figure 2, Table 2). Controlling for phylogeny and allometric relationships, eye volume was larger in species that forage in more closed habitats, in more solitary species and in hyperopic rather than myopic species (Figure 3, Table 2). Eye volume was smaller in aquatic species and larger in aerial species than that in terrestrial species (Table 2). In terrestrial habitats, eye volume tended to decrease farther away from the ground, but this effect did not reach statistical significance (Table 2). Eye volume was not associated with diet, absolute latitude, migration or the timing of activity (Table 2).
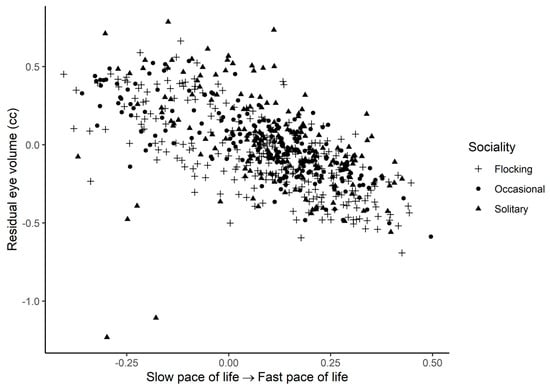
Figure 2.
Residual eye volume (cc) as a function of the pace-of-life PCA axis for the three different types of sociality across birds. Residuals are taken from the full phylogenetic model with all variables minus the pace-of-life PCA axis. Larger residual eye volumes indicate that eyes are larger than predicted given the size of a species and its ecology. Larger values on the PCA axis are interpreted as faster life histories.
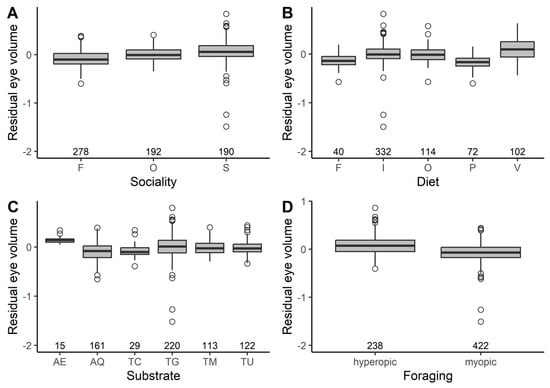
Figure 3.
The relationship between residual eye volume (cc) and selected ecological predictors in birds. Residuals are taken from the full phylogenetic model with all variables minus the target variable. Larger residual eye volumes indicate that eyes are larger than predicted given the size of a species and its ecology. Box and whisker plots show the mean and interquartile range, and the whiskers extend to 1.5 times the interquartile range (outliers are shown as dots). The sample size for each category is shown under each box. In panel (A): flocking (F), occasional (O) and solitary (S). In panel (B): fruits/nectar (F), invertebrates (I), omnivores (O), plants/seeds (P) and vertebrates (V). In panel (C): aerial (AE), aquatic (AQ), terrestrial-canopy (TC), terrestrial-ground (TG), terrestrial-mid-story (TM) and terrestrial-under-story (TU). In panel (D): hyperopic and myopic foraging maneuvers.
Eye size as measured by axial length also exhibited a strong phylogenetic signal (λ = 0.96). The R2 for the full model was 0.94, and the ecological variables in the phylogenetic linear model explained 20.3% of the variation in axial length across birds (Table S3). As with eye volume, axial length increased with body mass and decreased with faster life histories. Axial length was also larger in more solitary species. For the remaining ecological variables, the same effects were recovered for axial length as those for eye volume (Table S3).
4. Discussion
Eye size in birds, as measured by eye volume and axial length, showed a strong phylogenetic signal and was allometrically related to body mass. After correcting for phylogeny and body mass, I found strong support for the prediction that predation risk, through its association with life history and sociality, influences eye size across birds. In particular, species at the slow end of the life history continuum and more solitary species have evolved relatively larger eyes.
The association between eye size and life history fits with the asset protection principle whereby animals invest more in anti-predator defenses when they have more to lose in terms of future reproductive potential [17]. In this study, species at the slow end of the life history spectrum, which emphasize adult survival over reproduction, have evolved larger eyes, which is helpful in reducing predation risk by allowing earlier detection. Consistent with the concept of risk aversion, empirical studies have documented more caution with respect to predators for species at the slow end of the life history continuum [18,19,22]. These studies have focused on behavioral responses to risk. This study shows that bird species with different life histories can also differ in morphological traits with an anti-predator function, such as the eye. This is similar to the idea that predation in general can lead to the evolution of morphological traits aimed at reducing predation risk [49].
The association between eye size and sociality fits with the idea that high predation risk associated with solitary living can select for the evolution of relatively larger eyes. Although species that forage alone rather than in flocks often experience higher risk [32,33], foraging alone or in flocks is also associated with particular ecological niches that, on their own, might affect eye size independently of risk. For instance, flocking in birds is associated with body mass, diet, the timing of activity and foraging substrate [36], and many of these variables are also correlates of eye size [9,10,11,35]. As I included these potential confounding effects in the phylogenetic model, the association between sociality and relative eye size was not an indirect effect of the above co-factors. Life history is also associated with ecological niches in general [16] and with flocking in birds as well [36]. Accounting for confounding variables, life history and sociality were both independently associated with relative eye size.
The idea that predation risk in general can influence eye size has received less attention than other variables such as diet, foraging substrate and the timing of activity. In birds, species facing more predation risk tend to flee at larger distances from potential threats and have evolved relatively larger eyes [13]. In a fish, an increase in predation risk was associated with a decrease rather than an increase in eye size [14], but larger eyes in fish are more reflective and might attract rather than deter predators. In two invertebrate species, by contrast, larger eyes evolved in habitats with more predators [50,51]. More arboreal snakes, which are exposed to more predation threats than terrestrial species, also tend to have larger eyes [52]. Limited evidence thus far supports a role for predation risk in the evolution of eye size.
The calculation of eye volume assumes that the eye is a spheroid. Although this assumption is common in the literature [10,11,13], it is clear that eye shape in some species may not fit this model [38]. Nevertheless, the association between eye size and life history or sociality remained significant regardless of whether eye size was measured as a volume or using one diameter (here axial length). It thus appears that, over evolutionary times, demand for larger eyes in relation to predation risk was met by an increase in axial length as well as other diameters of the eye.
Changes in axial length alone can increase visual acuity by allowing the formation of a larger image on the retina [53]. Ecology can have a greater influence on axial length than on eye volume in some cases [38]. Nocturnal species, for instance, tend to have longer axial lengths compared to those of diurnal species with a smaller difference in eye volume [11]. Here, neither axial length nor eye volume was associated with the timing of activity. This could be explained by differences in the ecological variables considered in the models. Liu et al. (2023) [11] did not consider life history and sociality in their model. As many nocturnal species are long-lived and rather solitary, the timing of activity after taking into account these two ecological variables might explain relatively little else in eye size. The same reasoning might apply to latitude, where tropical species tend to have larger eyes [9]. Ausprey’s model (2021) [9] did not consider life history. Latitude is likely subsumed in the life history axis that I considered, as tropical species have a slower pace of life [54].
Species foraging on the ground have relatively larger eyes to capture more elusive light in this forest stratum [9]. My model recovered this trend, but the effect was not significant, perhaps reflecting the lower power in my study and additional variables included in the model. If solitary species forage on the ground more often [55], the relatively larger eyes of solitary species could be explained by the darker habitat they inhabit rather than sociality. However, the effect of sociality persisted after controlling for foraging stratum.
This study has limitations. Although the number of species included in the analysis was large, it still represents only a fraction of the total number of known avian species [56]. In addition, eye size measurements were typically available for only one specimen per species [34]. Future studies will benefit from a larger number of species and more robust estimates of eye size. My analysis could be extended to other taxa with available eye size measurements, such as frogs, snakes and mammals [11,37,52,57]. In addition to life history and sociality, various other correlates of predation risk might be considered in future studies. For instance, species that are less susceptible to predation because of camouflage or chemical defense might be expected to evolve relatively smaller eyes.
Eye size is but one aspect of the visual system in birds. Predation risk could also influence other features, such as retinal specialization and visual field configuration, but comparisons across species are scant [58]. Opportunities thus exist to examine further whether predation risk is a general factor in the evolution of eye size and the overall visual system in animals.
5. Conclusions
In a phylogenetic framework and controlling for known correlates of eye size across birds, the results of this study show that the risk of predation can predict variations in eye size across species of birds. In particular, species at the slow end of the life history continuum, which are considered risk-averse, and those that live alone, which cannot rely on others in their groups to reduce predation risk, have evolved relatively larger eyes. This was true when eye size was estimated as a volume or using axial length.
Supplementary Materials
The following supporting information can be downloaded at https://www.mdpi.com/article/10.3390/birds4030024/s1: Table S1: Variance inflation factors for the effect of habitat, diet, foraging substrate, sociality, timing of activity, migration, latitude, foraging, body mass, and life history on eye volume in birds (n = 660 species); Table S2: Table of 136 families and 660 species with available data on eye size, life history, and flocking. Taxonomy is based on the Cornell Lab of Ornithology Birds of the World. Families are sorted by species sampled; Table S3: Results from a phylogenetic linear model for the effect of habitat, diet, foraging substrate, sociality, timing of activity, migration, latitude, foraging, body mass, and life history on axial length in birds (n = 660 species).
Funding
This research received no external funding.
Institutional Review Board Statement
Not applicable.
Data Availability Statement
The data are available from the corresponding author.
Conflicts of Interest
The author declares no conflict of interest.
References
- Rojas, L.M.; Ramírez, Y.; McNeil, R.; Mitchell, M.; Marín, G. Retinal morphology and electrophysiology of two Caprimulgiformes birds: The cave-living and nocturnal Oilbird (Steatornis caripensis), and the crepuscularly and nocturnally foraging Common Pauraque (Nyctidromus albicollis). Brain Behav. Evol. 2004, 64, 19–33. [Google Scholar] [CrossRef] [PubMed]
- Lisney, T.J.; Stecyk, K.; Kolominsky, J.; Schmidt, B.K.; Corfield, J.R.; Iwaniuk, A.N.; Wylie, D.R. Ecomorphology of eye shape and retinal topography in waterfowl (Aves: Anseriformes: Anatidae) with different foraging modes. J. Comp. Physiol. A Neuroethol. Sens. Neural Behav. Physiol. 2013, 199, 385–402. [Google Scholar] [CrossRef] [PubMed]
- Fernández-Juricic, E.; Moore, B.A.; Doppler, M.; Freeman, J.; Blackwell, B.F.; Lima, S.L.; DeVault, T.L. Testing the terrain hypothesis: Canada geese see their world laterally and obliquely. Brain Behav. Evol. 2011, 77, 147–158. [Google Scholar] [CrossRef] [PubMed]
- Potier, S.; Mitkus, M.; Kelber, A. Visual adaptations of diurnal and nocturnal raptors. Semin. Cell Dev. Biol. 2020, 106, 116–126. [Google Scholar] [CrossRef]
- Land, M.F.; Nilsson, D.E. Animal Eyes; Oxford University Press: Oxford, UK, 2012. [Google Scholar]
- Thomas, R.J.; Székely, T.; Powell, R.F.; Cuthill, I.C. Eye size, foraging methods and the timing of foraging in shorebirds. Funct. Ecol. 2006, 20, 157–165. [Google Scholar] [CrossRef]
- Wylie, D.R.; Gutiérrez-Ibáñez, C.; Iwaniuk, A.N. Integrating brain, behavior, and phylogeny to understand the evolution of sensory systems in birds. Front. Neurosci. 2015, 9, 281. [Google Scholar] [CrossRef]
- Moran, D.; Softley, R.; Warrant, E.J. The energetic cost of vision and the evolution of eyeless Mexican cavefish. Sci. Adv. 2015, 1, e1500363. [Google Scholar] [CrossRef]
- Ausprey, I.J. Adaptations to light contribute to the ecological niches and evolution of the terrestrial avifauna. Proc. R. Soc. B Boil. Sci. 2021, 288, 20210853. [Google Scholar] [CrossRef]
- Garamszegi, L.Z.; Møller, A.P.; Erritzøe, J. Coevolving avian eye size and brain size in relation to prey capture and nocturnality. Proc. R. Soc. B Boil. Sci. 2002, 269, 961–967. [Google Scholar] [CrossRef] [PubMed]
- Liu, Y.; Jiang, Y.; Xu, J.S.; Liao, W. Evolution of avian eye size is associated with habitat openness, food type and brain size. Animals 2023, 13, 1675. [Google Scholar] [CrossRef] [PubMed]
- Tisdale, V.; Fernández-Juricic, E. Vigilance and predator detection vary between avian species with different visual acuity and coverage. Behav. Ecol. 2009, 20, 936–945. [Google Scholar] [CrossRef]
- Møller, A.P.; Erritzøe, J. Flight distance and eye size in birds. Ethology 2010, 116, 458–465. [Google Scholar] [CrossRef]
- Svanbäck, R.; Johansson, F. Predation selects for smaller eye size in a vertebrate: Effects of environmental conditions and sex. Proc. R. Soc. B Boil. Sci. 2019, 286, 20182625. [Google Scholar] [CrossRef] [PubMed]
- Fullard, J.H.; Napoleone, N. Diel flight periodicity and the evolution of auditory defences in the Macrolepidoptera. Anim. Behav. 2001, 62, 349–368. [Google Scholar] [CrossRef]
- Roff, D.A. Life History Evolution; Sinauer Associates: Sunderland, MA, USA, 2002. [Google Scholar]
- Clark, C.W. Antipredator behavior and the asset-protection principle. Behav. Ecol. 1994, 5, 159–170. [Google Scholar] [CrossRef]
- Blumstein, D.T. Developing an evolutionary ecology of fear: How life history and natural history traits affect disturbance tolerance in birds. Anim. Behav. 2006, 71, 389–399. [Google Scholar] [CrossRef]
- Møller, A.P.; Liang, W. Tropical birds take small risks. Behav. Ecol. 2012, 24, 267–272. [Google Scholar] [CrossRef]
- Gotanda, K.M.; Turgeon, K.; Kramer, D.L. Body size and reserve protection affect flight initiation distance in parrotfishes. Behav. Ecol. Sociobiol. 2009, 63, 1563–1572. [Google Scholar] [CrossRef]
- Hau, M.; Ricklefs, R.E.; Wikelski, M.; Lee, K.A.; Brawn, J.D. Corticosterone, testosterone and life-history strategies of birds. Proc. R. Soc. B Boil. Sci. 2010, 277, 3203–3212. [Google Scholar] [CrossRef]
- Ghalambor, C.K.; Martin, T.E. Fecundity-survival trade-offs and parental risk-taking in birds. Science 2001, 292, 494–497. [Google Scholar] [CrossRef]
- Caro, T.M. Antipredator Defenses in Birds and Mammals; University of Chicago Press: Chicago, IL, USA, 2005. [Google Scholar]
- Brown, C.R.; Brown, M.B. Group size and ectoparasitism affect daily survival probability in a colonial bird. Behav. Ecol. Sociobiol. 2004, 56, 498–511. [Google Scholar] [CrossRef]
- Cash, K.J.; McKee, M.H.; Wrona, F.J. Short- and long-term consequences of grouping and group foraging in the free-living flatworm Dugesia tigrina. J. Anim. Ecol. 1993, 62, 529–535. [Google Scholar] [CrossRef]
- Clutton-Brock, T.H.; Gaynor, D.; McIlrath, G.M.; Maccoll, A.D.C.; Kansky, R.; Chadwick, P.; Manser, M.; Skinner, J.D.; Brotherton, P.N.M. Predation, group size and mortality in a cooperative mongoose, Suricata suricatta. J. Anim. Ecol. 1999, 68, 672–683. [Google Scholar] [CrossRef]
- Serrano, D.; Oro, D.; Ursúa, E.; Tella, J.L. Colony size selection determines adult survival and dispersal preferences: Allee effects in a colonial bird. Am. Nat. 2005, 166, E22–E31. [Google Scholar] [CrossRef]
- Beauchamp, G. Flocking in birds increases annual adult survival in a global analysis. Oecologia 2021, 197, 387–394. [Google Scholar] [CrossRef]
- Srinivasan, U. Morphological and behavioral correlates of long-term bird survival in selectively logged forest. Front. Ecol. Evol. 2019, 7, 17. [Google Scholar] [CrossRef]
- Jullien, M.; Clobert, J. The survival value of flocking in neotropical birds: Reality or fiction? Ecology 2000, 81, 3416–3430. [Google Scholar] [CrossRef]
- Cruz-Angón, A.; Sillett, T.S.; Greenberg, R. An experimental study of habitat selection by birds in a coffee plantation. Ecology 2008, 89, 921–927. [Google Scholar] [CrossRef]
- Shultz, S.; Noë, R.; McGraw, W.S.; Dunbar, R.I.M. A community-level evaluation of the impact of prey behavioural and ecological characteristics on predator diet composition. Proc. R. Soc. B Boil. Sci. 2004, 271, 725–732. [Google Scholar] [CrossRef]
- Beauchamp, G. Susceptibility to predation varies with body mass, foraging niche, and anti-predator responses among bird species. Birds 2023, 4, 73–84. [Google Scholar] [CrossRef]
- Ritland, S.M. The Allometry of the Vertebrate Eye; University of Chicago: Chicago, IL, USA, 1982. [Google Scholar]
- Brooke, M.d.L.; Hanley, S.; Laughlin, S.B. The scaling of eye size with body mass in birds. Proc. R. Soc. B Boil. Sci. 1999, 266, 405–412. [Google Scholar] [CrossRef]
- Beauchamp, G. Flocking in birds is associated with diet, foraging substrate, timing of activity, and life history. Behav. Ecol. Sociobiol. 2022, 76, 74. [Google Scholar] [CrossRef]
- Thomas, K.N.; Gower, D.J.; Bell, R.C.; Fujita, M.K.; Schott, R.K.; Streicher, J.W. Eye size and investment in frogs and toads correlate with adult habitat, activity pattern and breeding ecology. Proc. R. Soc. B Boil. Sci. 2020, 287, 20201393. [Google Scholar] [CrossRef] [PubMed]
- Hall, M.I.; Ross, C.F. Eye shape and activity pattern in birds. J. Zool. 2007, 271, 437–444. [Google Scholar] [CrossRef]
- Wilman, H.; Belmaker, J.; Simpson, J.; de la Rosa, C.; Rivadeneira, M.M.; Jetz, W. EltonTraits 1.0: Species-level foraging attributes of the world’s birds and mammals. Ecology 2014, 95, 2027. [Google Scholar]
- Tobias, J.A.; Sheard, C.; Pigot, A.L.; Devenish, A.J.M.; Yang, J.X.; Sayol, F.; Neate-Clegg, M.H.C.; Alioravainen, N.; Weeks, T.L.; Barber, R.A.; et al. AVONET: Morphological, ecological and geographical data for all birds. Ecol. Lett. 2022, 25, 581–597. [Google Scholar] [CrossRef]
- McNeil, R.; Drapeau, P.; Goss-Custard, J.D. The occurrence and adaptive significance of nocturnal habits in waterfowl. Biol. Rev. 1992, 67, 381–419. [Google Scholar] [CrossRef]
- McNeil, R.; Drapeau, P.; Pierotti, R. Nocturnality in colonial waterbirds: Occurrence, special adaptations and suspected benefits. In Current Ornithology; Power, D.M., Ed.; Plenum Press: New York, NY, USA, 1993; pp. 187–246. [Google Scholar]
- Revell, L.J. Phytools: An R package for phylogenetic comparative biology (and other things). Methods Ecol. Evol. 2012, 3, 217–223. [Google Scholar] [CrossRef]
- Ho, S.L.T.; Ane, C.; Lachlan, R.; Tarpinia, K.; Feldman, R.; Yu, Q.; van der Bijl, W.; Maspons, J.; Vos, R. Package ‘Phylolm’ v. 2.6.2. 2020. Available online: https://github.com/lamho86/phylolm (accessed on 1 May 2023).
- Hackett, S.J.; Kimball, R.T.; Reddy, S.; Bowie, R.C.K.; Braun, E.L.; Braun, M.J.; Chojnowski, J.L.; Cox, W.A.; Han, K.L.; Harshman, J.; et al. A phylogenomic study of birds reveals their evolutionary history. Science 2008, 320, 1763–1768. [Google Scholar] [CrossRef]
- Paradis, E.; Claude, J.; Strimmer, K. APE: Analyses of Phylogenetics and Evolution in R language. Bioinformatics 2004, 20, 289–290. [Google Scholar] [CrossRef]
- O’Brien, R.M. A caution regarding rules of thumb for variance inflation factors. Qual. Quant. 2007, 41, 673–690. [Google Scholar] [CrossRef]
- Ives, A.R.; Li, D. rr2: An R package to calculate R^2s for regression models. J. Open Source Softw. 2019, 3, 1028. [Google Scholar] [CrossRef]
- Langerhans, R.B.; Layman, C.A.; Shokrollahi, A.M.; DeWitt, T.J. Predator-driven phenotypic diversification in Gambusia affinis. Evolution 2004, 58, 2305–2318. [Google Scholar]
- Glazier, D.S.; Deptola, T.J. The amphipod Gammarus minus has larger eyes in freshwater springs with numerous fish predators. Invertebr. Biol. 2011, 130, 60–67. [Google Scholar] [CrossRef]
- Beston, S.M.; Wostl, E.; Walsh, M.R. The evolution of vertebrate eye size across an environmental gradient: Phenotype does not predict genotype in a Trinidadian killifish. Evolution 2017, 71, 2037–2049. [Google Scholar] [CrossRef]
- Liu, Y.; Ding, L.; Lei, J.; Zhao, E.; Tang, Y.P. Eye size variation reflects habitat and daily activity patterns in colubrid snakes. J. Morphol. 2012, 273, 883–893. [Google Scholar] [CrossRef]
- Hall, M.I.; Heesy, C.P. Eye size, flight speed and Leuckart’s Law in birds. J. Zool. 2011, 283, 291–297. [Google Scholar] [CrossRef]
- Wiersma, P.; Muñoz-Garcia, A.; Walker, A.; Williams, J.B. Tropical birds have a slow pace of life. Proc. Natl. Acad. Sci. USA 2007, 104, 9340–9345. [Google Scholar] [CrossRef]
- Thiollay, J.-M.; Jullien, M. Flocking behaviour of foraging birds in a neotropical rain forest and the antipredator defence hypothesis. Ibis 1998, 140, 382–394. [Google Scholar] [CrossRef]
- Barrowclough, G.F.; Cracraft, J.; Klicka, J.; Zink, R.M. How many kinds of birds are there and why does it matter? PLoS ONE 2016, 11, e0166307. [Google Scholar] [CrossRef]
- Veilleux, C.C.; Kirk, E.C. Visual acuity in Mammals: Effects of eye size and ecology. Brain Behav. Evol. 2014, 83, 43–53. [Google Scholar] [CrossRef] [PubMed]
- Fernández-Juricic, E. Sensory basis of vigilance behavior in birds: Synthesis and future prospects. Behav. Proc. 2012, 89, 143–152. [Google Scholar] [CrossRef] [PubMed]
Disclaimer/Publisher’s Note: The statements, opinions and data contained in all publications are solely those of the individual author(s) and contributor(s) and not of MDPI and/or the editor(s). MDPI and/or the editor(s) disclaim responsibility for any injury to people or property resulting from any ideas, methods, instructions or products referred to in the content. |
© 2023 by the author. Licensee MDPI, Basel, Switzerland. This article is an open access article distributed under the terms and conditions of the Creative Commons Attribution (CC BY) license (https://creativecommons.org/licenses/by/4.0/).