Article

Evaluation of Accuracy and Precision of the Sound-Recorder-Based Point-Counts Applied in Forests and Open Areas in Two Locations Situated in a Temperate and Tropical Regions

Department of Behavioural Ecology, Faculty of Biology, Adam Mickiewicz University in Poznań, Uniwersytetu Poznańskiego 6, 61614 Poznań, Poland
*
Author to whom correspondence should be addressed.
Birds 2021, 2(4), 351-361; https://doi.org/10.3390/birds2040026
Submission received: 7 September 2021 / Revised: 16 October 2021 / Accepted: 19 October 2021 / Published: 21 October 2021
(This article belongs to the Special Issue Feature Papers of Birds 2021)

Abstract

:

Simple Summary

Counting from points is one of the most popular techniques for surveying birds, and it is applied in various environments, from polar to tropical regions. Across such a wide range of environmental conditions, the effectiveness of this method may vary considerably. In this study, we applied autonomous sound recorders to examine whether effectiveness of the method in bird biodiversity estimation differ depending on the geographical region (tropical vs. temperate), habitat type (forest vs. open area) and the time of day at which the survey began. We found that point-counts provided statistically indistinguishable estimates of bird biodiversity in different geographical regions and habitats. However, during a single 5-min survey, only 41–54% of species present at the recording site were detected. Independent of the region or habitat type, we recorded significantly more species at sunrise than during later surveys. Our study showed that point-counts provided similar estimates of bird biodiversity in various habitat types and geographical regions. At the same time, the low proportion of detected species during a single survey limits the usefulness of the method in studying bird–environment relationships (e.g., habitat preferences), while decreasing number of detected species across the day may result in the misinterpretation of the status of bird populations when early and late surveys are compared without controlling this factor.

Abstract

The point-count method is one of the most popular techniques for surveying birds. However, the accuracy and precision of this method may vary across various environments and geographical regions. We conducted sound-recorder-based point-counts to examine the accuracy and precision of the method for bird biodiversity estimation as a function of geographical region, habitat type and the time of day at which the survey began. In temperate (Poland) and tropical (Cameroon) regions, we recorded soundscapes on two successive mornings at 36 recording sites (18 in each location). At each site, we analyzed three 5-min surveys per day. We found no differences in the accuracy and precision of the method between regions and habitats. The accuracy was significantly greater at sunrise than during later surveys. The similarity of the bird assemblages detected by different surveys did not differ between regions or habitats. However, the bird communities described at the same time of day were significantly more similar to each other than those detected by surveys conducted at different times. The point-count method provided statistically indistinguishable estimates of bird biodiversity in different geographical regions and habitats. However, our results highlight two weaknesses of the method: low accuracy (41–54%), which limits the usefulness of a single survey in understanding bird–environment relationships, and changes in accuracy throughout the day, which may result in the misinterpretation of the status of bird populations.

1. Introduction

The point-count method is one of the most popular techniques for surveying birds, used for estimating abundance, density, species richness, distribution, and relations between birds and environment [1,2,3]. However, this method does not provide real values but estimates of measured parameters [4,5]. Therefore, knowing the accuracy and precision of any applied variants of the method for surveying birds is important. Accuracy describes how close the estimate is to the true value, whereas precision is a measure of how close replicated estimates are to each other and is unrelated to the true value of species abundance or distribution [5].
For point-counts, accuracy and precision in the context of species richness estimation are influenced by the detectability of particular species in a bird community [5]. Detectability of a species is determined by the detection probabilities of each individual present in a given area (D = 1 − (1 − p)N, where D = detectability of a species, p = probability of detecting an individual, and N = number of individuals), which varies among species and depends on a number of variables, including specific behavior (e.g., secretive vs. vociferous), territory size, habitat (open vs. closed), and inhabited vegetation layer (understory vs. emergent layer) [6,7]. Thus, by applying a given set of methodological assumptions (e.g., constant detection distance, time and duration of survey, observer skills, and weather conditions), different species are detected with different probabilities [8].
Point-counts have been used to survey birds in a variety of habitats, ranging from dense forests to completely open areas, and from polar to tropical regions [9,10]. These environments have species that differ in detection probability during a single survey, and the combination of detection probabilities of the species reflects the effectiveness of the surveying method in the context of the whole bird community within the studied environment. Therefore, we may expect variation in the precision and accuracy of the point-counts in different habitats and geographical regions, even when the same methodological assumptions are applied. Moreover, typical monitoring schemes assume that field surveys are conducted in a specific period of the season (e.g., one month) and time of day (e.g., from one hour before sunrise to four hours after sunrise). Such assumptions lead to inconsistencies in the accuracy and precision of the method, since the probability of species detection varies daily and seasonally.
Differences in detectability have been characterized for many bird species, especially in temperate regions [7,8,11,12]. However, most studies have focused on a single geographical region, a single type of environment, or a selected species from the whole bird assemblage. Therefore, it is important to know how effective point-counts are in estimating bird species’ richness, assuming that the same methodological assumptions are applied under different environmental conditions and geographical regions.
We focused on the accuracy and precision of the acoustic-recorder-based point-count method for estimating breeding bird species’ richness in forests and open habitats of tropical and temperate regions. The detectability of a species strongly depends on survey methods, e.g., survey duration, time of day, stage of the breeding season, weather conditions, the size of the area sampled around points, and the skill and experience of observers [4,11,13,14,15]. For this reason, we standardized the survey method. In both locations, we surveyed birds in the peak of the breeding season of most species and maintained constant survey duration, time of day, and detection range for the species within recording site. However, detection distance varied between species due to differences in species’ frequency ranges and amplitude influencing the effective detection distances, and it varied between habitats, because effective detection distance is shorter in open habitats than in forests. We also minimized the effect of the observer’s skills and applied a standardized approach throughout the study. We replaced human-observers surveying birds in the field within unlimited distance with autonomous sound recorders. Autonomous sound recorders enable users to record soundscapes and are a promising alternative to human-based point-counts for estimation of abundance, density, occupancy, or bird species’ richness [16,17]. Many investigators have compared the effectiveness of bird species’ richness estimated by autonomous sound recorders and human-based point-counts. The results showed higher effectiveness of human-observers [18], recorders [19], or no differences between methods [20]. This inconsistency may arise from three factors: varying skills of the observers who surveyed birds in the field (low-skilled observers should support recorders), varying detection ranges applied by observers (unlimited radius should support observers), and different types of habitats in which comparisons were made. However, a recent meta-analysis showed that bird species’ richness estimated by human-observers and autonomous sound recorders surveying birds at the same time is statistically indistinguishable when detection distance is controlled [21]. One reason is that human-observers, especially in forest habitats, detect most birds by using auditory cues [22]. Thus, in our study, autonomous sound recorders should provide a similar estimate of bird species’ richness as human-observers. Applying autonomous sound recorders allowed us to survey birds at the same time at multiple sites. Using the same model of sound recorder, we kept the detection range constant at the recording sites (generally shorter than that of a human-observer without distance limitation; [23]) and, most importantly, minimized the effect of observer’s skills and experience. In the field, observers may not detect or may incorrectly identify a species, and these sources of error can bias the results of a study [24,25]. We analyzed soundscape recordings in the lab, so we were able to listen to them many times and compare vocalizations with samples from sound libraries when we had difficulty identifying species.
Our objective was to examine the precision and accuracy of the recorder-based point-count method in estimating breeding bird species’ richness in two different geographical regions (temperate vs. tropical), two different habitat conditions (forest vs. open), and at different times of day (sunrise and one and two hours after sunrise). Our goal was not to optimize the method or estimating bird biodiversity for a given location but to assess how well a particular variant of the method works in different environmental conditions, and how the time of the survey influences estimated bird-species richness from the perspective of an individual recording site and a single survey.

2. Materials and Methods

2.1. Study Area

We conducted our study in two locations (Tables S1 and S2), representing a temperate region (Upper Nurzec River Valley, eastern Poland; coordinates: N52.597521°, E23.230633°) and a tropical region (Bamenda Highlands, Northwest Cameroon; coordinates: N6.090594°, E10.298807°).
The Upper Nurzec River Valley is a ~4000 ha Important Bird Area of international importance in Poland (PL056), protected as part of the Natura 2000 conservation network [25]. This area has temperate climate, with warm summers (an average temperature in June is 18 °C) and cold winters (an average temperature in January is −6 °C). Annual precipitation in the region oscillates from 600 to 700 mm, and annual mean temperatures are from 8.7 °C to 9.3 °C [26]. The Upper Nurzec River Valley is a compact complex of drained alluvial agricultural meadows and wastelands, with low coverage by forests and arable fields, located at elevations from 144 to 162 m a.s.l. The number of breeding bird species was estimated to be 111 [27], the breeding season for most species extends from beginning of April to the end of June [28], and most bird species leave the area for the winter.
The Bamenda Highlands are part of the Cameroon Mountains Endemic Bird Area [29]. This area has a short dry season (from November to February) and a long wet season (March–October; [30]). Annual precipitation ranges from 2300 to 3000 mm, and annual mean temperatures range from 18.7 °C to 21.0 °C [31]. Our study area covered a non-protected area of ~400-ha located near the village of Big Babanki (Northwest Region, Cameroon; 1824–2340 m a.s.l). The habitat consisted of a mosaic of fragments of upper montane rainforests, woodlands, forest clearings, stream corridors, shrub vegetation, pastures, and abandoned lands under succession by shrubs and ferns. In our study location, most species of birds breed during the dry season, from October to March [32,33]. The local breeding bird community included an estimated 109 species [33]; most of them are resident.

2.2. Soundscape Recording and Analysis

We used Song Meter SM2 autonomous sound recorders (two omnidirectional microphones SMX-II, signal-to-noise ratio > 62 dB; Wildlife Acoustics) to collect soundscape recordings in the Bamenda Highlands, and Song Meter SM3 recorders (two omnidirectional microphones SMM-A1, signal-to-noise ratio > 68 dB; Wildlife Acoustics) in the Upper Nurzec River Valley. The detection range of recorders is generally shorter than the human detection range; is species-specific (species producing lower-frequency and louder sounds are detected from a further distance); and depends on vegetation type (detection range is longer in open habitats than in forests), humidity (positive effect on detection range), and wind conditions (negative effect on detection range) [23]. The comparison of the two models of recorders we used suggests that SM2 has a slightly shorter effective detection range than SM3, but the difference depends on frequency of sound and habitat type [23]. However, for the purpose of the study, we did not apply a correction for effective detection distance related with species, recorder and vegetation type, humidity, and wind. At each location, we recorded soundscapes at 18 randomly chosen recording sites, including nine located in forests and nine in open areas. We defined forests as an area of land dominated by trees, whereas open areas included meadows, pastures, and abandoned lands with herbaceous vegetation, ferns, or shrubs. Recorders were attached to shrubs or trees between 2 and 5 m aboveground. We collected soundscape data on two successive mornings at each site when weather conditions were suitable (no rain or strong wind). We used the same recording settings at both locations (stereo recordings, 16-bit PCM WAV recording format, and 48.0 kHz sample rate; no low- or high-pass filter applied).
In the Bamenda Highlands, we recorded soundscapes from 16 November to 12 December 2010 (14 recording sites) and 2011 (four recording sites), corresponding to the beginning of the breeding season in this region [33]. The average linear distance between neighboring recording sites was 287 m (range = 89–630 m; the closest recording sites were located on opposite sides of a hillcrest, so soundscapes did not overlap). In the Upper Nurzec Valley, we recorded soundscapes from 3 to 7 May 2018, corresponding to the beginning of the breeding season for most bird species [28]. The average linear distance between neighboring recording sites was 568 m (range = 334–1212 m).
At each recording site, we selected and analyzed three sound samples, each 5-min long, per day, that began at sunrise, one hour after sunrise, and two hours after sunrise (early, intermediate, and late survey, respectively). A 5-min survey duration is often used by human-observers to survey birds in the field, and this duration is usually sufficient to determine the structure of a bird community [34]. In total, at each recording site, we analyzed 30 min of soundscape recordings (3 per day × 5 min × 2 days), using Avisoft SAS Lab Pro 5.2.13 software. We generated spectrograms with the following settings: FFT length = 1024, frame size = 75%, Window = Hamming, and overlap = 50%. We then manually scanned spectrograms and listened to recordings to detect and identify all bird vocalizations. Recordings were analyzed by two experienced observers (KK—recordings from Upper Nurzec River Valley; MB—recordings from Bamenda Highlands). When we had difficulties with species identification, we compared the unknown sound with examples of bird vocalizations from www.xeno-canto.org, accessed on 21 October 2021 (Xeno-Canto Foundation). For each 5-min recording, we prepared a list of species detected.

2.3. Statistical Analyses

First, we determined if the number of bird species detected at a recording site depended on the region where the survey was conducted (tropical vs. temperate), the habitat type (forest vs. open area), the day of survey (first or second), or the time of day (early, intermediate, or late). For this, we used generalized estimating equations (GEEs). GEEs extend the generalized linear model to allow for analysis of repeated measurements or other correlated observations [35]. In the model, we used the number of detected bird species as the dependent variable, and region, habitat, day, and time of survey as predictors. In the GEEs, we specified each recording site as a subject variable, and survey as a within-subject variable. Data were fitted by a negative binomial distribution with a log-link function.
In the second step, we estimated the accuracy of a single survey by calculating the ratio of the number of bird species detected during a single survey to the total number of bird species detected during all six surveys at the recording site. Our assumption was that, over the course of six surveys, we would detect almost all species breeding around the recording site, but not all. We then applied GEEs to determine if the accuracy of a single 5-min survey differed between regions, habitats, days, or times of day. Again, we specified the recording site as a subject variable, and survey as a within-subject variable in the GEEs. Data were fitted by a gamma distribution with a log-link function.
To compare the precision of applied recorder-based point-count method (i.e., the repeatability of results delivered by different point-counts conducted in the same recording site) between habitats and regions, we calculated the standard error of the mean number of species recorded in each recording site over the six surveys [5]. We then created a generalized linear model (GLM) with this value as the dependent variable, and region and habitat type as predictors. Data were fitted by a gamma distribution and log-link function.
In the last step, we compared the similarity of the bird assemblages that were detected in the different surveys conducted at the same recording site. For this, we applied a measure commonly used to compare species composition between two communities: Sørensen similarity index [36]. In our case, Sørensen similarity index (QS = 2C/(A + B)) counted the number of bird species recorded during each of two surveys at a recording site (Survey A and B), and the number of bird species detected by both (C). QS values can range from 0 (no bird species were detected by both surveys) to 1 (all bird species were observed during both surveys). We compared all possible combinations of surveys at the recording site (six surveys per recording site; ten combinations). We then applied GEEs to examine whether QS varied between regions, habitat types, days of survey, and times of survey. We specified the recording site as a subject variable, and comparison ID as a within-subject variable. Data were fitted by a normal distribution with identity link function. All statistical analyses were performed in IBM SPSS Statistics 26. We assumed a significance level of α = 0.05, and the tests were two-tailed.

3. Results

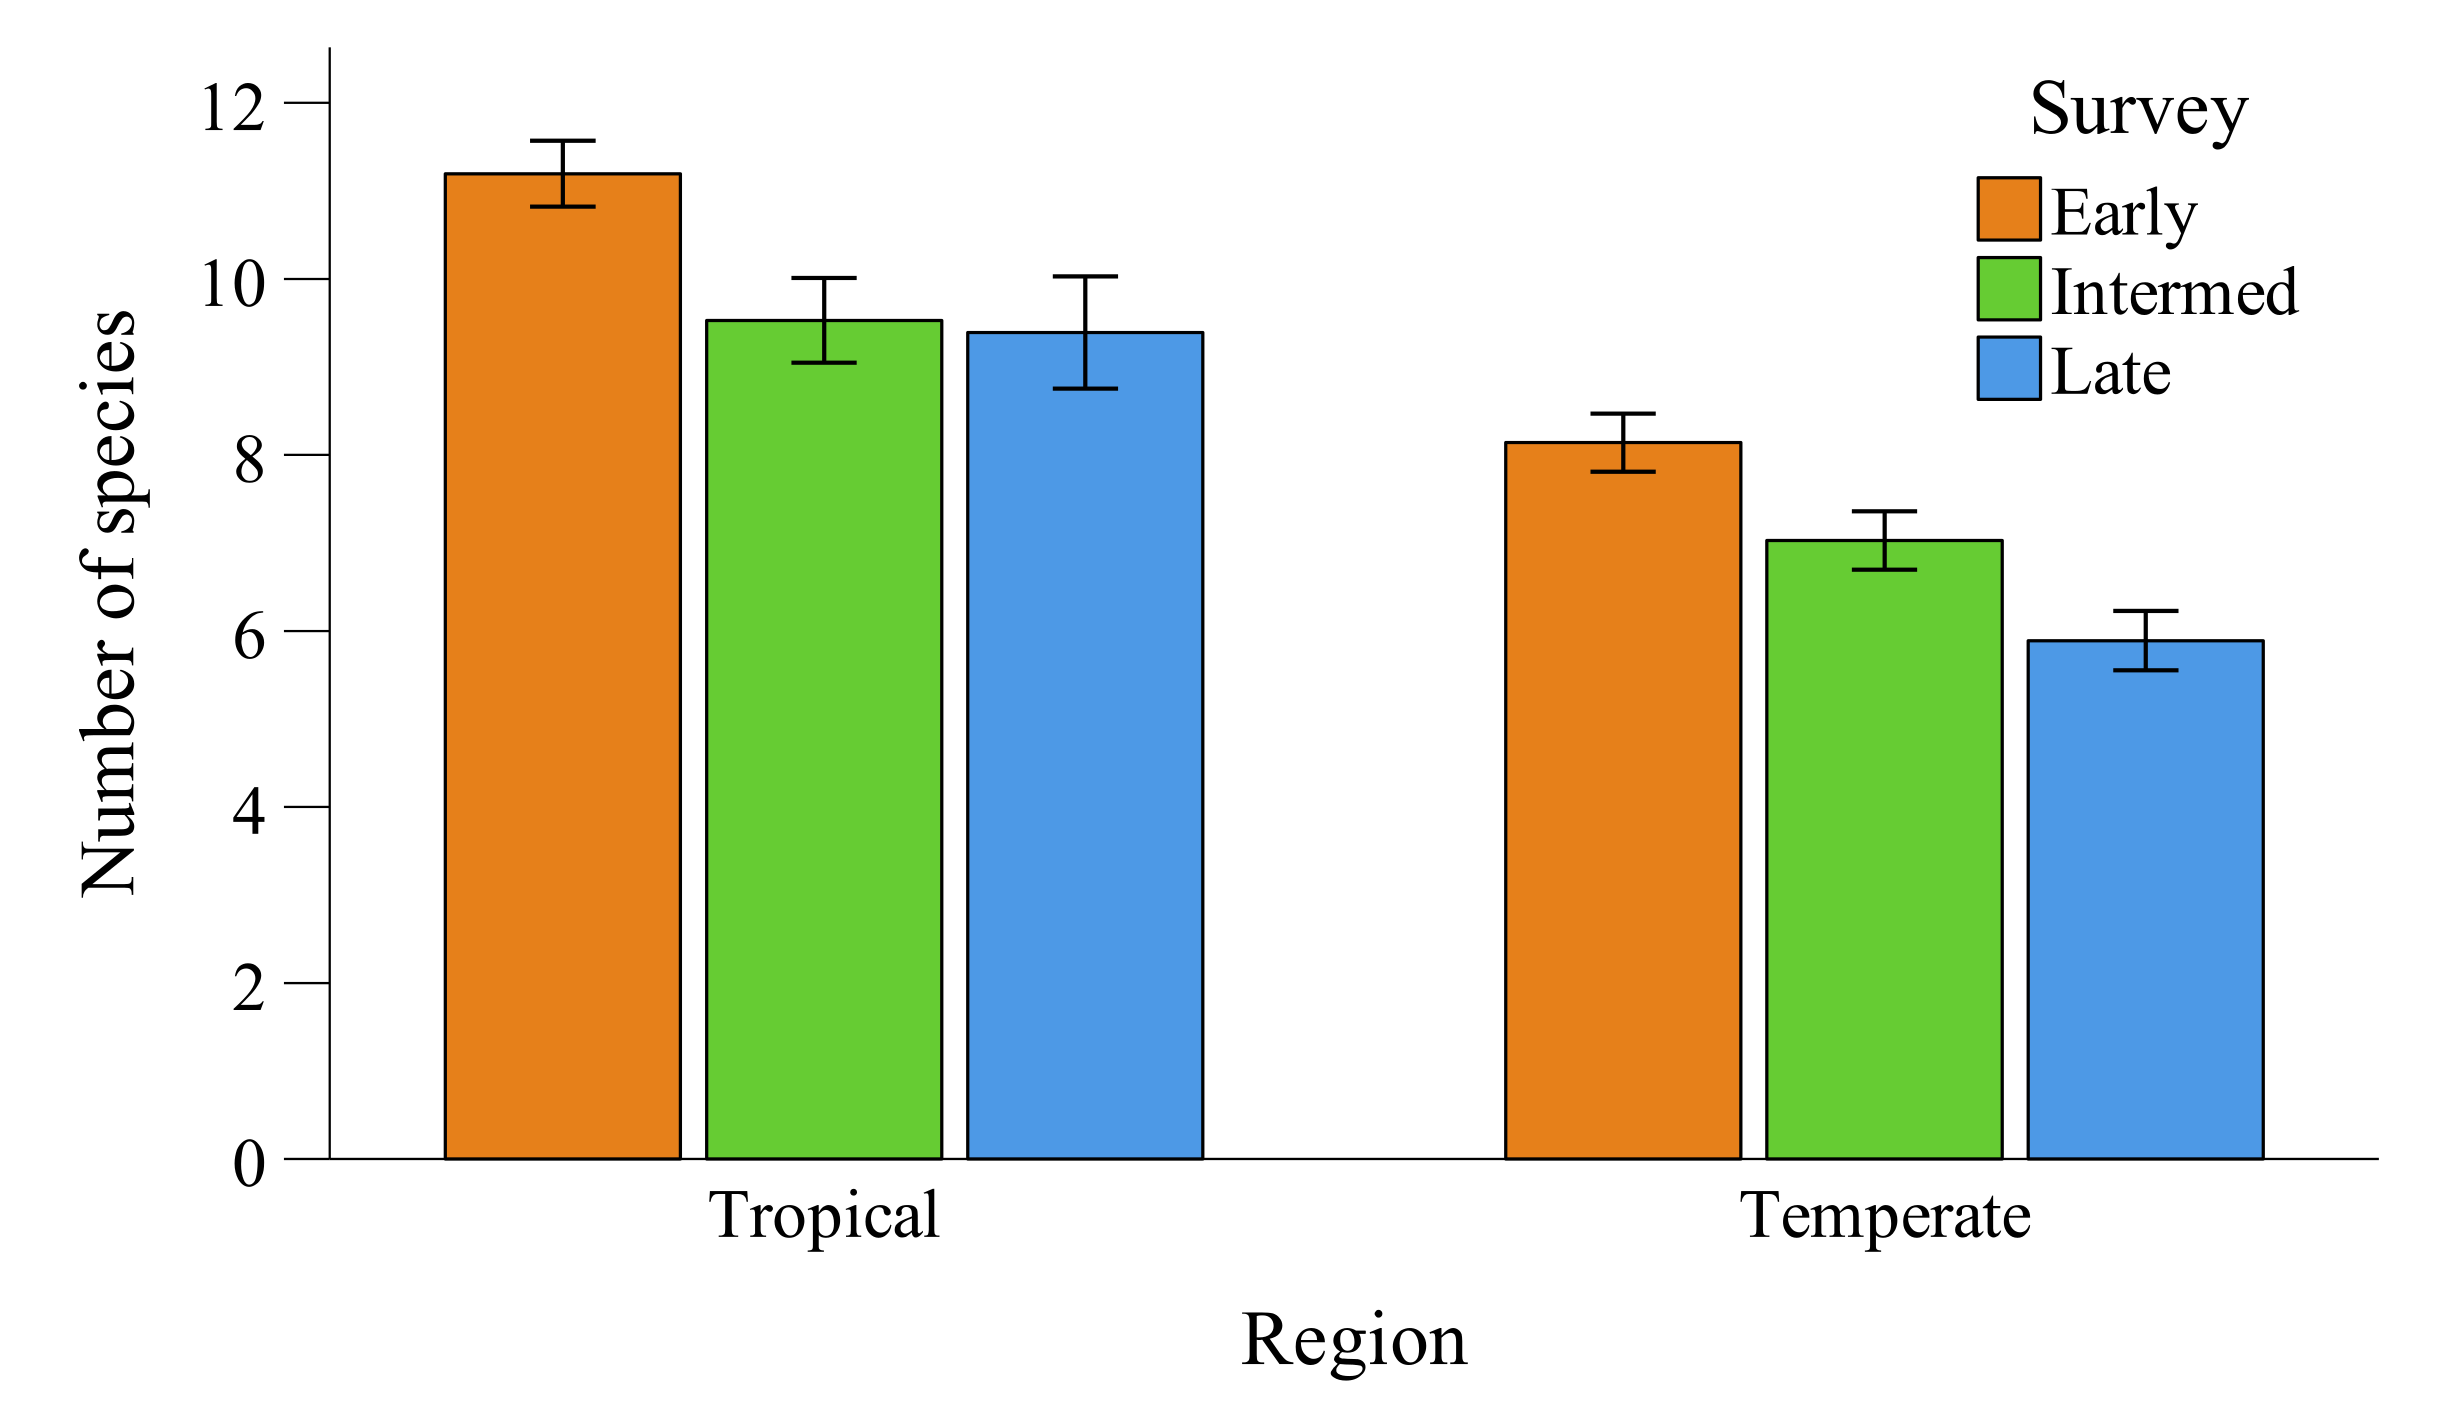
3.1. Species Richness

We recorded 51 bird species in the tropical region and 54 in the temperate region. On average, we observed 21.3 ± 3.8 species per recording site at the tropical region and 14.9 ± 2.1 at the temperate region (Mann–Whitney test: Z = −4.196, p < 0.001). During a single survey, we recorded an average of 10.0 ± 3.1 species at tropical sites and 7.0 ± 2.2 at temperate regions (Mann–Whitney test: Z = −7.709, p < 0.001, Supplementary Materials Tables S1 and S2).
The GEE-based analysis revealed that the number of birds detected during 5-min surveys differed significantly by region (Wald χ2 = 26.5, p < 0.001) and time of survey (Wald χ2 = 28.1, p < 0.001), but not by habitat (Wald χ2 = 0.03, p = 0.87) or day of survey (Wald χ2 = 0.002, p = 0.96). We recorded significantly more species per survey in the tropical region than the temperate region, and during surveys conducted at sunrise than one or two hours after sunrise (Table 1 and Figure 1).

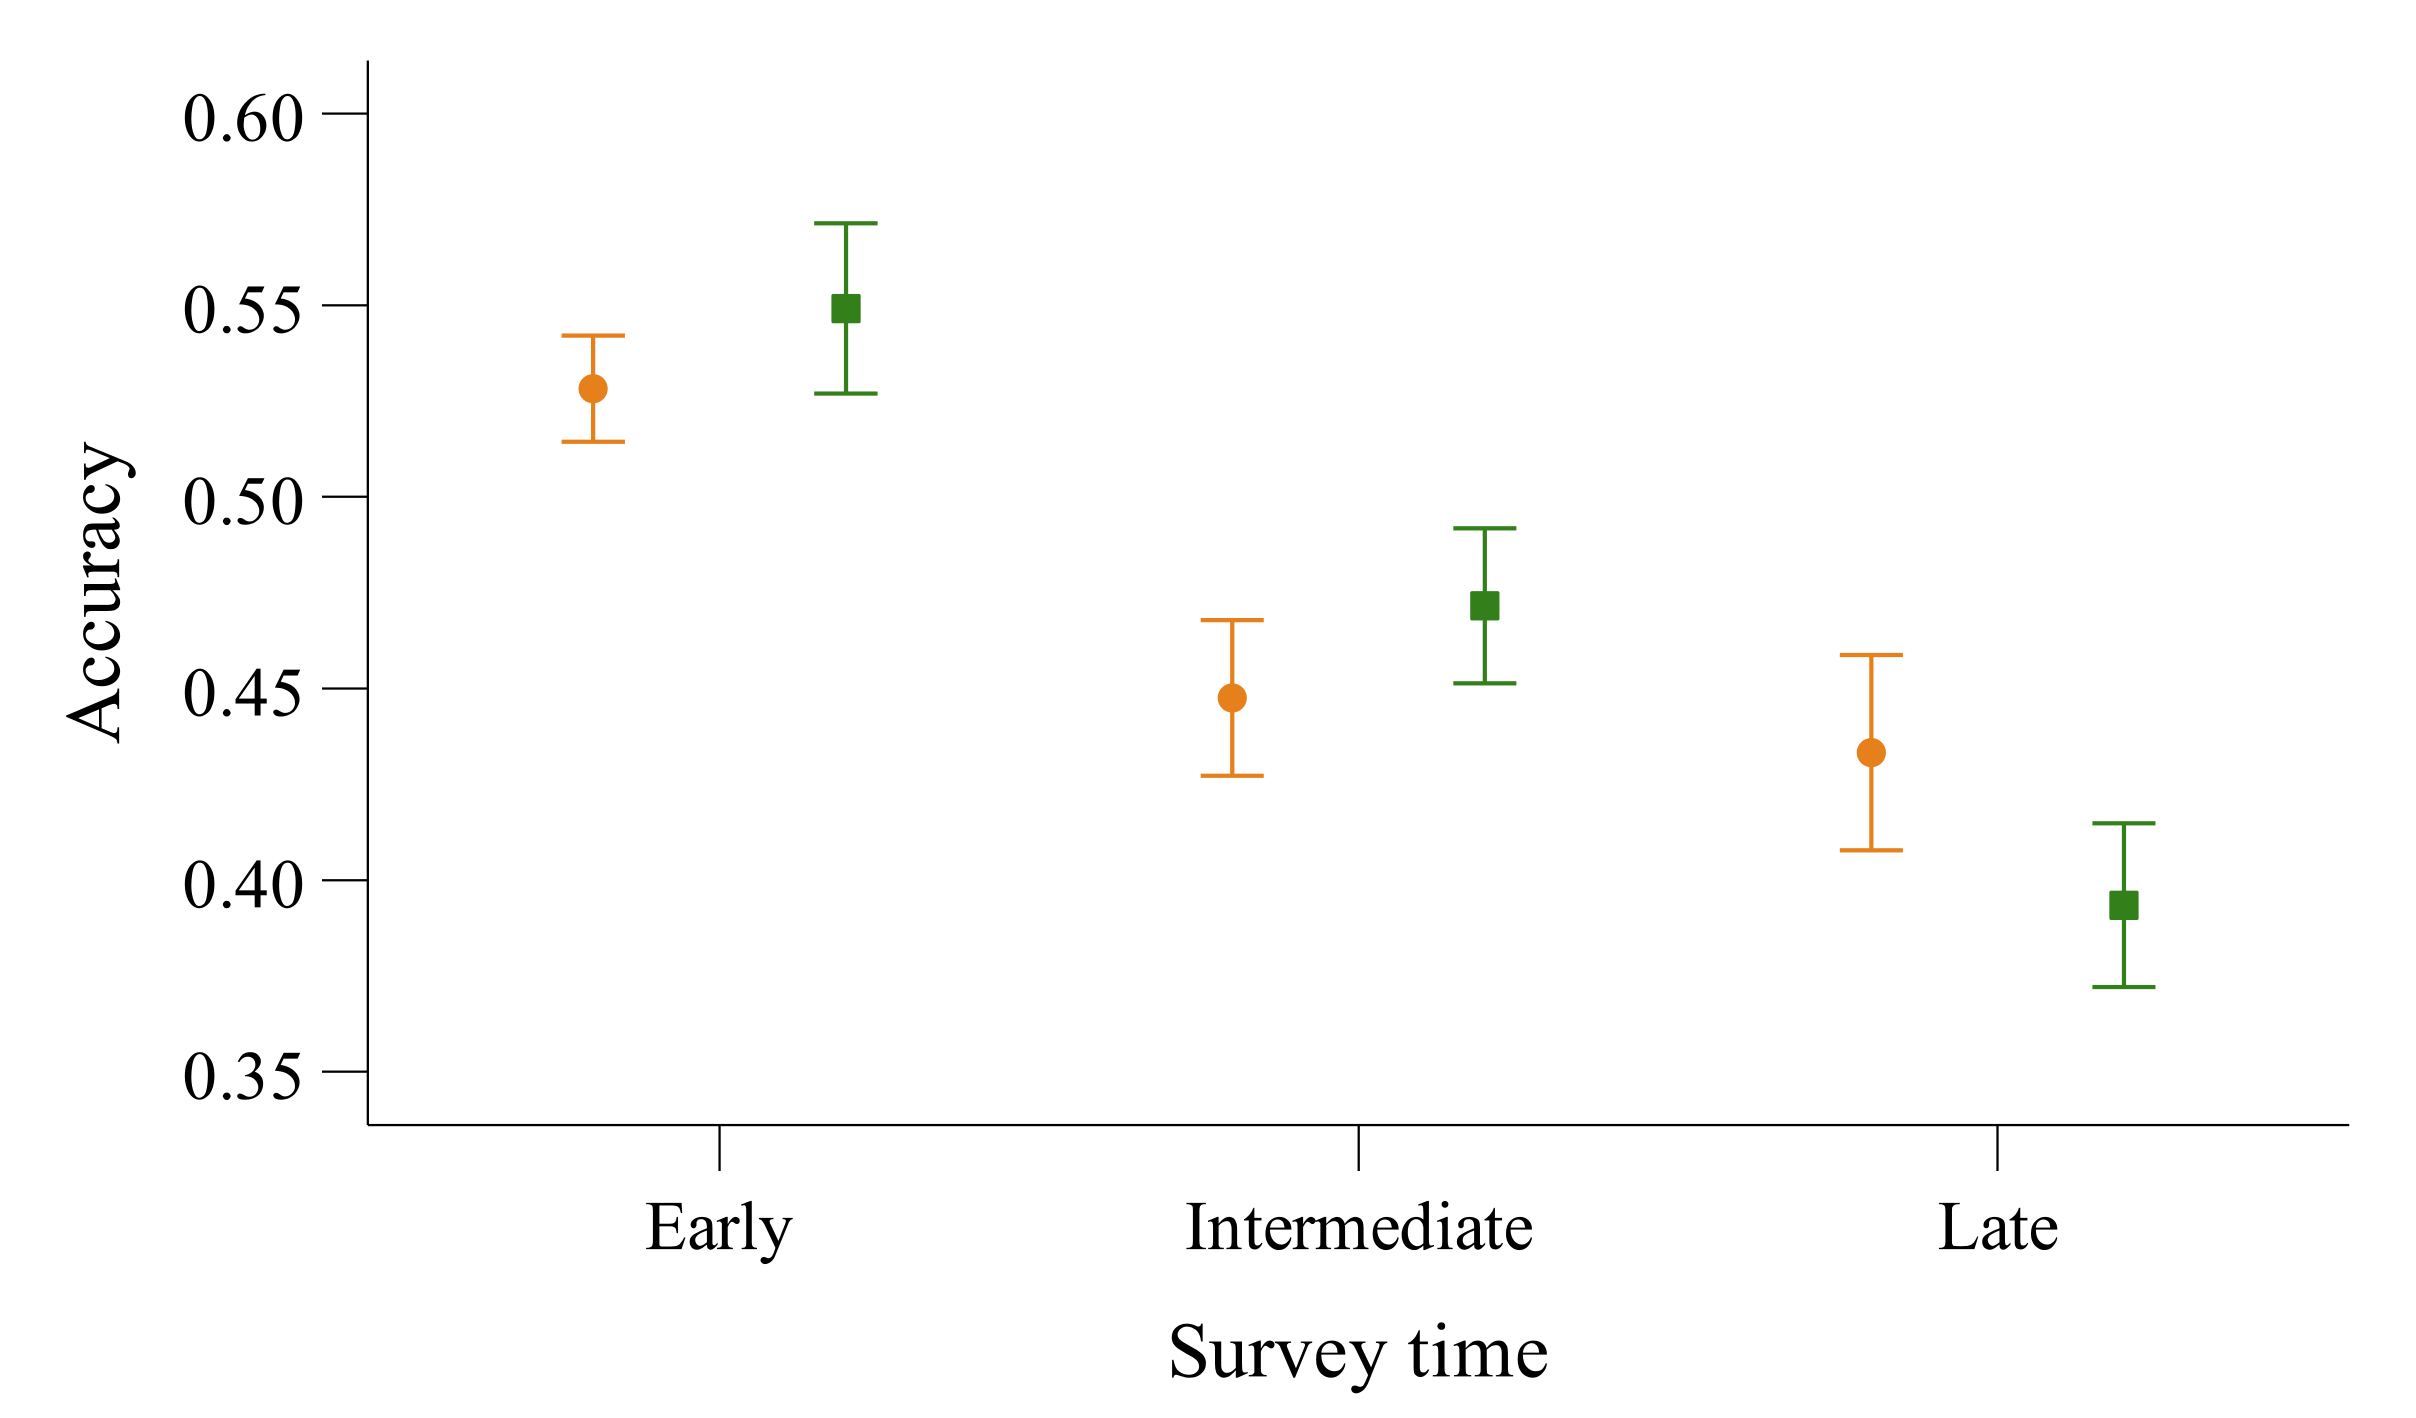
3.2. Accuracy and Precision of 5-min Surveys

We found that the accuracy of a given survey depended on the time of the survey (Wald χ2 = 28.9, p < 0.001), but not on region (Wald χ2 = 0.003, p = 0.96), habitat (Wald χ2 = 0.4, p = 0.84), or day (Wald χ2 = 0.1, p = 0.83). Accuracy was significantly higher at sunrise (54% of bird biodiversity detected) than one or two hours after sunrise (46% and 41% of bird biodiversity detected, respectively; Table 2 and Figure 2). We found no differences in the precision of surveys either between regions (Wald χ2 = 1.2, p = 0.28) or habitats (Wald χ2 = 0.01, p = 0.92). The average precision (measured as a standard error of the six surveys conducted at recording site) was 0.84 in the tropical region and 0.72 in the temperate region.

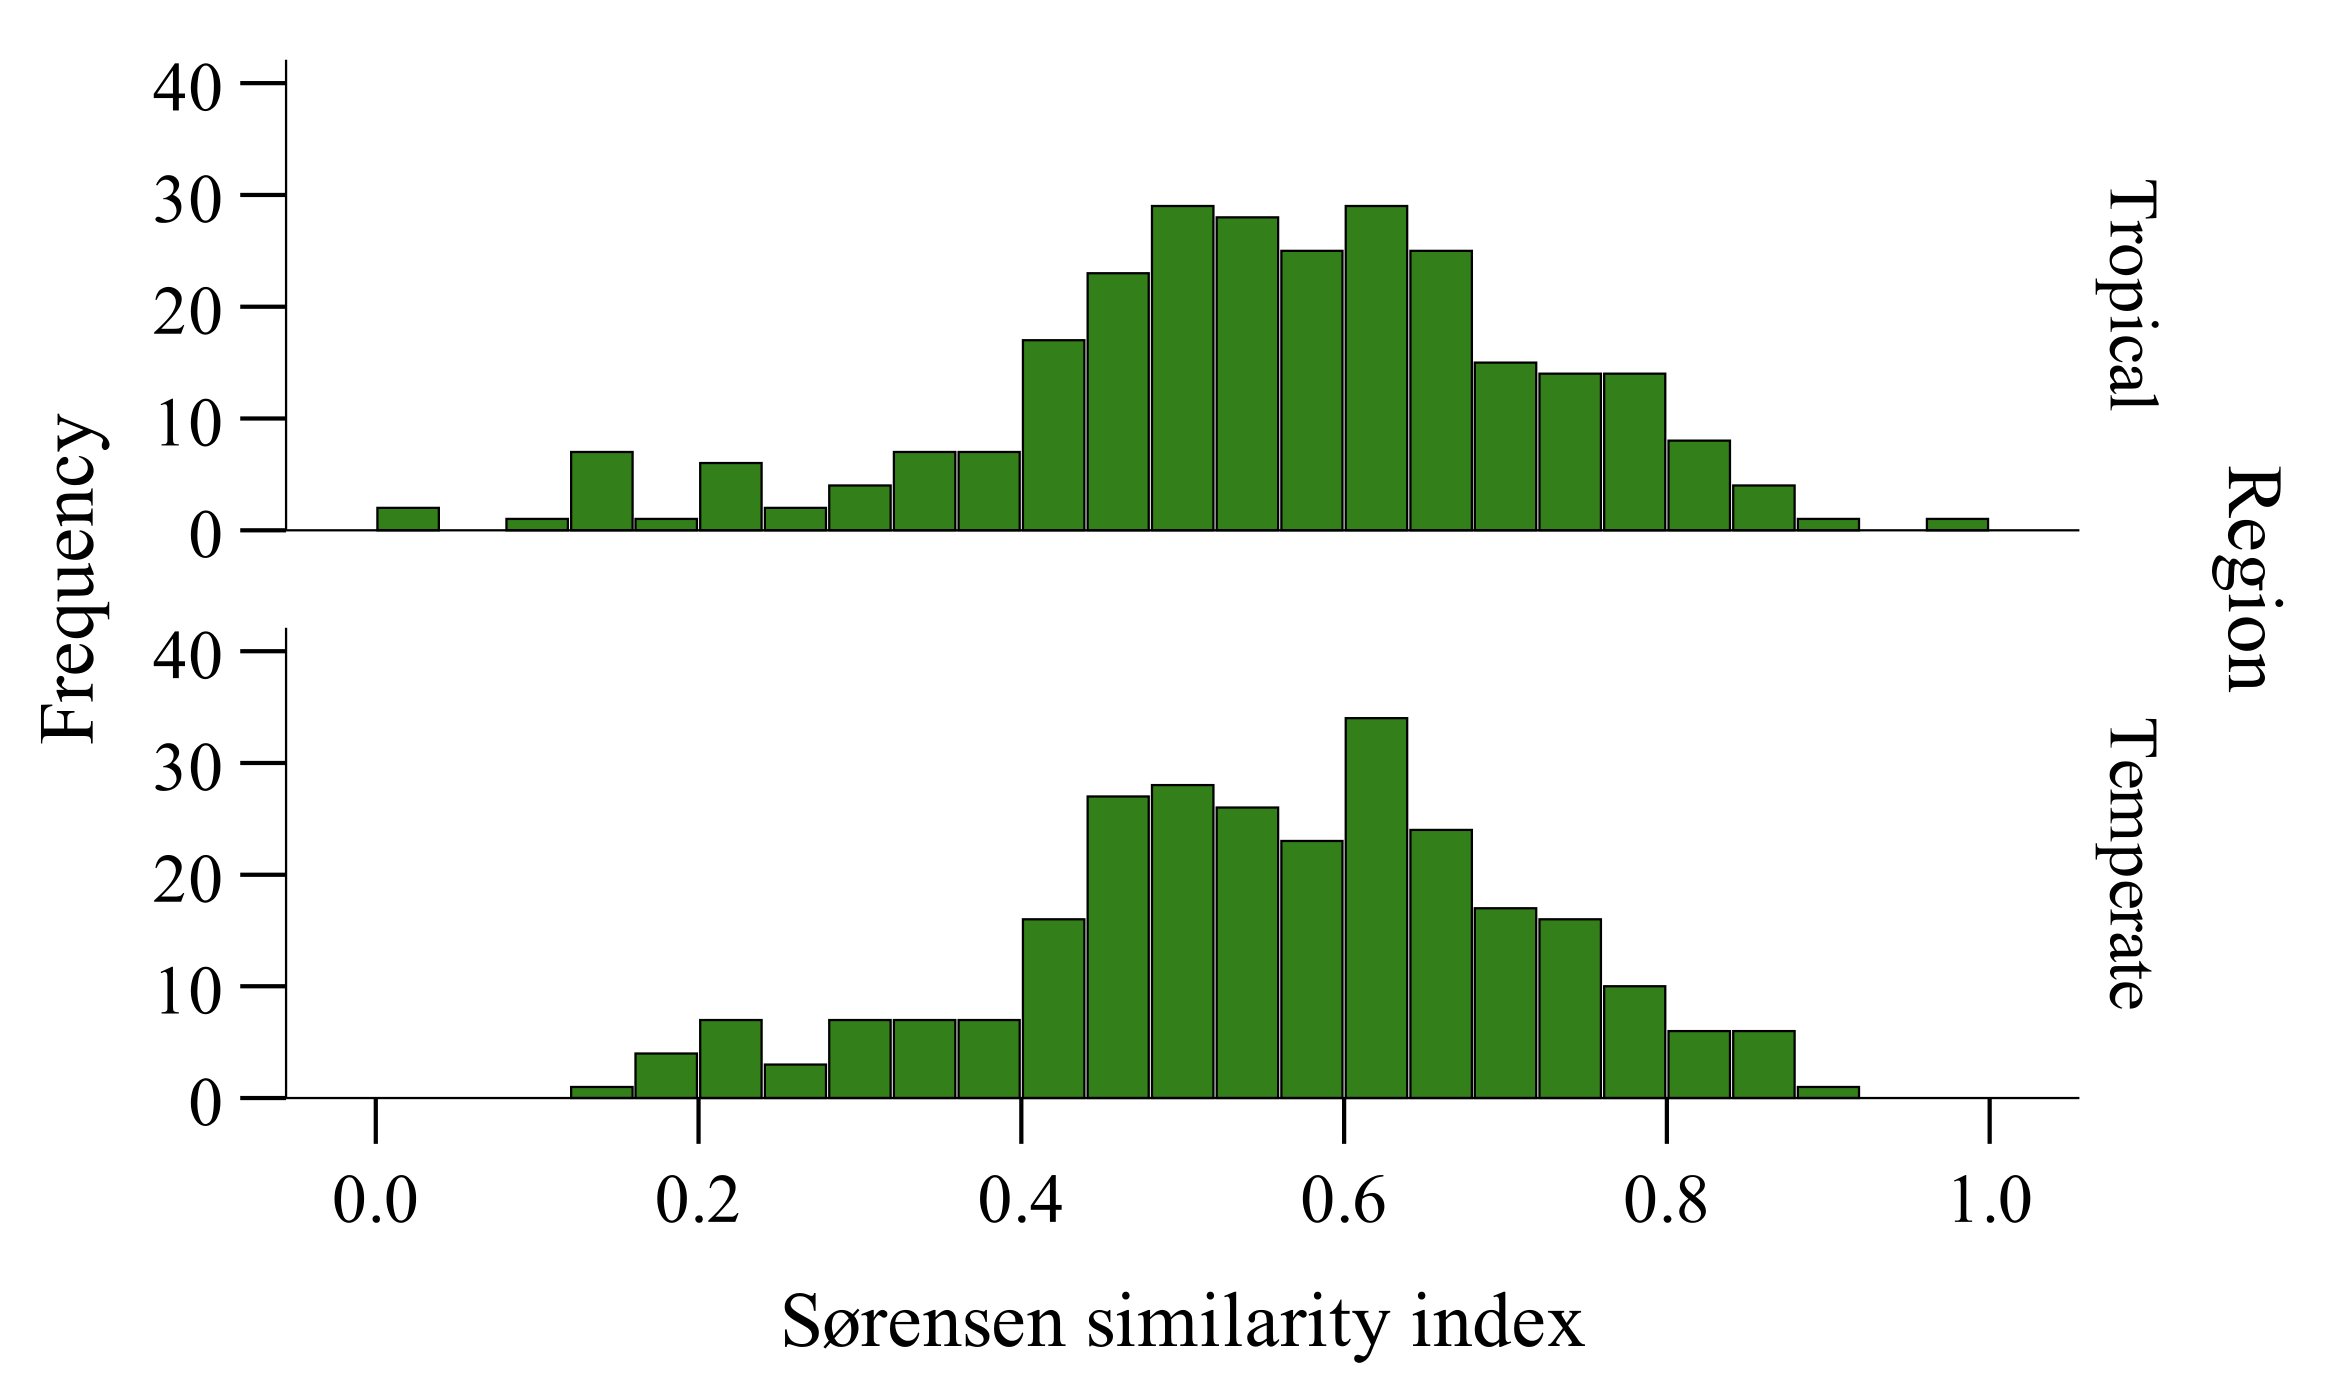
3.3. Species Composition

The average value of Sørensen similarity index for any two surveys at a recording site was 0.55 at tropical sites (range = 0–1) and 0.56 at temperate sites (range = 0.15–0.89) (Figure 3). No differences were found between tropical and temperate regions (Wald χ2 = 0.02, p = 0.89) or between forests and open habitats (Wald χ2 = 0.3, p = 0.59). However, we found that similarity values depended significantly on whether the two surveys were conducted on the same day (Wald χ2 = 6.4, p = 0.012) or the same time of day (Wald χ2 = 23.0, p < 0.001). Similarity was significantly lower for surveys conducted on the same day than on different days, and it was significantly higher for surveys conducted at the same time of day than at different times of the day (Table 3).

4. Discussion

We detected no differences in the accuracy or precision of the recorder-based point-count method, either between tropical and temperate regions or between forests and open habitats. Similarly, there was no effect of region or habitat on the species assemblage detected by multiple surveys at a given recording site (Sørensen similarity index). Thus, in the environments analyzed here, 5-min surveys provided estimates of bird-species richness that were statistically indistinguishable between regions and habitats. Our results are based on a specific approach where a human-observer surveying birds within unlimited radius was replaced by an autonomous sound recorder. Therefore, by using our method, we were unable to detect silent species that can be recorded visually by observers [18], but this bias concerned analyzed regions. The difference may come from the varying numbers of silent species inhabiting different locations and generally greater likelihood of visually spotting birds in open habitats than in forests. If we assume that the detection distance is only slightly shorter for the recorders than for observers [23], that most birds are detected by auditory cues in the field [22], and that similar species richness estimations are obtained by recorders and observers [21], then we may generalize our results also to traditional human-based point-counts where bird species richness is estimated in an unlimited radius. In studied locations, the effectiveness of the same type of recorders was compared with human point-counts. Studies reported similar bird-species-richness estimation by human-observers and recorders in Cameroon [20] and in forests in Poland, but in open habitats in Poland, recorders detected a lower number of bird species than human-observers surveying birds at the same time [37]. During a single survey, we detected an average of 47% of the overall daily bird-species richness observed during two succeeding days at a given recording site. Correspondingly, estimates of community similarity between surveys, as quantified with Sørensen similarity index, were low (0.55–0.56). This degree of repeatability among surveys has been due to the specific methods used in our study—a 5-min survey. The accuracy and precision of single surveys have been shown to depend not only on their duration, time of day, and stage in the season, but also on the probabilities of detection of single species that make up a bird community [11,37,38]. Survey durations and stages of the breeding season from the perspective of a single recording site were constant in our study. Thus, variation in bird-species-richness estimation was mainly related to daily changing probabilities of detecting species that compose the bird community at a recording site. It means that, in all analyzed regions and habitat types, as in other studies (e.g., see References [39,40]), some species were easy to detect, while others were not, and the sum of probabilities of detection gave an estimation of species richness, which, in our study, did not differ between habitats. In our study, tropical and temperate locations varied in their size and the distance between neighboring recording sites. Therefore, we analyzed bird-species richness only at the recording site and did not compare species’ richness between whole locations. Additionally, the effectiveness of a single survey in our study was compared to the total number of bird species detected during six surveys conducted in two succeeding days in the morning hours.
Our results also highlight a more general problem, i.e., a single point-count survey has clear limitations for assessing the spatial distribution of particular species, such as in studies of site occupancy rates or habitat preferences [41,42]. This limitation especially applies to species with low detectability. In such cases, increasing either the duration (e.g., by applying autonomous sound recorders) or number of surveys in a season may improve detectability and increase the performance of models that seek to describe relationships between birds and environmental characteristics [40,43,44]. We showed that a single survey conducted at sunrise recorded more species than surveys conducted one or two hours after sunrise, but it was still only 54% of overall bird species detected at the recording site during six surveys conducted by two succeeding days. We are aware that, even when conducting six surveys, we were not able to detect all bird species present around recording sites, because we did not record soundscapes at night, for example. Autonomous sound recorders are well adapted for studying bird species’ richness. In the simplest approach, a single 24-h survey should allow for the detection of all vocalizing species present within the detection range of the recorders. Manual spectrogram scanning and listening to recordings are time-consuming, but appropriate sampling across whole days (e.g., 5 min every hour) should reduce the effort with a slight decrease of accuracy and give a good bird-species-richness estimation independently of the geographical region and habitat type. Sound attenuates faster in forests than in open habitats [45], so the detection ranges of the same sound by recorders and human-observers are larger in open than in forest habitats [23]. We did not apply habitat-related correction for detection range in our study, so we expect that the sampling area around recording sites was larger in the open than in the forest habitat, but still constant at the recording site. Such an approach corresponds with point-counts, applying an unlimited radius of detection.
Regardless of habitat type or region, the number of species detected in our study was highest at sunrise and lower in later surveys. This result is not surprising, because bird vocal activity is highest at dawn [46,47,48]. However, human-observers have a finite ability to perceive different birds, and, therefore, the probability of not detecting a species increases with the number of species vocalizing at the same time [49]. In our approach, we sought to eliminate the subjective effects of perception and observer skill by analyzing recordings in the lab; we were thus able to listen to recordings many times and compare unknown vocalizations with sound samples from online libraries. If we had used human-observers, differences between different times of day would likely have been less pronounced—human-observers should tend to overlook species during dawn chorus, when most species are singing than during later hours [49]. As is, our results highlight a clear effect of the time of day when surveys are conducted. If this factor is not considered in the design and interpretation of surveys, spurious changes in bird biodiversity would likely appear that do not reflect any biological or ecological process but are merely an effect of the time when surveys were conducted.

5. Conclusions

Our study showed that recorder-based point-counts provided similar estimates of bird biodiversity in various habitat types and geographical regions. At the same time, a low proportion of detected species during a single survey limits the usefulness of the method in studying bird–environment relationships (e.g., habitat preferences), while a decreasing number of detected species across the day may result in the misinterpretation of the status of bird populations, when early and late surveys are compared without controlling this factor. Using acoustic recorders, we missed some silent species, which could be detected by human-observers. We also focused on a very short period in the breeding season and only surveyed birds active during the day. To fully estimate bird biodiversity, repeated surveys at recording sites should be conducted across the whole year, including day and night controls. Our study was conducted only in two locations. To support our results further studies applying the same bird survey method in tropical and temperate regions are needed.

Supplementary Materials

The following are available online at https://www.mdpi.com/article/10.3390/birds2040026/s1. Table S1: List of bird species detected in each location. Table S2: Dataset containing ID of recording sites, geographical coordinates of recording sites, location, habitat type, date of survey, time of survey and the number of detected bird species.

Author Contributions

Conceptualization, M.B., K.K. and T.S.O.; methodology, M.B.; software, M.B. and K.K.; validation, M.B.; formal analysis, M.B. and K.K.; investigation, M.B., K.K. and T.S.O.; data curation, M.B., K.K. and T.S.O.; writing—original draft preparation, M.B.; writing—review and editing, K.K. and T.S.O.; visualization, M.B.; funding acquisition, M.B. and T.S.O. All authors have read and agreed to the published version of the manuscript.

Funding

This research was funded by the Ministry of Science and Higher Education, grant number IP2014 005073; and the National Science Center, Poland, grant number 2015/17/B/NZ8/02347 and grant number 2019/35/D/NZ8/04416.

Institutional Review Board Statement

The study was classified as a non-animal experiment, and thus it did not require approval from a relevant body.

Data Availability Statement

The data presented in this study are available in supplementary material.

Acknowledgments

We thank Ernest Amohlon Vunan for enabling work on land belonging to the Kedjom-Keku People and for his help in organizing the field work in Cameroon. We are grateful to Anna Skierczyńska and Marcin Antczak for their help in the field, Lindsay Riggings and Agata Staniewicz for improving our writing, and two anonymous reviewers for helpful comments and suggestions.

Conflicts of Interest

The authors declare no conflict of interest.

References

  1. Bibby, C.J.; Hill, D.A.; Burgess, N.D.; Mustoe, S. Bird Census Techniques, 2nd ed.; Academic Press: London, UK, 2000. [Google Scholar]
  2. Matsuoka, S.M.; Mahon, C.L.; Handel, C.M.; Sólymos, P.; Bayne, E.M.; Fontaine, P.C.; Ralph, C.J. Reviving common standards in point-count surveys for broad inference across studies. Condor 2014, 116, 599–608. [Google Scholar] [CrossRef] [Green Version]
  3. Crisol-Martínez, E.; Moreno-Moyano, L.T.; Horgan, F.G. Bioacoustics Reveal Species-Rich Avian Communities Exposed to Organophosphate Insecticides in Macadamia Orchards. Birds 2020, 1, 35–52. [Google Scholar] [CrossRef]
  4. Ralph, C.J.; Sauer, J.R.; Droege, S. Monitoring Bird Populations by Point Counts; General Technical Report PSW-GTR-149, Pacific Southwest Research Station; U.S. Department of Agriculture, Forest Service: Albany, CA, USA, 1997. [Google Scholar]
  5. Gregory, R.D.; Gibbson, D.W.; Donald, P. Bird census and survey techniques. In Bird Ecology and Conservation: A Handbook of Techniques; Sutherland, W.J., Newton, I., Green, R.E., Eds.; Oxford University Press: New York, NY, USA, 2004; pp. 17–56. [Google Scholar]
  6. Tozer, D.C.; Abraham, K.F.; Nol, E. Improving the accuracy of counts of wetland breeding birds at the point scale. Wetlands 2006, 26, 518–527. [Google Scholar] [CrossRef]
  7. Gale, G.; Round, P.D.; Pierce, A.J.; Nimnuan, S.; Pattanavibool, A.; Brockelman, W.Y. A field test of distance sampling methods for a tropical forest bird community. Auk 2009, 126, 439–448. [Google Scholar] [CrossRef]
  8. Fuller, R.J.; Langslow, D.R. Estimating numbers of birds by point counts: How long should counts last? Bird Study 1984, 31, 195–202. [Google Scholar] [CrossRef]
  9. Budka, M.; Jobda, M.; Szałański, P.; Piórkowski, H. Effect of agri-environment measure for the Aquatic Warbler on bird biodiversity in the extensively managed landscape of Biebrza Marshes (Poland). Biol. Conserv. 2019, 239, 108279. [Google Scholar] [CrossRef]
  10. Burner, R.C.; Styring, A.R.; Rahman, M.A.; Sheldon, F.H. Occupancy patterns and upper range limits of lowland Bornean birds along an elevational gradient. J. Biogeogr. 2019, 46, 2583–2597. [Google Scholar] [CrossRef] [Green Version]
  11. Drapeau, P.; Leduc, A.; McNeil, R. Refining the use of point counts at the scale of individual points in studies of bird-habitat relationship. J. Avian Biol. 1999, 30, 367–382. [Google Scholar] [CrossRef]
  12. Forcey, G.M.; Anderson, J.T.; Ammer, F.K.; Whitmore, R.C. Comparison of two double-observer point-count approaches for estimating breeding bird abundance. J. Wildl. Manag. 2006, 70, 1674–1681. [Google Scholar] [CrossRef]
  13. Howell, C.A.; Porneluzi, P.A.; Clawson, R.L.; Faaborg, J. Breeding density affects point-count accuracy in Missouri forest birds. J. Field Ornithol. 2004, 75, 123–133. [Google Scholar] [CrossRef]
  14. Efford, M.G.; Dawson, D.K. Effect of distance-related heterogeneity on population size estimates from point counts. Auk 2009, 126, 100–111. [Google Scholar] [CrossRef]
  15. Rigby, E.A.; Johnson, D.H. Factors affecting detection probability, effective area surveyed, and species misidentification in grassland bird point counts. Condor 2019, 12, 1–10. [Google Scholar] [CrossRef]
  16. Celis-Murillo, A.; Deppe, J.L.; Allen, M.F. Using soundscape recordings to estimate bird species abundance, richness, and composition. J. Field Ornithol. 2009, 80, 64–78. [Google Scholar] [CrossRef]
  17. Darras, K.; Batáry, P.; Furnas, B.J.; Grass, I.; Mulyani, Y.A.; Tscharntke, T. Autonomous sound recording outperforms human observation for sampling birds: A systematic map and user guide. Ecol. Appl. 2019, 29, e01954. [Google Scholar] [CrossRef] [PubMed] [Green Version]
  18. Hutto, R.L.; Stutzman, R.J. Humans versus autonomous recording units: A comparison of point-count results. J. Field Ornithol. 2009, 80, 387–398. [Google Scholar] [CrossRef]
  19. Wheeldon, A.; Mossman, H.L.; Sullivan, M.J.P.; Mathenge, J.; de Kort, S.R. Comparison of acoustic and traditional point count methods to assess bird diversity and composition in the Aberdare National Park, Kenya. African J. Ecol. 2019, 57, 168–176. [Google Scholar] [CrossRef]
  20. Sedláček, O.; Vokurkova, J.; Ferenc, M.; Djomo, E.N.; Albrecht, T.; Horak, D. A comparison of point counts with a new acoustic sampling method: A case of a bird community from the montane forests of Mount Cameroon. Ostrich 2015, 86, 1–8. [Google Scholar] [CrossRef]
  21. Darras, K.; Batáry, P.; Furnas, B.; Celis-Murillo, A.; van Wilgenburg, S.L.; Mulyani, Y.A.; Tscharntkeet, T. Comparing the sampling performance of sound recorders versus point counts in bird surveys: A meta-analysis. J. Appl. Ecol. 2018, 55, 2575–2586. [Google Scholar] [CrossRef]
  22. Brewster, J.P.; Simons, T.R. Testing the importance of auditory detections in avian point counts. J. Field Ornithol. 2008, 80, 178–182. [Google Scholar] [CrossRef]
  23. Yip, D.; Leston, L.; Bayne, E.; Sólymos, P.; Grover, A. Experimentally derived detection distances from audio recordings and human observers enable integrated analysis of point count data. Avian Conserv. Ecol. 2017, 12, 11. [Google Scholar] [CrossRef] [Green Version]
  24. Sauer, J.R.; Peterjohn, B.C.; Link, W.A. Observer differences in the North American Breeding Bird Survey. Auk 1994, 111, 50–62. [Google Scholar] [CrossRef]
  25. Farmer, R.G.; Leonard, M.L.; Flemming, J.E.M.; Anderson, S.C. Observer aging and long-term avian survey data quality. Ecol. Evol. 2014, 4, 2563–2576. [Google Scholar] [CrossRef] [PubMed]
  26. IMGW. Climate of Poland; Institute of Meteorology and Water Management National Research Institute: Warsaw, Poland, 2020. [Google Scholar]
  27. Budka, M. Upper Nurzec River Valley. In Important Bird Areas of International Importance in Poland; Wilk, T., Jujka, M., Krogulec, J., Chylarecki, P., Eds.; Polish Society for the Protection of Birds: Marki, Poland, 2010. [Google Scholar]
  28. Wesołowski, T.; Czeszczewik, D.; Hebda, G.; Maziarz, M.; Mitrus, C.; Rowiński, P. 40 years of breeding bird community dynamics in a primeval temperate forest (Białowieża National Park, Poland). Acta Ornithol. 2015, 50, 95–120. [Google Scholar] [CrossRef]
  29. BirdLife International. Endemic Bird Areas factsheet: Cameroon mountains. Available online: http://www.birdlife.org (accessed on 24 October 2020).
  30. Tye, H. The climate of the highlands of western Cameroon. In Conservation of Cameroon Montane Forests; Stuart, S.N., Ed.; International Council for Bird Preservation: Cambridge, UK, 1986; pp. 18–19. [Google Scholar]
  31. Innocent, N.M.; Bitondo, D.; Azibo, B.R. Climate variability and change in the Bamenda highlands of north western Cameroon: Perceptions, impacts and coping mechanisms. Br. J. Appl. Sci. Technol. 2016, 12, 1–18. [Google Scholar] [CrossRef]
  32. Tye, H. Reversal of breeding season by lowland birds at higher altitudes in western Cameroon. Ibis 1992, 134, 154–163. [Google Scholar] [CrossRef]
  33. Sedláček, O.; Reif, J.; Hořák, D.; Riegert, J.; Pešata, M.; Klvana, P. The birds of a montane forest mosaic in Big Babanki area, Bamenda Highlands, Cameroon. Malimbus 2007, 29, 89–100. [Google Scholar]
  34. Bonthoux, S.; Balent, G. Point count duration: Five minutes are usually sufficient to model the distribution of bird species and to study the structure of communities for a French landscape. J. Ornithol. 2012, 153, 491–504. [Google Scholar] [CrossRef]
  35. Hardin, J.W.; Hilbe, J.M. Generalized Estimating Equations, 2nd ed.; Chapman and Hall/CRC: Boca Raton, FL, USA, 2013. [Google Scholar]
  36. Sørensen, T. A method of establishing groups of equal amplitude in plant sociology based on similarity of species and its application to analyses of the vegetation on Danish commons. K. Dan. Vidensk. Selsk. 1948, 5, 1–34. [Google Scholar]
  37. Kułaga, K.; Budka, M. Bird species detection by an observer and an autonomous sound recorder in two different environments: Forest and farmland. PLoS ONE 2019, 14, e0211970. [Google Scholar] [CrossRef]
  38. Harms, T.M.; Dinsmore, S.J. Optimizing surveys for marsh songbirds: Does timing matter? J. Field Ornithol. 2018, 89, 276–286. [Google Scholar] [CrossRef] [Green Version]
  39. Kéry, M.; Schmidt, B.R. Imperfect detection and its consequences for monitoring for conservation. Comm. Ecol. 2008, 9, 207–216. [Google Scholar] [CrossRef] [Green Version]
  40. Sliwinski, M.; Powell, L.; Koper, N.; Giovanni, M.; Schacht, W. Research design considerations to ensure detection of all species in an avian community. Methods Ecol. Evol. 2016, 7, 456–462. [Google Scholar] [CrossRef]
  41. MacKenzie, D.; Nichols, J.; Lachman, G.; Droege, G.S.; Royle, J.; Langtimm, C. Estimating site occupancy rates when detection probabilities are less than one. Ecology 2002, 83, 2248–2255. [Google Scholar] [CrossRef]
  42. Gu, W.; Swihart, R.K. Absent or undetected? Effects of non-detection of species occurrence on wildlife–habitat models. Biol. Conserv. 2003, 116, 195–203. [Google Scholar] [CrossRef]
  43. Dettmers, R.; Buehler, D.; Bartlett, J.; Klaus, N. Influence of point count length and repeated visits on habitat model performance. J Wild Manag. 1999, 63, 815–823. [Google Scholar] [CrossRef]
  44. Budka, M.; Czyż, M.; Skierczyńska, A.; Skierczyński, M.; Osiejuk, T.S. Duration of survey changes interpretation of habitat preferences: An example of an endemic tropical songbird, the Bangwa Forest Warbler. Ostrich 2020, 91, 195–203. [Google Scholar] [CrossRef]
  45. Yip, D.; Bayne, E.; Sólymos, P.; Campbell, J.; Proppe, D. Sound attenuation in forest and roadside environments: Implications for avian point-count surveys. Condor 2017, 119, 73–84. [Google Scholar] [CrossRef] [Green Version]
  46. Catchpole, C.K. The functions of advertising song in the Sedge Warbler (Acrocephalus schoenobaenus) and the Reed Warbler (A. scirpaceus). Behaviour 1973, 46, 300–319. [Google Scholar] [CrossRef]
  47. Gil, D.; Llusia, D. The bird dawn chorus revisited. In Coding Strategies in Vertebrate Acoustic Communication; Aubin, T., Mathevon, N., Eds.; Springer Nature: London, UK, 2020; pp. 45–92. [Google Scholar]
  48. Bateman, H.L.; Riddle, S.B.; Cubley, E.S. Using Bioacoustics to Examine Vocal Phenology of Neotropical Migratory Birds on a Wild and Scenic River in Arizona. Birds 2021, 2, 261–274. [Google Scholar] [CrossRef]
  49. Haselmayer, J.; Quinn, J.S. A comparison of point counts and sound recording as bird survey methods in Amazonian Southeast Peru. Condor 2000, 102, 887–893. [Google Scholar] [CrossRef]
Figure 1. Average number of bird species (+/−SD) recorded during a five-minute survey in tropical and temperate regions. Surveys started at sunrise (early), 1 h after sunrise (intermediate), and 2 h after sunrise (late). The significant differences (p < 0.001) in the number of detected bird species were observed between the regions, as well as between early vs. intermediate and late survey independently on the region.
Birds 02 00026 g001
Figure 2. Accuracy of a single five-minute survey in tropical (orange) and temperate (green) region during early, intermediate, and late survey. Mean values and SE of means are given.
Birds 02 00026 g002
Figure 3. Distribution of Sørensen similarity index comparing bird species composition during two random surveys at recording site in tropical and temperate regions. Histogram based on comparisons of 540 pairs of surveys.
Birds 02 00026 g003
Table 1. Results of generalized estimating equations examining the effect of region, habitat type, day, and time of survey on the number of bird species recorded during a single five-minute survey. As reference categories, we used tropical region, forest, first day, and early survey.
PredictorBSEWald χ2dfp-Value
Intercept2.4420.06351480.1791<0.001
Region (temperate)−0.3620.070326.5361<0.001
Habitat (open habitats)−0.0120.07050.02810.867
Day (second)0.0020.03230.00210.961
Survey (late)−0.2470.052821.8901<0.001
Survey (intermediate)−0.1540.033521.0501<0.001
Table 2. Results of generalized estimating equations examining the effect of region, habitat type, day, and time of survey on the accuracy of a single five-minute survey. As reference categories, we used tropical region, forest, first day, and early survey.
PredictorBSEWald χ2dfp-Value
Intercept−0.6280.0439205.0551<0.001
Region (temperate)−0.0030.05010.00310.955
Habitat (open habitats)0.0320.05050.39610.529
Day (second)−0.0080.03550.04510.832
Survey (late)−0.2640.55222.9331<0.001
Survey (intermediate)−0.1600.034621.2531<0.001
Table 3. Results of generalized estimating equations examining the effect of region, habitat type, day (surveys conducted on the same or different days), and time of survey (surveys conducted at the same time on different days or at different times) on values of Sørensen similarity index.
PredictorBSEWald χ2dfp-Value
Intercept0.5460.0266420.7921<0.001
Region (temperate)0.0040.02940.02010.888
Habitat (open habitats)0.0160.02940.29210.589
Day (different)−0.0270.01066.36110.012
Time of survey (the same)0.0690.014422.9531<0.001
Publisher’s Note: MDPI stays neutral with regard to jurisdictional claims in published maps and institutional affiliations.

