1. Introduction
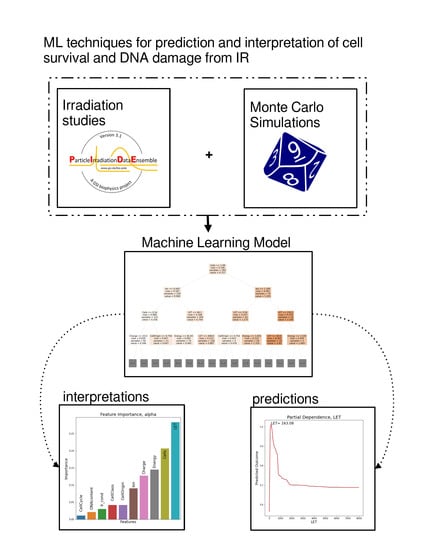
When a population of living cells is exposed to ionizing radiation (IR), an array of complex responses takes place. Our main aim was to predict the irradiation’s effect on the survival of cells and its impact on the cell’s DNA. In order to achieve this, we employed various Machine Learning (ML) techniques and fast Monte Carlo simulations [
1] to calculate the DNA damage. The study was based on an extended dataset of cell irradiation studies: PIDE [
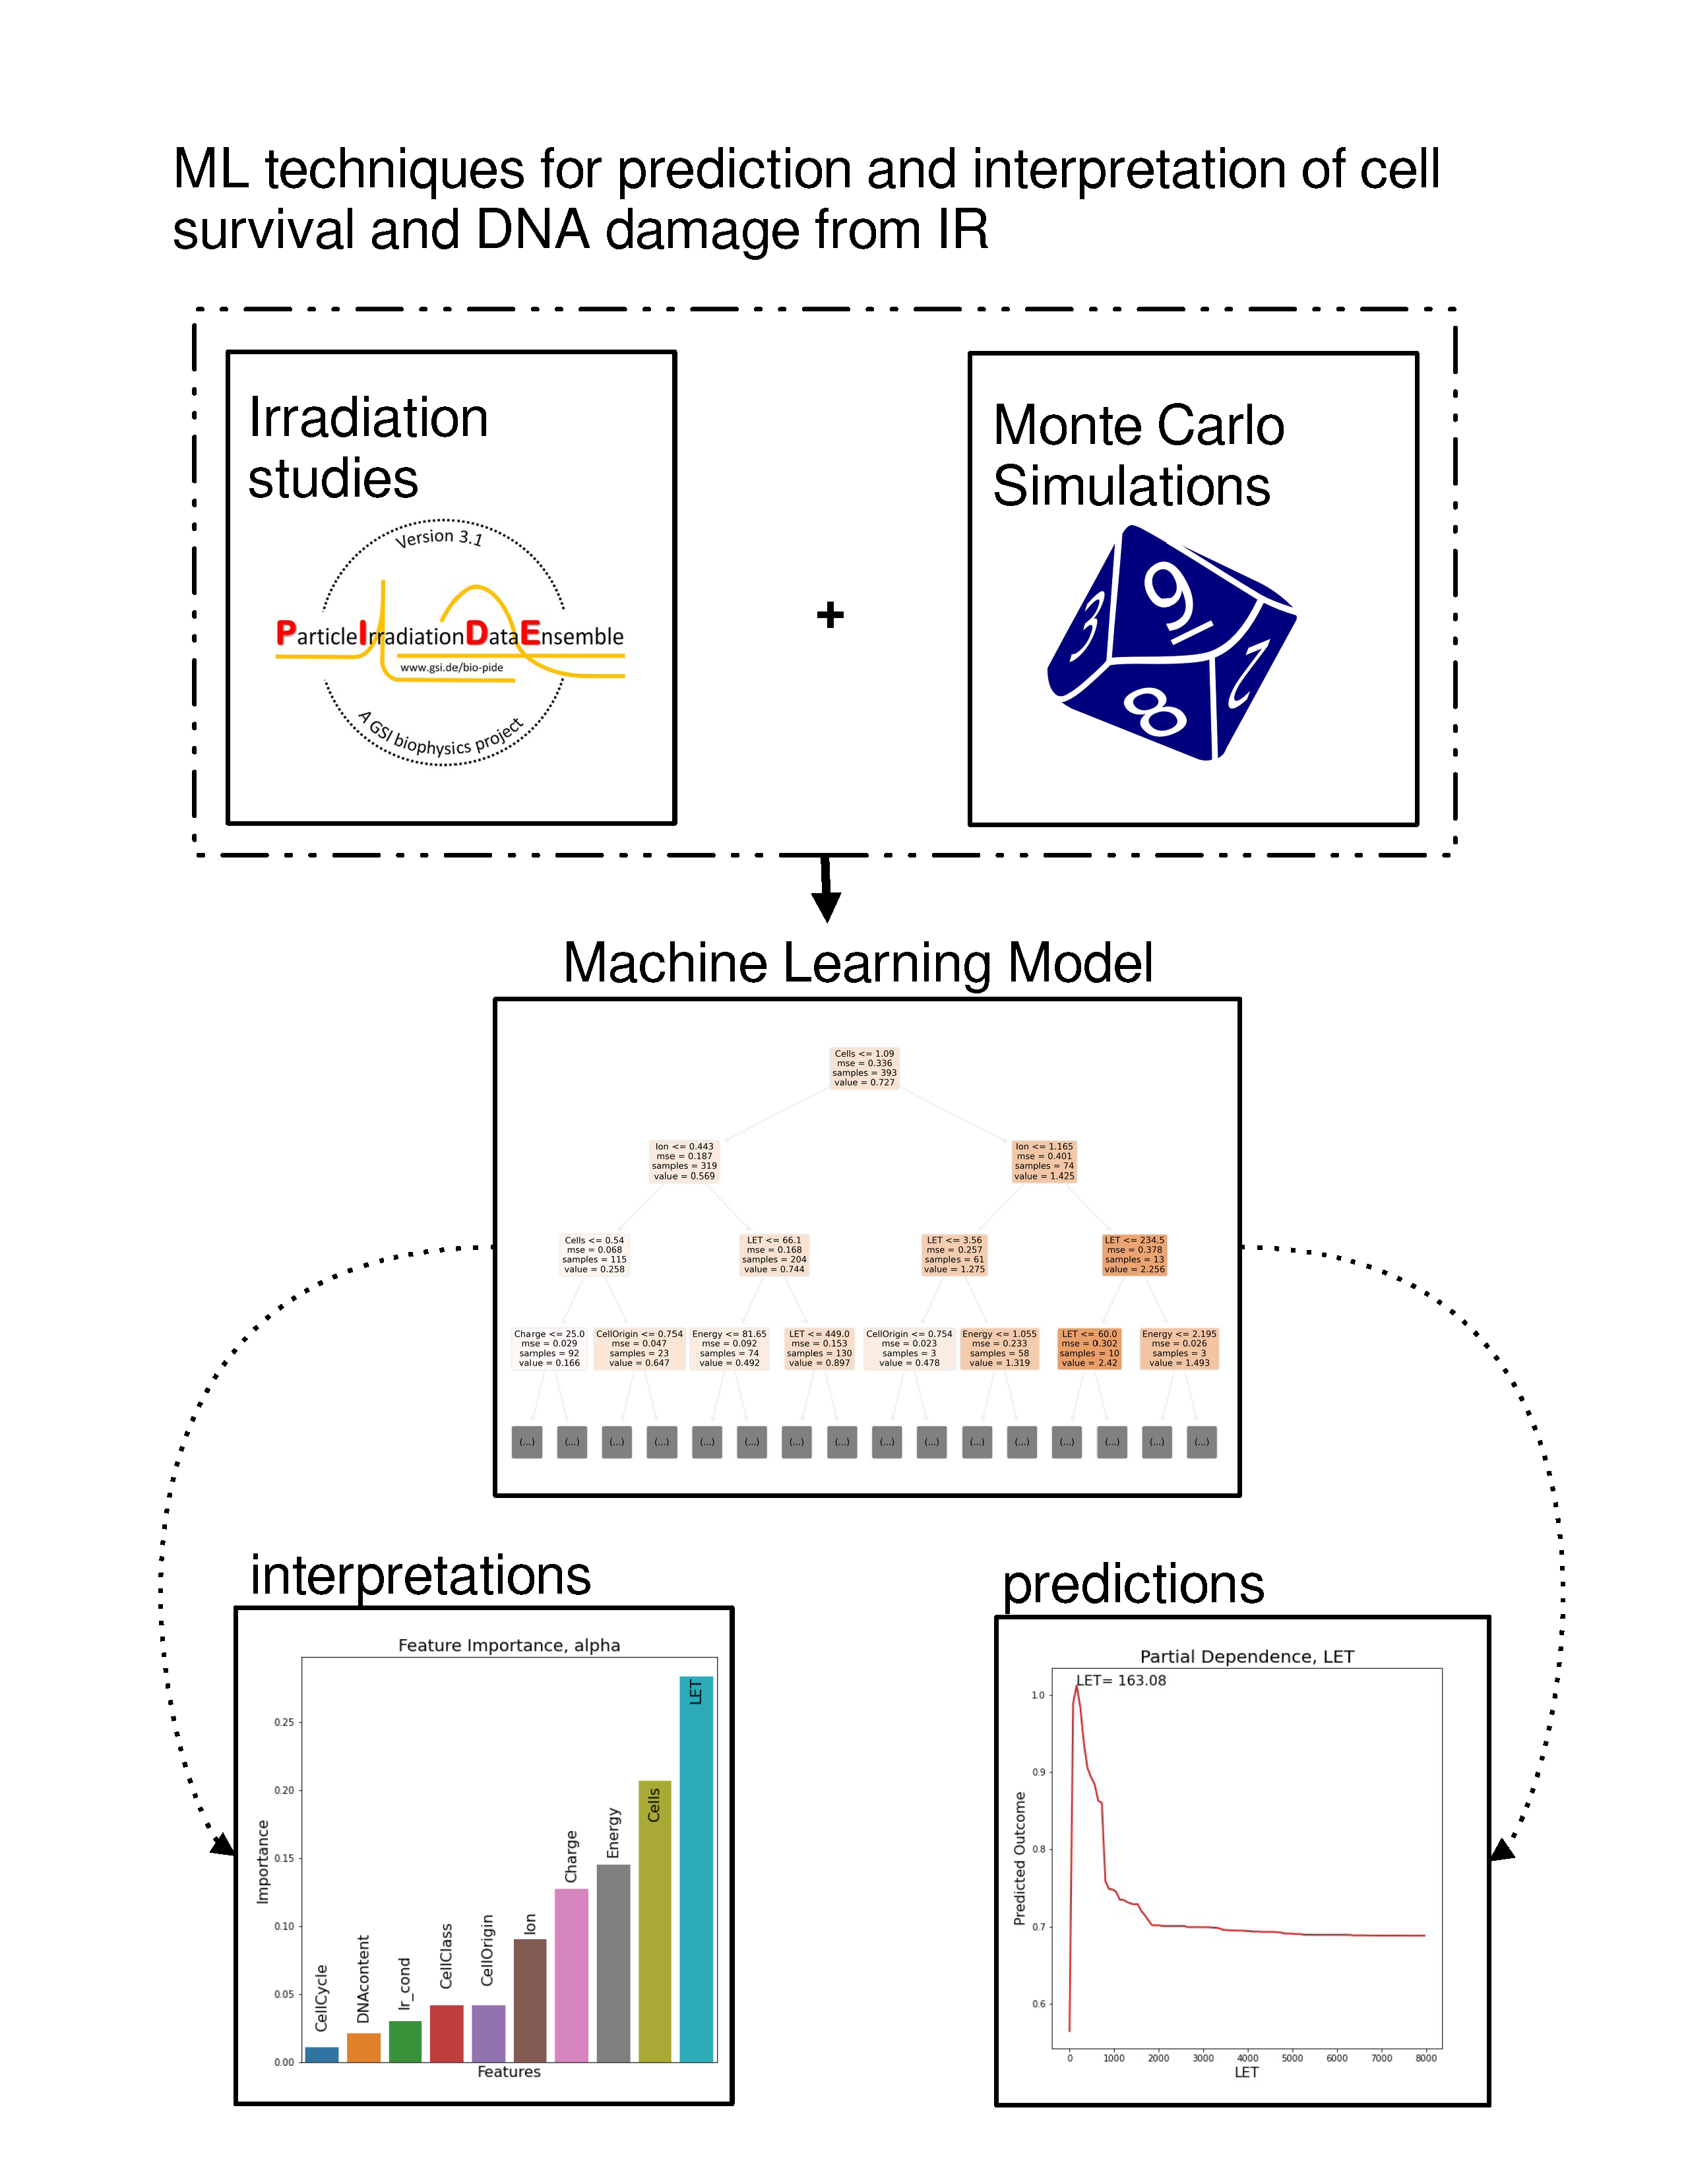
2]. This introduction aims to illustrate the biophysical importance of the dataset’s features and their impacts on the biological outcome of the computational model itself. Additionally, the basic rationale of the ML approach is outlined. A common way of modeling and quantifying the relation between radiation dosage and fraction of surviving cells is the established linear quadratic (LQ) model.
1.1. LQ Model
The LQ model [
3] is among several empirical and less mechanistic mathematical formalisms that have been proposed to describe the relation between cell survival and radiation dose absorption by cells or tissues. It is also among the most prevalent models in this field, and its basic assumption is that there are two parameters that contribute to cell killing: the first,
, is mainly the linear component and relates to the dosage D, while the second
, a quadratic component relates to the square of the dosage
[
4]. This relation is expressed in the equation:
where
S represents the fraction of cells that survived dose D. In
Figure 1 below, a typical response curve of a cell population to ionizing radiation based on the LQ model is presented as an example.
The
and
parameters represent the linear and quadratic contributions to cell death, respectively. The LQ model’s widespread usage lies in the fact that it has only two parameters and it is not computationally demanding. These parameters also have some associated biophysical importance and biophysical interpretations [
4]. Single hits of radiation (one particle) may cause cell death by inducing breaks in two adjacent chromosomes (
D component). When two or more particles induce two chromosomal breaks, injuries become cumulative. Irradiation’s mechanism behind cell death is believed to be strongly related to DNA damage, and double-stranded breaks (DSBs) especially [
5]. The probability of this multiple-hit event is proportional to the square of the dose, which is represented by the
parameter. A significant part of this study is the determination of the dose–response of a cell population, by predicting the
and
parameters of the LQ model.
1.2. Radiation Properties
Linear energy transfer (LET) is a quantity that signifies the average amount of energy that ionizing radiation conveys to a material, per unit of distance. It describes the transfer of radiation’s energy to matter; it depends on the nature of the irradiated matter, and the type of radiation and its characteristics, such as particle kinetic energy and charge, but it is strictly positive. Energy transfer causes damage to the structure of the material, as near the radiation track the ionizing particle contacts the material. In biological systems, such microscopic failures increase the chance of a large scale failure, such as a double-stranded DNA break or cell apoptosis. LET’s importance stems from the fact that DNA damage is not proportional to the absorbed dose and it is typically measured in KeV/m or MeV/mm. Another aspect of the impact of IR on cells is the number of DSBs induced by that radiation. In this study, we predict DSBs and all types of complex DNA damage (all clusters). Both all clusters and DSBs are measured in number of lesions per Gray per bp i.e., . DNA damage was calculated through fast Monte Carlo simulations. There are several different ways to quantify the complexity of DNA damage, from defining a single DSB as a region in which two DNA lesions exist within a span of less than 10 base pairs (bp), to incorporating other types of critical damage to the DNA molecule in a region sufficiently close to a DSB, which amounts to what we describe as all clusters. The all clusters metric is described in detail in the Methods section.
1.3. Biophysical Background
This study includes two categories of features. On one hand, there are physical features related to the radiation itself, such as LET and ion species. On the other hand, there are biophysical features related to the cell, such as cell cycle phase, cell line and cell type (i.e., normal or tumor). A high LET value denotes quick attenuation of the radiation inside the material, lower radiation penetration and increased complexity of damage [
6]. From a biological standpoint, such microscopic failures increase the chances of large-scale failures, such as double-stranded DNA breaks and cell apoptosis. Radiation affects cells in multiple ways, including cellular damage, apoptosis, mutations and chromosome aberrations, i.e., genomic instability. Cells exhibit varying responses to low doses of radiation which cannot be extrapolated accurately from high-dose responses to low dose radiation, a state that can lead to low-dose hyper-radiosensitivity (HRS) and increased radio resistance (IRR). The phase of the cell cycle and whether the cell is tumorous or not are considered to play major roles in radiosensitivity.
1.4. Machine Learning Approach
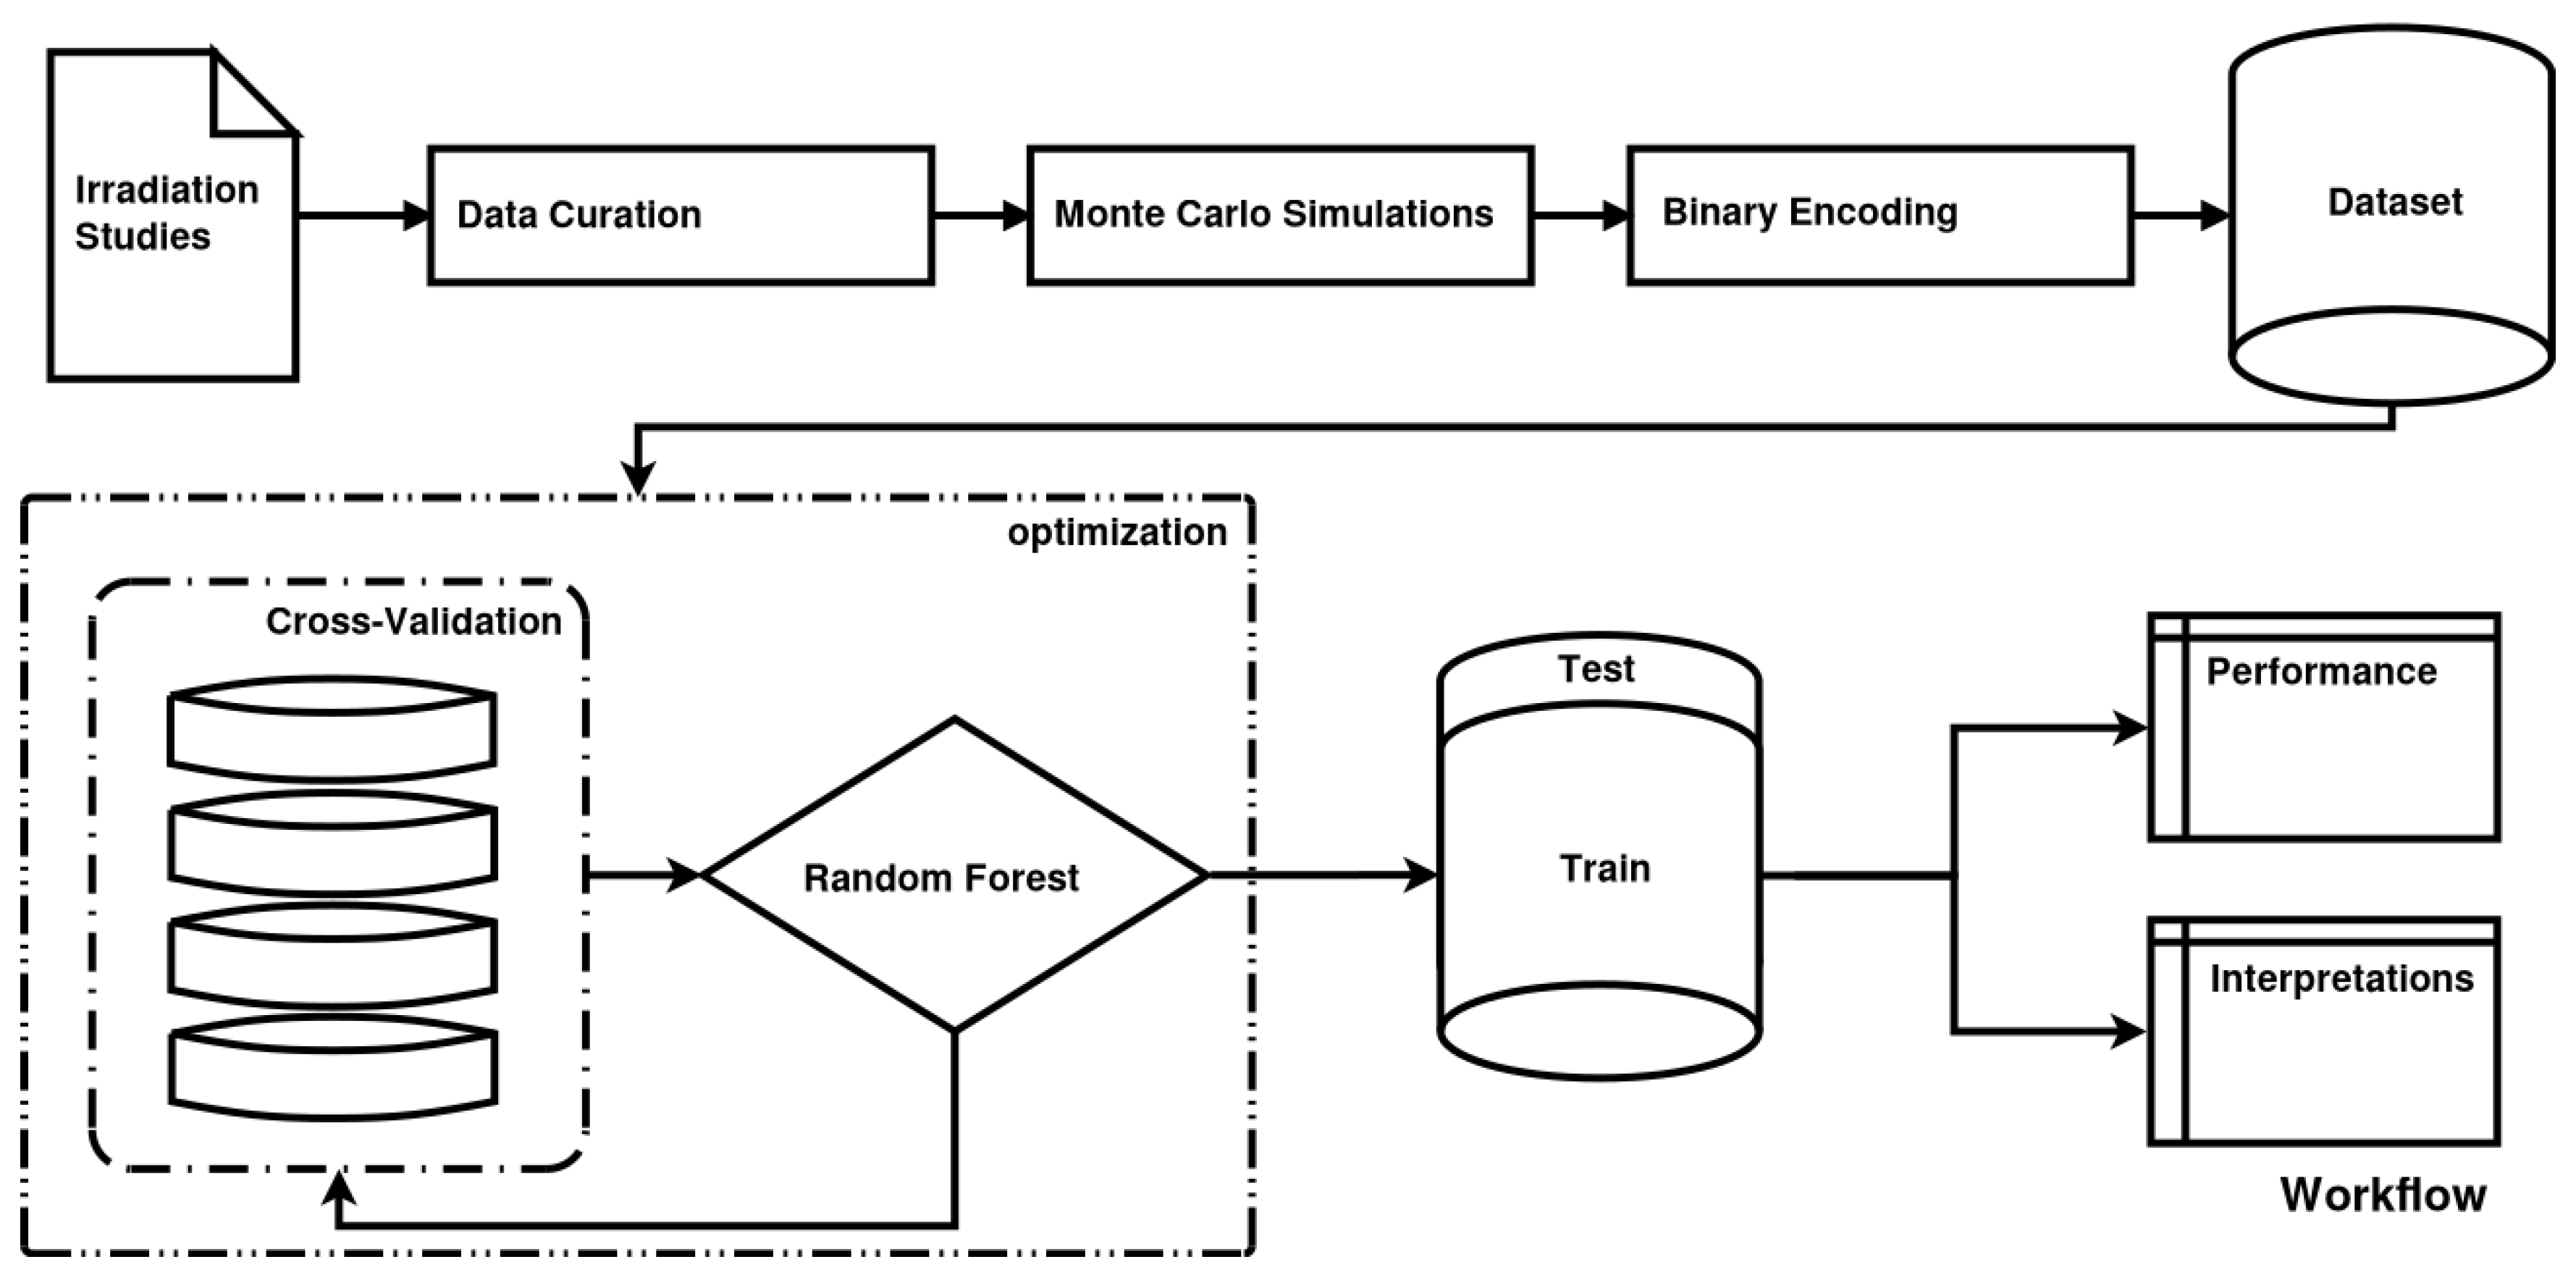
In the case of cell irradiation there can be no specific hypothesis for the variable distribution, as features exhibit complex multicollinearities and there is also a strong element of randomness (intrinsic noise) in the studied data. Based on the above, we are compelled to implicate ML methods. ML, in contrast to classical statistics, does not impose a preconceived relation between dependent and independent variables. ML aims to “learn” the dataset itself. In this study, we will adhere to what in statistics are called independent and dependent variables as features and targets respectively, in compliance with ML lingo. The random forest [
7] (RF) algorithm that was chosen is typical for ML models, but it produces a “black box” model. This means that it does not offer any biophysical explanations for its predictions. In order to overcome this opaqueness of ML models and interpret the relations between the features and the outcome, various interpretation methods are employed, such as surrogate models and partial dependencies. In fact, predictive performance is used as a quality indicator for the interpretations.
2. Results
Model assessment is organized into two sections. Firstly, several metrics and graphs that quantify the predictive performance of our model are presented. Evaluation of the implementation of the model can be done along various lines. Here, some basic evaluation aspects are presented, such as confidence intervals and the distribution of true vs. predicted values. The next section of results accommodates their interpretation, such as feature importance, interactions and individual prediction interpretation graphs. The terms a_paper, b_paper, a_fit and b_fit below refer to the way that
and
parameters are represented in the dataset. The difference between
paper and
fit targets is that the former refer to parameters as they were measured and calculated by the authors in the original studies of the dataset, while the latter refer to their calculations through fitting, based on cell survival data from the creators of the PIDE database [
2]. In this section, two kinds of result plots are presented:
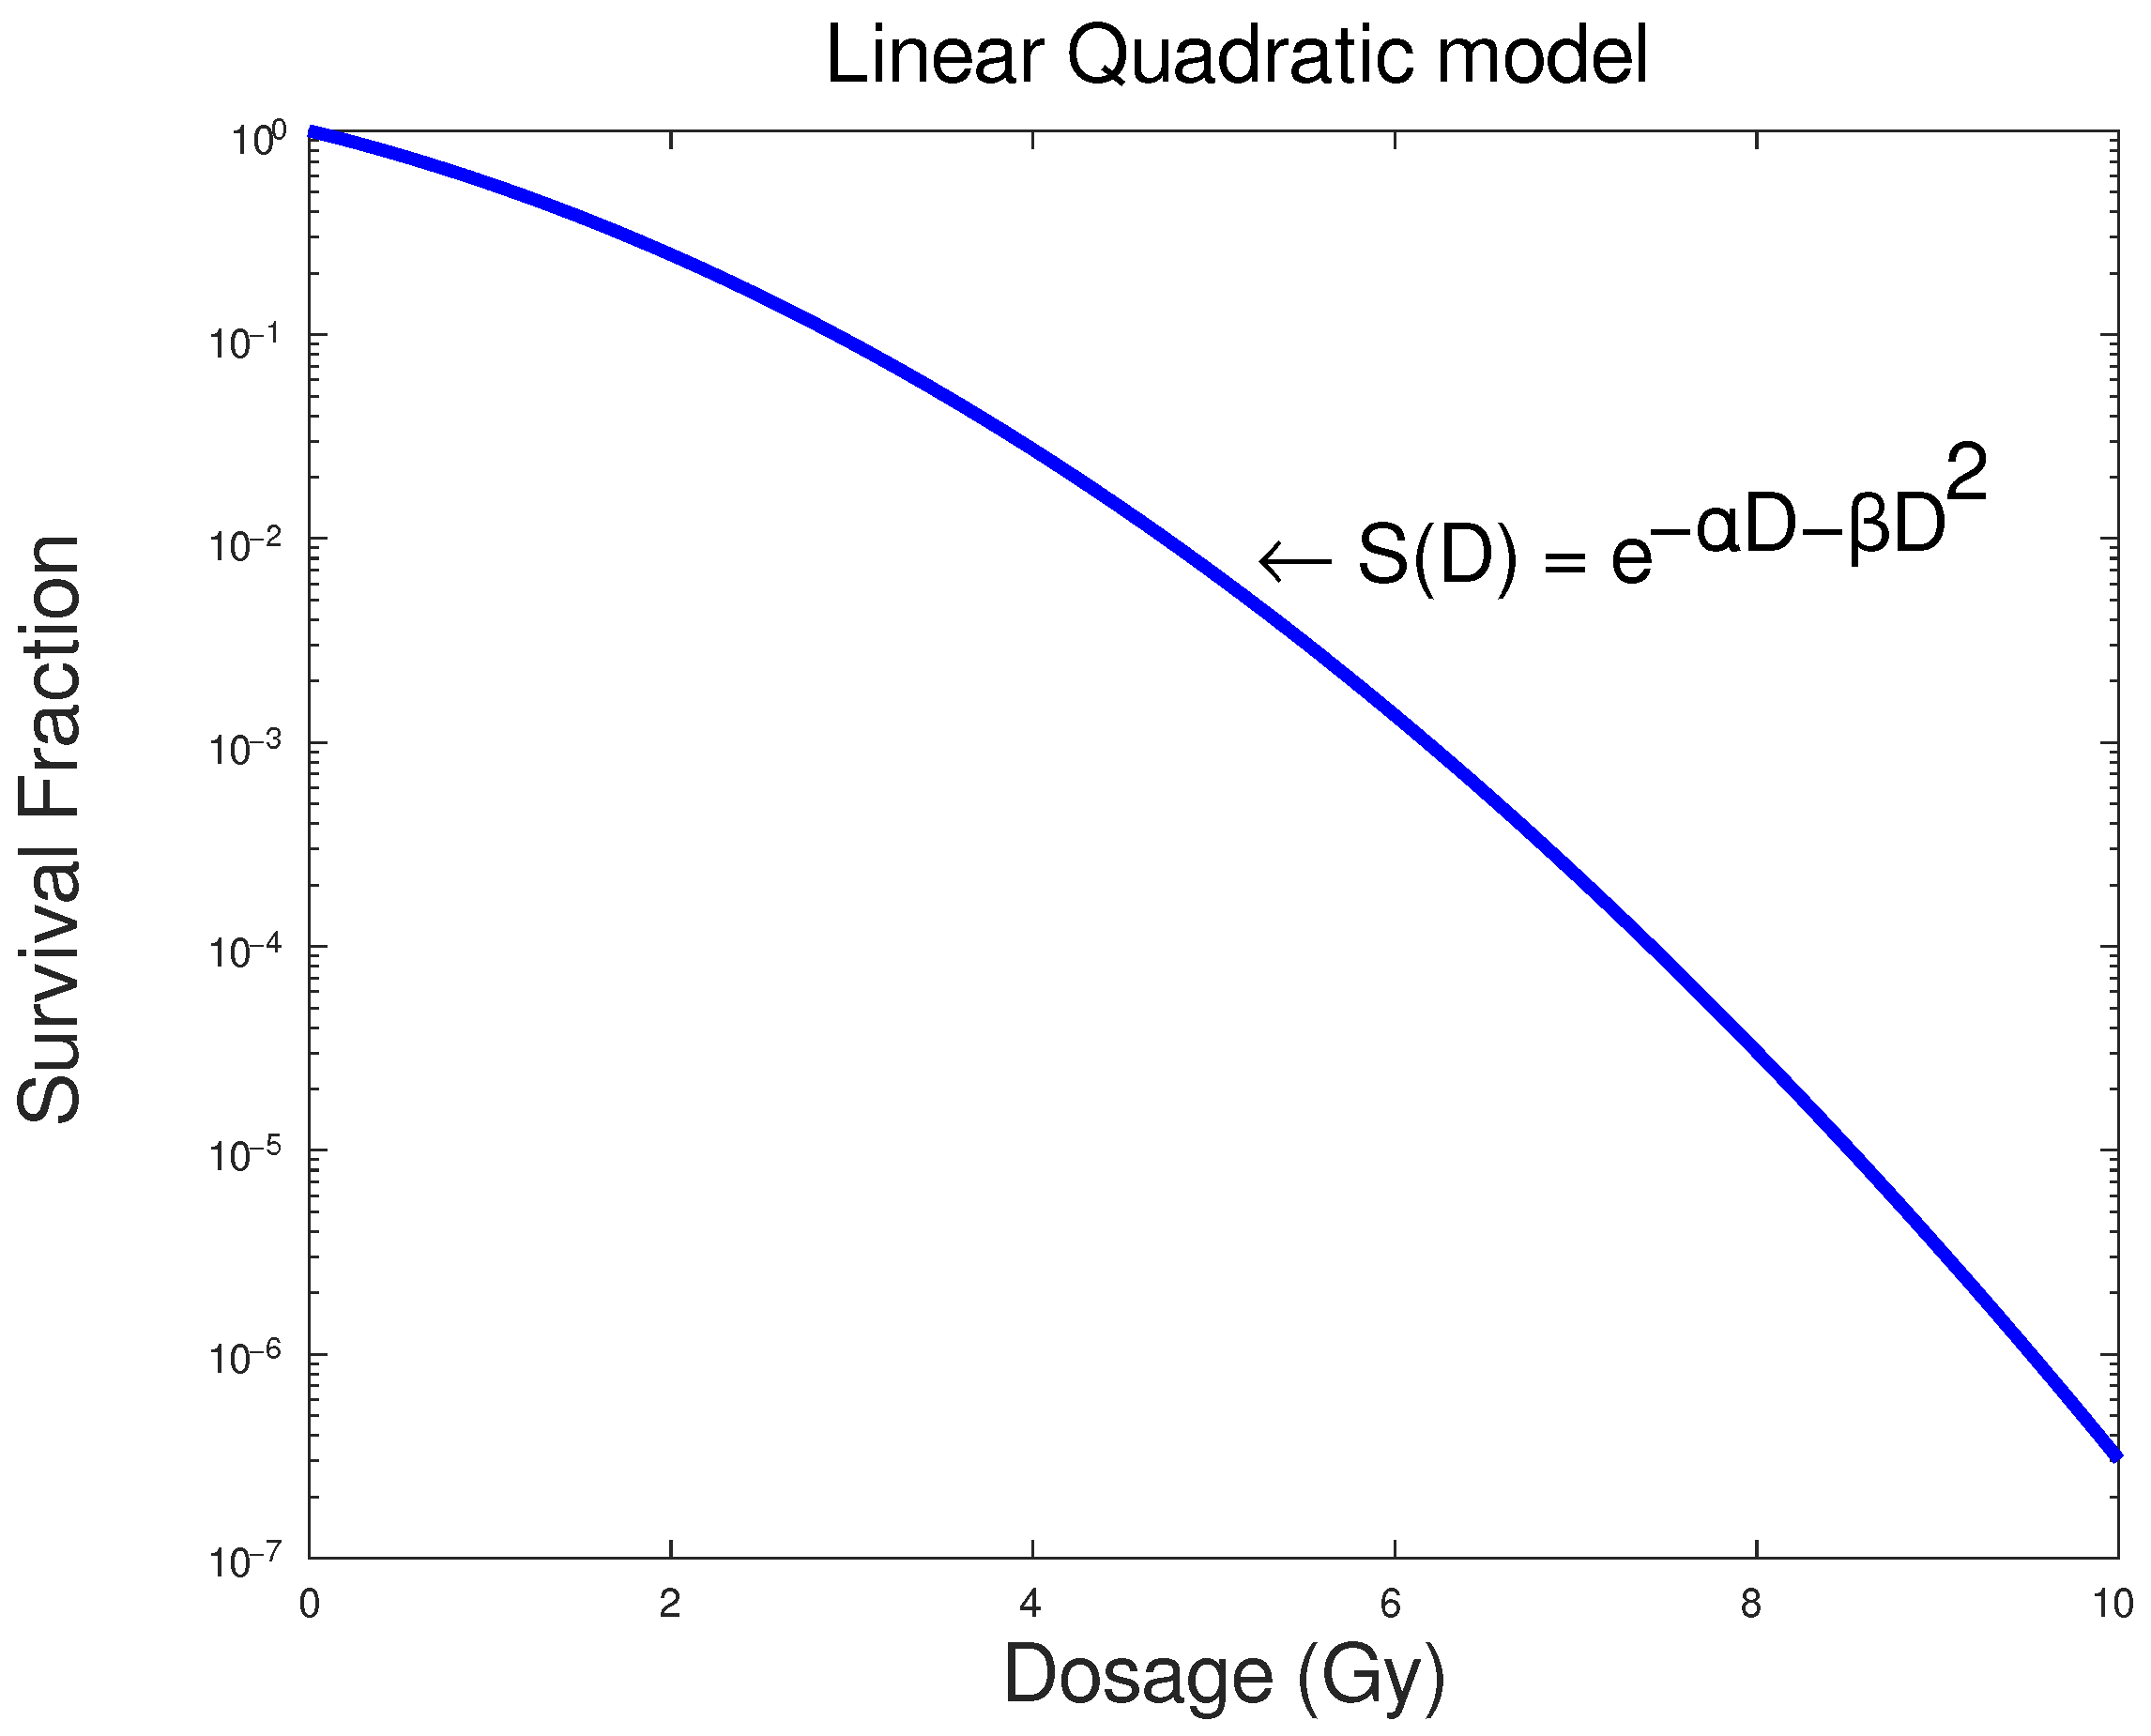
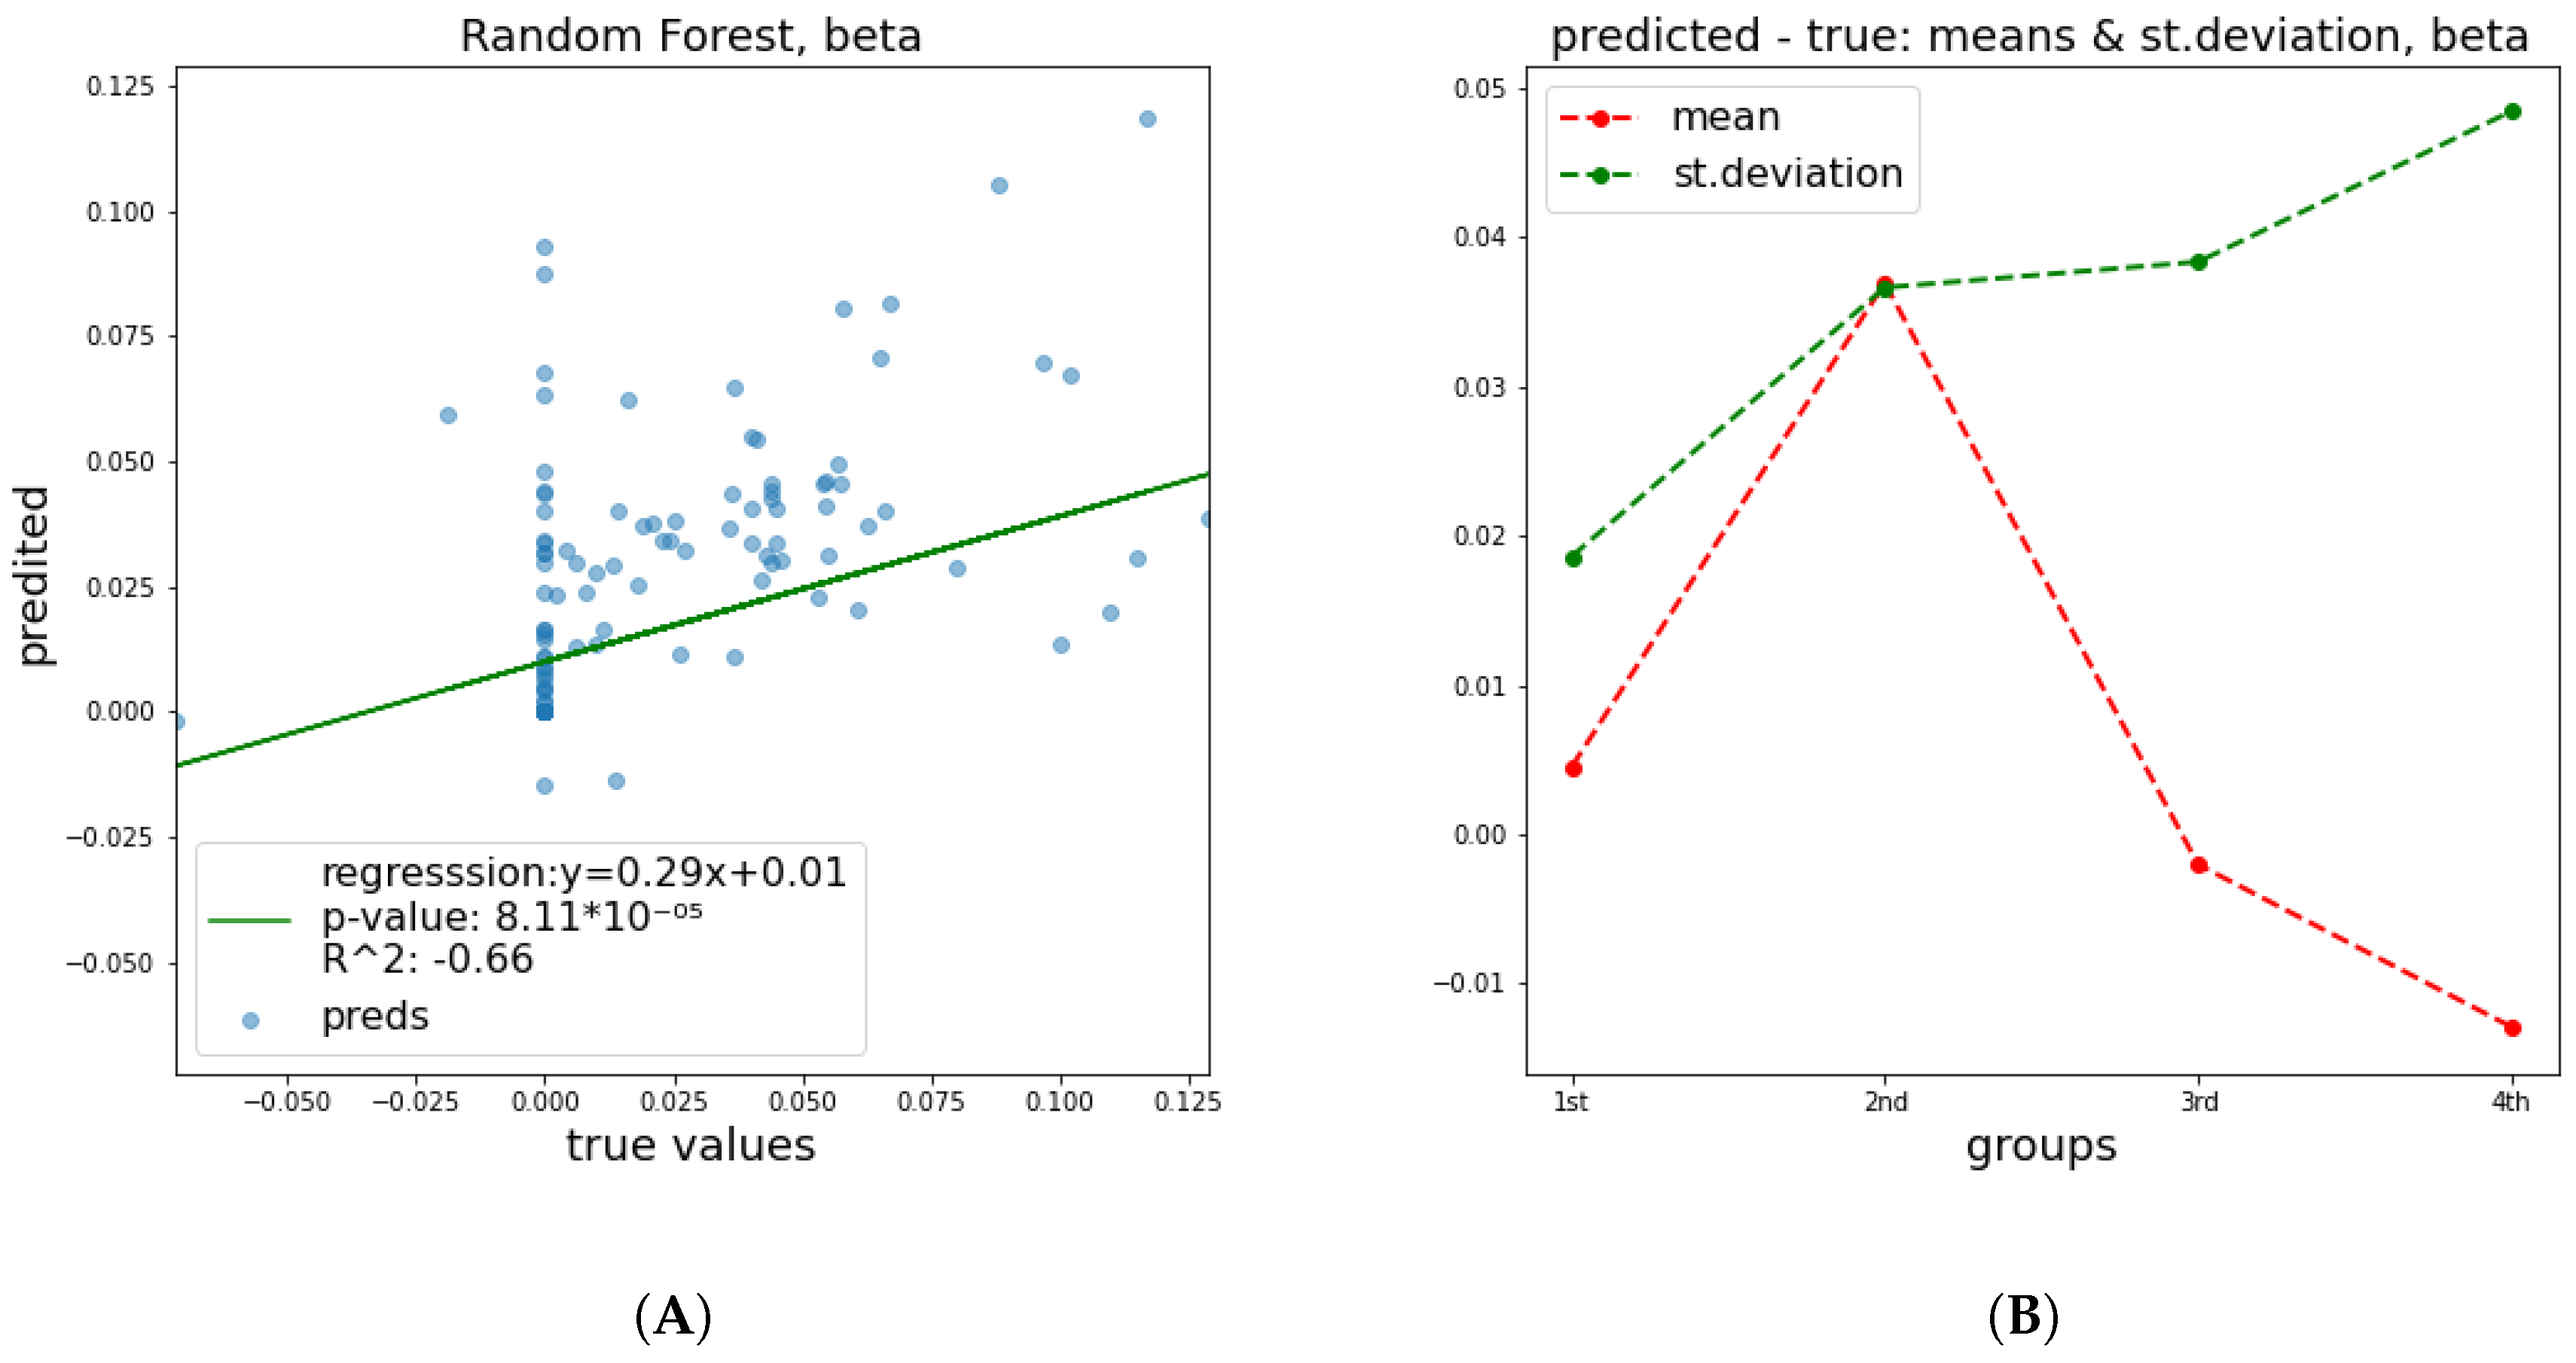
True vs. predicted graphs show the evolutions of key statistics in every ML model. These graphs consist of pairs of actual and predicted values from the test set, on which the model was not trained (holdout set). The closer these points are to the line, the better the predictive performance of the estimator. Additionally, a linear regression line was plotted based on the points in order to quantify the distance from the identity line, with the corresponding equation being given on the plot. p-values represent the probability that, given the sampled data, the slope of the regression line is zero—i.e., that the two variables are unrelated.
Mean and standard deviation graphs depict the ways in which the means and the standard deviations (STD) of error change. The pairs of true and predicted values were sorted with respect to the true value and they were separated into four groups containing equal numbers of pairs. For each group, the means and the STD of distance between the two parts of the pair (i.e., error) were calculated. This graph aims to examine whether the error of the ML model follows a specific trend. The x-axis corresponds to the four groups of errors, while the y-axis has the same units as the target studied.
For brevity, only the figures related to a_paper and b_paper are included, because based on the results of
Table 1, the performance falls significantly in the fitted cases.
2.1. Predictive Performance
2.1.1. and Parameters
To describe the performance of estimator, the relative root mean squared error (RRMSE) metric is provided along with bootstrapped [
8] 95% confidence intervals. The results in all tables that contain confidence intervals, for instance, see
Table 1 below, are dimensionless and can be compared in each case.
What should become apparent from the above table is the better performance of our ML-based model regarding the
parameter, especially regarding the
parameter derived from experimental values of previous studies compared to those derived from the fitting process, as performed by the authors of PIDE database. The same trend was observed for the
parameter, with the notable difference that in both
paper and
fit cases, predictions were altogether relatively bad, which is very informative about the nature of
. This is indicative of the fitting process, in which both of parameters increase the error. It also shows that the mean magnitude of the
parameter is comparable to the measurement error and the fitting process error. The same picture arises when visualization of the estimator’s behavior is attempted. Especially for
parameter, both the error and the graphs show a relation between the features and a value of
that is close to random noise. The mean and standard deviation plots in all cases illustrate the same trend, namely, that the STD of distance between true and predicted values becomes larger, meaning that as the value that we are trying to predict increases, the error increases too.
Figure 2 and
Figure 3 depict the predictive performance of
and
parameters. Additional results regarding the
parameter that are related to further investigation of the model, such as partial dependence and various interpretation plots, are kept in the
supplementary section (Figures S1 and S2).
2.1.2. DNA Damage
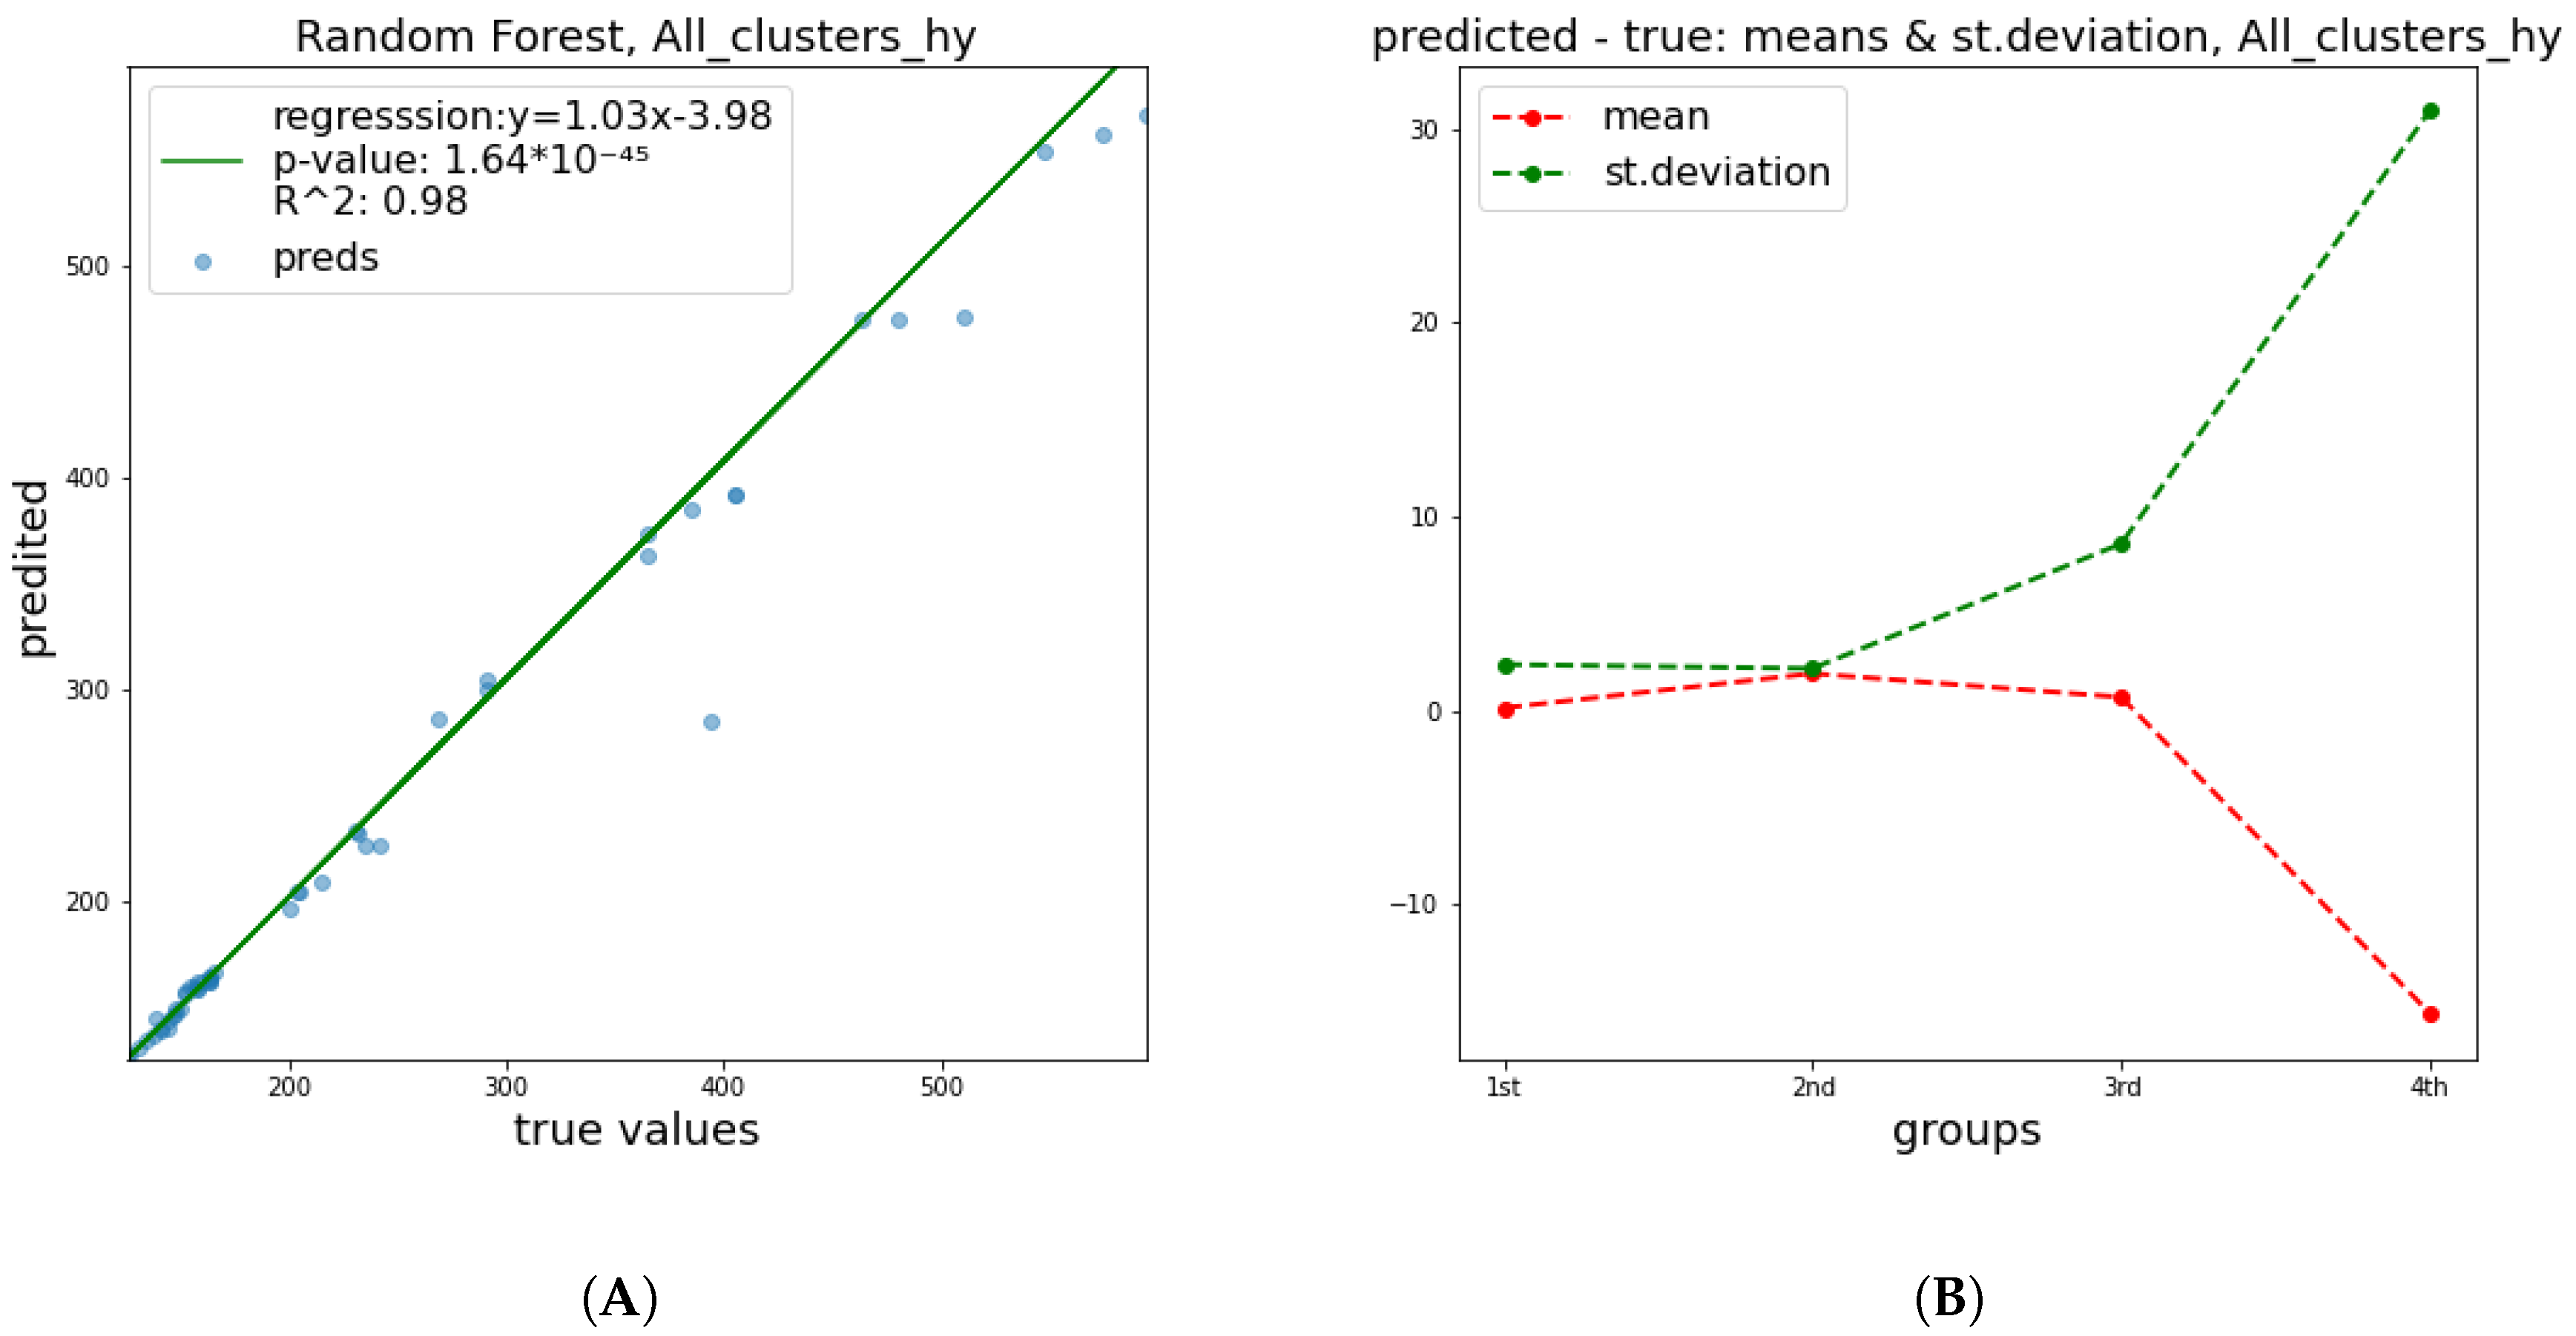
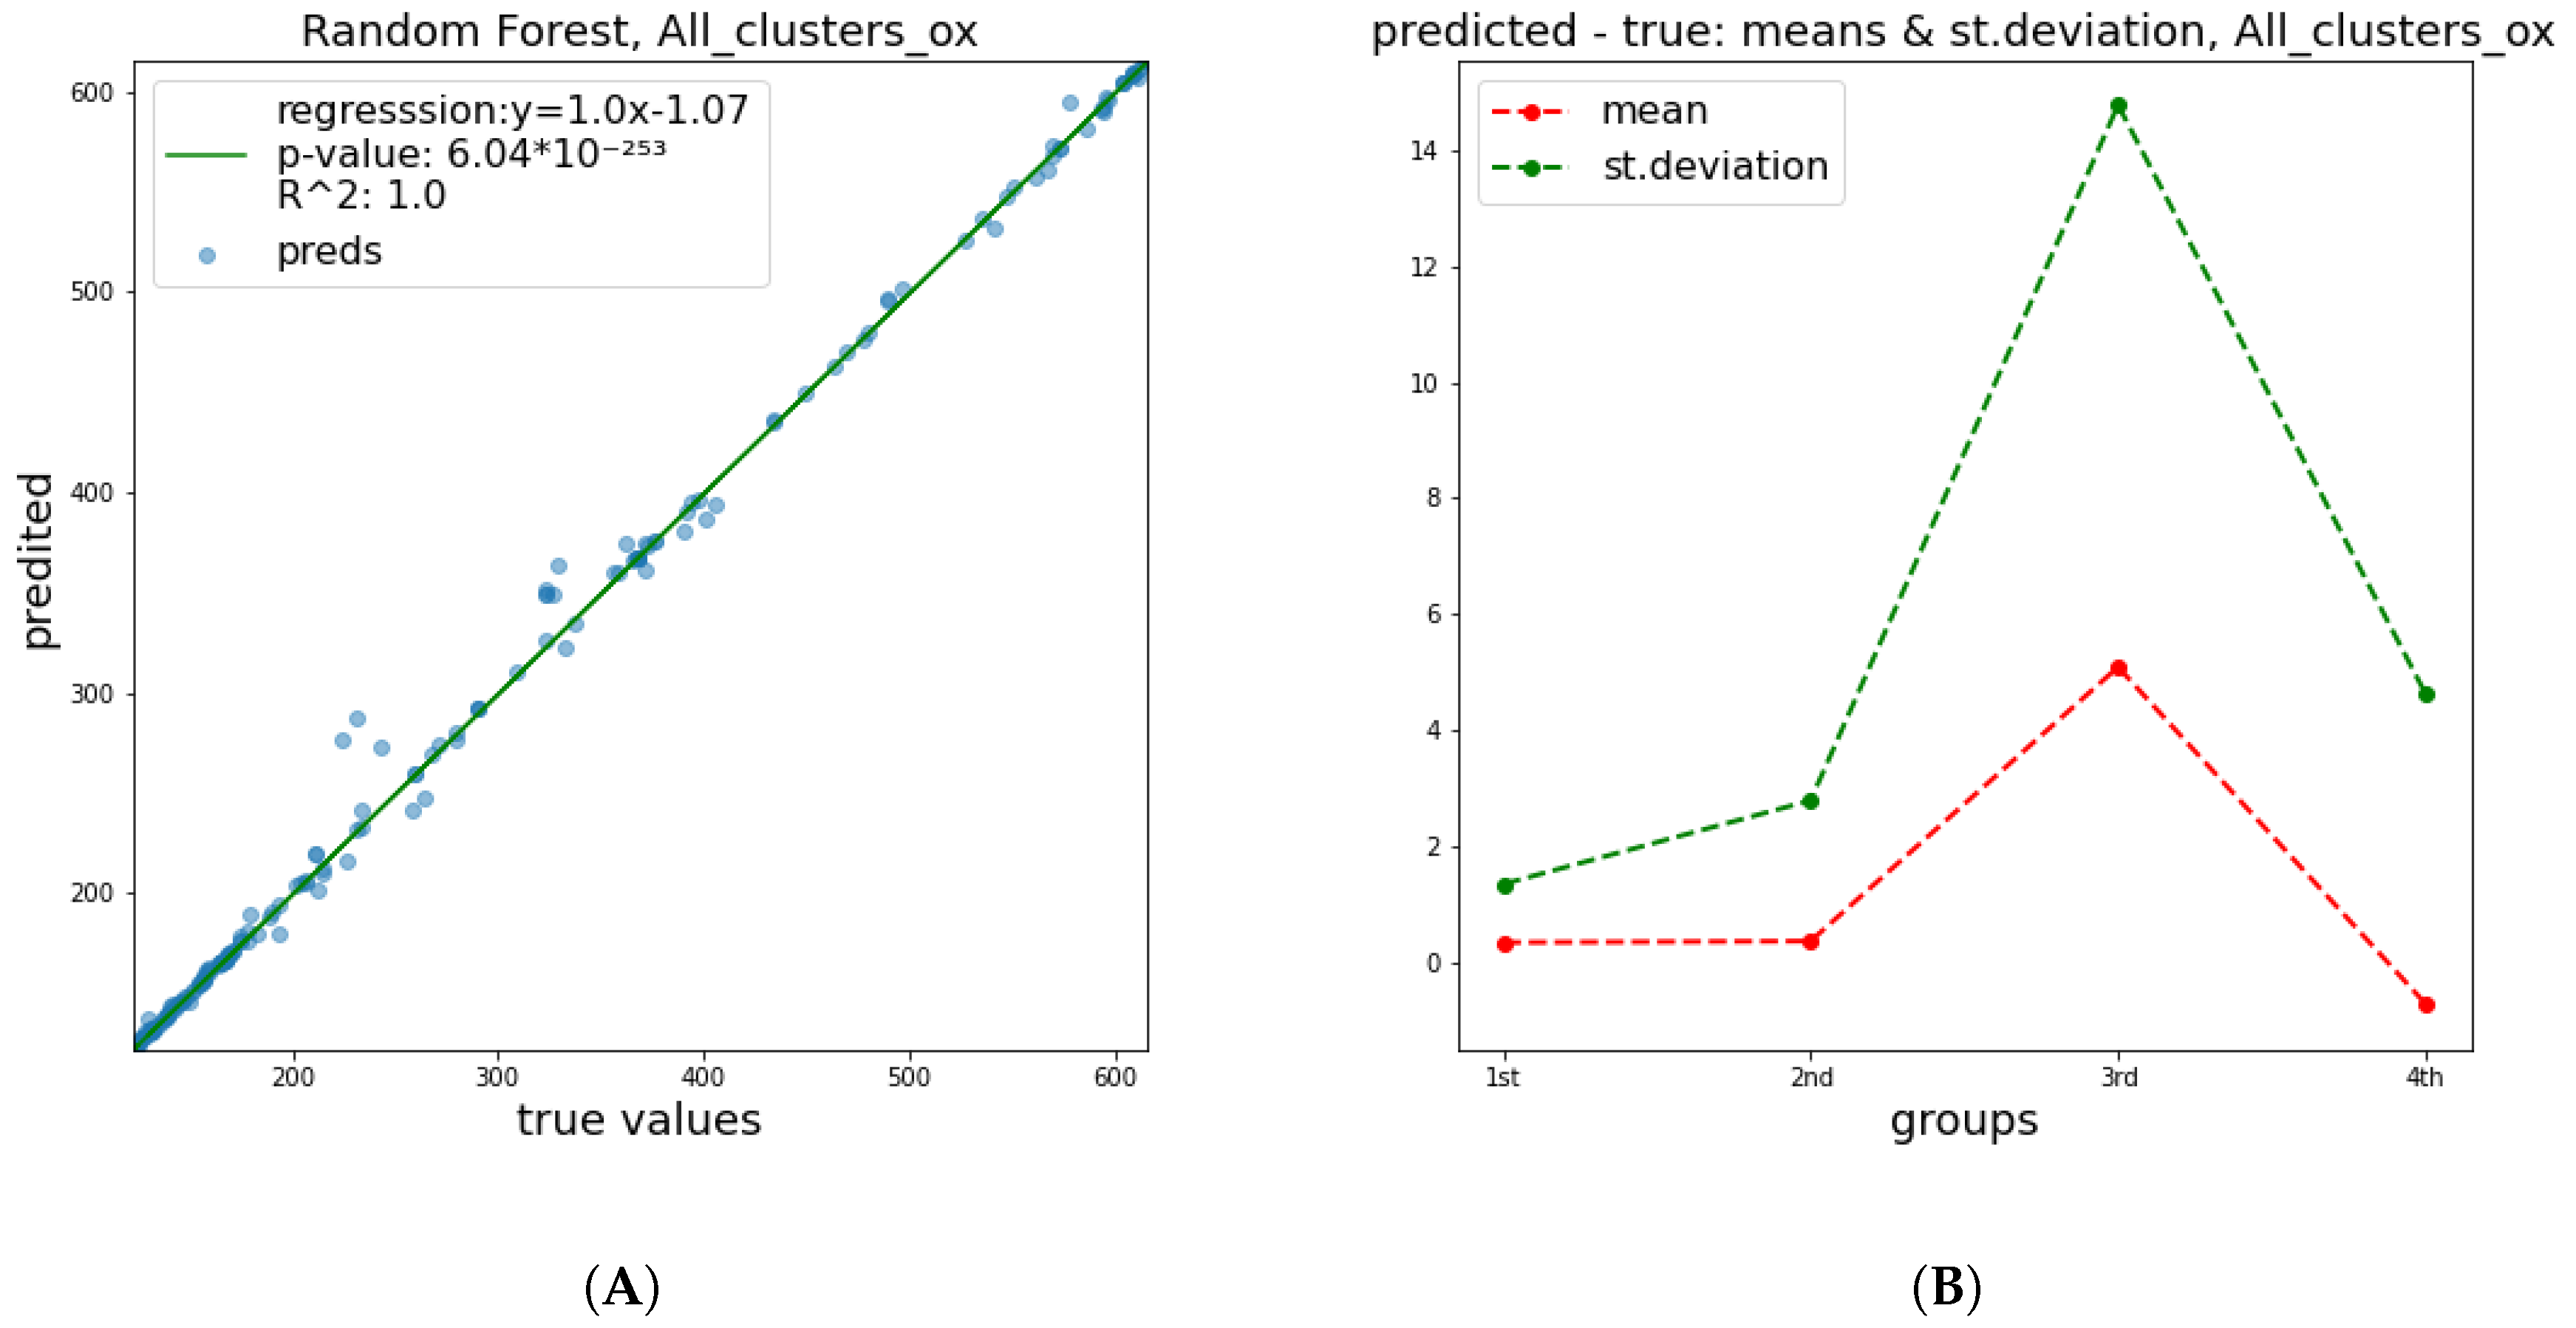
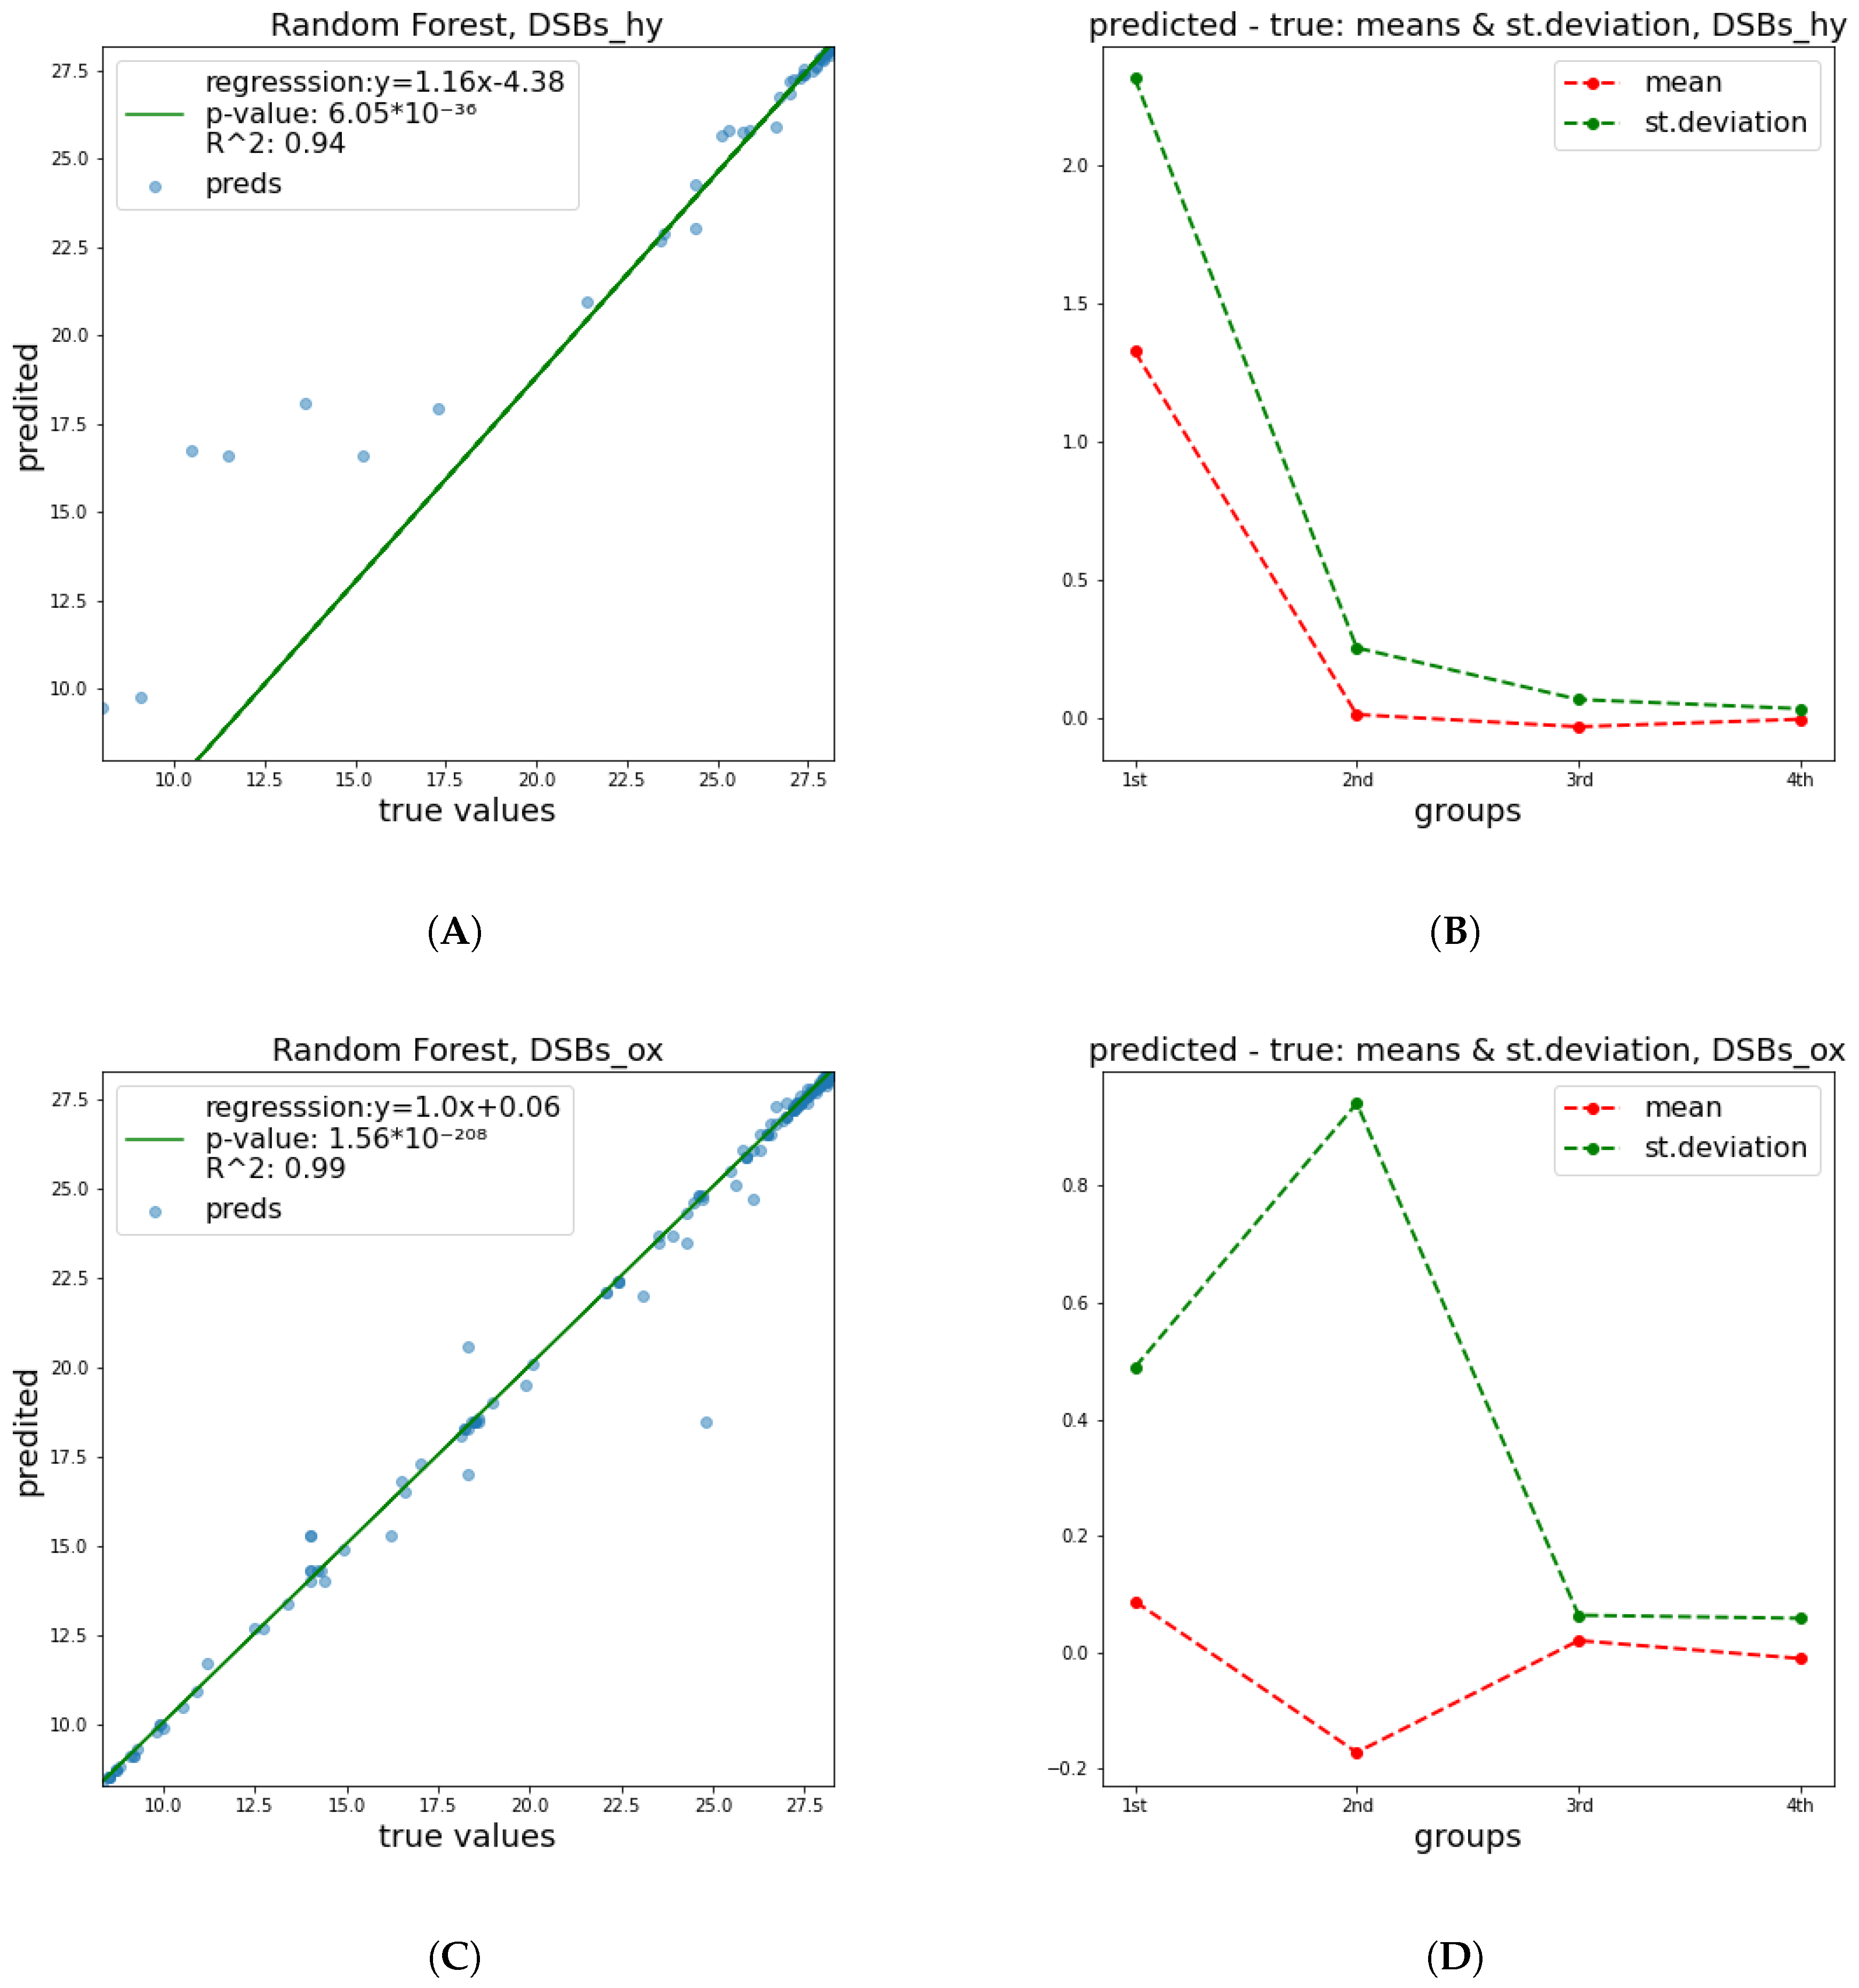
Similarly, the same metrics and visuals are provided for the predicting of DSB clustering damage of the DNA molecules (
Table 2).
These results show a significant improvement of the quality of predictions in relation to
and
parameters. This happened mainly due to the fact that the breaking of a DNA strand is more attributable to a small number of radiation features and has a less complex nature, in contrast to cell apoptosis, which is affected by a numerous factors, including biological DNA repair mechanisms and genes’ functions or possible deficiencies. Therefore, it is easier to predict the damage of DNA molecule. In
Figure 4,
Figure 5 and
Figure 6 below, corresponding plots for the DNA damage features that underline the effect of the improvement shown in the previous table are provided. Additionally, it is apparent that the error of prediction increases for greater values of all clusters.
2.2. Interpretation
2.2.1. Feature Importance
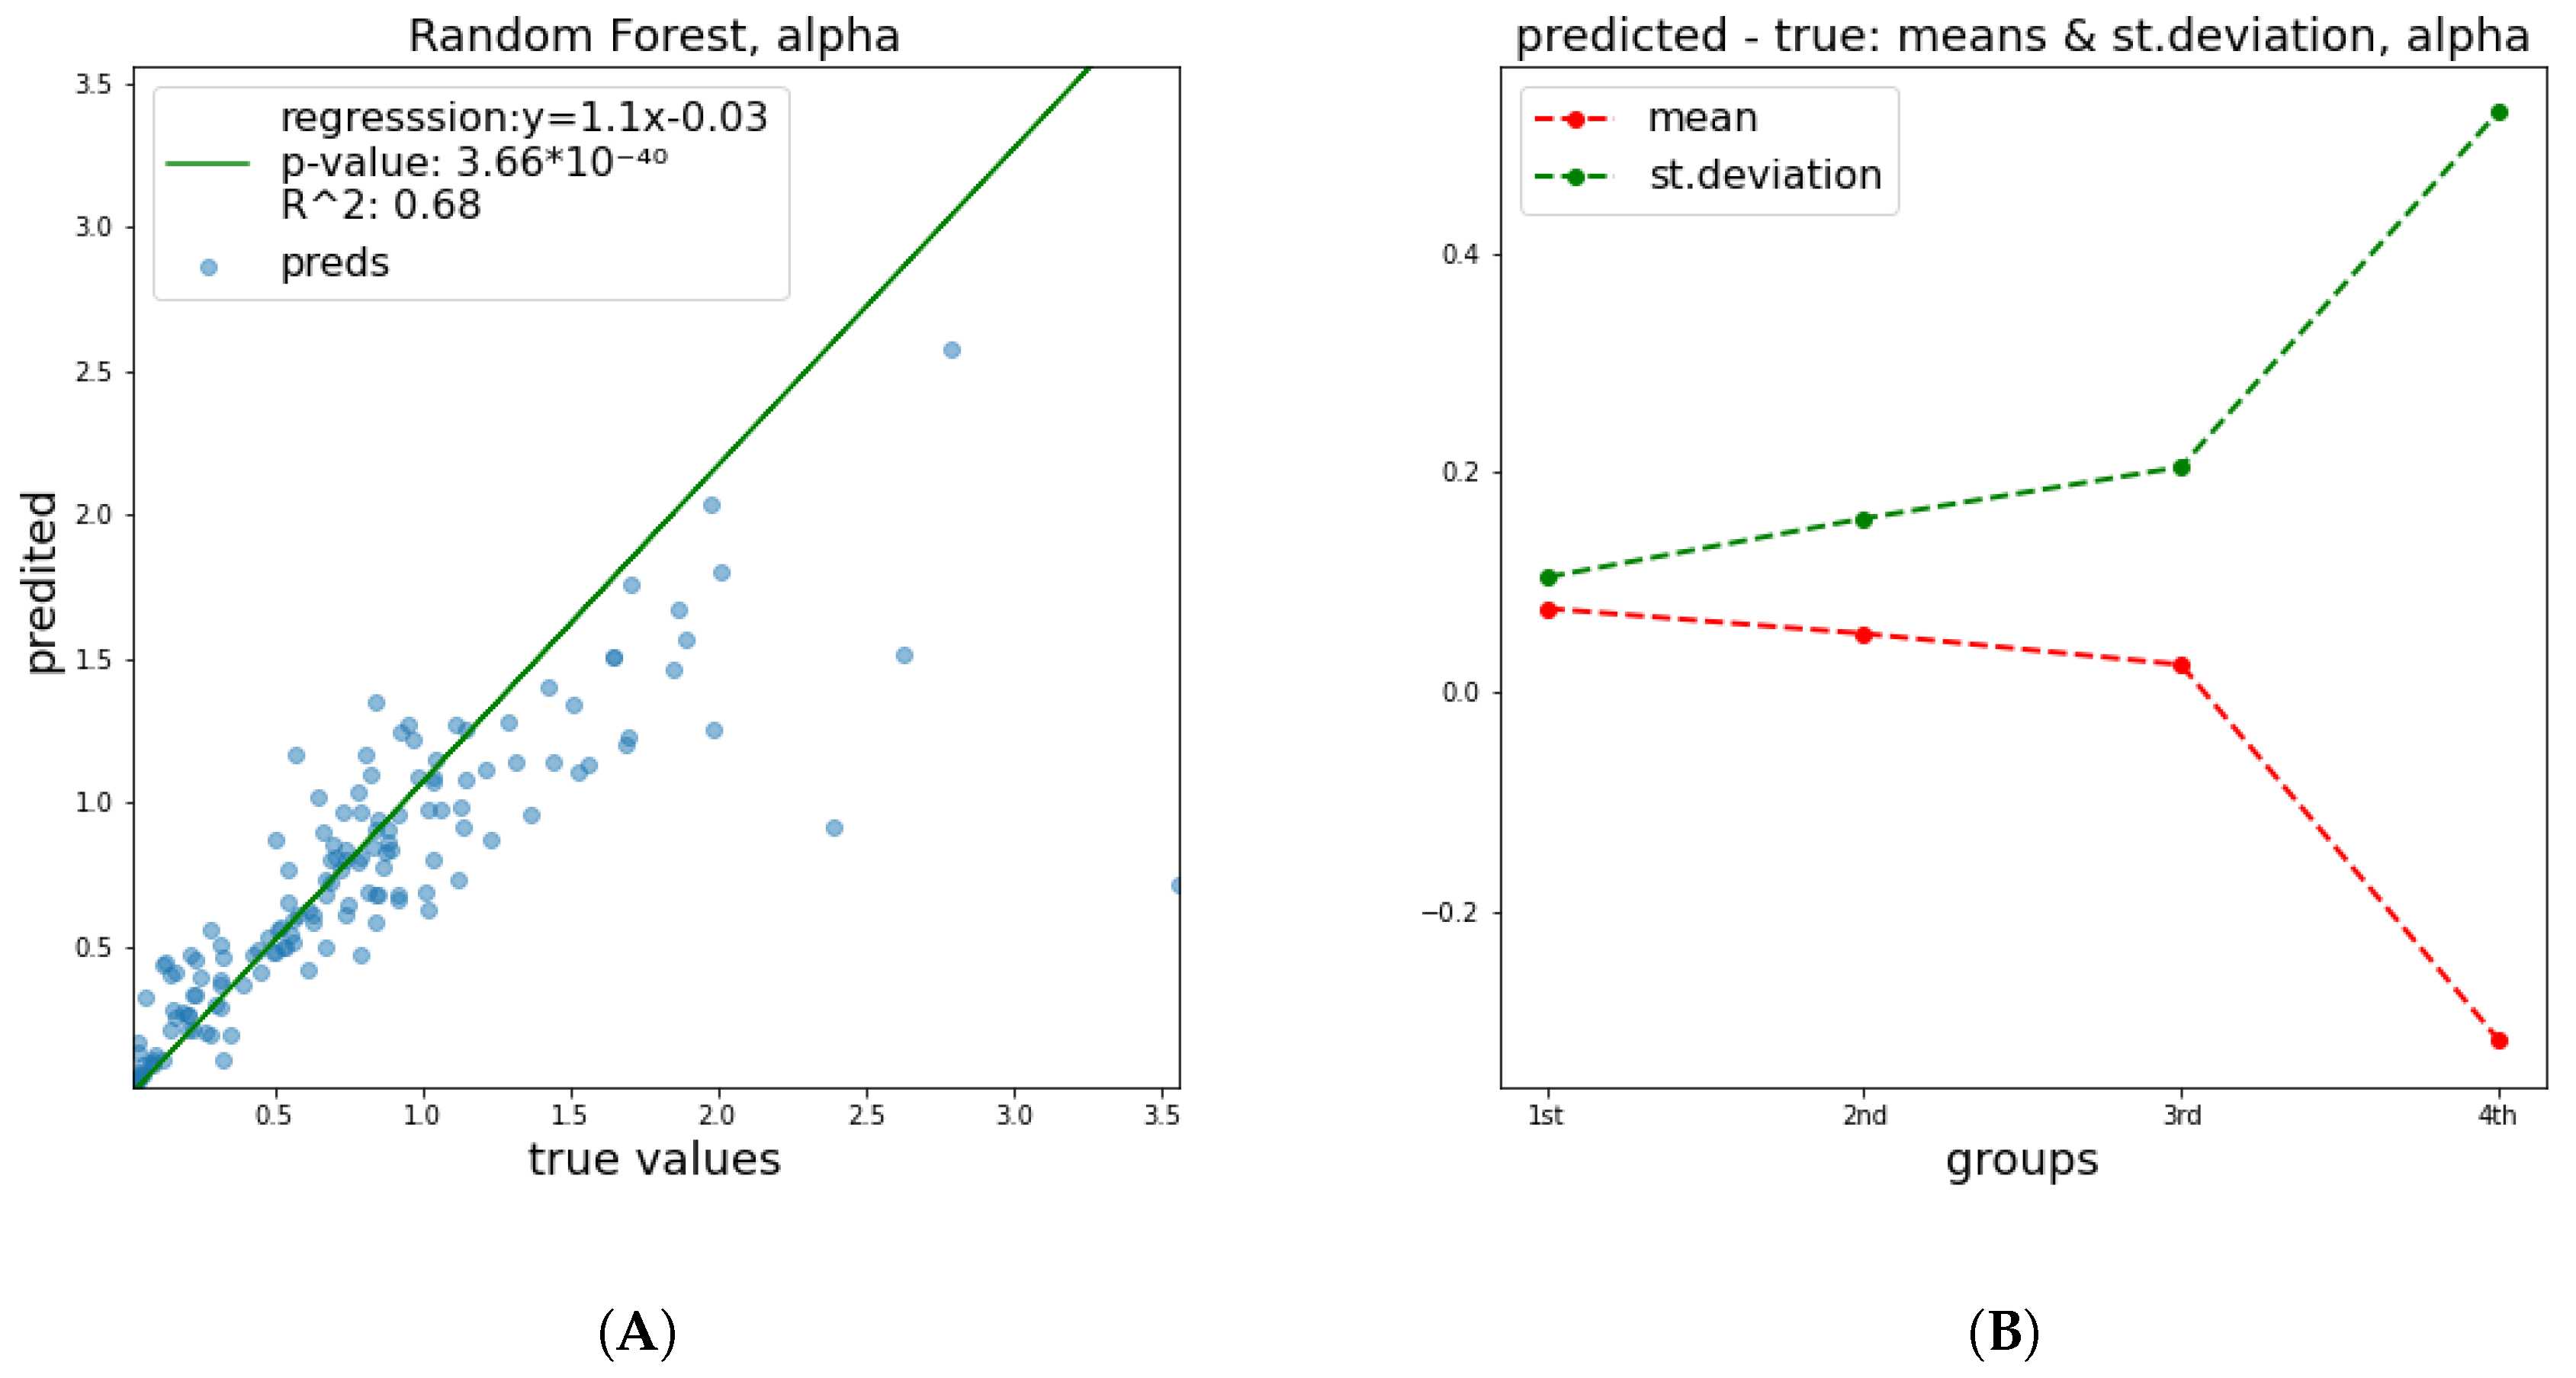
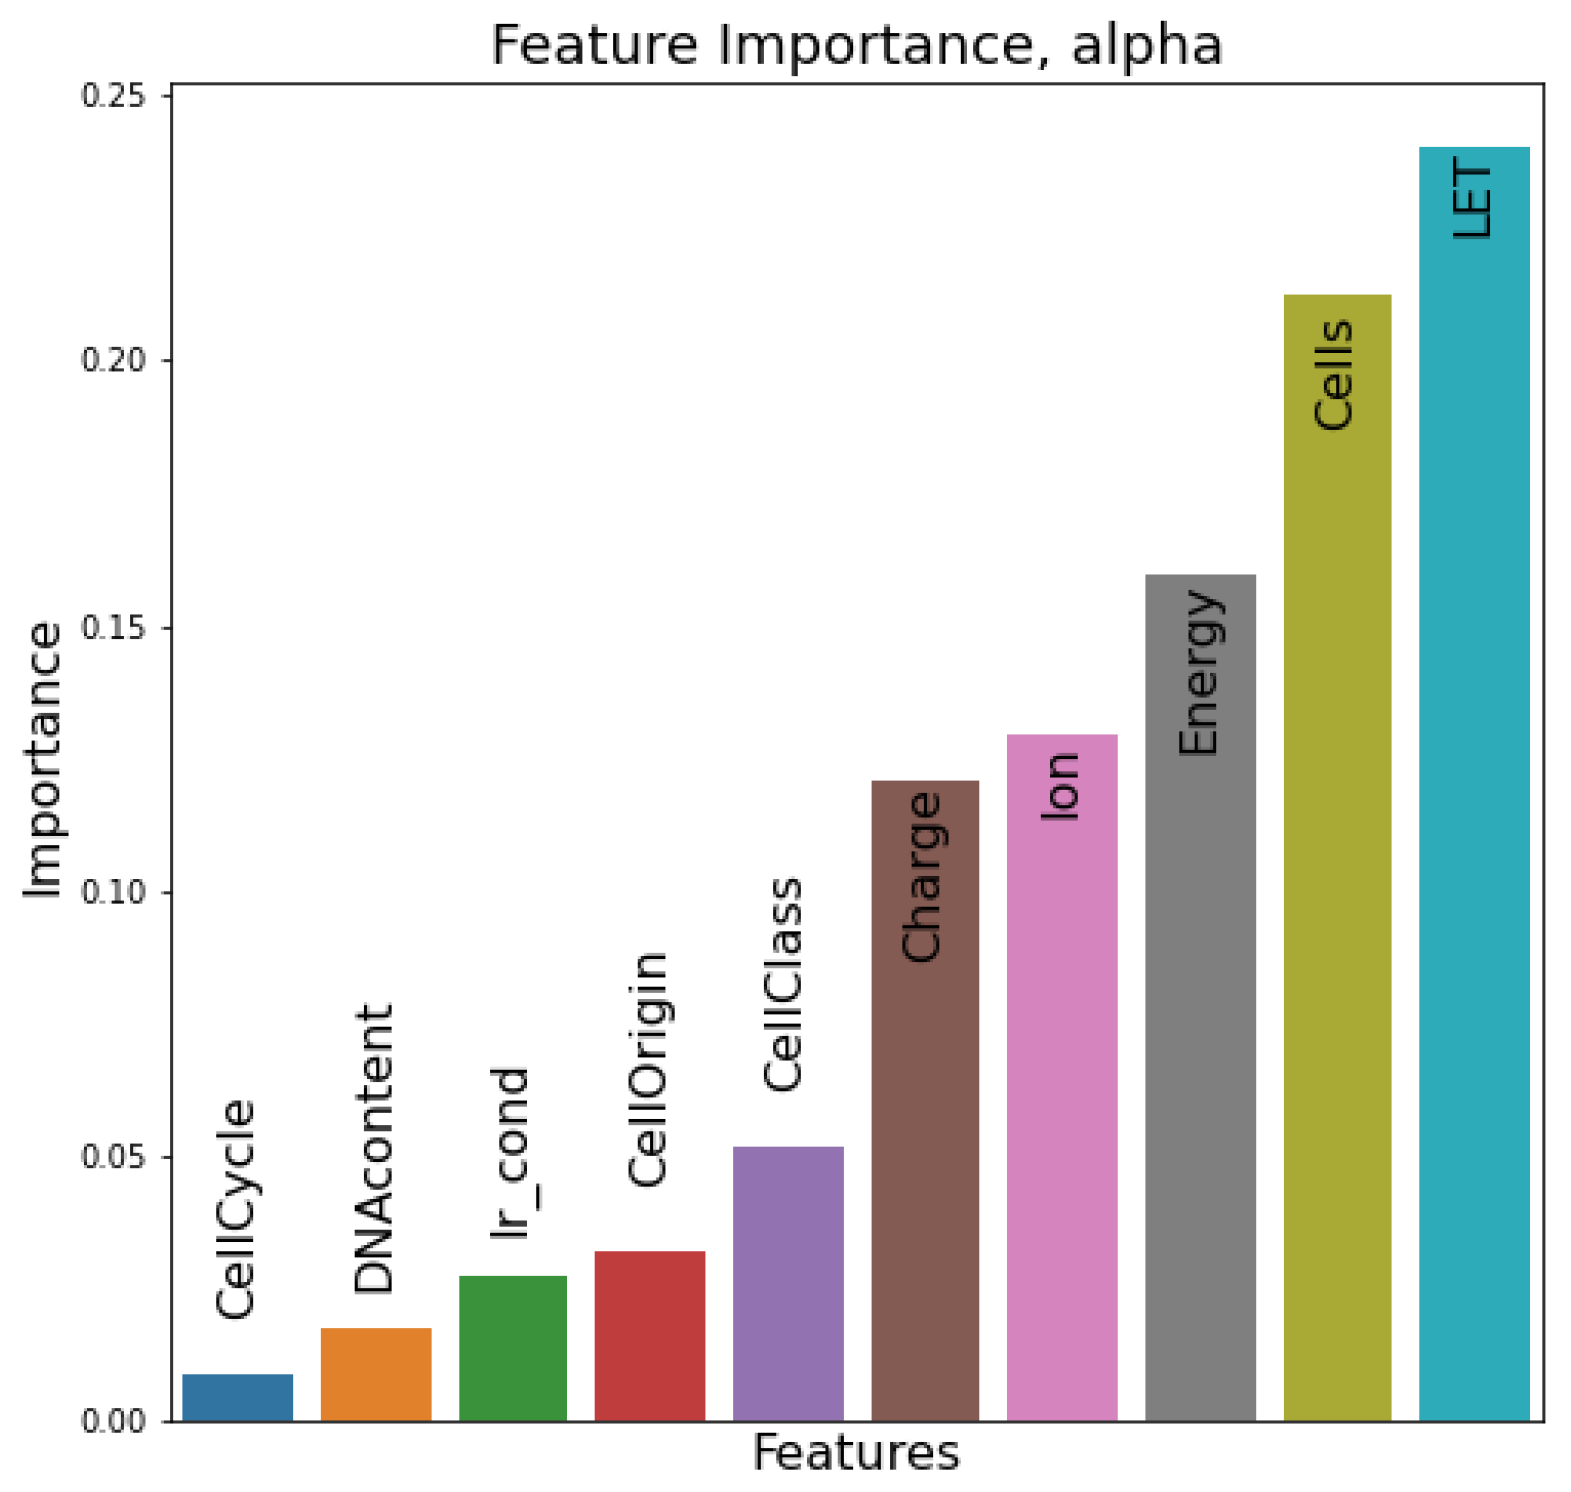
In this section, the relative importance of features in the dataset is presented. In the first case (
Figure 7) of the
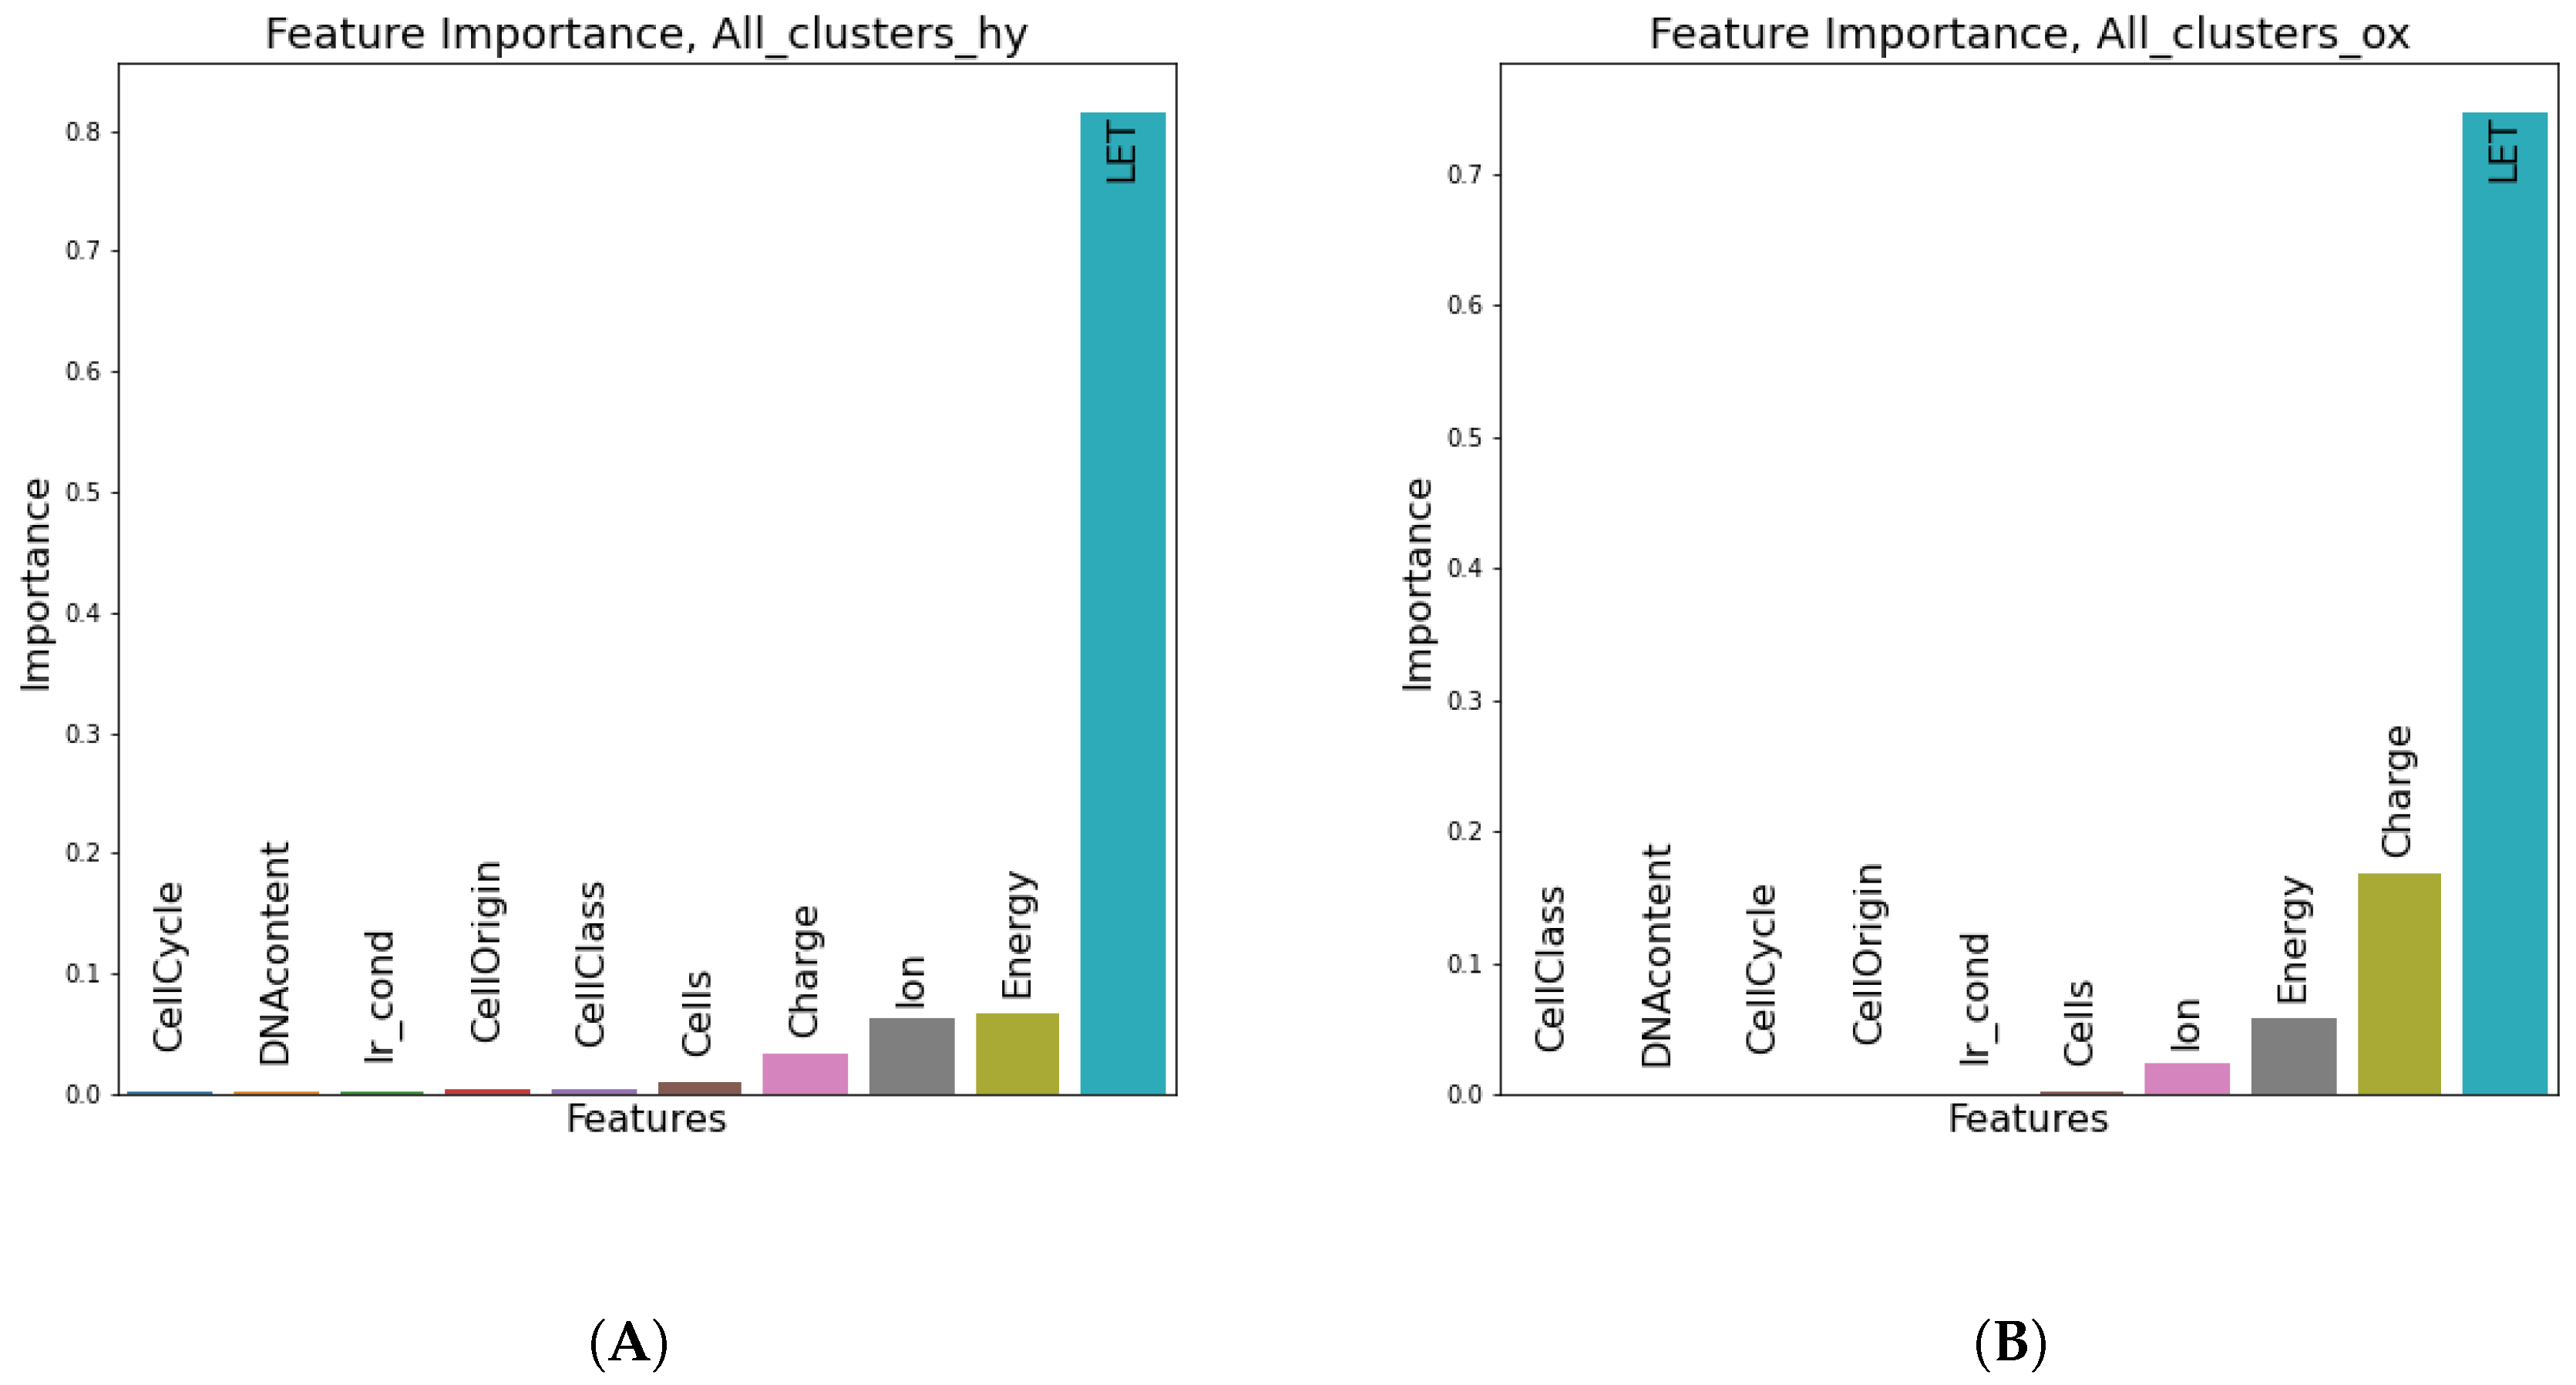
parameter, LET and cell line features seem to be the most determinant factors to the prediction of the estimator, followed by energy and ion species features. In
Figure 8, LET seems to be by far the most instrumental feature (as expected) in predicting the number of all clusters in both oxic and hypoxic cases.
2.2.2. Partial Dependence
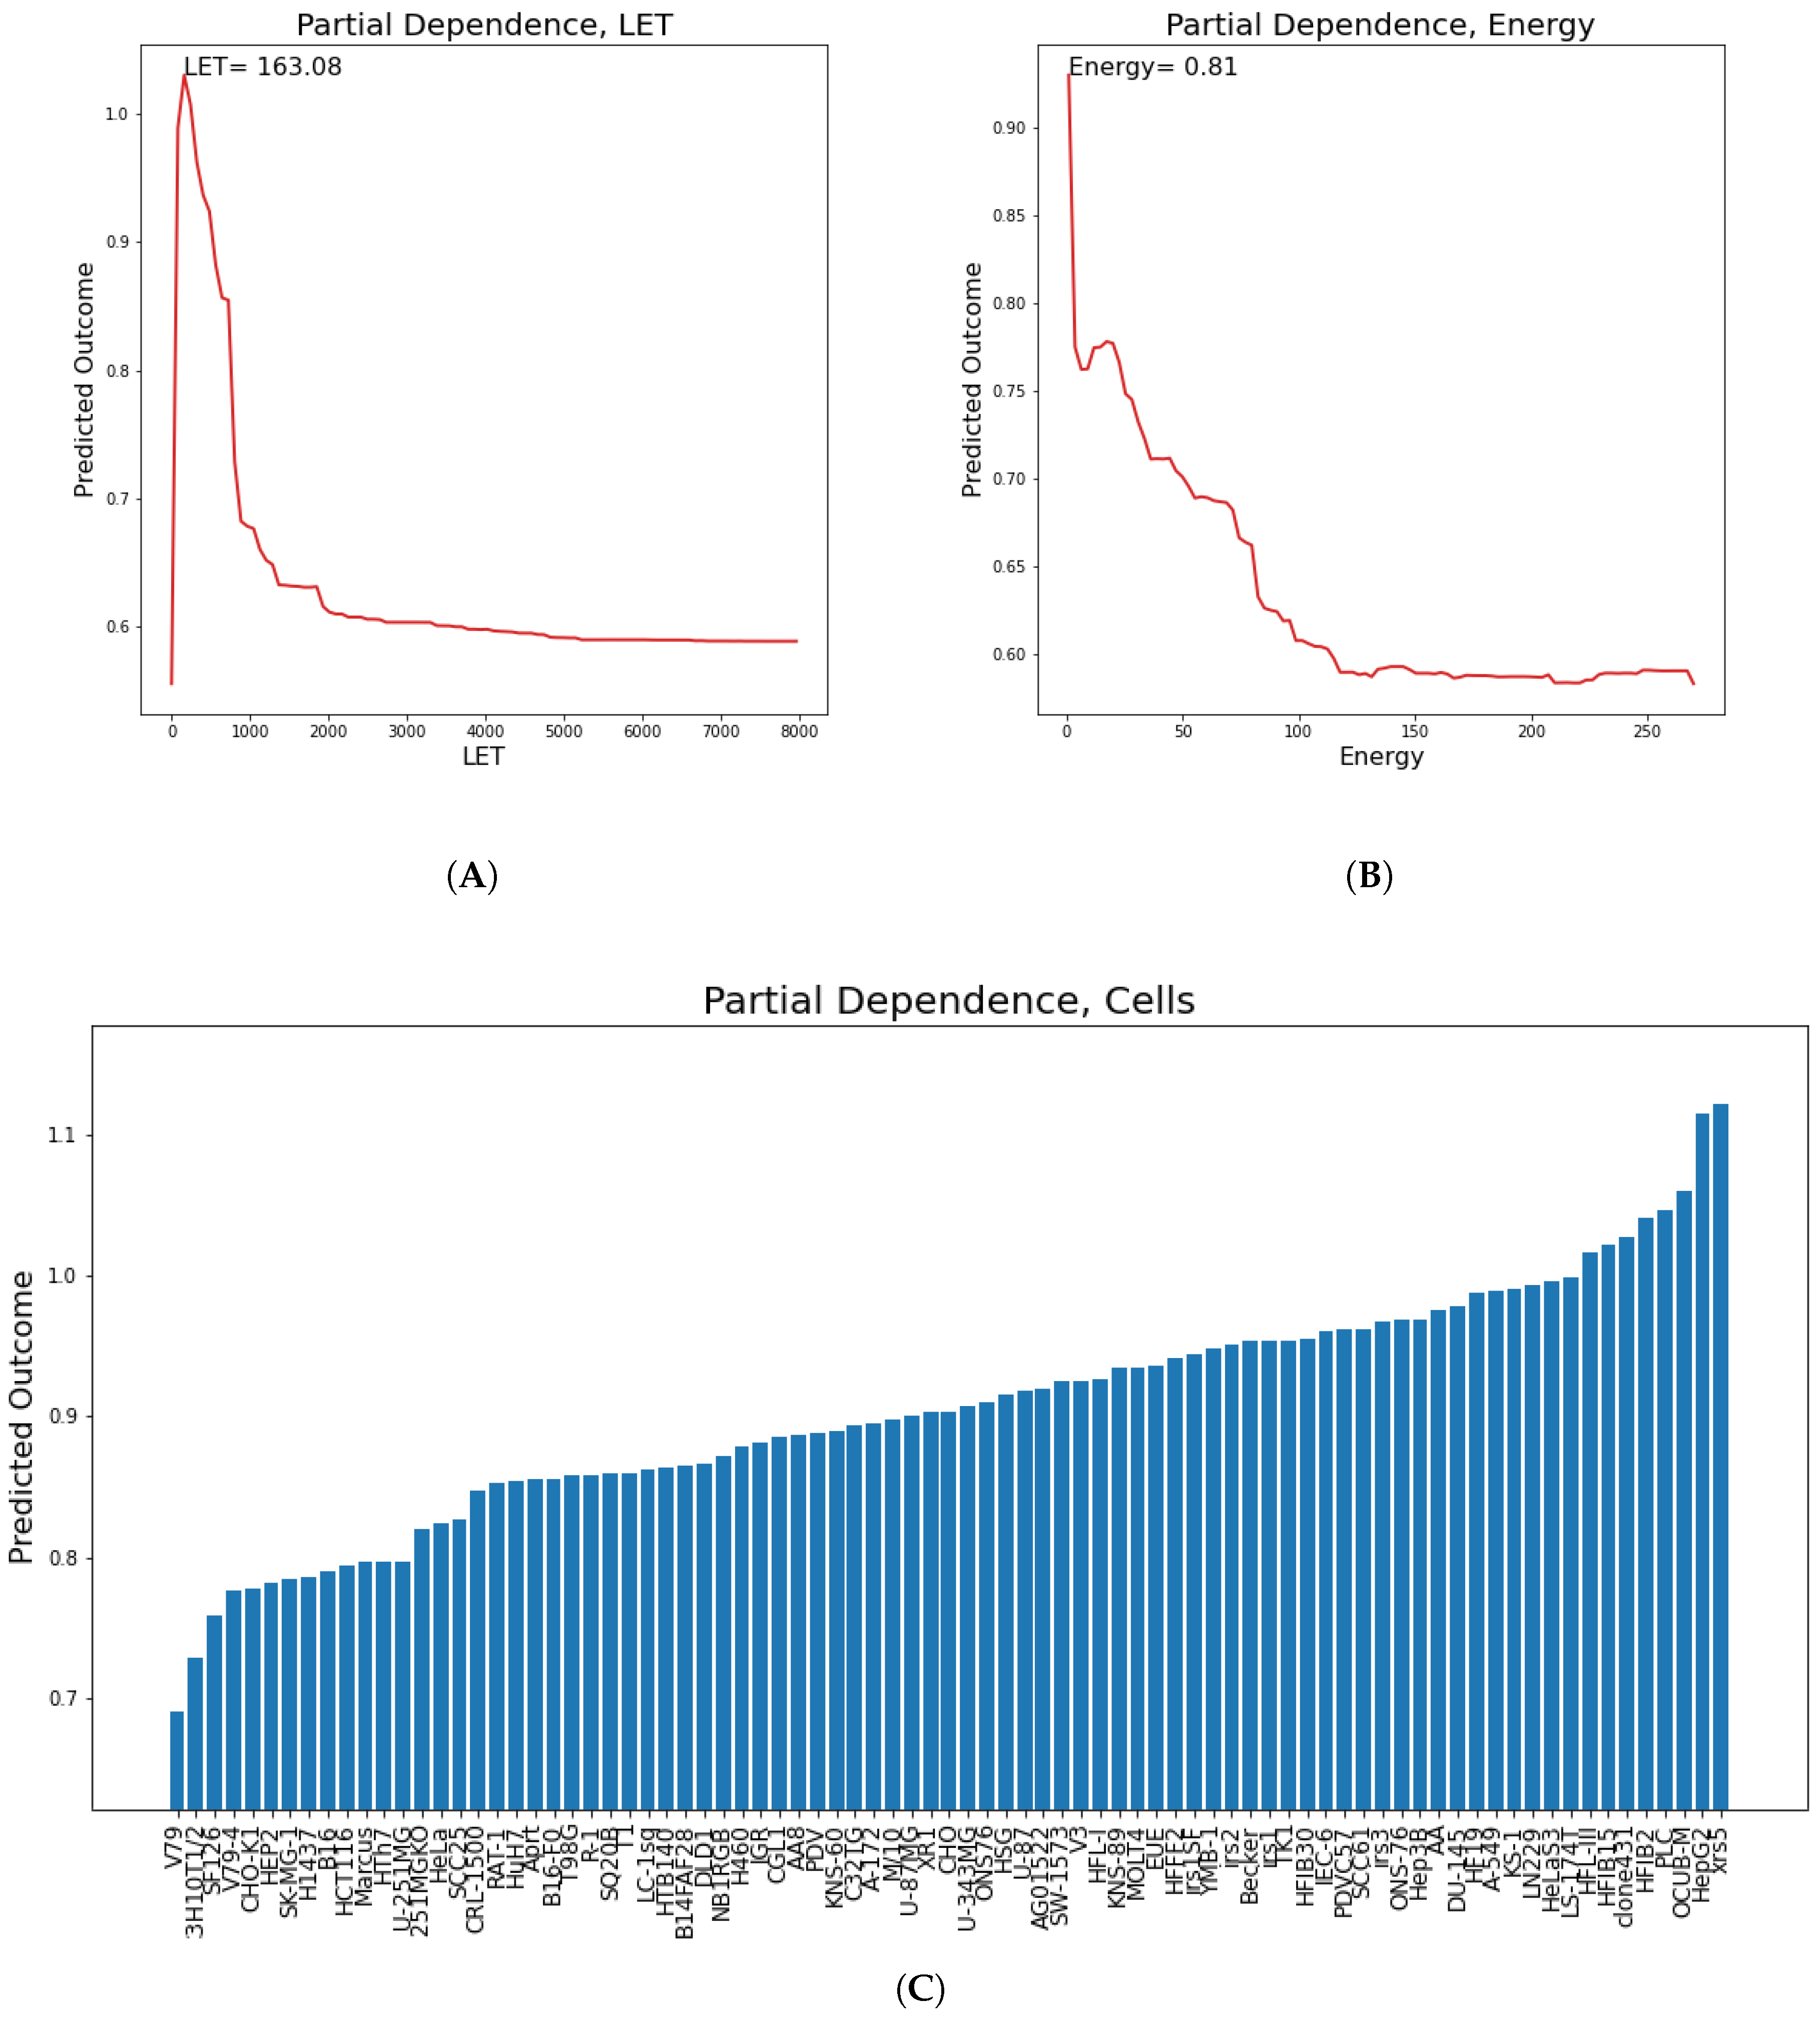
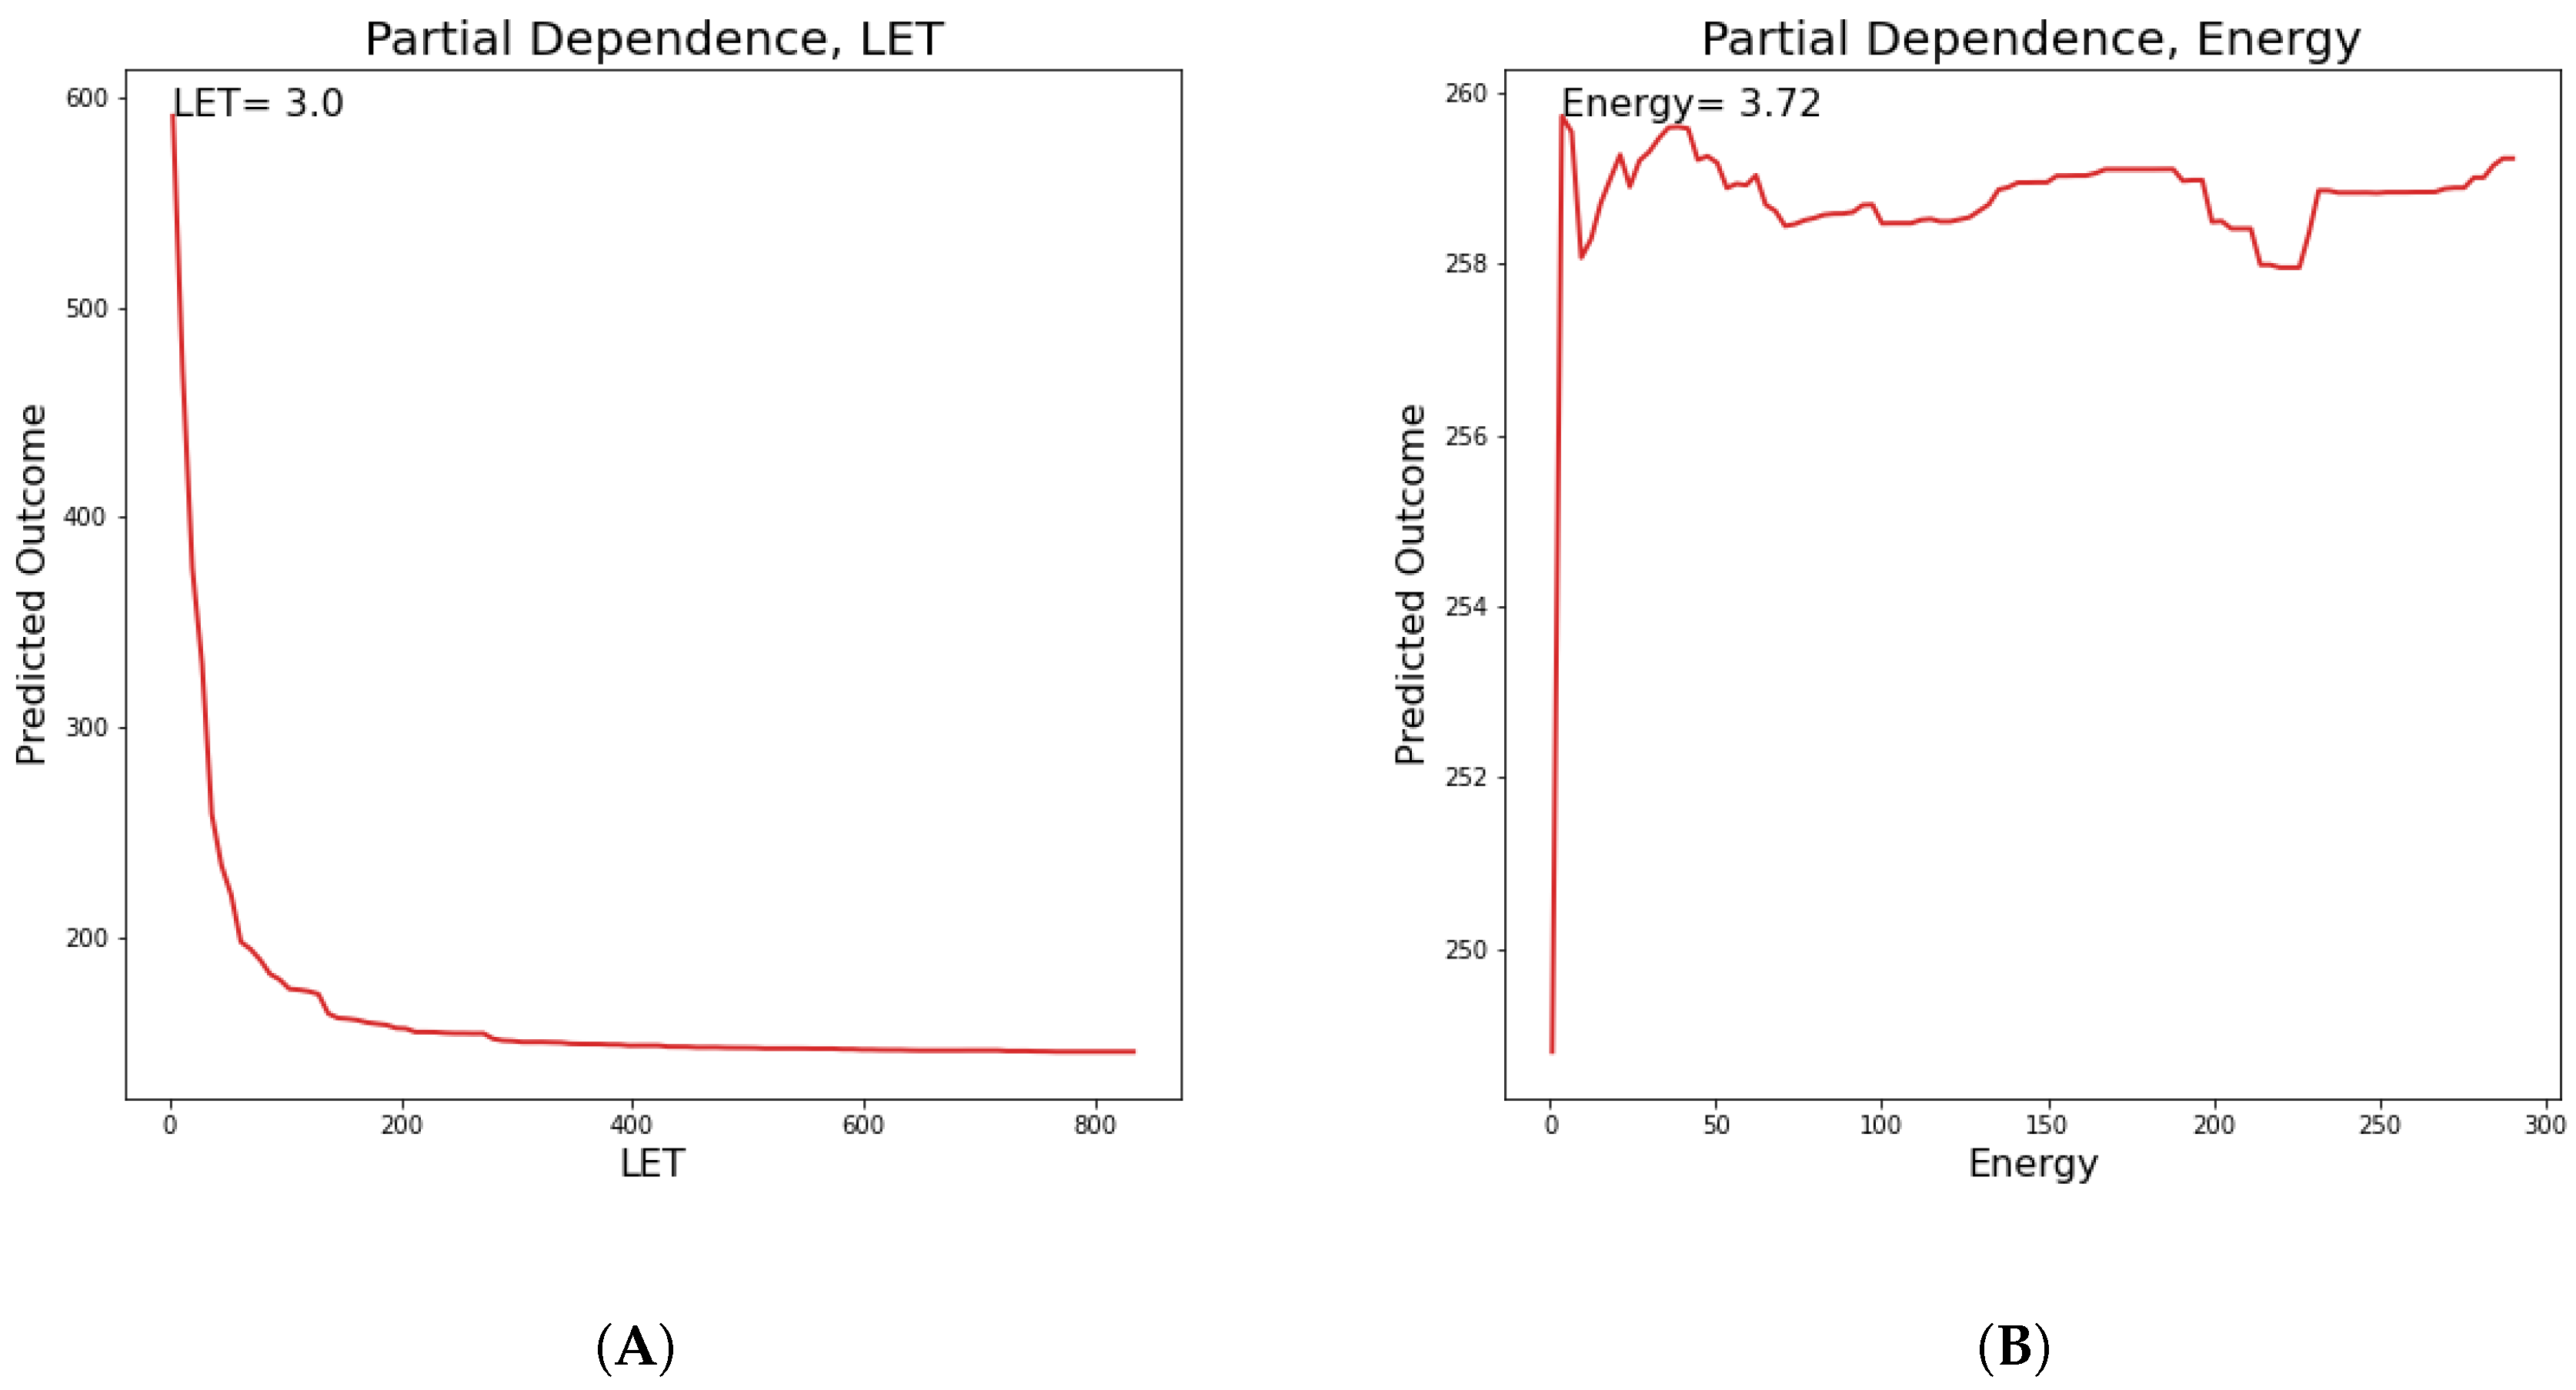
In this section, partial dependence plots are presented concerning all the predicted targets for the three most important features. A partial dependence plot depicts the impact of one or multiple features on the predicted target. It can also reveal whether the relation is linear or more complex. In linear regression, the plot should be a straight line. In this way, partial dependence plots can give valuable insights to biophysical modeling. Additionally, for continuous features, the value of the feature where the predicted outcome is maximum is provided. We will discuss results regarding the
parameter, so as to illustrate how plots like these should be interpreted. LET, cell lines and Energy partial dependence plots are shown below (
Figure 9). Concerning LET, the predicted outcome is reaching a maximum value of 163.1 KeV/
m and falls rapidly into a steady state. For the cell line, it appears that there are groups of cell lines which have the same or very similar predicted outcome, which reaches a maximum for cell lines xrs5, KS-1 and IGR.
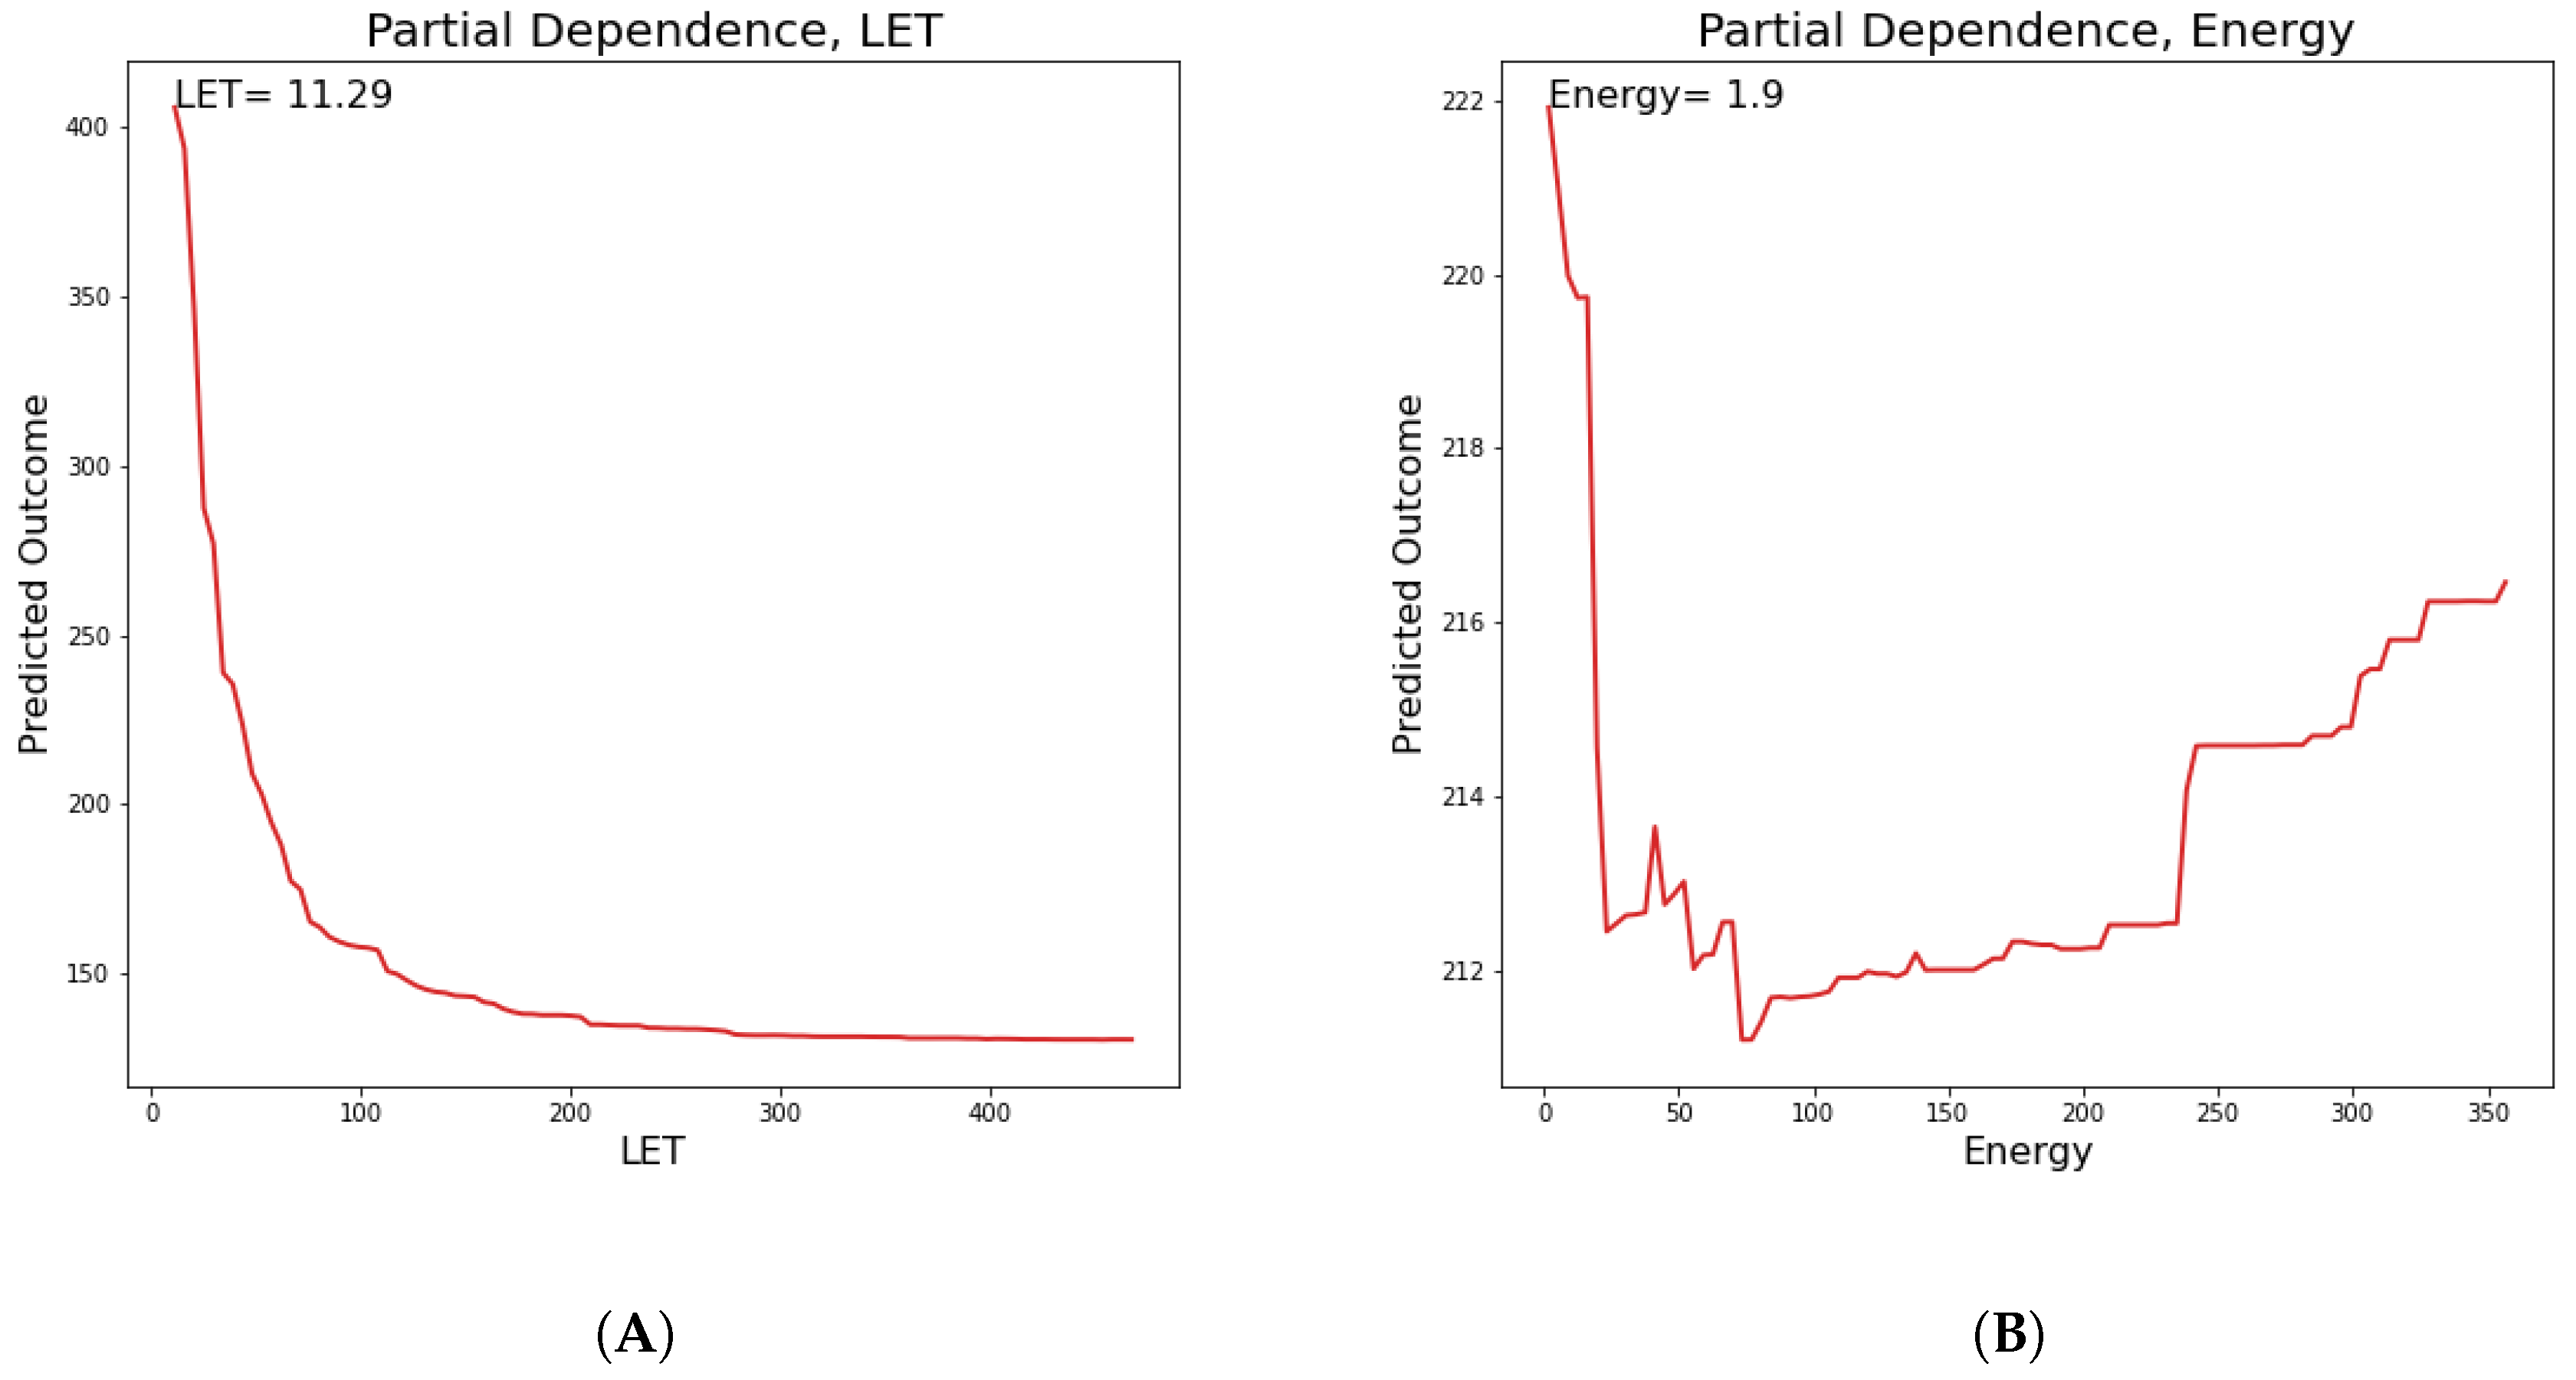
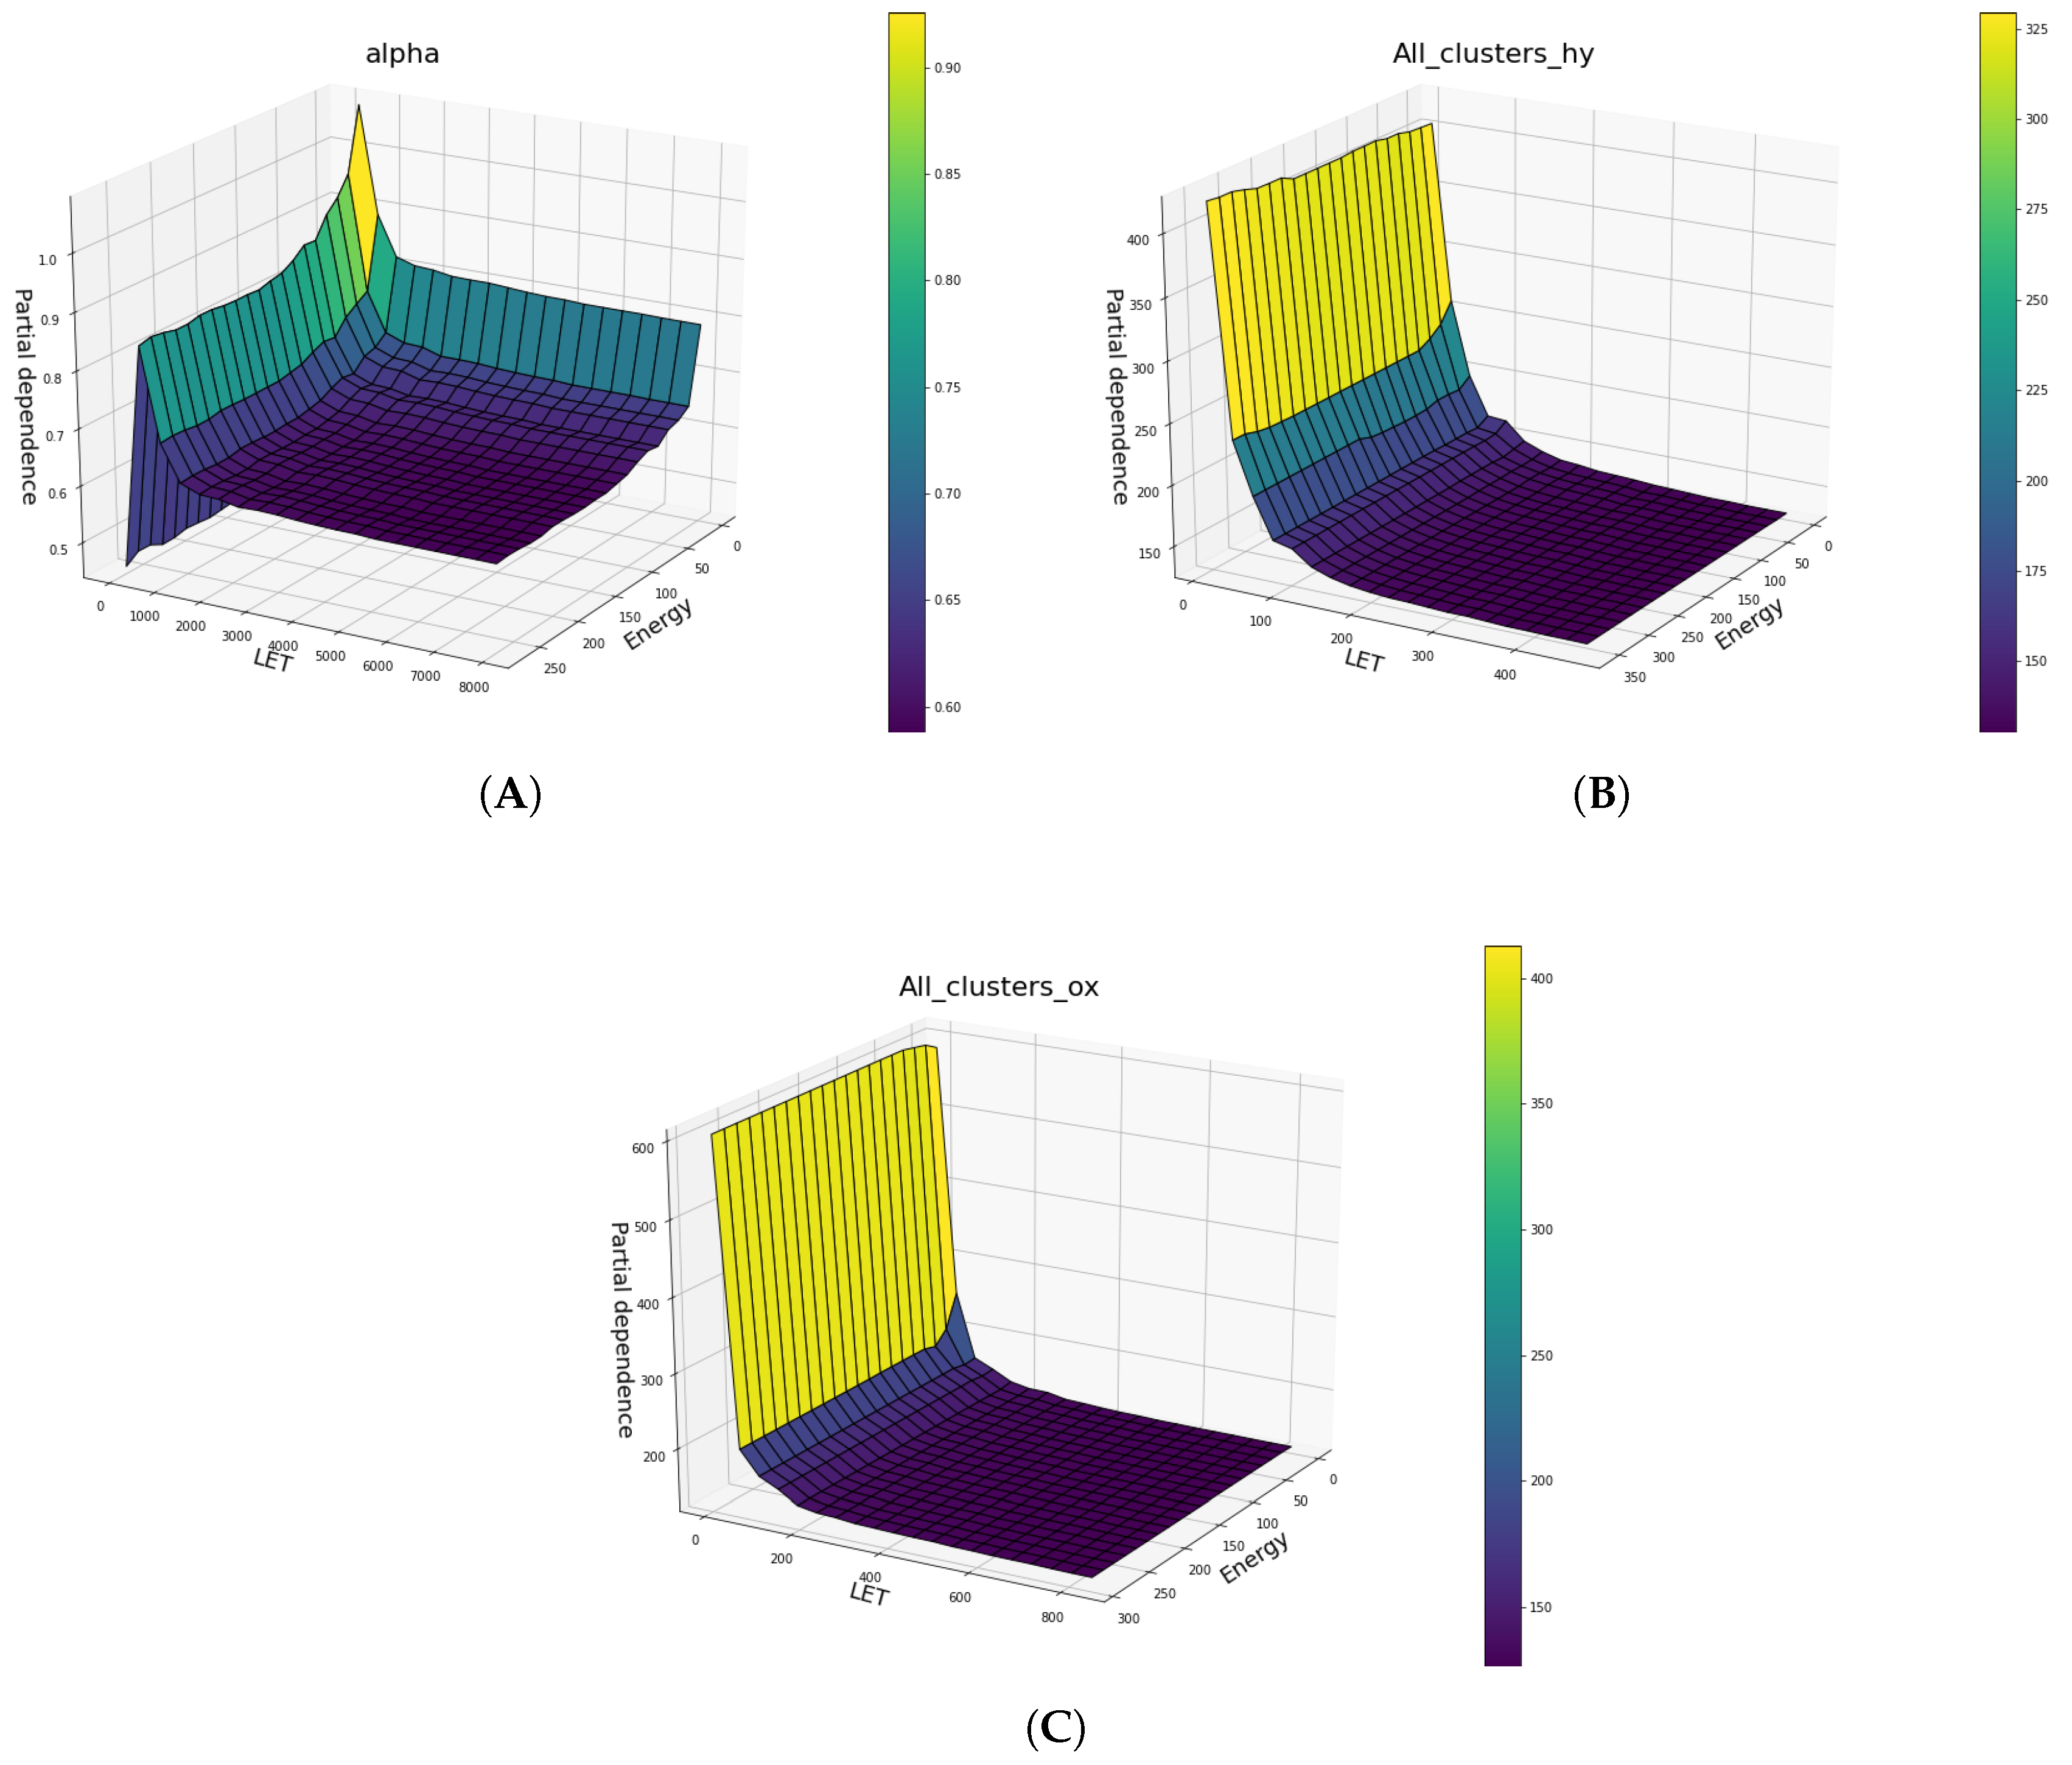
Below in
Figure 10 and
Figure 11, the partial dependences of all clusters DNA damage in hypoxic and oxic cells on the LET and specific energy features are presented.
Below (
Figure 12), several two-way Partial Dependence plots between LET and energy features, which are both continuous features and its comparison is meaningful, are shown, illustrating how the two features influence in tandem the predicted outcome. This produces a three dimensional plot where the two base axes correspond to the two features, and the vertical axis corresponds to the predicted outcome.
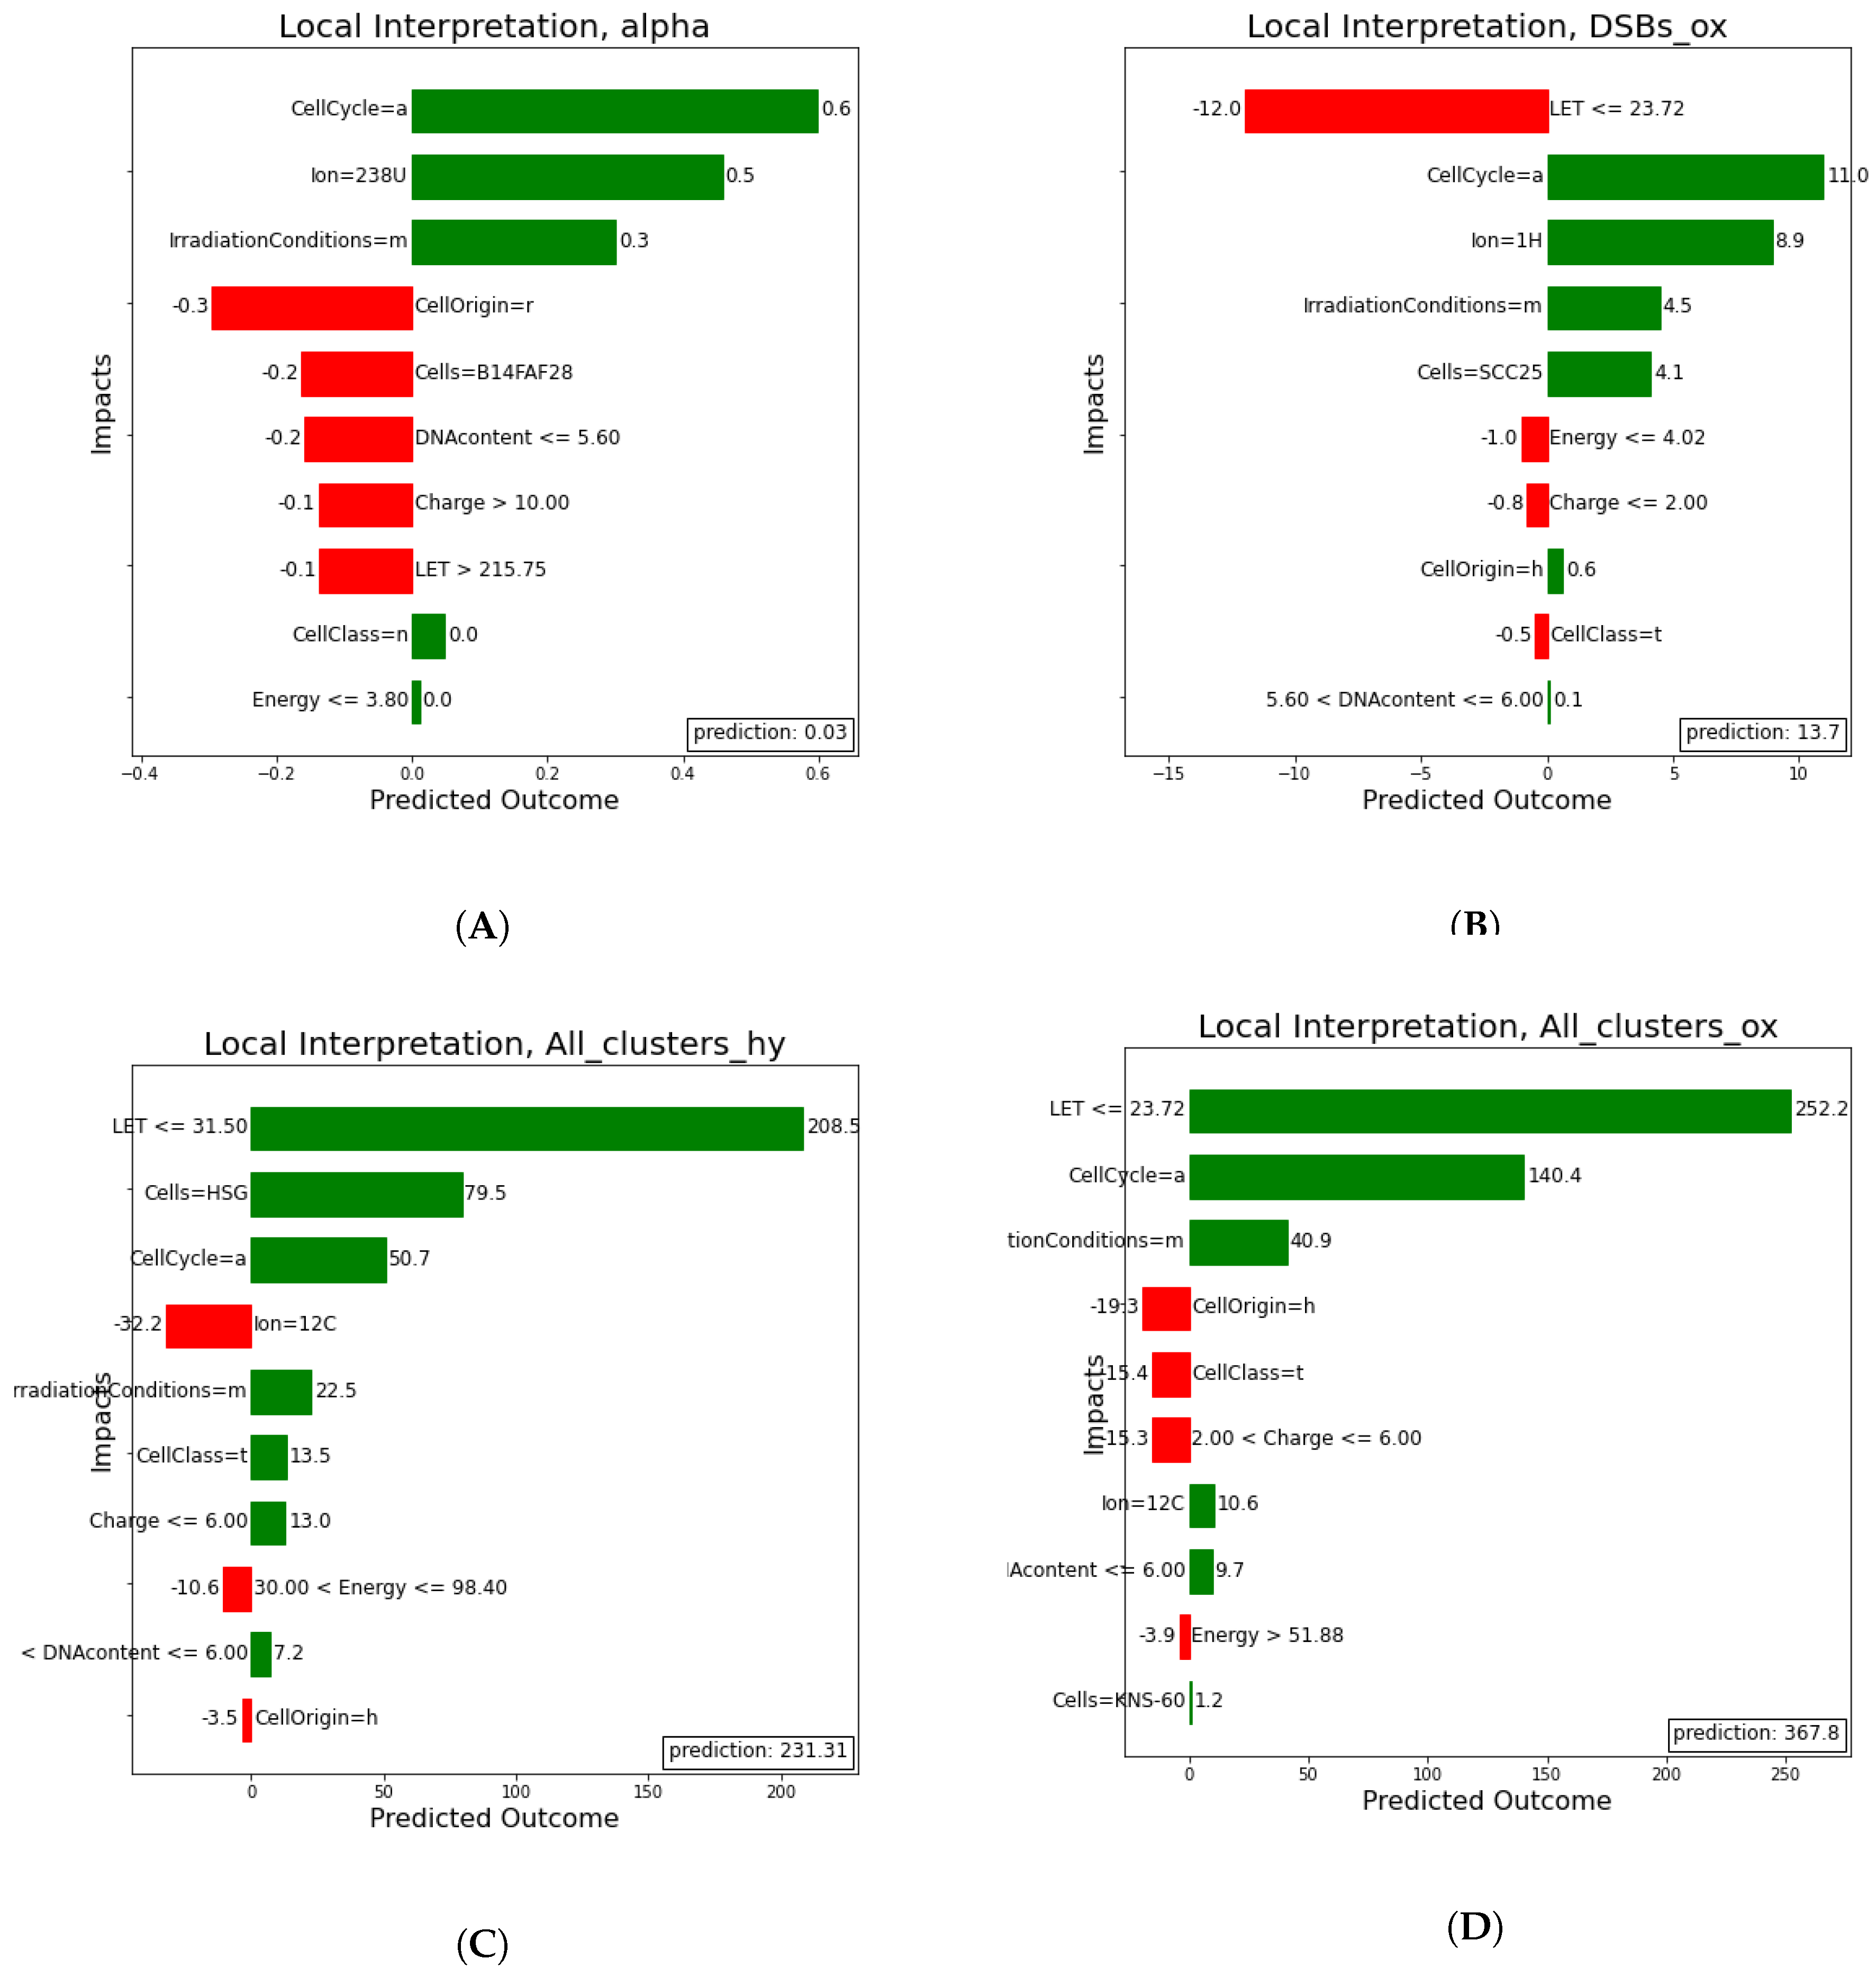
2.2.3. Local Interpretation
Here, (
Figure 13) a local rule-based interpretation of individual predictions is shown. The plots depict an explanation of the predictions of four irradiation experiments, based on specific values of the features in a descending order of significance. The direction of the bar, signifies whether the feature has a negative or positive effect on the predicted outcome (left being negative and right positive). In
Table 3 below, the exact values predicted in comparison to the true values on which the local prediction interpretations were made, are shown.
2.3. Significance Analysis
To establish whether the ML model has statistically significant better performance than a classic statistical method, several statistical models were also fitted and compared to the ML model. Here (
Table 4), the results from this comparison with the statistical model that fared better, which is the generalized linear model [
9] with Poisson link function, are presented.
Several link functions were tried, among which the Poisson fared better. Linear regression assumes that the dependent variable is normally distributed. GLMs can have dependent variables distributed in other ways, not necessarily by following Normal distribution and the relationship between independent and dependent variables can have a non-linear form. The link function links the mean of the dependent variable which is to the linear term through a link function . This approach seems to be the most appropriate for our task, given the nature of the responses of Cells to radiation, which is not linear.
The ML model consistently produced lower mean errors. The question is, whether there is significant difference in the error distribution, and by what margin. Hypothesis H0 is that the means of error distributions do not differ significantly. For all targets, the ML model displayed significantly better performance compared to any classic statistical model, as indicated by the respective p-values by orders of magnitude, with the exception of the ML model trained for parameter, where the rejection of H0 hypothesis indicates that our model does not manage to improve the prediction in relation to the statistical model, with a cutoff value of 0.05. This last point is another sign of the inherent noise and large uncertainty in parameter and indicates that both ML and statistical models are similarly bad at predicting the parameter
4. Discussion
The results include multiple key findings. Firstly, the better and safer prediction of
parameter compared to
parameter in the survival studies, indicates the difficulty of measuring the latter. This happens probably due to the fact that its magnitude is small enough that is comparable to the experimental error of measurement, which results in a very noisy and near random picture for the
parameter. This is also merely a statistical effect: a small absolute value of
(and correspondingly large absolute value of
) indicates that the tumor has a very low sensitivity to the effects of fractionation. All tumors with
close to zero have low fractionation sensitivity, while tumors with a large
are sensitive to fractionation [
21]. The lack of an adequate prediction for
parameter does not allow the establishment of major causal interpretations.
Additionally, the most important features for predicting cell survival, as seen by the importance of
parameter, are the LET and cell line features. This is a fact that shows up in other cell survival studies [
22] too. In partial dependence plots, specific cell lines that have the greatest impact on the
parameter are shown, which translates to cell lines that are more prone to suffer higher death rates for the same amount of radiation, while others exhibit significant radiation resistance. The interesting fact is that cell line is marginally more significant than LET when talking about ion irradiation. Furthermore, the results of all clusters are similar in their dependence, mainly involving a small number of radiation features.
Another important fact is the non-linear relation between the most important features and the predicted in all cases, which supports even more the fact that a classic statistical model would be either not suitable or computationally expensive to implement and therefore impractical. Partial dependence plots can provide valuable biophysical insights to the phenomenon and explanatory power to the model. Examples of these aspects are the maxima displayed in the partial dependence plots, which are open to biological interpretation, and the behavior of cell lines in the same plots, where distinct cell lines cause the predicted outcome to rise sharply. Additionally, there are several cell lines that exhibit a very similar biological response.
The way in which
changes with increasing LET is less well documented than for larger and easier to measure changes in
with increasing LET. Increasing LET must initially enhance the intrinsic radiosensitivity parameters, where the increment in
far exceeding that in
. This happens because a greater proportion of clustered damage is non-repairable by non-homologous end joining process, although the repair of sub-lethal damage continues, probably with lower fidelity and even the recombination repair mechanism may also be overwhelmed by increasingly complex lesions affecting the same sites on sister chromatids [
23].
Another interesting fact is that for the energy and LET features, dependence starts from a peak early on and then decreases rapidly, which is a clue that above a threshold of LET and energy, any further increase is irrelevant to the outcome of either survival (
and
parameters) or DNA damage (all clusters). As far as we know, the severity of complex damage increases with LET, especially when it is higher than 150 KeV/
m [
24]. This means that repairability is decreased with an increase in LET up to 150 keV/
m or higher, reaching an apparent minimum of “zero.” Additionally, the decreasing portion in LET versus
relation would be due to overkill [
25]. The overkill effect is sometimes called the phenomenon when there is an optimal LET for cell inactivation, after which there is a reduced effectiveness in cell inactivation per unit dose, with the effect that the slope of the survival curve decreases again [
26].
This study aimed to showcase that there can be an ML-based computational framework that will provide both good predictive performance along with interpretation. A future step would be to enrich the dataset with more studies and different types of IR, apart from particles and radiation regimens, and therefore increase the accuracy and predictive power of our ML-model. We envision applications of our methodology in various areas such as radiation protection and in the medical field where high-LET particles are to be used for tumor treatment.

 ,
, 


