Article

Tracking Tourism Waves: Insights from Automatic Identification System (AIS) Data on Maritime–Coastal Activities

by
Jorge Ramos
1,*,
Benjamin Drakeford
2,
Joana Costa
1,3,
Ana Madiedo
1,4 and
Francisco Leitão
5
1
Research Centre for Tourism, Sustainability and Well-Being (CinTurs), University of Algarve, 8005-139 Faro, Portugal
2
Centre for Blue Governance (CBG), University of Portsmouth, Portsmouth PO1 2UP, UK
3
Faculty of Sciences and Technology (FCT), University of Algarve, 8005-139 Faro, Portugal
4
Centre for Marine and Environmental Research (CIMA), University of Algarve, 8005-139 Faro, Portugal
5
Centre of Marine Sciences (CCMAR), University of Algarve, 8005-139 Faro, Portugal
*
Author to whom correspondence should be addressed.
Tour. Hosp. 2025, 6(2), 99; https://doi.org/10.3390/tourhosp6020099
Submission received: 14 April 2025 / Revised: 7 May 2025 / Accepted: 23 May 2025 / Published: 31 May 2025

Abstract

:
The demand for maritime–coastal tourism has been intensifying, but its offerings are sometimes limited to a few activities. Some of these activities do not require specific skills or certifications, while others do. This study aimed to investigate what type of activities are carried out by tourism and recreational vessels in the coastal area of the central Algarve (Portugal). To this end, data from the automatic identification system (AIS) of recreational vessels was used to monitor and categorise these activities in a non-intrusive manner. A model (TORMA) was defined to facilitate the analysis of AIS data and relate them to five independent variables (distance from the coast, boat speed, bathymetry, seabed type, and number of pings). The results of the analysis of more than 11 thousand hourly AIS records for passenger, sailing, and charter vessels showed that the 14 most regular ones had strong seasonal patterns, greater intensity in summer, and spatial patterns with more records near some coastal cliffs. This study provides valuable information on the management of motorised nautical activities near the coast and at sea, contributing to more informed and effective tourism regulation and planning.

1. Introduction

A simple leisure trip by boat in a coastal area not only creates expectations in the users but also contributes to accumulating memorable experiences. The maritime space itself facilitates a set of expectations in order to obtain satisfaction during holidays or leisure time (Kelly, 2020).
Tourism in coastal areas implies that there is a demand for entertainment and leisure activities related to the sea, but carried out on land (Moscardo et al., 2001; Onofri & Nunes, 2013; Heslinga et al., 2017). Marine tourism activities include the need to use a boat, and the existence of marinas and their attributes is an added value for tourist satisfaction (Christensen et al., 2023). Among marine tourism activities, cruising typically involves travelling on a commercial passenger ship for leisure purposes, while boating is more focused on relaxation, sightseeing, and cultural experiences (Sun et al., 2021).
In the last few decades, marine tourism activities have expanded significantly, making it possible to find these activities in various places (Cisneros-Montemayor & Sumaila, 2010). The offers are varied, there are many operators, and attracting customers depends on several factors (Moore, 2019). On the supply side, operators offer relatively cheap services that meet demand and do not require much of customers. In other words, for the customer, it is about arriving and boarding without the need to have any certification of competence acquired as a user of the service. This type of service offering encourages the massification of tourism for these segments (Rodrigue & Notteboom, 2013).
On a boat trip whose objective is to visit rocky reliefs, there is no need to search for them, as they are invariably in a specific geographic position known in advance. However, it is important for the service provider to capture the attention of visitors (Antić & Mayor, 2023). The provider knows a priori the distances to points of interest and the time it will take to visit these locations (Rutherford et al., 2015).
Unlike visiting rocky reliefs, spotting marine mammals requires more specific knowledge on the part of the skipper or guide, and the provision of this service is subject to some randomness in finding these animals, which implies variation in geographic positioning (Bentz et al., 2016a). It will also invariably imply less control over the duration of the tour to find these marine animals, which is associated with a greater risk in achieving the objectives of the tour. The particularity here is based on customer satisfaction, that is, it is important to see the mammals, which sometimes requires a search quite far from the coast (Bentz et al., 2016b).
The capacity for interaction, creativity, and good training of tour guides on board are fundamental characteristics to improve the service provided in responsible cetacean-based tourism (CBT) (Jonas et al., 2019; Rocha et al., 2022). In this type of interaction with marine animals, there is no direct contact, which reduces the risk for tourists (Hild et al., 2023).
Activities that require certain acquired skills on the part of practitioners are found in recreational fishing and SCUBA diving. In the latter case, diving activities require certification from practitioners, whether they are tourists or regular local enthusiasts (Queiroz Neto et al., 2017). Practicing this type of activity may just be for relaxation, but it may also involve some risks (Fuchs et al., 2016; Pagel, 2021; Pagel & Lück, 2022).
Coastal areas with high tourist demand boost business development by offering boat activities (Higham & Lück, 2007). The entry of firms (operators) offering boat services in this market niche is dependent on competition among the different players and subject to the regulations that supposedly exist to control the activities (Scott & Laws, 2013; Ramli et al., 2022).
The issue of sustainability (environmental and economic) enters this process. This can be justified by the simple reason that if there is too much pressure on endogenous resources, there will tend to be a setback in economic benefits (Ponte et al., 2018). Therefore, adequate regulation to control the density of vessels in coastal tourist areas is of fundamental interest for the entire system to function (Davenport & Davenport, 2006; Coomber et al., 2016).
The objective of this work was to analyse AIS ping data relating to the most frequently visited coastal–maritime areas off the central Algarve, select those relating to maritime vessels of a tourist or recreational nature, and infer what type of activities they perform. We also intended to verify the dispersion of pings in the summer and winter seasons to understand if there are usage patterns in a given area. An attempt was also made to investigate what type of recreational maritime activity (TORMA) is associated with the analysed AIS positions.

2. Literature Review

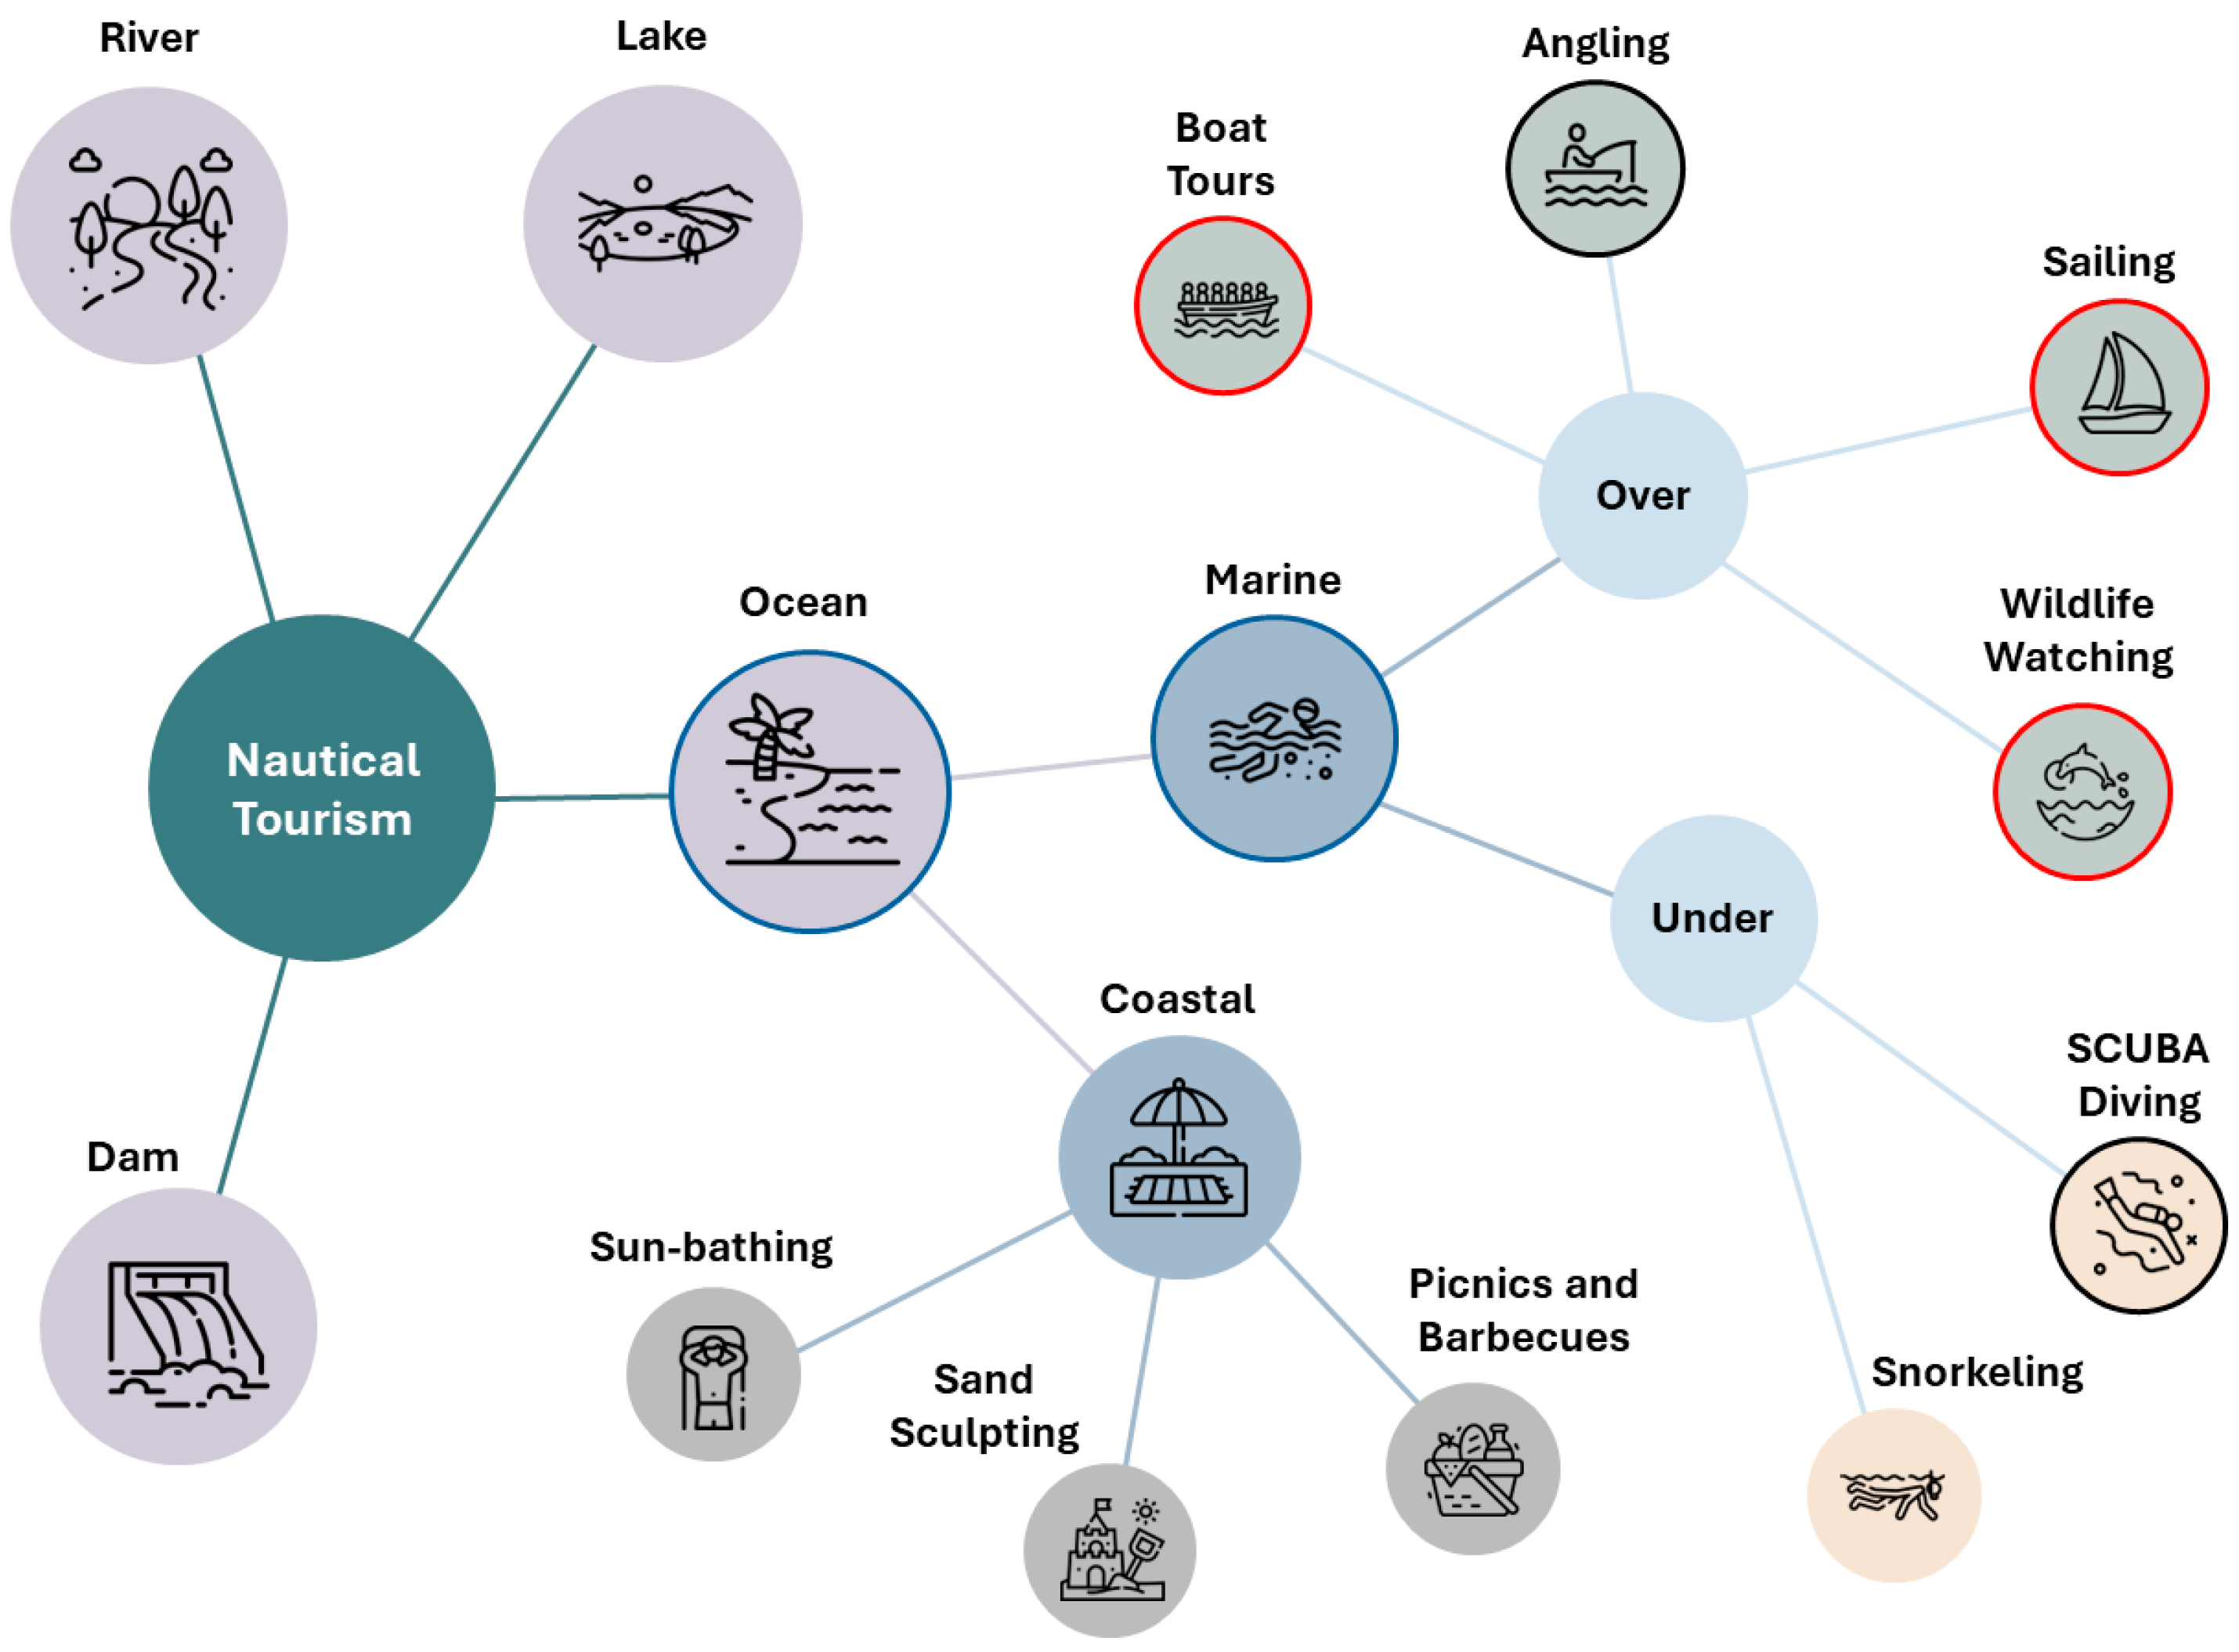
2.1. Nautical Activities

As exemplified in Figure 1, nautical tourism, which can be undertaken and adapted to individuals of any age (Davidson & Stebbins, 2011), depending on the location where it occurs, can be characterised as: river tourism, dam tourism, lake tourism, or maritime tourism (Martínez-Vázquez et al., 2022). Several activities require a boat and consequently, the existence of marinas helps to consolidate the development of these practices (Paker & Vural, 2016). Furthermore, regardless of whether they are practiced in salt water or not, some of these activities require the development of certain technical skills by practitioners (Pomfret, 2021).

2.2. Nautical Tourist Profile

Nautical tourism, which can also be called water tourism, combines navigation with leisure activities and holidays. It may include travelling between different ports on a cruise ship. It may also include participating in boating events such as regattas or boarding a boat for lunch or other specially arranged daytime recreation. This is a type of tourism that is more popular in the summer (Gannier et al., 2022).
In general, the definition of nautical tourist is very broad and is not consensual (Vázquez, 2020). Therefore, it is sometimes difficult to define the profile of the nautical tourist (Moreno & Otamendi, 2017). Sometimes, very popular destinations (e.g., certain islands) help with the definition because their tourist offer is largely based on activities practiced at sea (Lam-González et al., 2020). There may also be circumstances in which there are factors that may discourage some tourists from practicing certain nautical activities, but where the destination is invariably at sea (Jovanovic et al., 2013). As this work tracked recreational and passenger vessels, it was important to know about the type of tourist who seeks this type of boating activity to better understand their profile.

2.3. Economic and Environmental Impact of Nautical Activities Supported by Motorised Boats

The development of marinas encourages the appearance of firms that explore maritime-tourist activities, which in turn offer recreational services with different degrees of complexity (Martínez-Vázquez et al., 2022). Nautical tourism and its different aspects have an important economic impact (Alcover et al., 2011; Spinelli & Benevolo, 2022).
There are several types of services within blue tourism whose activities consist of taking visitors to different levels of experiences. These can vary from a simple boat trip close to the coast to appreciate the relief of the coastal cliffs (Bachmann-Vargas et al., 2022) to a sea trip away from the coast to find and observe dolphins or other marine animals (La Manna et al., 2020). There are also more demanding experiences where certain qualifications are required, such as recreational fishing on charter boats (Li et al., 2019) or even specific activities such as SCUBA diving (Queiroz Neto et al., 2017). Kessler et al. (2014) and Bach and Burton (2017) state that people who like to observe marine fauna prefer experiences that are very close to the animals.
Most of these services are advertised in or near marinas and accessed via the internet. For example, Kovačić and Silveira (2018) refer to a relevant economic impact due to the existence of marinas in Croatia and Portugal that support firms that are in the business. The identification of the activities that are offered by maritime-tourism firms is an important detail in order to be able to carry out an adequate analysis of the AIS pings that were explored in the present research for our study site.

2.4. Data Georeferencing in Activity Monitoring

There is a vast literature exploring the use of AIS data to characterise maritime traffic. The combined use of AIS and geographic data in this paper is intended to be a novel contribution. Hence, it seems important to make not only a focused review of previous work and existing knowledge gaps but also to indicate some of the new aspects that were intended to be addressed in this study.
As mentioned by Le Tixerant et al. (2018), AIS data are a reliable source for mapping and describing some marine human activities. The emission of AIS signals by vessels that have Maritime Mobile Service Identity (MMSI) allows identifying the use of certain areas by different types of boats (Ricci & Bohnenstiehl, 2022). In Europe, it is not mandatory for recreational vessels to have AIS, with the exception of those carrying passengers, which must have an AIS georeferencing system (MarineTraffic, 2024). Of the nautical activities mentioned above, only the following are more likely to obtain an AIS registration: boat tours, support boats (SCUBA diving and angling), and sailing (Huveneers et al., 2021; Prasetyo et al., 2023).
As mentioned by Breithaupt et al. (2022), AIS data are useful for understanding the density of maritime traffic and being able to make estimates of various types (e.g., determine the probability of collision risk between vessels). Deter et al. (2017) used such data to understand what type of activities are carried out by vessels. It is necessary to have a sequence of geolocatable points and corroborate them with characteristics of vessels associated with these points at those times (e.g., anchor points, distance from the coast, vessel speed, habitual use of the vessel).

2.5. Analysis of Georeferenced Data in Tourism Studies

With the advancement of technology associated with vessels that broadcast AIS signals, it is possible to monitor the use of certain maritime areas, which may have applications in the governance of these areas in a more appropriate way by coastal managers (Robards et al., 2016). Some examples of this type of study can be found recurrently in the literature on the subject (e.g., Dunn et al., 2018). Studies on cruise tourism are the most dominant (e.g., Weeden et al., 2011; Papathanassis, 2017; MacNeill & Wozniak, 2018; Buhalis et al., 2022). Boat trips for a day or less have some significance, but are comparatively less frequent (Le Corre et al., 2021; Komninos et al., 2022).

3. Materials and Methods

3.1. Research Question

It is in the coastal areas of the Algarve where most tourist and leisure activities take place. The central area of the region is where there is the most tourist pressure. As the interest of this study was to understand what types of leisure maritime activities occur off the central area of the Algarve, it was decided to geographically delimit this area. With this delimitation, it was possible to obtain AIS data to answer the following research question:
  • What types of boating activities are related to the central area of the Algarve?
Related to this issue, it is important to simultaneously explore which types of boats are relevant for tourism and leisure. It is also important to know the minimum number of pings per vessel to perceive the (in)existence of patterns. To better perceive patterns, it is also important to detect the dispersion of pings (for example, in the contrasting seasons of summer versus winter).

3.2. Experimental Design to Address Research Question

The objective of this experimental design was, based on the analysis of AIS data (e.g., Chen et al. (2020)), to identify what types of maritime-tourist vessel activities exist (Figure 2). For this purpose, the present study focused on a busy area in terms of maritime–coastal traffic off the central Algarve. AIS data were obtained for the geographic area (coordinates WGS84: 36°54′00″ N to 37°11′24″ N and 7°46′48″ W to 8°24′00″ W) for the winter (January–March) and summer (July–September) seasons for the year 2022. Records were obtained with an hourly frequency.
Within this area, records from the AIS that correspond to passenger vessels or that can potentially carry out maritime-tourist activities were selected. To verify which vessels simultaneously operate in the chosen area and have equipment that broadcast AIS signals, sampling data were also triangulated with field trips on board anonymised boats (i.e., in each of the main marinas in the study area).

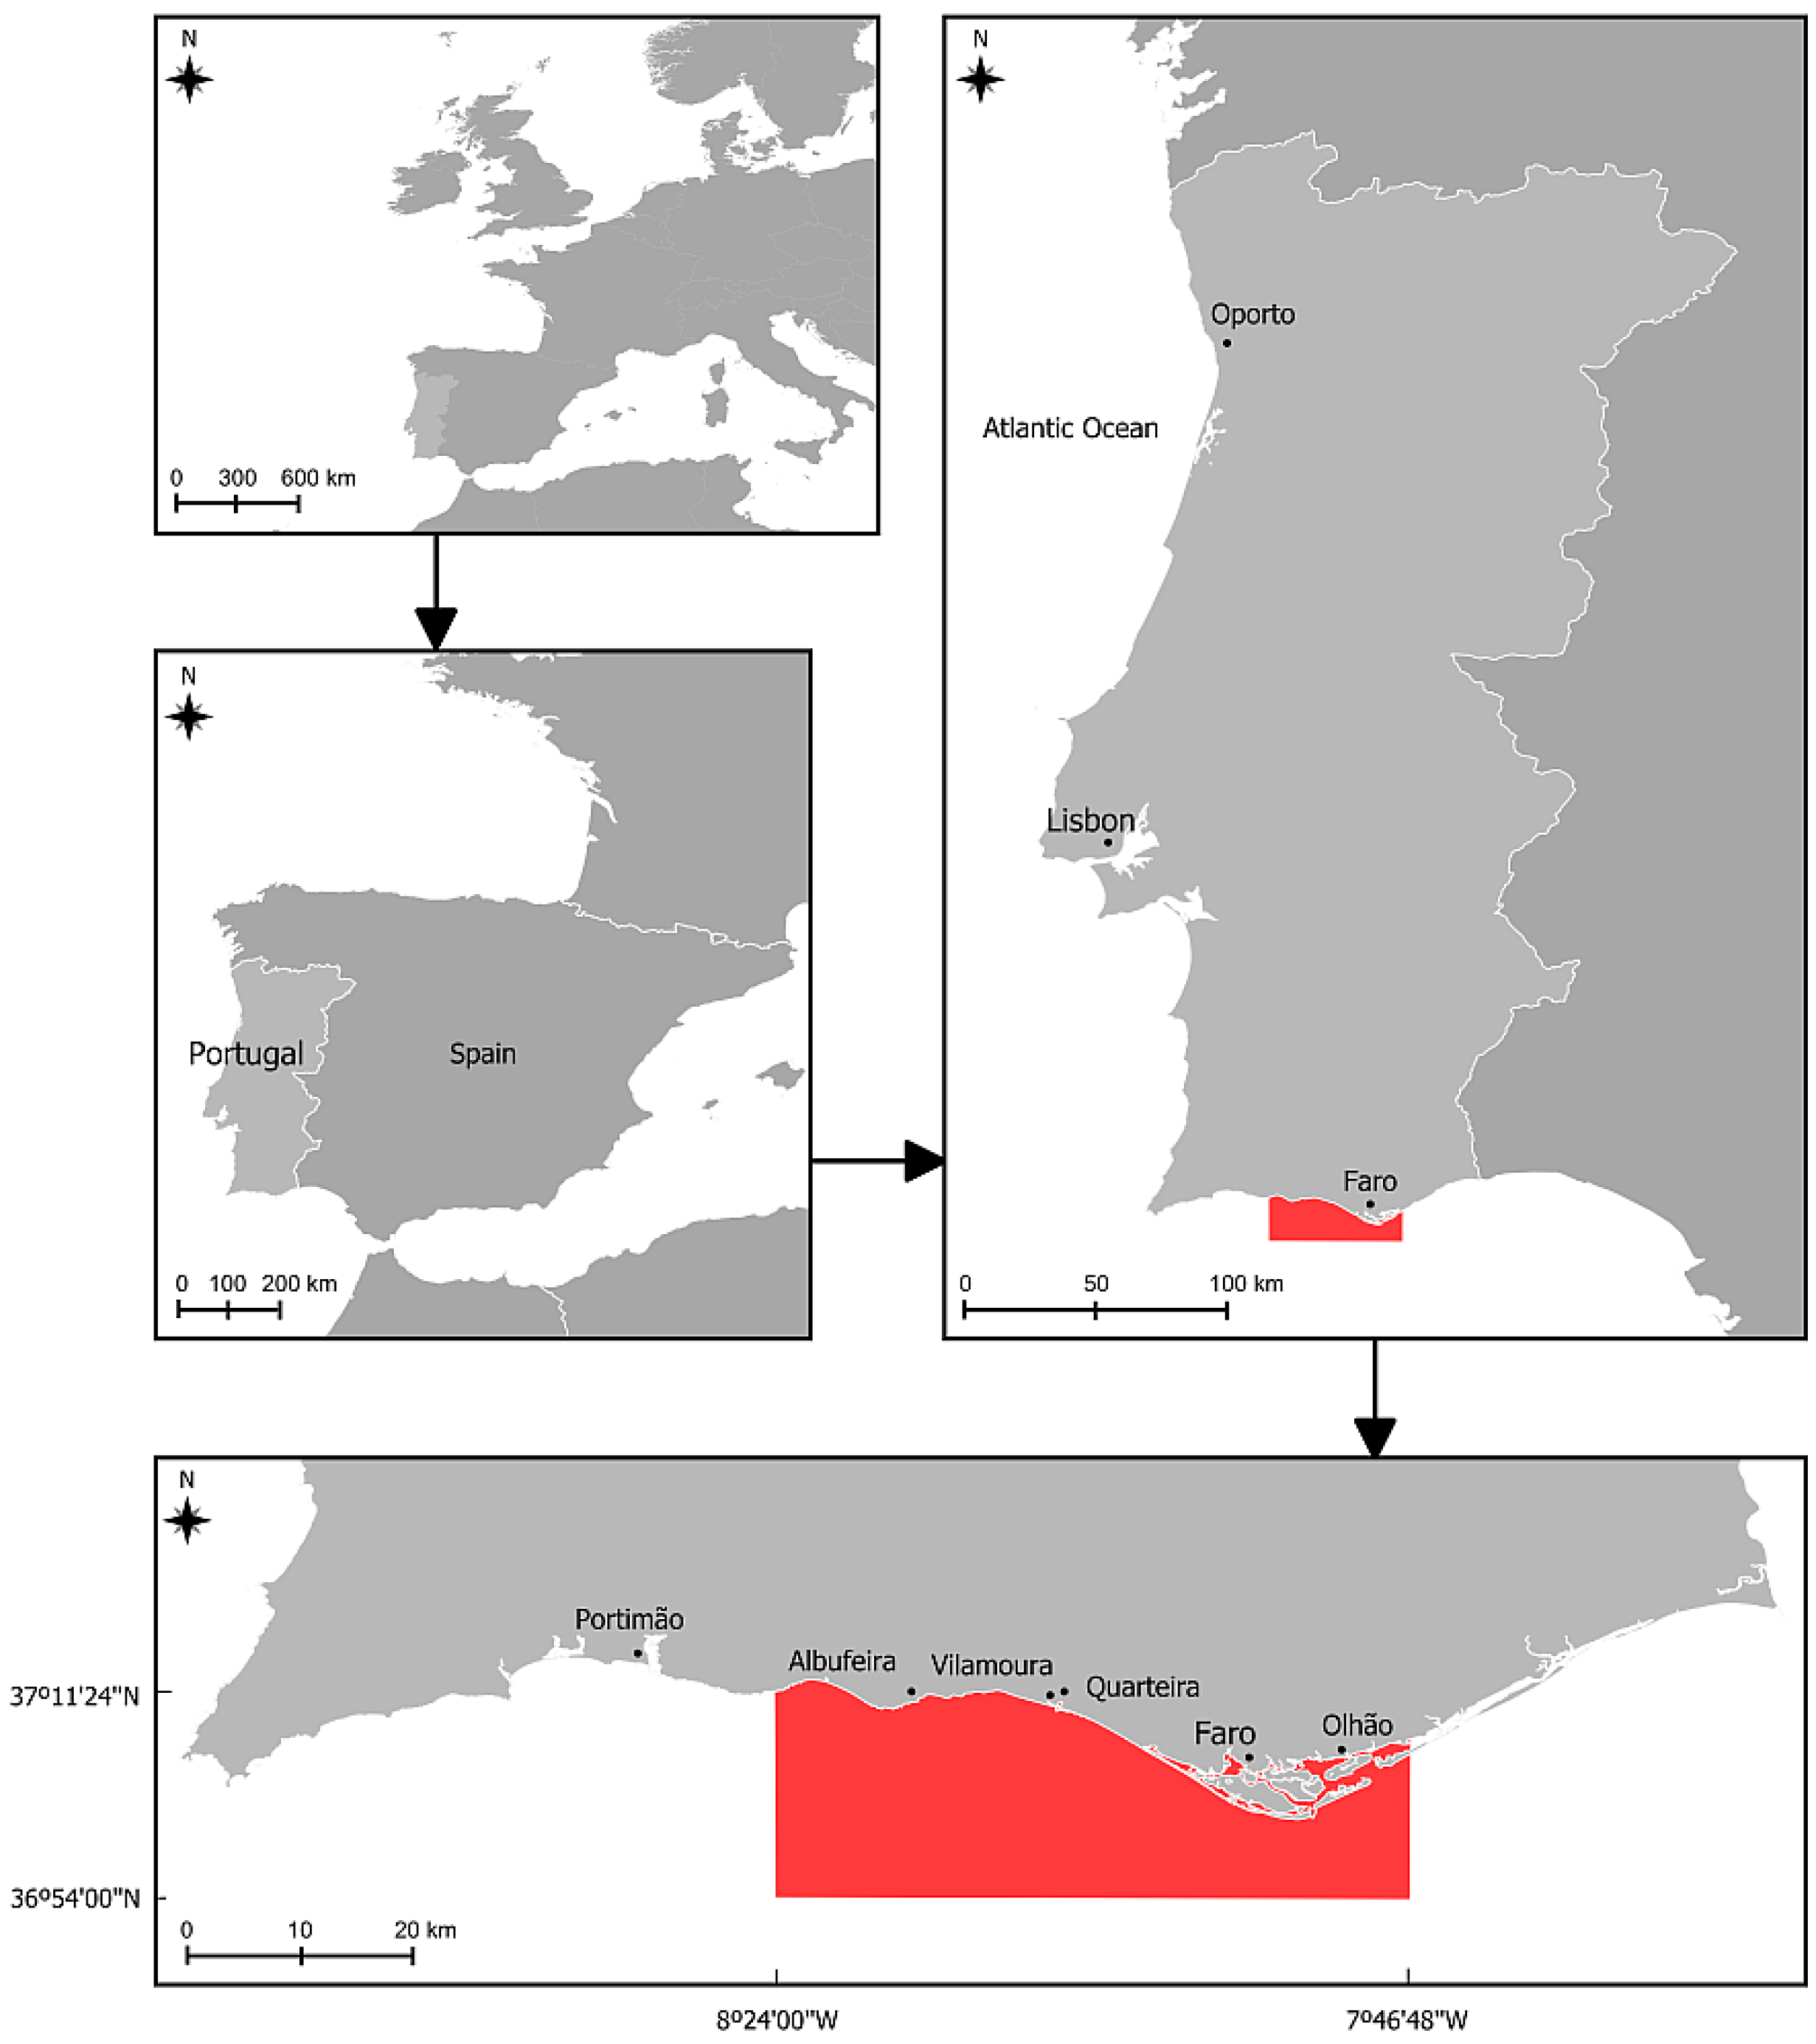
3.3. Case Study: Coastal and Maritime Central Algarve Area

The Algarve region has around half a million inhabitants (i.e., according to the 2021 census, there were 467,343 inhabitants). The largest cities and population centres are located along the coast and the interior area is sparsely populated. During the peak of summer, the population quadruples. The Algarve reached 5.13 million guests for 2023 (INE, 2024).
The Algarve is a tourist region. The main financial revenues are derived from tourism and many jobs are generated, although many of these are seasonal (L. M. Ramos & Sol Murta, 2023). In addition to the traditional ‘sun and sand’, tourists have several motivations for visiting the region, with nautical activities being among their list of preferences (Barreira et al., 2017). The coastal area of the Algarve has some reference resorts close to golf courses, which is a factor that generates major revenue for the tourism industry (Soler et al., 2019).
There are also reference marinas such as Vilamoura, which is both the oldest and the largest in Portugal. In the last decade, other marinas have been developed, such as Portimão and Albufeira, which have triggered a boom in maritime-tourist activities. It is also in these places where the largest number of tourists are concentrated (Monteiro et al., 2017).
Among the activities practiced with the help of a boat are guided visits to some of the most iconic coastal areas, such as the Benagil cave, which is located close to Praia da Marinha, considered one of the ten most emblematic beaches in Europe and an inspiring landscape for countless human activities (Paris et al., 2019). The maritime area in the central south of the Algarve was chosen for this case study (Figure 3).
A combination of qualitative and quantitative methods was used to obtain greater scope and representativeness in understanding the phenomena under analysis (following the suggestions by Cash et al., 2022). In the present study, we identified and analysed the type of services offered by companies that use maritime tourist boats throughout the year. To accomplish this, a study area defined and the AIS data referring to this area for the year 2022 analysed. QGIS (version 3.36.1 Maidenhead, 2023) was used to process the AIS data.

3.4. AIS Data

Industry 4.0 tools have been developed in different scopes. The Internet of Things (IoT) allows connectivity between different devices in real time from anywhere in the world. AIS is an IoT tool that automatically sends a record with a time frequency based on the speed of the vessel (Le Tixerant et al., 2018). In this study, data obtained by AIS wereused to analyse the activities of recreational boats. Each AIS record includes various information (static: e.g., MMSI, vessel name, vessel type, and vessel dimensions; dynamic: date and time, longitude and latitude, speed, heading, and destination). Table 1 shows the AIS data types and their definition (e.g., Kang et al., 2022).

3.5. MMSI of Vessels and AIS Records of Maritime-Tourist Activity

Not all passenger boats that provide sightseeing services have an AIS system fitted. In addition, Goudossis and Katsikas (2019) state that it is of primary importance that the collection of AIS data presupposes that the vessels have certain characteristics and that the signal collection is reliable (e.g., if the boat is in the shipyard or in dry dock, the transponder may be switched on, but the AIS signal is not reliable in providing data about its activity) (Table 2).
Larger recreational and passenger vessels are those that have a transducer that allows sending a signal with information to satellite or terrestrial AIS receivers that store in real time the positioning and relative characteristics of each vessel encoded with a unique MMSI (Gao et al., 2018). The MMSI comprises a series of nine digits where three correspond to the maritime identification digits (country codes), concatenated with a specific identifier (Park et al., 2021).

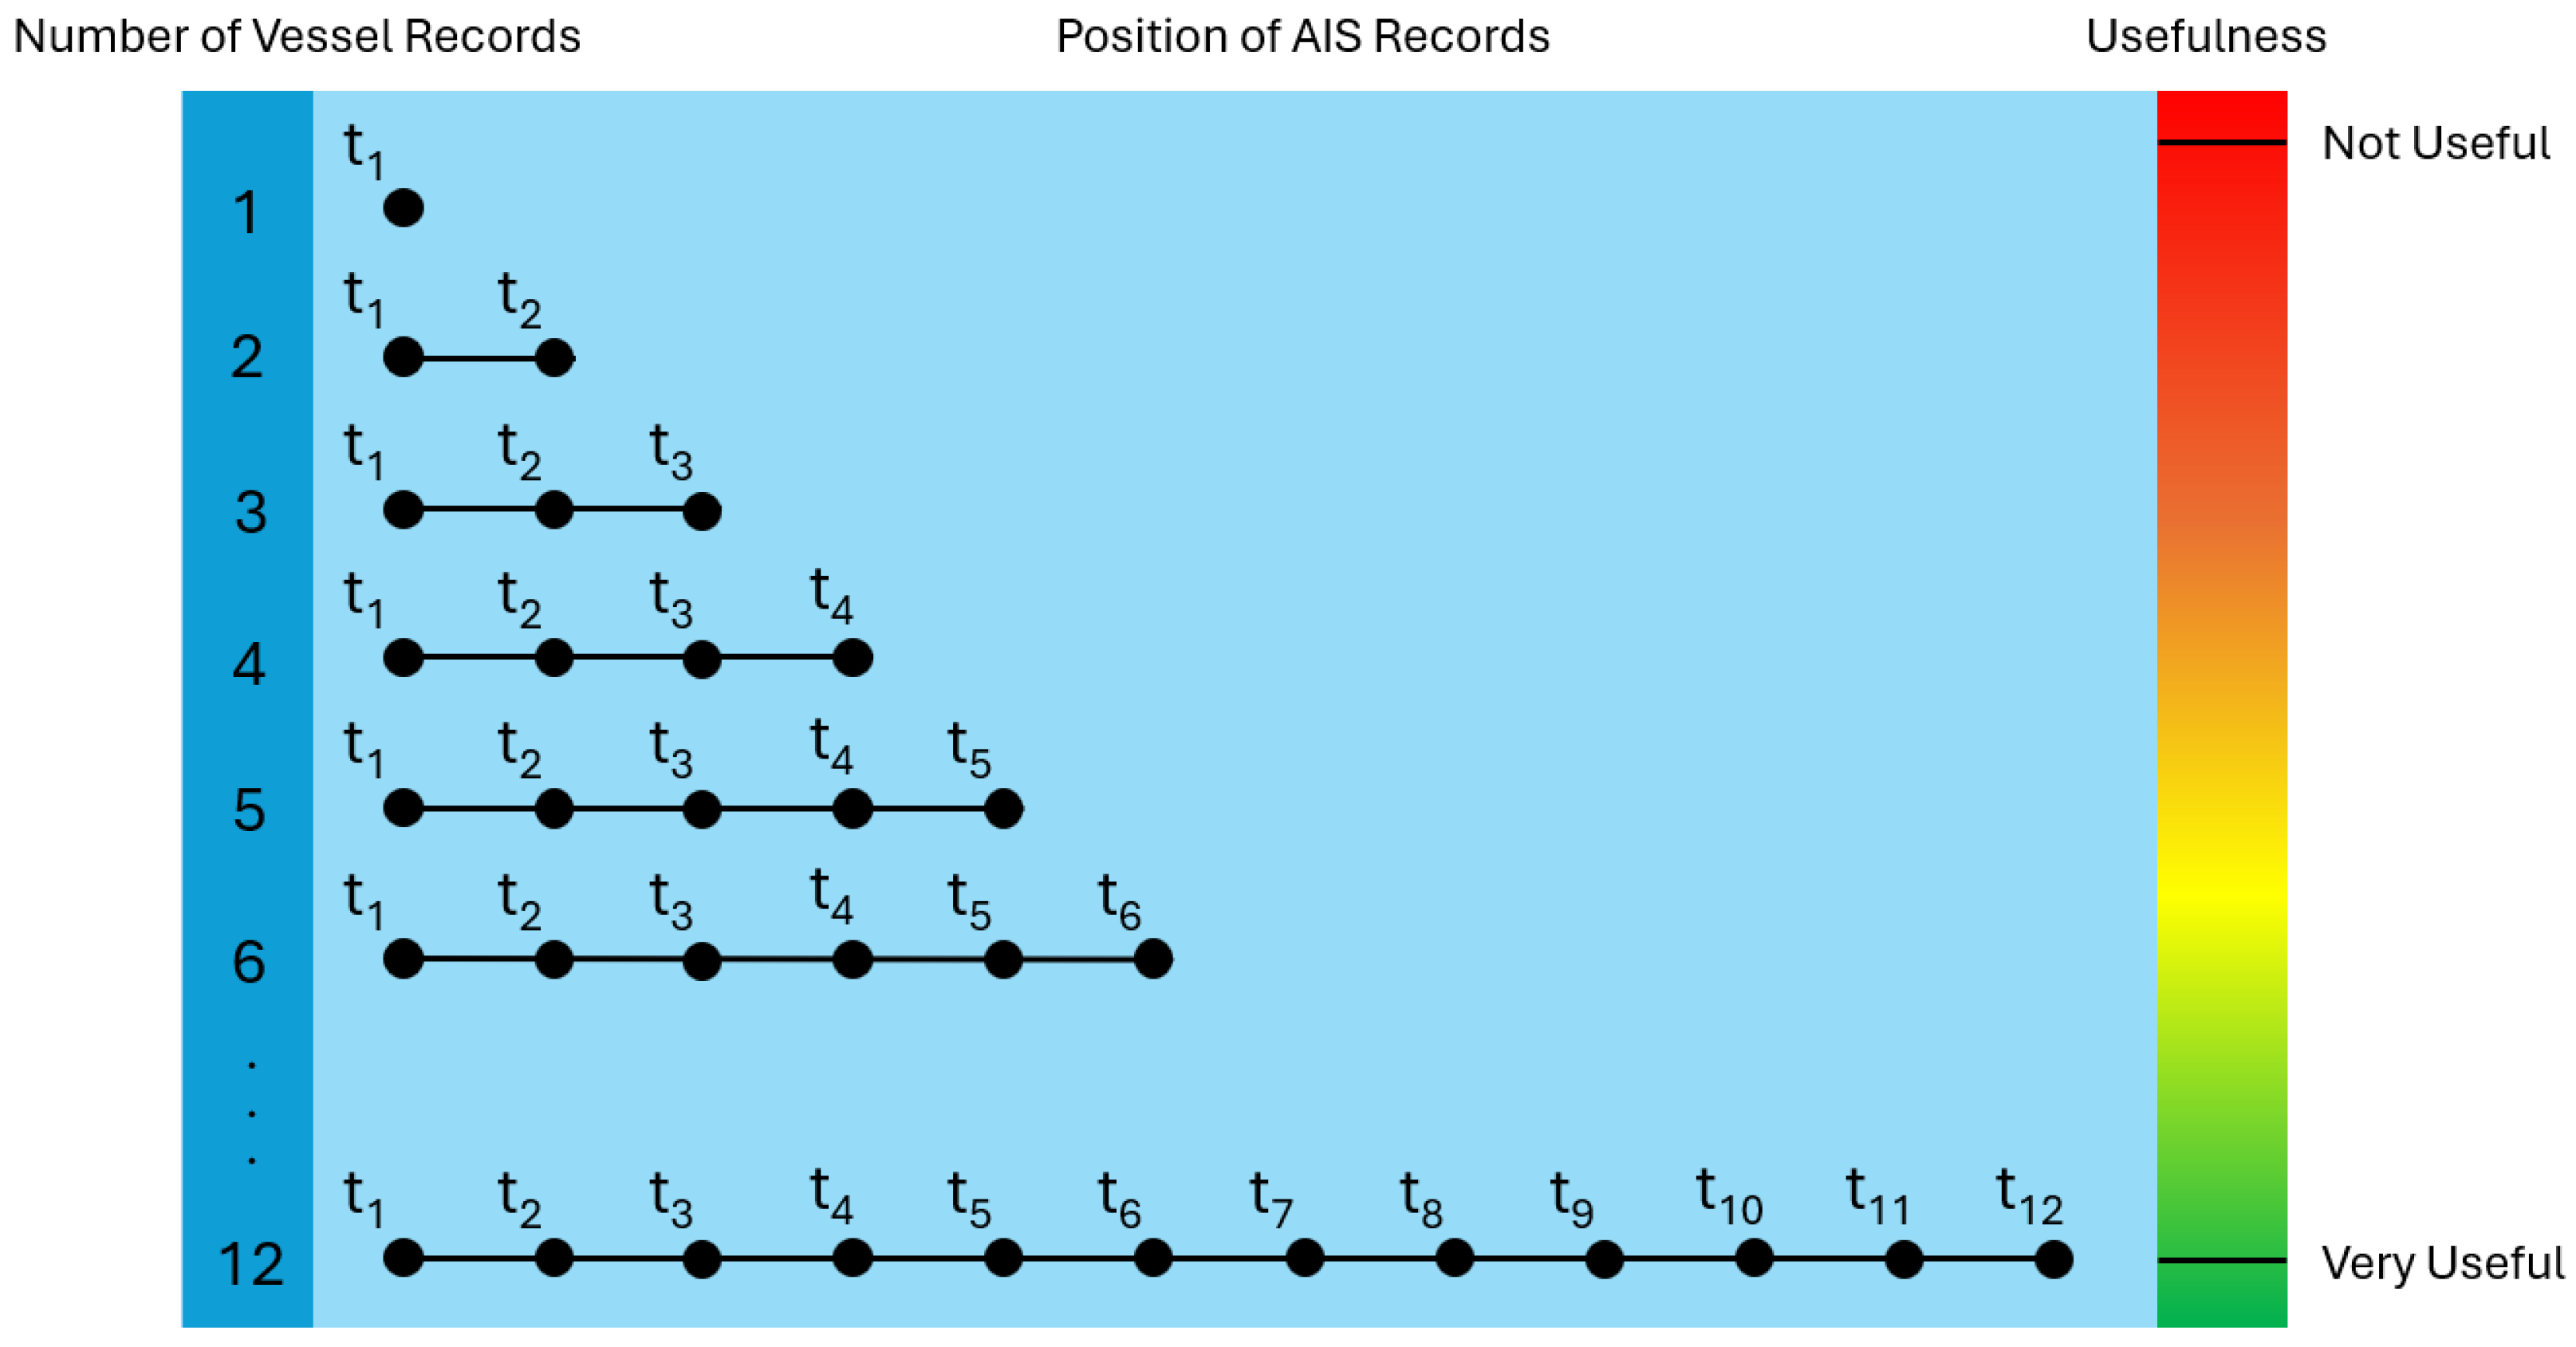
3.6. Finding a Feasible Number of Daily AIS Records

Some passenger and leisure vessels broadcast AIS data, which can be used to plot their routes and help reveal their recreational activities (Meijles et al., 2021). The identification of maritime activities related to vessels and marine animals has aroused some research interest, as can be found in the scientific literature (O’Hara et al., 2023; J. Ramos et al., 2024). Information from secondary sources—that can be used to triangulate data—reveals that most boat trips last between 1 and 6 h. The secondary sources to attest to this are, e.g., consulting the companies’ websites, information at the counter, and the purchasing of tickets for boat trips on vessels as customers/tourists. In the present study, AIS data provide access to hourly vessel records. This empirical decision was taken a priori because it was thought that it would not be necessary to obtain records more frequently in order to make the data useful. Thus, it is theoretically possible to have up to 24 daily records. For the information to be efficient, useful, and analysable, however, there is a minimum number of records/points per day (Figure 4).
With this approach to data analysis, it is possible to infer with some degree of certainty the probability of the vessel carrying out a certain type of activity at a given time. To achieve this, it is necessary to have a track with a minimum number of AIS records (Figure 5).

4. Results

4.1. Vessels Detected and Their Records of Maritime-Tourist Activity

Using the data, it is possible to scrutinise which are the most frequent maritime or tourist vessels in the area under analysis (Table 3). A descending sorting of AIS records was performed. Only 14 vessels were found that were considered relevant for this study, which were characterized by several elements derived from AIS data and field observations. A large number of other passenger and pleasure vessels are found in the AIS records, but the number of days at sea recorded is small and therefore useless for the present study. Through boat trips, it is clear that there are several passenger vessels that do not produce AIS records (due to lack of equipment, transponders being switched off, or other unknown reasons).

4.2. Dispersion of AIS Data

Most of the AIS positions detected were close to the coast, as shown in Figure 6 (regardless of whether they were AIS records from satellite or terrestrial). In comparison, more positions were recorded via the AIS in the summer season. In winter, there was a more sporadic record of AIS positionings. It should be highlighted that this difference may be a direct consequence of tourism, but may eventually be related to other phenomena (e.g., presence of marine mammals).
When analysing Figure 6, it can be seen that there were more records for summer than for winter. However, similar patterns can be seen in the most sought-after areas. As the vessels used for this study have somewhat different characteristics, the distance to the berth harbour and the bathymetry do not reveal which type of vessel fits best, but only the activities, as they may be limited by these two variables.
In the rocky area to the left of Albufeira, with bathymetric values around 10 m, there are many AIS records denoting great use of this area to see caves and other rocky places worthy of interest. At the far left is a large density of records, which correspond to the Benagil cave. This cave is an iconic site known throughout the world and is often used in marketing strategies to promote boat trips as one of the must-visit sites. It should be added, however, that since August 2024 (i.e., approximately 2 years after the analysis of the AIS records investigated here), due to the high demand for tourist visits, the Benagil cave has been subject to new rules and is limited in the number of vessels (maximum three if shorter than 12 m long) and visiting time (maximum 2 min/boat).
Further offshore, there were often more records in the bathymetric ranges of 20 to 30 m, indicating that there may be several possibilities for maritime activity in these locations. In places where there are depths close to 50 m or greater, the activities carried out are related to the observation of marine animals (most often dolphins).
In the Vilamoura area, there were many records, but only in the vicinity of the marina, showing that it is a shelter for boats. Thus, it seems that no interesting places to practice maritime activities exist nearby.
In the water area of the Ria Formosa in the marinas of Faro and Olhão, there were many records, both winter and summer, which are related to tours in the Ria Formosa lagoon, often combined with meals in establishments located in the barrier islands and visits to small spots of scenic interest.

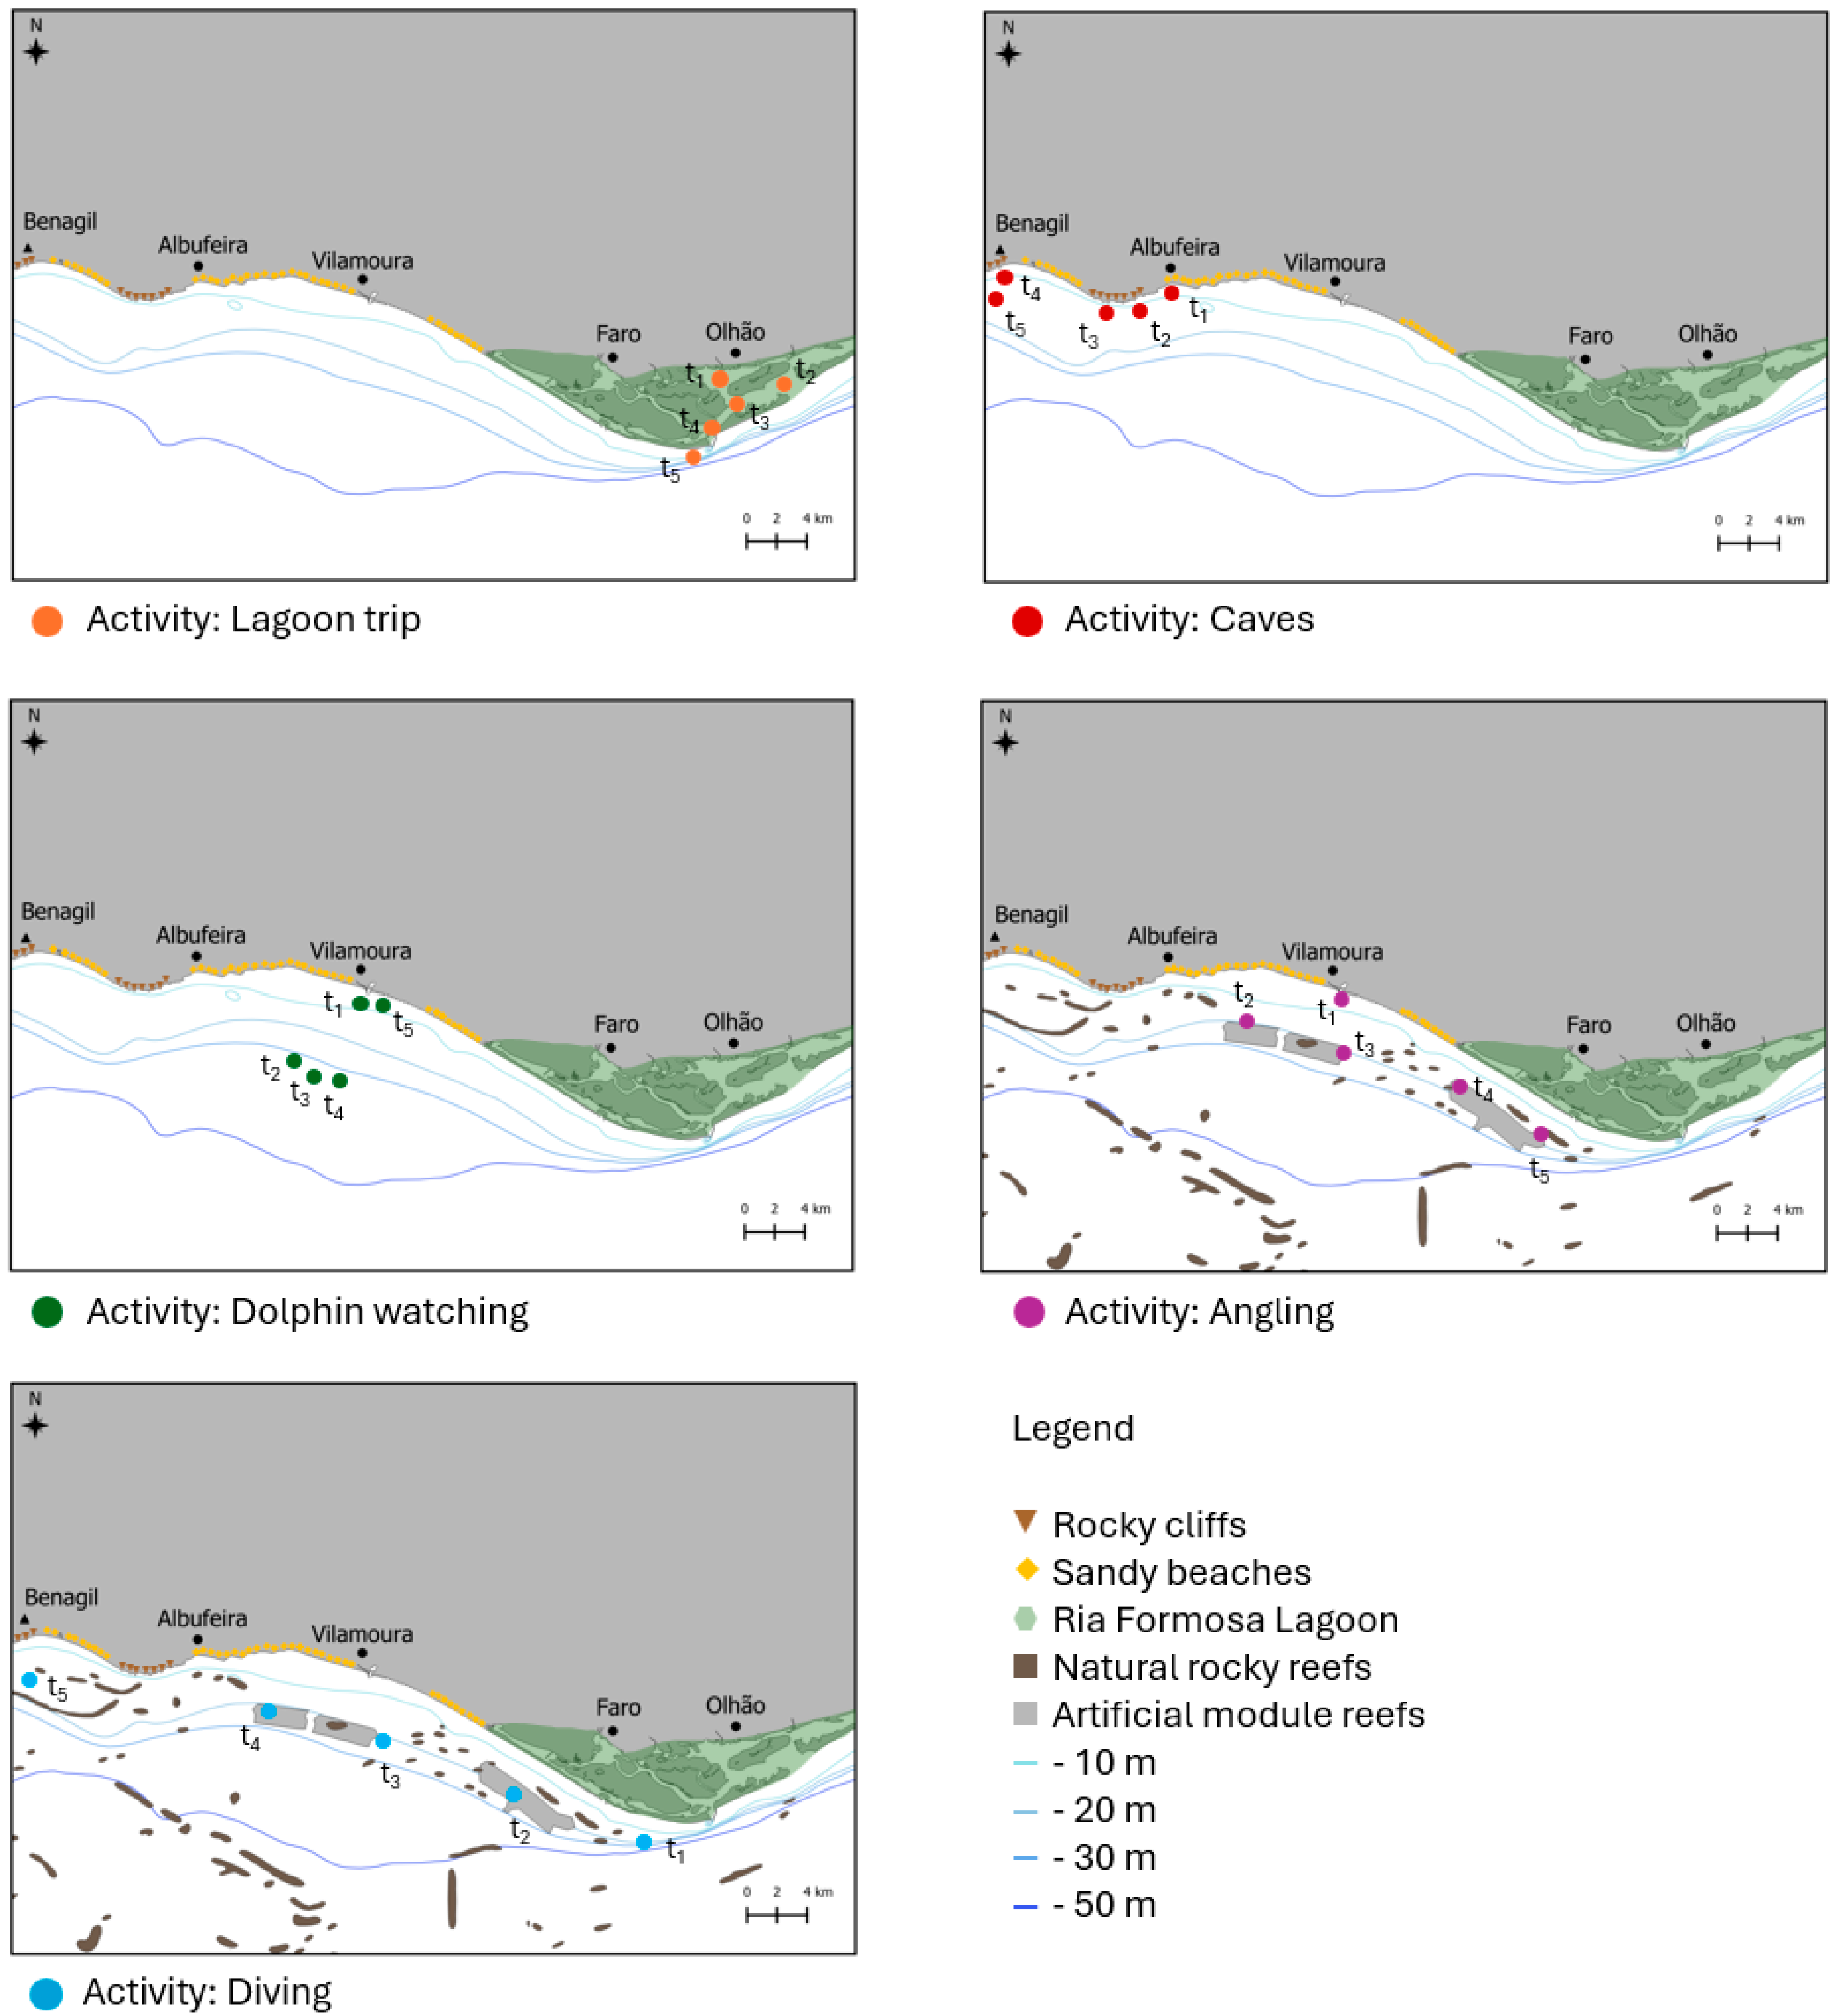
4.3. Allocation of Records by Type of Activity Detected

From the results, characteristic activities can be allocated through the distribution pattern. TORMA falls into four distinct categories, as shown in Figure 7. For additional details, see Appendix A. To be able to characterise boat activity, it is important to know the distance from the coast, where the activities that have to do with the reliefs of the cliffs do not move very far from the coastline and cover a parallel area in the area of the cliffs that is the one of interest. When the objective is to observe marine mammals, namely dolphins, there is a more wandering position for the vessels, and sightings can be either at a distance close to the coast or several miles from it, sometimes up to 12 miles (i.e., when wildlife is ‘difficult’ to find).
In the case of diving activities, areas that have submerged marine relief are chosen. Diving activities may include natural outcrops or, for example, a sunken boat or any other artificial structure.

5. Discussion

Territories with water are synonymous with relaxation, pleasantness, and sought after for leisure activities whenever available (Brito & Silveira, 2023). For this reason, in places with aquatic elements, when support infrastructures are created, there is an incentive for firms to develop services related to aquatic activities. These activities can be practised and accessed by anyone, but they may also require specific training or qualifications from the clientele. In most cases, the activities carried out by nautical companies offer recreational services that do not require any certification from tourists.

5.1. Berthing Locations and Types of Vessels Offering Maritime Activities

In the present study, it was reasonable to conclude that the main marinas in the Algarve are extremely important infrastructures in supporting maritime tourist activities. The existence of these infrastructures allows the leverage of several firms, who operate in free competition offering activities sought after by recreational visitors.
From a dataset of AIS records, it is likely that there are some boats that dock in the main Algarve marinas. Marinas with more infrastructure, such as Albufeira, Vilamoura, and Portimão, are where more boats with these AIS records can be found.
The vessels that are most important for maritime-tourist activities near coastal areas are divided into three categories: passengers, sailing, and pleasure craft. Most of them belong to firms dedicated to providing tourism and leisure activities for a diverse clientele in terms of interests and skills.

5.2. Selection of Collected AIS Data Records and Analysis

Based on analysis of hourly data in two seasons (winter and summer) for the year 2022, the number of vessels broadcasting AIS data was small. However, through the data that these vessels can provide, triangulated with additional secondary information (e.g., bathymetry and type of seabed), they become useful in corroborating the type of activities that can be experienced. Comparatively, there are vessels that broadcast much more AIS information than others, but it is through daily recording that it is possible to discern the geographic area covered and deduce other maritime activities that are being carried out at certain times (e.g., similar findings described in Ferter et al., 2023).
As regards the activities of maritime-tourist vessels, there is a strong seasonal variation. If on the one hand, in the winter months, there are much fewer AIS records, it will be because the probability of encountering adverse weather conditions compared to summer is much higher and because there is less demand from visitors, especially tourists. On the other hand, in the summer months, the number of AIS records increases considerably, most likely because atmospheric conditions improve, consequently resulting in a greater influx of tourism. It also appears that there are several vessels that only operate at this time of year, and many of them with a negligible number of AIS pings.

5.3. Activity Patterns Depending on Geographic Area

Tourist boat operators take advantage of the cliffs and the rock formations derived from them to offer a tourist product related to the caves that are associated with cultural characteristics such as legends, stories, and other types of narratives from each of these visitable places. Most AIS points correspond to locations that are very close to the coastal area and accommodate routes where boat trips take place parallel to the coast.
For the more distant AIS positions, most of them are associated with the observation of wildlife, namely marine mammals (nature-based tourism activity). The sighting of this type of animal is somehow associated with an educational component, where the visitor learns about the species in question and protects them (i.e., to have pro-conservation attitudes) to perpetuate these small moments of adrenaline (Apps et al., 2017).
From data analysis, the same vessels sometimes have wandering locations on different days, indicating that they do not always stick to the same location, but rather that they need to look for these animals in different geographic positions. Likewise, records of different vessels sometimes appear in a very close space on the same day, which means that this intangible asset is shared, affording the possibility of taking photographs or video recordings of the marine animals seen. Vessel skippers generally go where they know there is some wildlife in a given location, so this is not isotropic behaviour.
AIS records can still be verified that correspond to vessels that have a relationship with rocky bottom reliefs. In these situations, there is a dependence on the bottom for tourist activity. When this happens, it is possible to speculate the type of activity practiced. If the activity is practiced on the surface, it is angling, while if it is at the bottom, it is SCUBA diving (nature-based tourism activity).
In the case of diving trips, it helps to know the points of interest for diving operators (Nunes & Roeder, 2014). The geographic marking of these points is of crucial importance to infer the use by operators that explore the more specialised segment—i.e., certification by the clientele—that corresponds to diving. On the south coast of the Algarve, diving sites can vary between natural and artificial reefs (J. H. Ramos, 2022). In the typology of artificial reefs, they can be of various types, from vessel sinkings (accidentally or on purpose), modular structures, or others. Diving tourism activities encourage attitudes towards conserving biological resources (Lucrezi et al., 2017).
Yet another type of AIS records that do not fit into the four types of activities mentioned above (TORMA) and fit into another type of coastal tourism and leisure services provided includes charter boats or larger vessels that are rented for birthday parties, weddings (including meals), or themed parties.

5.4. Synthesis of Detected Patterns

The patterns detected by AIS pings can be related to different vessel user profiles. The relationship can be discerned for each type of boat, as summarised below.
Vessels that have well-defined standards are generally passenger boats that provide services to tourists. These tourists, whose profile fits the demand for experiences related to the sea, purchase a ticket for a boat trip lasting a few hours, where they will enjoy sometimes unique experiences, led by tour guides.
There are pleasure craft vessels that can be rented as charters and present two types of standards: (1) relatively well defined, generally related to more specific locations, namely submerged structures, and from there it can be deduced that there is leisure/tourist demand for activities related to diving, for example, or (2) not very well defined, indicating that they are vessels that are used for leisure activities without having a specific purpose related to marine resources (e.g., sunset parties, birthdays).
There are even boats whose AIS pings do not show a well-defined pattern. People whose way of life consists of using their own boat as a home at sea (e.g., sailing boats) do not seek out any specific marine resource and simply enjoy the sea for travel (Lepoša, 2018). These people are essentially travellers (possibly engaged in leisure/tourism activities).

6. Conclusions

The use of Industry 4.0 tools, through data from the Internet of Things (IoT), namely AIS records, adds value to studies monitoring maritime activities. They have the advantage of being non-intrusive data and sent voluntarily to a global system (with accessibility through cloud computing).
With the help of these types of tools, it is possible to obtain reliable records regarding the location and potential type of activity carried out by vessels that provide nature-based tourism and leisure services. A careful analysis of this type of data allows researchers to properly monitor activities and shed some light on maritime–coastal management.
Some limitations were identified in the present study. For example, when triangulating observations collected in field sampling with AIS data, it was found that there are several vessels that provide maritime-tourism services, but that do not produce AIS signals because they do not have this technology available on board. This can also happen with vessels that do not have the AIS device switched on all the time, thus limiting data collection.
The interpretation of AIS positioning was conducted as cautiously as possible. However, this interpretation is subject to several assumptions, and consequently there may be associated errors.
This study, although still somewhat preliminary, allows us to suggest some recommendations to decision-makers based on its conclusions:
-
Activities diversification—Encourage diversification of maritime–coastal tourist activities, providing incentives for firms that introduce new activities, to attract a wider range of tourists.
-
Seasonal regulation—Introduce seasonal regulations to manage peak season activity, such as capability limits of motorised nautical activities at sensitive sites (e.g., Benagil cave), ensuring more sustainable tourist practices and protection of coastal areas during periods of high demand.
-
Certification—Strengthen the application of certification needed for certain maritime activities to improve safety and ensure high-quality services, especially for activities involving motorised boats.
-
AIS data for monitoring—Use AIS data to support real-time monitoring of boat traffic, allowing for better supervision over tourism flow, thus enhancing security and decreasing environmental impact.

Author Contributions

Conceptualization, J.R.; methodology, J.R.; software, F.L.; validation, J.R., F.L. and B.D.; formal analysis, J.R.; investigation, J.R., A.M. and J.C.; resources, J.R.; data curation, J.R. and F.L.; writing—original draft preparation, J.R.; writing—review and editing, J.R., F.L. and B.D.; visualization, J.R.; supervision, J.R. and F.L.; project administration, J.R.; funding acquisition, J.R. All authors have read and agreed to the published version of the manuscript.

Funding

This research was funded by Portuguese national funds through FCT—Foundation for Science and Technology within the scope of the projects UIDB/04020/2020, UIDB/04326/2020, UIDP/04326/2020, LA/P/0101/2020 and 2022.01783.PTDC and the Individual Calls to Scientific Employment Stimulus 2021.02180.CEECIND (J.R.) and 2022.04803.CEECIND (F.L.).

Institutional Review Board Statement

Not applicable.

Informed Consent Statement

Not applicable.

Data Availability Statement

The original contributions presented in this study are included in the article. Further inquiries can be directed at the corresponding author.

Conflicts of Interest

The authors declare no conflicts of interest.

Abbreviations

The following abbreviations are used in this manuscript:
AISautomatic identification system
CBTcetacean-based tourism
IoTInternet of Things
MMSIMaritime Mobile Service Identity
QGISQuantum Geographic Information System
SCUBAself-contained underwater breathing apparatus
SOGspeed over ground (of the vessel)
TORMAtype of recreational maritime activity

Appendix A

Appendix A.1. The Model

In the literature, there are few references to tourist activities supported by boat and that can be detected from the AIS signal (e.g., recreational fishing, studied by Ferter et al., 2023). From the position records for each of the detected vessels, it is possible to infer what type of activity they are carrying out at a given time.
To infer on type of recreational maritime activity (TORMA), it is essential to collect positioning information from the AIS dataset, that is, the distance of the vessels in relation to the coast. Likewise, it is important to know for each of these positions what the speed of the vessel (SOG) is when the signal is collected. The number of records per day can better elucidate daily routes. From other data sources, it is important to collect data on the water depth and bottom type.
We intended to predict the dependent variable (Y), which is the TORMA. The model can be specified as follows:
Y = β0 + βDc + βVs + βWd + βSb + βRd + ε
where:
  • Y is the outcome variable of interest, derived from the combination of the vessel’s MMSI.
  • β0 is the intercept term.
  • β1, β2, β3, β4, and β5 are the coefficients for each predictor variable.
  • ε is the error term, accounting for the variability in Y not explained by the model.
The independent variables explained are:
  • Dc is the distance from the coast (continuous). It represents the distance of the vessel from the nearest coastline (in kilometres).
  • Vs is the vessel speed (continuous). It represents the velocity of a boat in each position at a certain time.
  • Wd is the water depth or bathymetry (continuous). It represents the depth of the water (in metres). Bathymetry data can also include features such as underwater slopes and terrain.
  • Sb is the sea bottom type (categorical, e.g., sandy, muddy, rocky, natural or artificial reef structures).
  • Rd is the number of AIS records/day (continuous). It represents the number of AIS records or pings received from the vessel per day.
The dependent variable is the type of recreational maritime activity undertaken by a certain type of vessel (categorical). TORMA can be lagoon trip, cave trip, dolphin watching, sea angling, and SCUBA diving. The vessel can also carry out two combined activities (e.g., a trip to the caves and dolphin watching, or a trip to the lagoon and dolphin watching).

Appendix A.2. Allocation of the Type of Activities (Dependent Variable)

Starting from triangulation with secondary data obtained from the collection of information about firms that have boats to provide this type of services, it is possible to know the type of activities. These activities can be related to four main types: (i) visiting coastal features (e.g., caves, potholes), (ii) searching for marine mammals (e.g., various species of dolphins), (iii) recreational fishing (e.g., angling in charter boats), and iv) recreational diving (e.g., in natural and artificial reef areas).
Of the boat activities, it is possible to find tours that include meals on board, but this turned out to be an activity only practiced during the summer season. It is also possible to find activities to support sea kayaking, but these activities do not have AIS screening.
From Equation (A1) above, it can be seen that the more complete the information from the AIS data collected—as well as from other additional information—the better the categorization of the type of activity that a given vessel is carrying out. The same vessel may however carry out different types of activity.

References

  1. Alcover, A., Alemany, M., Jacob, M., Payeras, M., García, A., & Martínez-Ribes, L. (2011). The economic impact of yacht charter tourism on the Balearic economy. Tourism Economics, 17(3), 625–638. [Google Scholar] [CrossRef]
  2. Antić, A., & Mayor, A. (2023). Geomythology, caves, and tourism: History and future perspectives. International Journal of Tourism Anthropology, 9(2), 99–112. [Google Scholar] [CrossRef]
  3. Apps, K., Dimmock, K., Lloyd, D. J., & Huveneers, C. (2017). Is there a place for education and interpretation in shark-based tourism? Tourism Recreation Research, 42(3), 327–343. [Google Scholar] [CrossRef]
  4. Bach, L., & Burton, M. (2017). Proximity and animal welfare in the context of tourist interactions with habituated dolphins. Journal of Sustainable Tourism, 25(2), 181–197. [Google Scholar] [CrossRef]
  5. Bachmann-Vargas, P., van Koppen, C. S. A., & Lamers, M. (2022). A social practice approach to nature-based tours: The case of the Marble Caves in Northern Patagonia, Chile. Journal of Ecotourism, 21(1), 1–17. [Google Scholar] [CrossRef]
  6. Barreira, A. P., Cesário, M., & De Noronha, M. T. (2017). Pull attributes of the Algarve: The tourists’ view. Tourism Planning & Development, 14(1), 87–109. [Google Scholar] [CrossRef]
  7. Bentz, J., Lopes, F., Calado, H., & Dearden, P. (2016a). Enhancing satisfaction and sustainable management: Whale watching in the Azores. Tourism Management, 54, 465–476. [Google Scholar] [CrossRef]
  8. Bentz, J., Lopes, F., Calado, H., & Dearden, P. (2016b). Managing marine wildlife tourism activities: Analysis of motivations and specialization levels of divers and whale watchers. Tourism Management Perspectives, 18, 74–83. [Google Scholar] [CrossRef]
  9. Breithaupt, S. A., Bensi, M., & Copping, A. (2022). AIS-based characterization of navigation conflicts along the US Atlantic Coast prior to development of wind energy. Ocean Engineering, 264, 112235. [Google Scholar] [CrossRef]
  10. Brito, M., & Silveira, L. (2023). Blue planning—A planning model for the development of Blue Tourism in Blue Spaces. Tourism Recreation Research, 49, 1360–1380. [Google Scholar] [CrossRef]
  11. Buhalis, D., Papathanassis, A., & Vafeidou, M. (2022). Smart cruising: Smart technology applications and their diffusion in cruise tourism. Journal of Hospitality and Tourism Technology, 13(4), 626–649. [Google Scholar] [CrossRef]
  12. Cash, P., Isaksson, O., Maier, A., & Summers, J. (2022). Sampling in design research: Eight key considerations. Design Studies, 78, 101077. [Google Scholar] [CrossRef]
  13. Chen, X., Liu, Y., Achuthan, K., & Zhang, X. (2020). A ship movement classification based on Automatic Identification System (AIS) data using convolutional neural network. Ocean Engineering, 218, 108182. [Google Scholar] [CrossRef]
  14. Christensen, C. P., Shen, Y., Kokkranikal, J., & Morrison, A. M. (2023). Understanding British and Danish sailing tourism markets: An analysis based on Kano’s evaluation matrix. Tourism Recreation Research, 48(1), 30–42. [Google Scholar] [CrossRef]
  15. Cisneros-Montemayor, A. M., & Sumaila, U. R. (2010). A global estimate of benefits from ecosystem-based marine recreation: Potential impacts and implications for management. Journal of Bioeconomics, 12, 245–268. [Google Scholar] [CrossRef]
  16. Coomber, F. G., D’Incà, M., Rosso, M., Tepsich, P., di Sciara, G. N., & Moulins, A. (2016). Description of the vessel traffic within the north pelagos sanctuary: Inputs for marine spatial planning and management implications within an existing international marine protected area. Marine Policy, 69, 102–113. [Google Scholar] [CrossRef]
  17. Davenport, J., & Davenport, J. L. (2006). The impact of tourism and personal leisure transport on coastal environments: A review. Estuarine, Coastal and Shelf Science, 67(1–2), 280–292. [Google Scholar] [CrossRef]
  18. Davidson, L., & Stebbins, R. (2011). Serious leisure and nature: Sustainable consumption in the outdoors. Springer. [Google Scholar] [CrossRef]
  19. Deter, J., Lozupone, X., Inacio, A., Boissery, P., & Holon, F. (2017). Boat anchoring pressure on coastal seabed: Quantification and bias estimation using AIS data. Marine Pollution Bulletin, 123(1–2), 175–181. [Google Scholar] [CrossRef]
  20. Dunn, D. C., Jablonicky, C., Crespo, G. O., McCauley, D. J., Kroodsma, D. A., Boerder, K., Gjerde, K. M., & Halpin, P. N. (2018). Empowering high seas governance with satellite vessel tracking data. Fish and Fisheries, 19(4), 729–739. [Google Scholar] [CrossRef]
  21. Ferter, K., Otterå, H., Christman, M., Kleiven, A. R., Weltersbach, M. S., Gundersen, S., Djønne, C., Bjelland, O., Hartill, B., Lyle, J., Hyder, K., Borch, T., & Vølstad, J. H. (2023). Integrating complementary survey methods to estimate catches in Norway’s complex marine recreational hook-and-line fishery. ICES Journal of Marine Science, 80(1), 107–121. [Google Scholar] [CrossRef]
  22. Fuchs, G., Reichel, A., & Shani, A. (2016). Scuba divers: The thrill of risk or the search for tranquility. Tourism Recreation Research, 41(2), 145–156. [Google Scholar] [CrossRef]
  23. Gannier, A. J., Boyer, G., & Gannier, A. C. (2022). Recreational boating as a potential stressor of coastal striped dolphins in the northwestern Mediterranean Sea. Marine Pollution Bulletin, 185, 114222. [Google Scholar] [CrossRef] [PubMed]
  24. Gao, M., Shi, G., & Li, S. (2018). Online prediction of ship behavior with automatic identification system sensor data using bidirectional long short-term memory recurrent neural network. Sensors, 18(12), 4211. [Google Scholar] [CrossRef]
  25. Goudossis, A., & Katsikas, S. K. (2019). Towards a secure automatic identification system (AIS). Journal of Marine Science and Technology, 24, 410–423. [Google Scholar] [CrossRef]
  26. Heslinga, J. H., Groote, P., & Vanclay, F. (2017). Using a social-ecological systems perspective to understand tourism and landscape interactions in coastal areas. Journal of Tourism Futures, 3(1), 23–38. [Google Scholar] [CrossRef]
  27. Higham, J. E. S., & Lück, M. (2007). Marine wildlife and tourism management: In search of scientific approaches to sustainability. In Marine wildlife and tourism management: Insights from the natural and social sciences (pp. 1–16). CAB International. [Google Scholar]
  28. Hild, B. O., Jóhannesson, G. T., & Sydnes, A. K. (2023). “Everyone can be a guide until something goes wrong”: Adventure guides’ competencies and tourist safety in the Arctic. Scandinavian Journal of Hospitality and Tourism, 23, 325–344. [Google Scholar] [CrossRef]
  29. Huveneers, C., Jaine, F. R., Barnett, A., Butcher, P. A., Clarke, T. M., Currey-Randall, L. M., Dwyer, R. G., Ferreira, L. C., Gleiss, A. C., Hoenner, X., Ierodiaconou, D., Lédée, E. J. I., Meekan, M. G., Pederson, H., Rizzari, J. R., van Ruth, P. D., Semmens, J. M., Taylor, M. D., Udyawer, V., … Harcourt, R. (2021). The power of national acoustic tracking networks to assess the impacts of human activity on marine organisms during the COVID-19 pandemic. Biological Conservation, 256, 108995. [Google Scholar] [CrossRef]
  30. INE. (2024). Instituto nacional de estatística—Estatísticas do turismo: 2023. INE. Available online: https://www.ine.pt/xurl/pub/439494299 (accessed on 14 June 2024)ISSN 0377-2306. ISBN 978-989-25-0683-8. (In Portuguese)
  31. Jonas, L. C., Botha, N. M., & Myles, P. (2019). A curriculum framework for undergraduate coastal and marine tourism university programs. Tourism in Marine Environments, 14(4), 249–264. [Google Scholar] [CrossRef]
  32. Jovanovic, T., Dragin, A., Armenski, T., Pavic, D., & Davidovic, N. (2013). What demotivates the tourist? Constraining factors of nautical tourism. Journal of Travel & Tourism Marketing, 30(8), 858–872. [Google Scholar] [CrossRef]
  33. Kang, M. J., Zohoori, S., Hamidi, M., & Wu, X. (2022). Study of narrow waterways congestion based on automatic identification system (AIS) data: A case study of Houston Ship Channel. Journal of Ocean Engineering and Science, 7(6), 578–595. [Google Scholar] [CrossRef]
  34. Kelly, C. (2020). Beyond ‘a trip to the seaside’: Emotional connections, family tourism and psycho-social wellbeing. Tourism Geographies, 24(2–3), 284–305. [Google Scholar] [CrossRef]
  35. Kessler, E., Harcourt, R., & Bradford, W. (2014). Will whale watchers sacrifice personal experience to minimize harm to whales? Tourism in Marine Environments, 10(1–2), 21–30. [Google Scholar] [CrossRef]
  36. Komninos, A., Kostopoulos, C., & Garofalakis, J. (2022). Automatic generation of sailing holiday itineraries using vessel density data and semantic technologies. Information Technology & Tourism, 24(2), 265–298. [Google Scholar] [CrossRef]
  37. Kovačić, M., & Silveira, L. (2018). Nautical tourism in Croatia and in Portugal in the late 2010’s: Issues and perspectives. Pomorstvo, 32(2), 281–289. [Google Scholar] [CrossRef]
  38. La Manna, G., Melis, G., Rako-Gospić, N., Basta, J., Mackelworth, P., Holcer, D., Atzeni, M., & Leeb, K. (2020). Sustainable dolphin watching tours as a tool to increase public awareness of marine conservation—A comparative analysis between two Mediterranean destinations and implications for management. Journal of Ecotourism, 19(4), 345–361. [Google Scholar] [CrossRef]
  39. Lam-González, Y. E., León, C. J., & De León, J. (2020). Measuring tourist satisfaction with nautical destinations: The effects of image, loyalty, and past destination choice. Tourism in Marine Environments, 15(1), 47–58. [Google Scholar] [CrossRef]
  40. Le Corre, N., Saint-Pierre, A., Hughes, M., Peuziat, I., Cosquer, A., Michot, T., & Bernard, N. (2021). Outdoor recreation in French Coastal and Marine Protected Areas. Exploring recreation experience preference as a way for building conservation support. Journal of Outdoor Recreation and Tourism, 33, 100332. [Google Scholar] [CrossRef]
  41. Lepoša, N. (2018). When sea becomes home. Annals of Tourism Research, 72, 11–21. [Google Scholar] [CrossRef]
  42. Le Tixerant, M., Le Guyader, D., Gourmelon, F., & Queffelec, B. (2018). How can Automatic Identification System (AIS) data be used for maritime spatial planning? Ocean & Coastal Management, 166, 18–30. [Google Scholar] [CrossRef]
  43. Li, S., Vogel, R., & Viswanathan, N. (2019). Demand for saltwater recreational fishing: A generalized demand approach. Ocean & Coastal Management, 179, 104820. [Google Scholar] [CrossRef]
  44. Lucrezi, S., Milanese, M., Markantonatou, V., Cerrano, C., Sarà, A., Palma, M., & Saayman, M. (2017). Scuba diving tourism systems and sustainability: Perceptions by the scuba diving industry in two marine protected areas. Tourism Management, 59, 385–403. [Google Scholar] [CrossRef]
  45. MacNeill, T., & Wozniak, D. (2018). The economic, social, and environmental impacts of cruise tourism. Tourism Management, 66, 387–404. [Google Scholar] [CrossRef]
  46. MarineTraffic. (2024). Marinetraffic: Global ship tracking intelligence. Available online: https://www.marinetraffic.com/en/ais/home/ (accessed on 4 September 2024).
  47. Martínez-Vázquez, R. M., de Pablo Valenciano, J., & Milán-García, J. (2022). Impact analysis of marinas on nautical tourism in Andalusia. Journal of Marine Science and Engineering, 10(6), 780. [Google Scholar] [CrossRef]
  48. Meijles, E. W., Daams, M. N., Ens, B. J., Heslinga, J. H., & Sijtsma, F. J. (2021). Tracked to protect-Spatiotemporal dynamics of recreational boating in sensitive marine natural areas. Applied Geography, 130, 102441. [Google Scholar] [CrossRef]
  49. Monteiro, P. V., Salvador, R., & Soares, C. G. (2017). A microcluster approach applied to the case of the nautical tourism sector of the Algarve region (Portugal). Tourism in Marine Environments, 12(2), 105–124. [Google Scholar] [CrossRef]
  50. Moore, A. (2019). Selling Anthropocene space: Situated adventures in sustainable tourism. Anthropocene Journal of Sustainable Tourism, 27(4), 436–451. [Google Scholar] [CrossRef]
  51. Moreno, M. J., & Otamendi, F. J. (2017). Fostering nautical tourism in the Balearic Islands. Sustainability, 9(12), 2215. [Google Scholar] [CrossRef]
  52. Moscardo, G., Pearce, P., Green, D., & O’Leary, J. T. (2001). Understanding coastal and marine tourism demand from three European markets: Implications for the future of ecotourism. Journal of Sustainable Tourism, 9(3), 212–227. [Google Scholar] [CrossRef]
  53. Nunes, C. H., & Roeder, F. (2014). Tourism and Algarve’s underwater heritage valorisation. A case study. Journal of Maritime Research, 11(1), 35–44. [Google Scholar]
  54. O’Hara, P. D., Serra-Sogas, N., McWhinnie, L., Pearce, K., Le Baron, N., O’Hagan, G., Nesdoly, A., Marques, T., & Canessa, R. (2023). Automated identification system for ships data as a proxy for marine vessel related stressors. Science of The Total Environment, 865, 160987. [Google Scholar] [CrossRef]
  55. Onofri, L., & Nunes, P. A. (2013). Beach ‘lovers’ and ‘greens’: A worldwide empirical analysis of coastal tourism. Ecological Economics, 88, 49–56. [Google Scholar] [CrossRef]
  56. Pagel, C. D. (2021). The relevance of skilled in-water guides in swim-with wildlife tours. Tourism in Marine Environments, 16(4), 195–204. [Google Scholar] [CrossRef]
  57. Pagel, C. D., & Lück, M. (2022). #Wildlifeselfies: Insights into the ocular consumption of marine wildlife. Tourism Recreation Research, 49, 486–500. [Google Scholar] [CrossRef]
  58. Paker, N., & Vural, C. A. (2016). Customer segmentation for marinas: Evaluating marinas as destinations. Tourism Management, 56, 156–171. [Google Scholar] [CrossRef]
  59. Papathanassis, A. (2017). Cruise tourism management: State of the art. Tourism Review, 72(1), 104–119. [Google Scholar] [CrossRef]
  60. Paris, A., Galin, E., Peytavie, A., Guérin, E., & Gain, J. (2019). Terrain amplification with implicit 3D features. ACM Transactions on Graphics (TOG), 38(5), 1–15. [Google Scholar] [CrossRef]
  61. Park, K., Sim, S., & Bae, H. (2021). Vessel estimated time of arrival prediction system based on a path-finding algorithm. Maritime Transport Research, 2, 100012. [Google Scholar] [CrossRef]
  62. Pomfret, G. (2021). Family adventure tourism: Towards hedonic and eudaimonic wellbeing. Tourism Management Perspectives, 39, 100852. [Google Scholar] [CrossRef]
  63. Ponte, J., Couto, G., Pimentel, P., & Oliveira, A. (2018). Tourism activities and companies in a sustainable adventure tourism destination: The Azores. Tourism & Management Studies, 14(4), 25–38. [Google Scholar]
  64. Prasetyo, N., Filep, S., & Carr, A. (2023). Towards culturally sustainable scuba diving tourism: An integration of Indigenous knowledge. Tourism Recreation Research, 48(3), 319–332. [Google Scholar] [CrossRef]
  65. Queiroz Neto, A., Lohmann, G., Scott, N., & Dimmock, K. (2017). Rethinking competitiveness: Important attributes for a successful scuba diving destination. Tourism Recreation Research, 42(3), 356–366. [Google Scholar] [CrossRef]
  66. Ramli, A. M., Asby, P. N. K., Noor, H. M., & Afrizal, T. (2022). Challenges encountered by SMEs in tourism industry: A review from 2017 to 2021. Journal of Asian Behavioural Studies, 7(21), 1–13. [Google Scholar] [CrossRef]
  67. Ramos, J., Drakeford, B., Madiedo, A., Costa, J., & Leitão, F. (2024). A bayesian approach to infer the sustainable use of artificial reefs in fisheries and recreation. Sustainability, 16(2), 810. [Google Scholar] [CrossRef]
  68. Ramos, J. H. (2022). Portuguese artificial reef modules: Are they suitable for dive tourism? In Impact of artificial reefs on the environment and communities (pp. 127–150). IGI Global. [Google Scholar] [CrossRef]
  69. Ramos, L. M., & Sol Murta, F. (2023). Tourism seasonality management strategies–what can we learn from payment data. Journal of Hospitality and Tourism Insights, 6(3), 1205–1221. [Google Scholar] [CrossRef]
  70. Ricci, S. W., & Bohnenstiehl, D. R. (2022). Monitoring visitation at North Carolina artificial reef sites using high spatiotemporal resolution PlanetScope imagery. Regional Studies in Marine Science, 55, 102511. [Google Scholar] [CrossRef]
  71. Robards, M. D., Silber, G. K., Adams, J. D., Arroyo, J., Lorenzini, D., Schwehr, K., & Amos, J. (2016). Conservation science and policy applications of the marine vessel Automatic Identification System (AIS)—A review. Bulletin of Marine Science, 92(1), 75–103. [Google Scholar] [CrossRef]
  72. Rocha, D., Marley, S. A., Drakeford, B., Potts, J., & Gullan, A. (2022). The benefits of guide training for sustainable cetacean-based tourism in developing countries, case study–Ponta do Ouro Partial Marine Reserve, Mozambique. Journal of Coastal Conservation, 26(4), 33. [Google Scholar] [CrossRef]
  73. Rodrigue, J. P., & Notteboom, T. (2013). The geography of cruises: Itineraries, not destinations. Applied Geography, 38, 31–42. [Google Scholar] [CrossRef]
  74. Rutherford, J., Kobryn, H., & Newsome, D. (2015). A case study in the evaluation of geotourism potential through geographic information systems: Application in a geology-rich island tourism hotspot. Current Issues in Tourism, 18(3), 267–285. [Google Scholar] [CrossRef]
  75. Scott, N., & Laws, E. (2013). Whale watching—The roles of small firms in the evolution of a new Australian niche market. In Small firms in tourism (pp. 153–166). Routledge. [Google Scholar]
  76. Soler, I. P., Gemar, G., Correia, M. B., & Serra, F. (2019). Algarve hotel price determinants: A hedonic pricing model. Tourism Management, 70, 311–321. [Google Scholar] [CrossRef]
  77. Spinelli, R., & Benevolo, C. (2022). Towards a new body of marine tourism research: A scoping literature review of nautical tourism. Journal of Outdoor Recreation and Tourism, 40, 100569. [Google Scholar] [CrossRef]
  78. Sun, X., Kwortnik, R., Xu, M., Lau, Y. Y., & Ni, R. (2021). Shore excursions of cruise destinations: Product categories, resource allocation, and regional differentiation. Journal of Destination Marketing & Management, 22, 100660. [Google Scholar] [CrossRef]
  79. Vázquez, R. M. M. (2020). Nautical tourism: A bibliometric analysis. Journal of Spatial and Organizational Dynamics, 8(4), 320–330. [Google Scholar]
  80. Weeden, C., Lester, J. A., & Thyne, M. (2011). Cruise tourism: Emerging issues and implications for a maturing industry. Journal of Hospitality and Tourism Management, 18(1), 26–29. [Google Scholar] [CrossRef]
Figure 1. Nautical activities and ease of practicing the activity: accessible (without skills, red-ringed circles) and conditioned accessibility (requires some skills, black-ringed circles). Source: authors.
Tourismhosp 06 00099 g001
Figure 2. Research framework. Source: authors.
Tourismhosp 06 00099 g002
Figure 3. The case study area located off the central Algarve (southern mainland Portugal). Source: authors. The software used to create the map was QGIS version 3.36.1 Maidenhead, 2023 (http://qgis.org accessed on 11 July 2024).
Tourismhosp 06 00099 g003
Figure 4. Exemplification of empirical perception for vessel tracking based on a reliable minimum number of records per vessel/day. On the right is a vertical scale that gives an indication of the usefulness of the data depending on the daily number of AIS records. Source: authors.
Tourismhosp 06 00099 g004
Figure 5. Illustrative tracking of vessel movements for data interpretation. With five daily records, it is possible to define a route pattern for a given vessel. Source: authors. The software used to create the map was QGIS version 3.36.1 Maidenhead, 2023 (http://qgis.org accessed on 11 July 2024).
Tourismhosp 06 00099 g005
Figure 6. Density maps using AIS data for the 14 vessels with records of relevance for this study. In the upper figure, the records refer to the months of July to September 2022 (nS = 3397 records), while in the lower figure, the months of January to March of the same year are depicted (nW = 322 records). Source: the software used to create the map was QGIS version 3.36.1 Maidenhead, 2023 (http://qgis.org accessed on 11 July 2024).
Tourismhosp 06 00099 g006
Figure 7. Relationship between distance from the coast and the most likely type of activity.
Tourismhosp 06 00099 g007
Table 1. AIS data variables and definitions. Source: authors.
VariableTypeDataDefinitionTraits
MMSILong IntegerStaticMaritime Mobile Service Identity, unique series of nine digits identifying the vesselVessel’s flag
Vessel NameStringStaticThe name of the vessel
Vessel TypeStringStaticThe type of vessel
StatusIntegerDynamicThe navigational status reported by the vessel
SpeedDoubleDynamicThe speed of the vessel, in knotsThe motion of the vessel according to its speed, drifting or navigating motion
LatitudeDoubleDynamicThe geographic coordinates of the vessel
Longitude
HeadingIntegerDynamicThe direction the vessel is facing
Date/TimeDateDynamicThe date and time of the recordThe season of the year of the record
Time
Table 2. Vessel type classification and their relevance for the present study. Source: authors.
AIS ClassificationSimplified AIS ClassificationRelevant
Cargo shipCargo shipNo
FishingFishingNo
PassengerPassengerYes
Pleasure craftPleasure boatYes
Sailing
Anti-pollution equipmentRescueNo
Law enforcement
Medical transport
Search-and-rescue vessel
Tug
Other typeOther typeNo
Table 3. Data related to the boats summarised (MMSI codified). This table was constructed by collecting data from secondary sources (i.e., videos and photos of boats and their operators from the internet), and from primary data sources relating to AIS data collected and field sampling. The data refer to only the area off the central Algarve for January–March and July–September 2022. Pmax is the maximum number of daily AIS pings found for a given vessel. Record patterns: S for summer, W for winter. Spot types refer to the likelihood of finding the boat in the following activities: A—caves and/or B—dolphins, C—charter, D—SCUBA diving (may include diving in natural reefs, sunken vessels/other structures, or artificial reef modules). Source: own elaboration.
No.Vessel CodeVessel TypeAIS PingsPmaxDays at SeaBerth MarinaSpotSW
1PA1Passenger99513131AlbufeiraA, B819176
2PA2Passenger93113109AlbufeiraA, B85576
3SA1Sailing499990FaroC47029
4SA2Sailing4691177FaroC4618
5SA3Sailing203844VilamouraC1994
6PC1Pleasure Craft2021045VilamouraC, D2020
7SA4Sailing1021031VilamouraC1020
8SA5Sailing97820OlhãoC916
9SA6Sailing88820PortimãoC, D7216
10PA3Passenger58342PortimãoA, B562
11PC2Pleasure Craft31415AlbufeiraC310
12PC3Pleasure Craft20411PortimãoC200
13SA7Sailing1968AlbufeiraC190
14SA8Sailing532AlbufeiraC05
Disclaimer/Publisher’s Note: The statements, opinions and data contained in all publications are solely those of the individual author(s) and contributor(s) and not of MDPI and/or the editor(s). MDPI and/or the editor(s) disclaim responsibility for any injury to people or property resulting from any ideas, methods, instructions or products referred to in the content.

