1. Introduction
Due to the developments in machine learning (ML) techniques for information retrieval and natural language processing (NLP); the growing accessibility of large datasets; and the realization of numerous commercial applications, sentiment analysis (SA) and related approaches have gained popularity in research and practice and started to be used in many different fields (
Gan et al., 2016;
Starosta et al., 2019). SA aids in a better understanding of the quality of an experience as viewed by more numerous and culturally diverse tourists (
Stellacci & Moro, 2023). SA can deliver more accurate and detailed sentiment expression (
Xi et al., 2022). SA is a subset of emotional computing that tries to extract, examine, and categorize subjective data from the source material, such as emotions (
Alslaity & Orji, 2022). Based on the idea that the information presented in a text is either subjective (personal ideas, beliefs, or feelings) or objective (facts and evidence), SA, also known as opinion mining, is used to analyze texts (
Baniya et al., 2020). SA is used to detect the polarity (positive, negative, or neutral) and strength of sentiment markers in the text and to find phrase valence and compare phrases with a lexicon or dictionary (
Nave et al., 2018).
In this study, text-based internet visitor reviews are subjected to SA. The authors completed an SA of TripAdvisor reviews posted by visitors to Romanian castles and palaces. A qualitative approach was preferable to a survey to highlight better personal opinions, experiences, emotions, and satisfaction from a cultural consumption perspective. Also, cluster analysis (CA) grouped reviews by key characteristics to identify visitor experience trends, enhancing insights from the SA. Econometric modeling assessed the relationships between emotions and sentiments. A group of experts evaluated the relevance of information obtained for managerial decision-making at the company level.
Identifying the diverse experiences of visitors at heritage assets can be achieved with qualitative analysis. This analysis can help to understand cultural consumption, especially in tourism. On the other hand, qualitative analysis allows for an exploration of individual opinions. This type of analysis helps to assess the impact of visitors’ personal experiences on the perception of cultural heritage.
Qualitative analysis can offer an image of the emotional connections of visitors to heritage sites. These results can provide valuable insights into visitor satisfaction and involvement. The motivations behind cultural consumption can then be analyzed based on these results.
A survey-based analysis may not capture the full range of personal experiences presented in reviews. These online reviews can provide comprehensive pictures of visitors’ perceptions and interactions with cultural heritage. The results of such analyses can guide the development of more targeted marketing and management strategies for heritage sites.
This paper explores online reviews from visitors to Romanian palaces and castles, as these comments may offer a foundation for enhancing the cultural products and services offered to tourists. The insights gained could serve as valuable resources for management, enabling companies to improve their cultural heritage offerings, connect more effectively with their target audience, and tailor experiences to align with visitors’ preferences and interests, fostering a richer cultural experience.
The castles and palaces in Romania have a rich and varied history. They are characterized by different periods of architectural development. We can mention here the Gothic, Renaissance, and Baroque styles but also Neo-Romanian styles. These buildings have their own stories connected with the evolution of construction techniques over time. Their details present a fascinating picture of the era in which they were built.
The buildings analyzed in this article were the homes of nobility, royalty, and political figures. They have influenced the history of Romania. For example, Bran Castle and Peleș Castle were at the center of key moments in Romania’s development. These castles currently hold collections of art and historical objects. Thus, museums in these heritage sites can enrich the knowledge of visitors.
Visitors from all over the world are attracted to castles and palaces. Thus, they make an important contribution to cultural tourism and to the economy of Romania. They host guided tours, festivals, and cultural events. There is also an indirect impact because this encourages investments in infrastructure and hospitality services.
Various myths and stories are associated with certain castles and palaces. These increase the attractiveness of these sites. Stories that combine history with legend attract visitors. Thus, visitors can have unforgettable experiences.
Castles and palaces offer a unique blend of culture, history, and architecture. They have impressive details, such as carved wood, stained glass, or event halls, which impress visitors. Castles and palaces are located in special landscapes, offering a unique experience to visitors. Emotions influence the consumption of cultural heritage. Those related to joy or surprise help people connect to the story of these heritage assets. Thus, visitors will explore more and actively engage in various activities. Emotions stimulate the recommendation of a visited place and the satisfaction of visitors. The visitors (cultural consumers) will return to previously visited places and share their experiences with others.
Visitors are motivated to return and visit a heritage asset if they feel connected to its story. Thus, the educational impact of their experience increases. Emotions make experiences unforgettable. They influence the behavior of visiting cultural assets. Experiences shared on social media platforms can attract other visitors eager to experience the same emotions.
Engaging actively on social media can capture various groups’ interests while creating a platform where individuals feel unrestricted in sharing their emotions and viewpoints.
Steinert and Dennis (
2022) examined how social media technologies facilitate online emotions because of emotional affordances. The authors emphasized that emotions can be easily expressed with the help of these technologies. However, the emotional reactions and behaviors obtained can be positive and negative.
As a result, this engagement could potentially impact the choices of others when it comes to visiting cultural heritage institutions. Individuals meet and discuss various aspects and share perspectives on online platforms. Thus, heritage-focused groups are developed (
Svensson & Maags, 2018).
New visitors can be motivated by others’ comments posted on social media to choose which cultural heritage destinations to visit. Because they are looking for similar experiences, they will be influenced by the ones shared by previous visitors.
The growth of a heritage site’s reputation can be influenced by positive comments. Site managers can improve the offer based on constructive feedback, thus responding to the needs of visitors.
The gap addressed by this paper is filled by an analysis of the comments posted online by visitors to selected Romanian castles and palaces. The discussion is connected to heritage tourism in Romania. It also provides valuable information on cultural heritage management.
The results of this study can contribute to identifying measures to improve the attractiveness of heritage assets. These measures could refer to the integration of interactive activities and immersive games within traditional cultural experiences on-site. This approach could help to refine offerings and improve the visitors’ experiences.
This paper is structured as follows:
Section 2 highlights a literature review and discusses the importance of analyzing tourist reviews.
Section 3 briefly presents the built heritage assets (castles and palaces) selected for this study, emphasizing their current usefulness and cultural value for consumers.
Section 4 describes the methodology used in the analysis.
Section 5 contains the data analysis.
Section 6 contains a discussion of the results. The final section concludes the paper.
2. Literature Review
In our literature analysis, we followed not only the interest in the topic of this paper (the opinion of clients/tourists regarding the capitalization on built heritage and increases in visibility through tourism) but also the relevance and usefulness of the selected analysis methods. In general, developing new cultural products based on heritage and local specificity can contribute to reconsidering the past’s usefulness for increasing individuals’ quality of life today. Creating new tourism products and activities represents a catalyst for job creation and overall community development (
Stefan et al., 2021). Rural areas with limited development prospects can benefit from heritage valorization (
Surugiu et al., 2019). The local development model is reshaped by leveraging cultural heritage in rural areas (
Stefan et al., 2021). Direct engagement with stakeholders and residents is important in heritage capitalization, fostering a sense of community identity (
Papathanasiou-Zuhrt & Di Russo, 2019).
We also considered the informational and opinion-creating power of customer reviews—the post-consumption of tourism products/services, freely expressed on social networks—to maintain the market competitiveness of companies that, among other things, capitalize on tourism and cultural activities of built heritage sites.
In tourism research, online reviews are analyzed with sentiment analysis (SA) (
Xi et al., 2022). Studies of travel reviews at a microeconomic scale are found in many SA works (
Starosta et al., 2019). Scholars and businesses capitalize on the results of studies on tourists’ sentiments and experiences posted on social media platforms to find solutions for various challenges (
Baniya et al., 2020).
The tourism industry’s big data offers insights into visitor sentiment, helping marketers tailor effective strategies for culturally diverse visitors with various practical applications (
Xi et al., 2022). Sentiment analysis allows for the mapping of the emotional responses of an extensive cluster sampling, overcoming some drawbacks of in-person interviews and other conventional data collection techniques (
Stellacci & Moro, 2023). Computer programs have limitations in recognizing sarcasm, irony, negotiation, jokes, and exaggeration, which are all human (
Baniya et al., 2020). Big data analytics based on user-generated material should not be used as the only foundation for managerial choices but rather as an additional source of information with visitor surveys conducted in the field (
Baniya et al., 2020). Using text mining and sentiment analysis techniques, managers may create fresh insights and plans that align with tourists’ expectations at a far more flexible and sustainable pace (
Nave et al., 2018).
Various authors have used SA to examine brief informal texts like opinions, sentiments, assessments, attitudes, and emotions on social media sites like Twitter, TripAdvisor, Trivago, Booking, Yelp, Weibo, eLong, and Ctrip regarding visited places (
Nave et al., 2018;
S. Park et al., 2018;
Baniya et al., 2020;
Jiang et al., 2021;
Zhang et al., 2021;
Lee et al., 2022;
Liu et al., 2022;
Sangkaew & Zhu, 2022;
Surugiu et al., 2022;
Hashimoto et al., 2023;
Stellacci & Moro, 2023;
Surugiu et al., 2023); accommodation service quality; features and experiences (
Maity et al., 2020;
E. Park et al., 2020;
Luo et al., 2021;
Xi et al., 2022;
Escandon-Barbosa & Salas-Paramo, 2023;
Li et al., 2023;
Thirumaran et al., 2023); and various types or forms of tourism (
Lu & Zheng, 2020;
Bhalla et al., 2021;
Demir et al., 2022;
Kattiyapornpong et al., 2022;
Luong et al., 2023;
S. Park et al., 2023;
Zhang et al., 2023).
S. Park et al. (
2018) showed how to examine consumer data using social media analytics and GIS analysis. The authors used SA to quantify the emotional content of tweets and linked tweets to place-based geostatistical analysis.
Nave et al. (
2018) applied a text mining and SA technique supported by R studio to organize Yelp online reviews concerning tourism in cities and present them in a decision support system.
SA was developed in the study of
Baniya et al. (
2020) to analyze tourists’ impressions of Angkor Wat expressed on TripAdvisor. According to the authors, positive sentiments were correlated with attraction design, guided tours, and on-site experiences.
Lee et al. (
2022) used the Naïve Bayes method to determine visitors’ emotional states, as stated in TripAdvisor travel reviews after visiting tourist attractions in Gatlinburg, USA.
Jiang et al. (
2021) sought to determine Hong Kong’s online destination image from reviews of tourism websites by mainland Chinese visitors and thereby capture the thoughts and feedback of individuals.
Surugiu et al. (
2022) looked into social media usage to highlight the tourism and cultural assets of Bucharest and identified the sentiments that visitors had while traveling.
Liu et al. (
2022) conducted an SA, to thoroughly understand the sentiments provided in Google and TripAdvisor reviews by foreign anime tourists who visited four well-known Japanese anime locations.
Sangkaew and Zhu (
2022) used the Naïve Bayes method to analyze the sentiment of TripAdvisor reviews of seven local Phuket marketplaces.
The SA developed by
Stellacci and Moro (
2023) based on online reviews of outdoor public spaces from TripAdvisor, was focused on community involvement in urban design studies. Japanese tourists’ perceptions of cultural theme parks were analyzed by
Hashimoto et al. (
2023). They used on-site visits, photographic documentation, and SA of visitors’ comments on TripAdvisor.
Zhang et al. (
2021) investigated reviews retrieved from
Ctrip.com concerning cultural theme parks in China using text mining, SA and a collection of statistical texts.
Surugiu et al. (
2023) examined tourists’ sentiments about various supposedly creative attractions in Bucharest.
As previously stated, accommodation services are analyzed using the SA method, as are features and experiences.
Maity et al. (
2020) used SA—which involved inferring user opinions from Trivago—and a conjuncture-based approach to breaking down phrases into pertinent clauses. The authors analyzed hotel features and the sentiment values associated with them.
E. Park et al. (
2020) performed an SA on customer review comments on a booking website to comprehend customers’ hotel revisiting behavior, using linguistic inquiry and word count.
Luo et al. (
2021) sought to better understand hotel visitors’ experiences and used deep learning fine-grained SA on
eLong.com online text reviews.
Li et al. (
2023) performed a fine-grained SA combined with a factor extraction technique to study the aspects of online reviews that positively and negatively affect the staycation experience in Hong Kong hotels.
Thirumaran et al. (
2023) found that the prominence of a luxury heritage hotel in the narratives of place creation might change over time based on an SA of hotel guest reviews of internationally renowned travel websites.
Escandon-Barbosa and Salas-Paramo (
2023) used SA to determine how COVID-19 affected travelers’ decisions to book luxurious hotels through TripAdvisor and Booking.
Xi et al. (
2022) devised an SA to determine travelers’ perceptions of Airbnb qualities and examine cross-cultural variances. A language analysis of the Airbnb reviews was performed.
Travelers’ emotions and feelings about their experiences have been analyzed in other works with SA.
Lu and Zheng (
2020) studied the dynamics of opinions about cruise travel during the COVID-19 pandemic.
To comprehend the tourists’ feelings and emotions during COVID-19 and their preferences for spiritual tourism for psychotherapeutic healing,
Bhalla et al. (
2021) conducted SA.
Demir et al. (
2022) employed SA to investigate whether computational literary techniques applied to a novel can produce valuable data that can be used for developing insights. Based on internet reviews of Thailand’s culinary tourism from unidentified reviewers,
Kattiyapornpong et al. (
2022) conducted SA and topic analysis.
S. Park et al. (
2023) used Twitter data for exploratory analysis, bi-gram frequency analysis, and SA to examine orphanage-tourism-related topics and opinions over time.
Zhang et al. (
2023) developed an SA for Weibo posts on recovery travel in China.
Luong et al. (
2023) conducted an SA to explore suppliers’ preference for regenerative tourism.
Consequently, little evidence exists about travelers’ sentiments and emotions when visiting cultural sites. Most authors prefer to deploy SA on accommodation units or various tourism destinations. They have performed niche analyses to depict precise data and insights about visitors’ sentiments associated with traveling experiences (
Papathanasiou-Zuhrt et al., 2019;
Vasile et al., 2015). For this study, a niche approach is chosen about visitors’ sentiments regarding Romanian cultural heritage, focusing on castles and palaces. However, it is essential to consider the fact that when travelers express their emotions and sentiments related to a particular destination, they take into account not only their lived experiences when visiting the respective castle or palace but also those associated with the quality of the restaurants in the area and the accommodation services.
Considering the examples of studies presented above, we performed a more detailed analysis of the scientific literature published in the WoS database regarding the selected data source (TripAdvisor), the analysis method (SA), and the research topic (cultural heritage).
The results indicated that the current study has achieved a novel approach by combining the topic, the method, and the database—the arguments being based on the analysis of the number of articles and studies published up to the query date (20 November 2023) on the three main keywords selected—as well as by associating them with each other and with other keywords, such as visitor comments and tourism:
- -
If we query the database using the word “cultural heritage”, 54,780 published papers can be identified; by associating it with the SA method, the number drops dramatically to 63, and in association with the data source, we would have no article. If we query for the association between cultural heritage/heritage and visitor comments, seven articles can be identified (one article for the first association and six for the second one).
The associated search between heritage and tourism indicates 16,464 papers. If we add the SA method, the number drops to only 28 papers. For a search for cultural heritage associated with tourism, we have only 6522 papers.
A database query according to our method finds 18,320 papers. However, the number drops to 618 when the word tourism is used, and only 35 articles can be identified when the word is associated with cultural heritage.
Only four articles contain the TripAdvisor database in the WoS search, so we did not consider it in the bibliometric analysis using the VOSviewer software (version 1.6.20).
The analysis of thematic links shows several areas of interest followed by experts in the published works:
- (i)
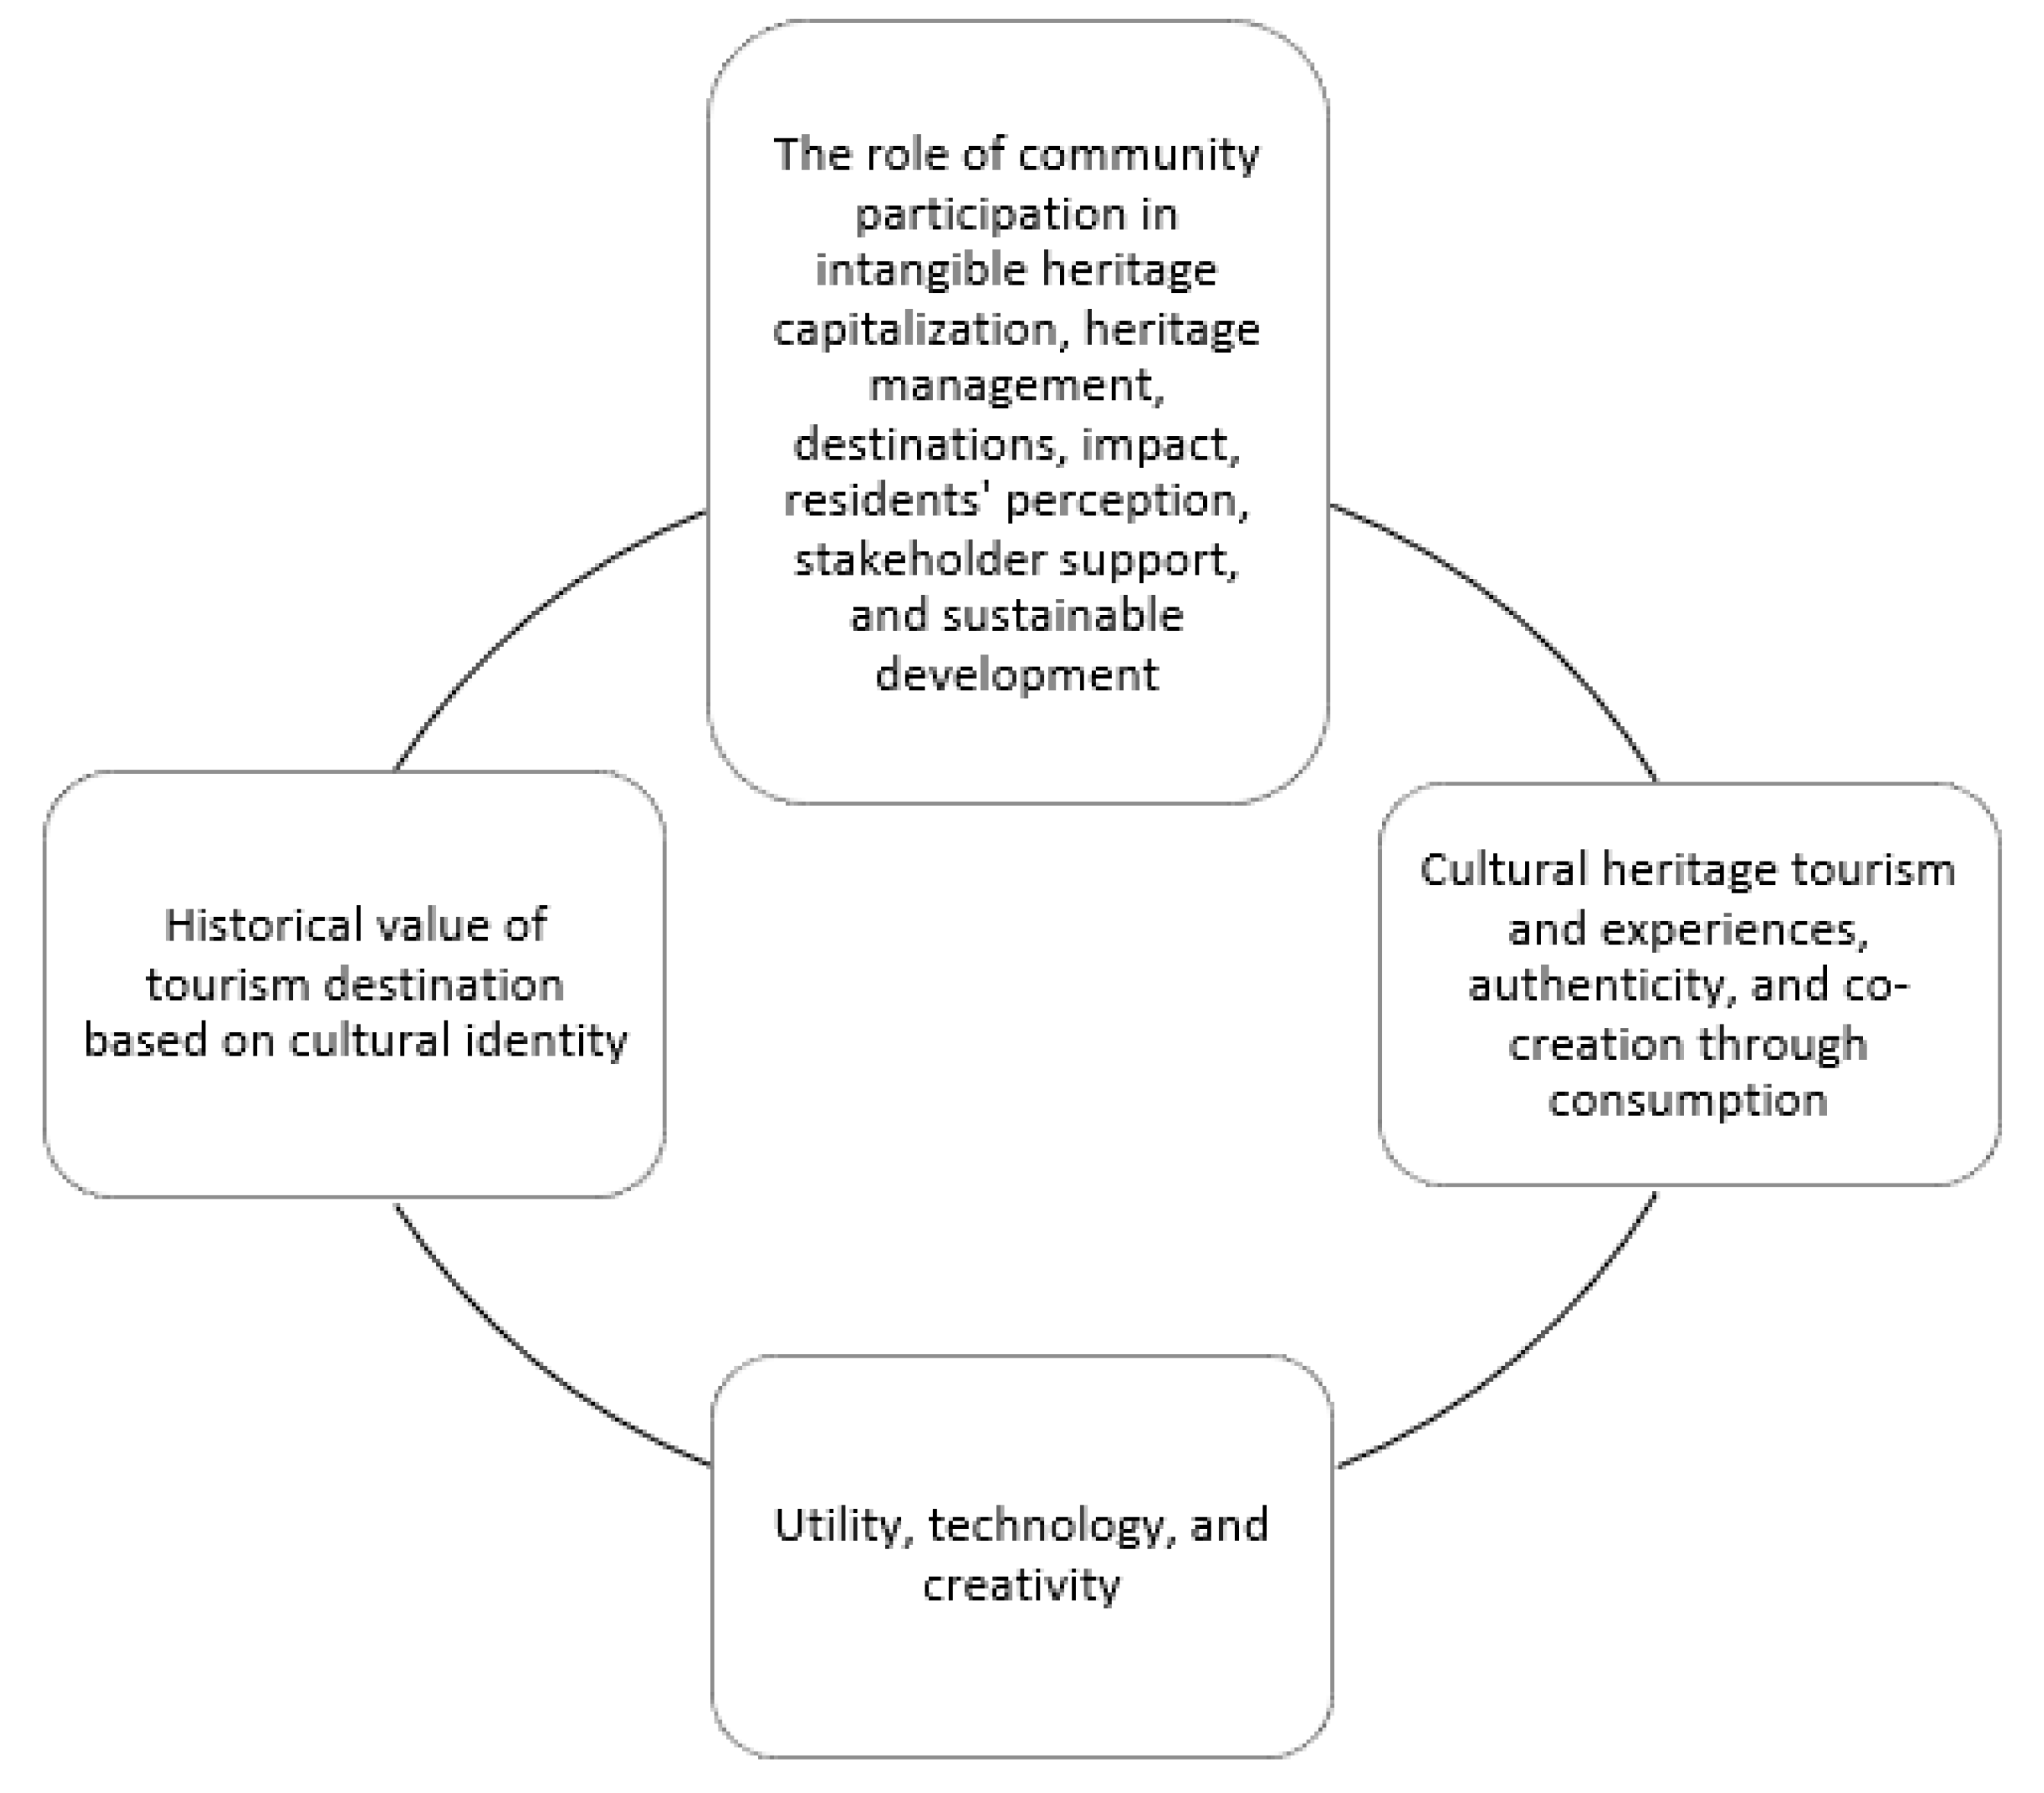
Thus, if we consider cultural heritage (capitalization) associated with tourism, we can conclude that the most debated aspects have focused on the complex interaction between geoheritage (with conservation, protected areas, and ecotourism), land-use (biodiversity, rural development, ecosystem services, etc.), and the value of cultural consumption (diversity patterns, recreation, resilience, heritage management, policy, resources, natural heritage, sustainable development, and systems). At the opposite pole, a less discussed issue addresses politics in relation to place identity and space.
It should be mentioned that the topic of interest for experts in heritage capitalization is approached from a multidisciplinary perspective, both through input aspects (factors and tools) and output aspects (applicability; economic effects; impacts on local development and the sustainability of heritage; and conservation and management). Thus, through an analysis of the 6522 articles, we identified a complex and multidisciplinary approach through four other chains of interest (
Figure 1). The main related keywords links are as follows: adaptive reuse, documentation, culture, determinants, contingent valuation, creativity, augmented reality, digital heritage, and social media system technologies.
- (ii)
If we consider the association between the SA method and tourist activity, the research theme can focus on the importance of databases, the role of customer evaluations, and economic impact analyses of tourism activity in general. The most frequent associations of words used in the analysis can be summarized in five directions of study (
Figure 2).
- (iii)
In the case of the association between the method (SA) and heritage, the results show 23 papers, most of them published after 2021. This indicates, on the one hand, an increase in interest in the analysis of the multidimensional impact of cultural heritage capitalization (35% considered knowledge engineering and 26% considered art, computer vision, and graphics) but, on the other hand, a lack of more comprehensive, multidisciplinary research on the impact/externalities of the valorization of cultural heritage through tourism, with an emphasis on customer perception/satisfaction (only five papers, published from 2022 to 2023).
From this brief bibliometric analysis, we can conclude that this paper’s topic is of increased interest to specialists and contributes to filling the gap in information regarding the importance of customer perception in the development of business and entrepreneurship of cultural heritage for improvement/innovation in consumption models, which respond, to a greater extent, to consumer expectations.
3. Romanian Castles and Palaces: Treasures to Be Visited by Every Generation
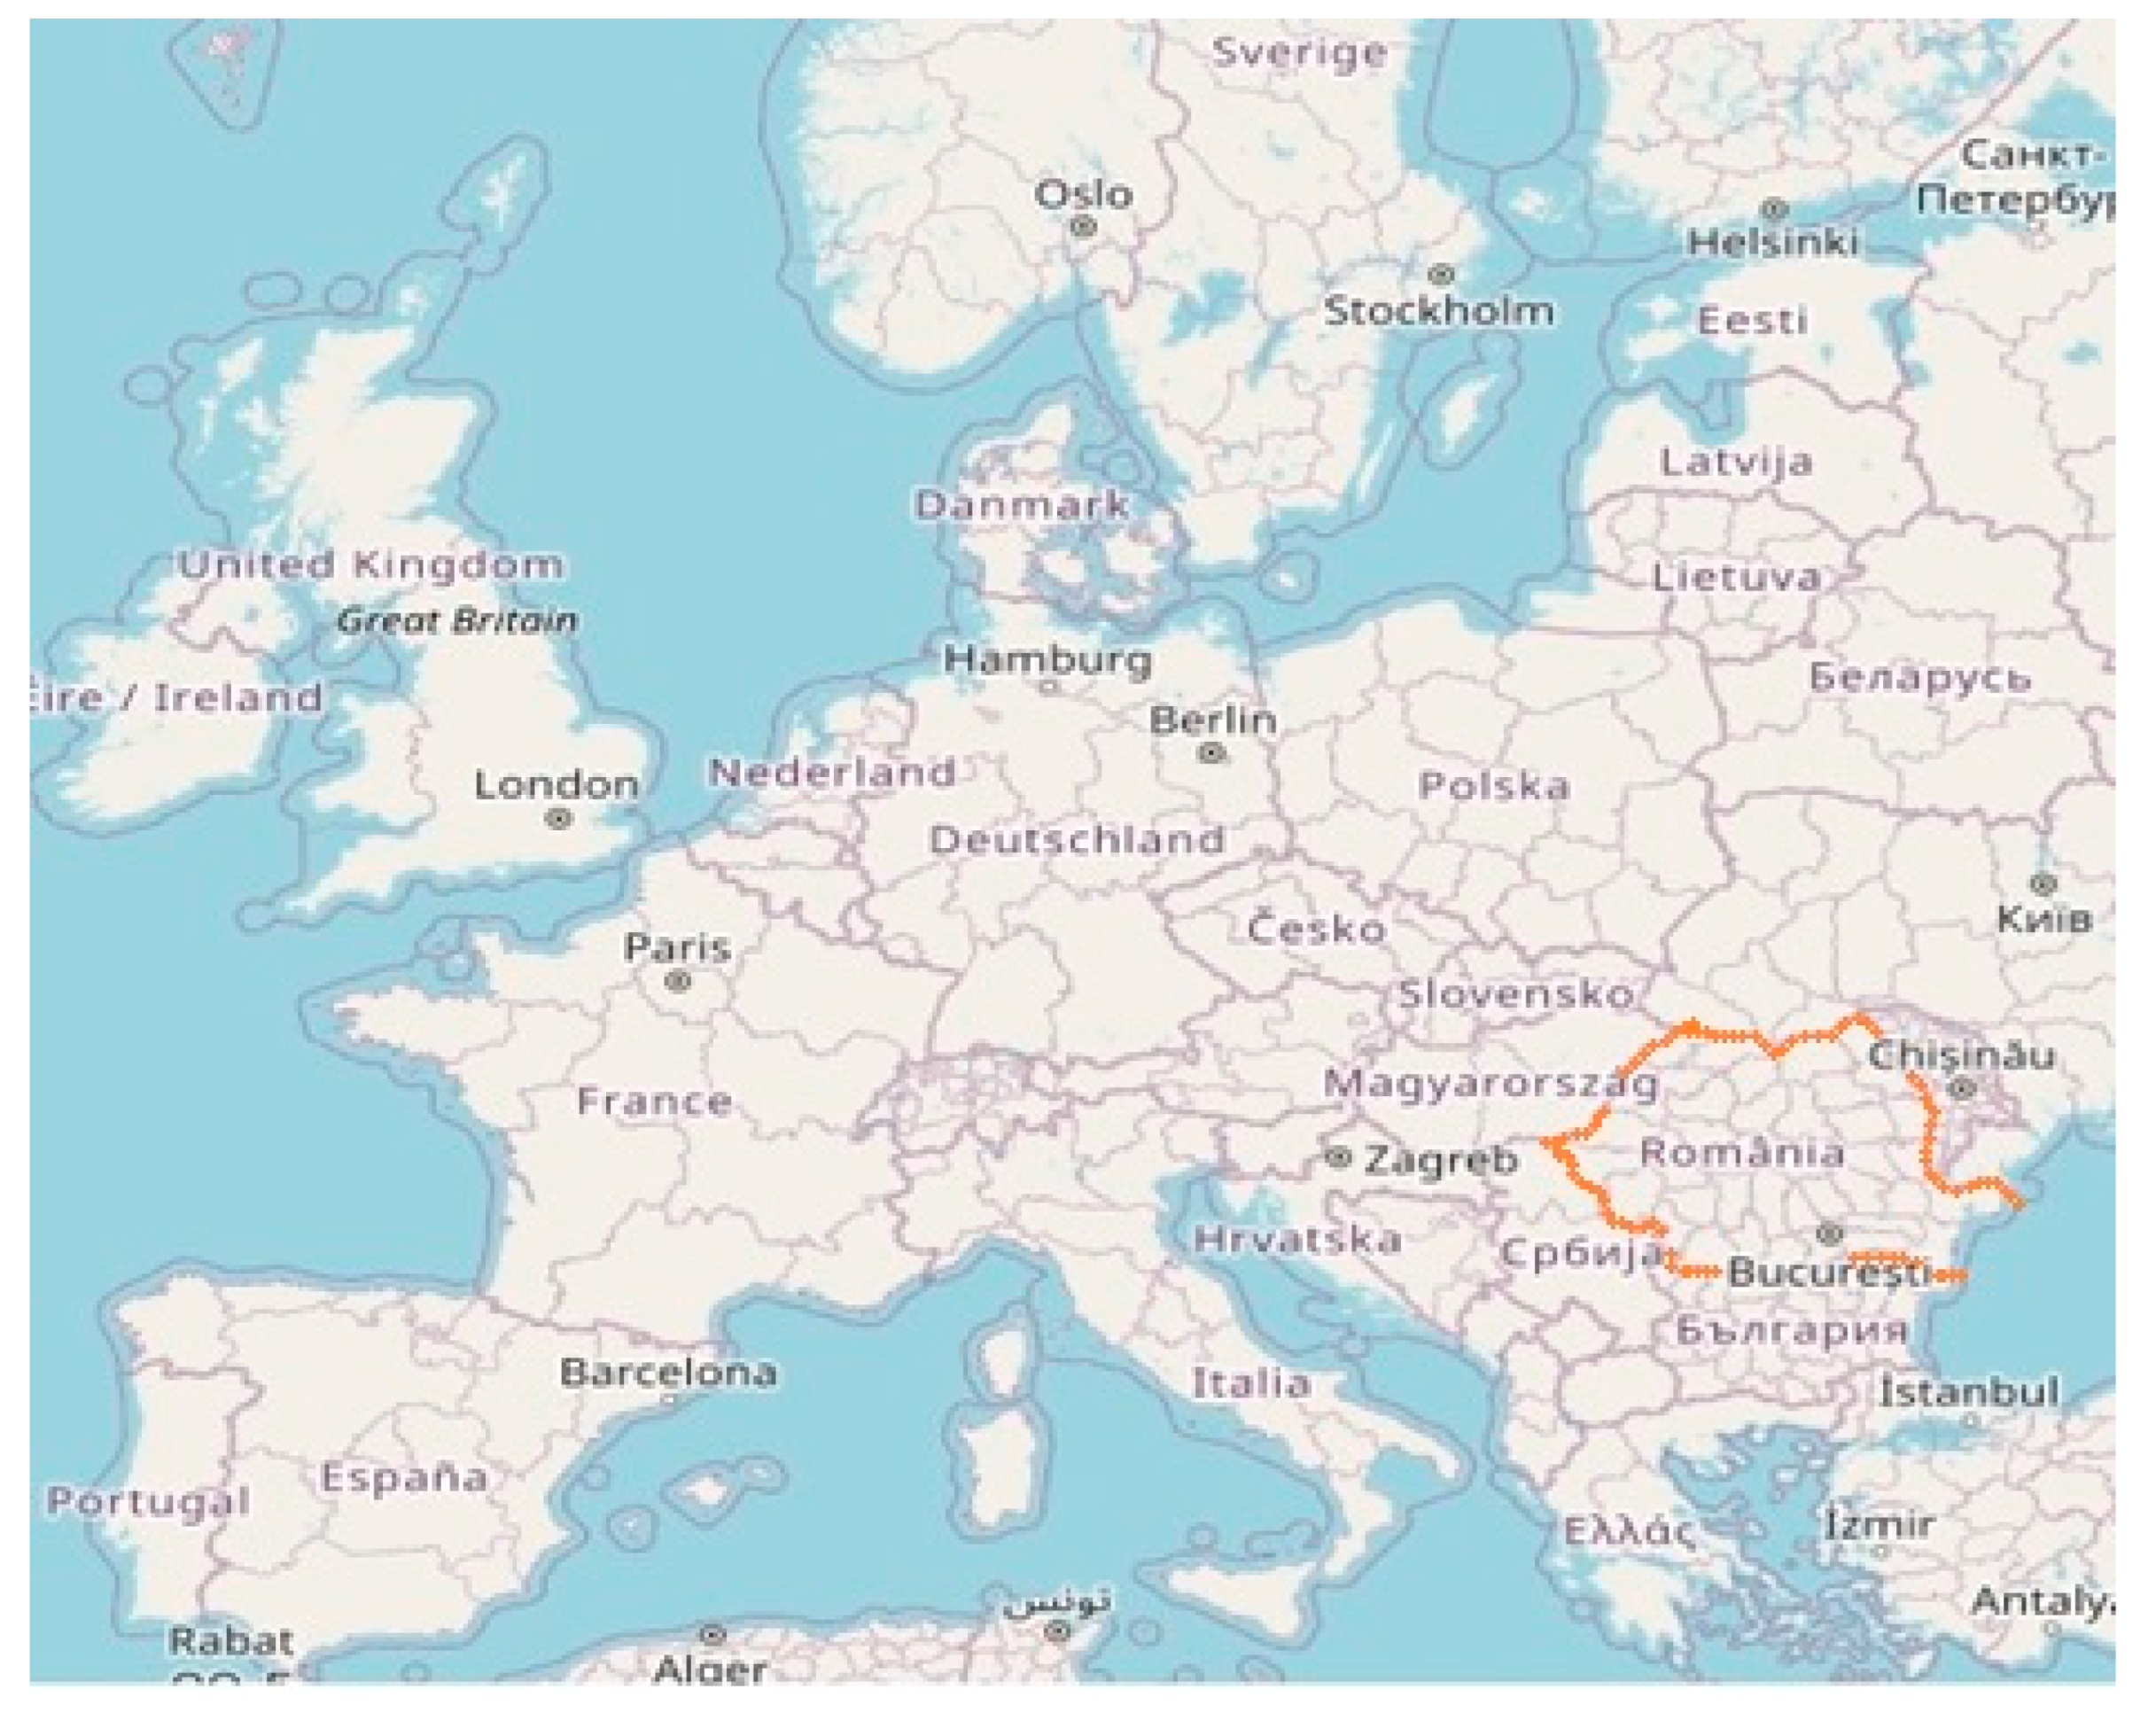
Romania is situated in the southeast of Europe, bordered by Bulgaria to the south, Ukraine to the north, Hungary and Serbia to the west, and Moldova to the east. Romania is rich in tourist attractions, from seasides to mountains and from impressive castles to medieval towns (
Figure 3).
In Romania, there are impressive architectural treasures. Castles, with their luxury, built in different historical periods and using diverse architectural styles, have delighted the imaginations of visitors throughout time and fueled curiosity regarding the events that took place there—personal and political intrigues, significant historical events for local development, dramas, etc. These edifices are windows to the past, emphasizing the complexity and beauty of history. From world-famous castles such as “Dracula’s” castle (Bran Castle), or the castles/palaces of the royal family of Romania (Peles Castle, Pelișor Castle, and Cotroceni Palace), to castles or mansions less known to tourists, such as Károlyi Castle and Bánffy Castle, these national heritage sites of Romania are insufficiently valued as cultural assets. They have a unique, historical, and practical informational load that can activate the benefits of the past for present and future local development and the enrichment of international cultural heritage.
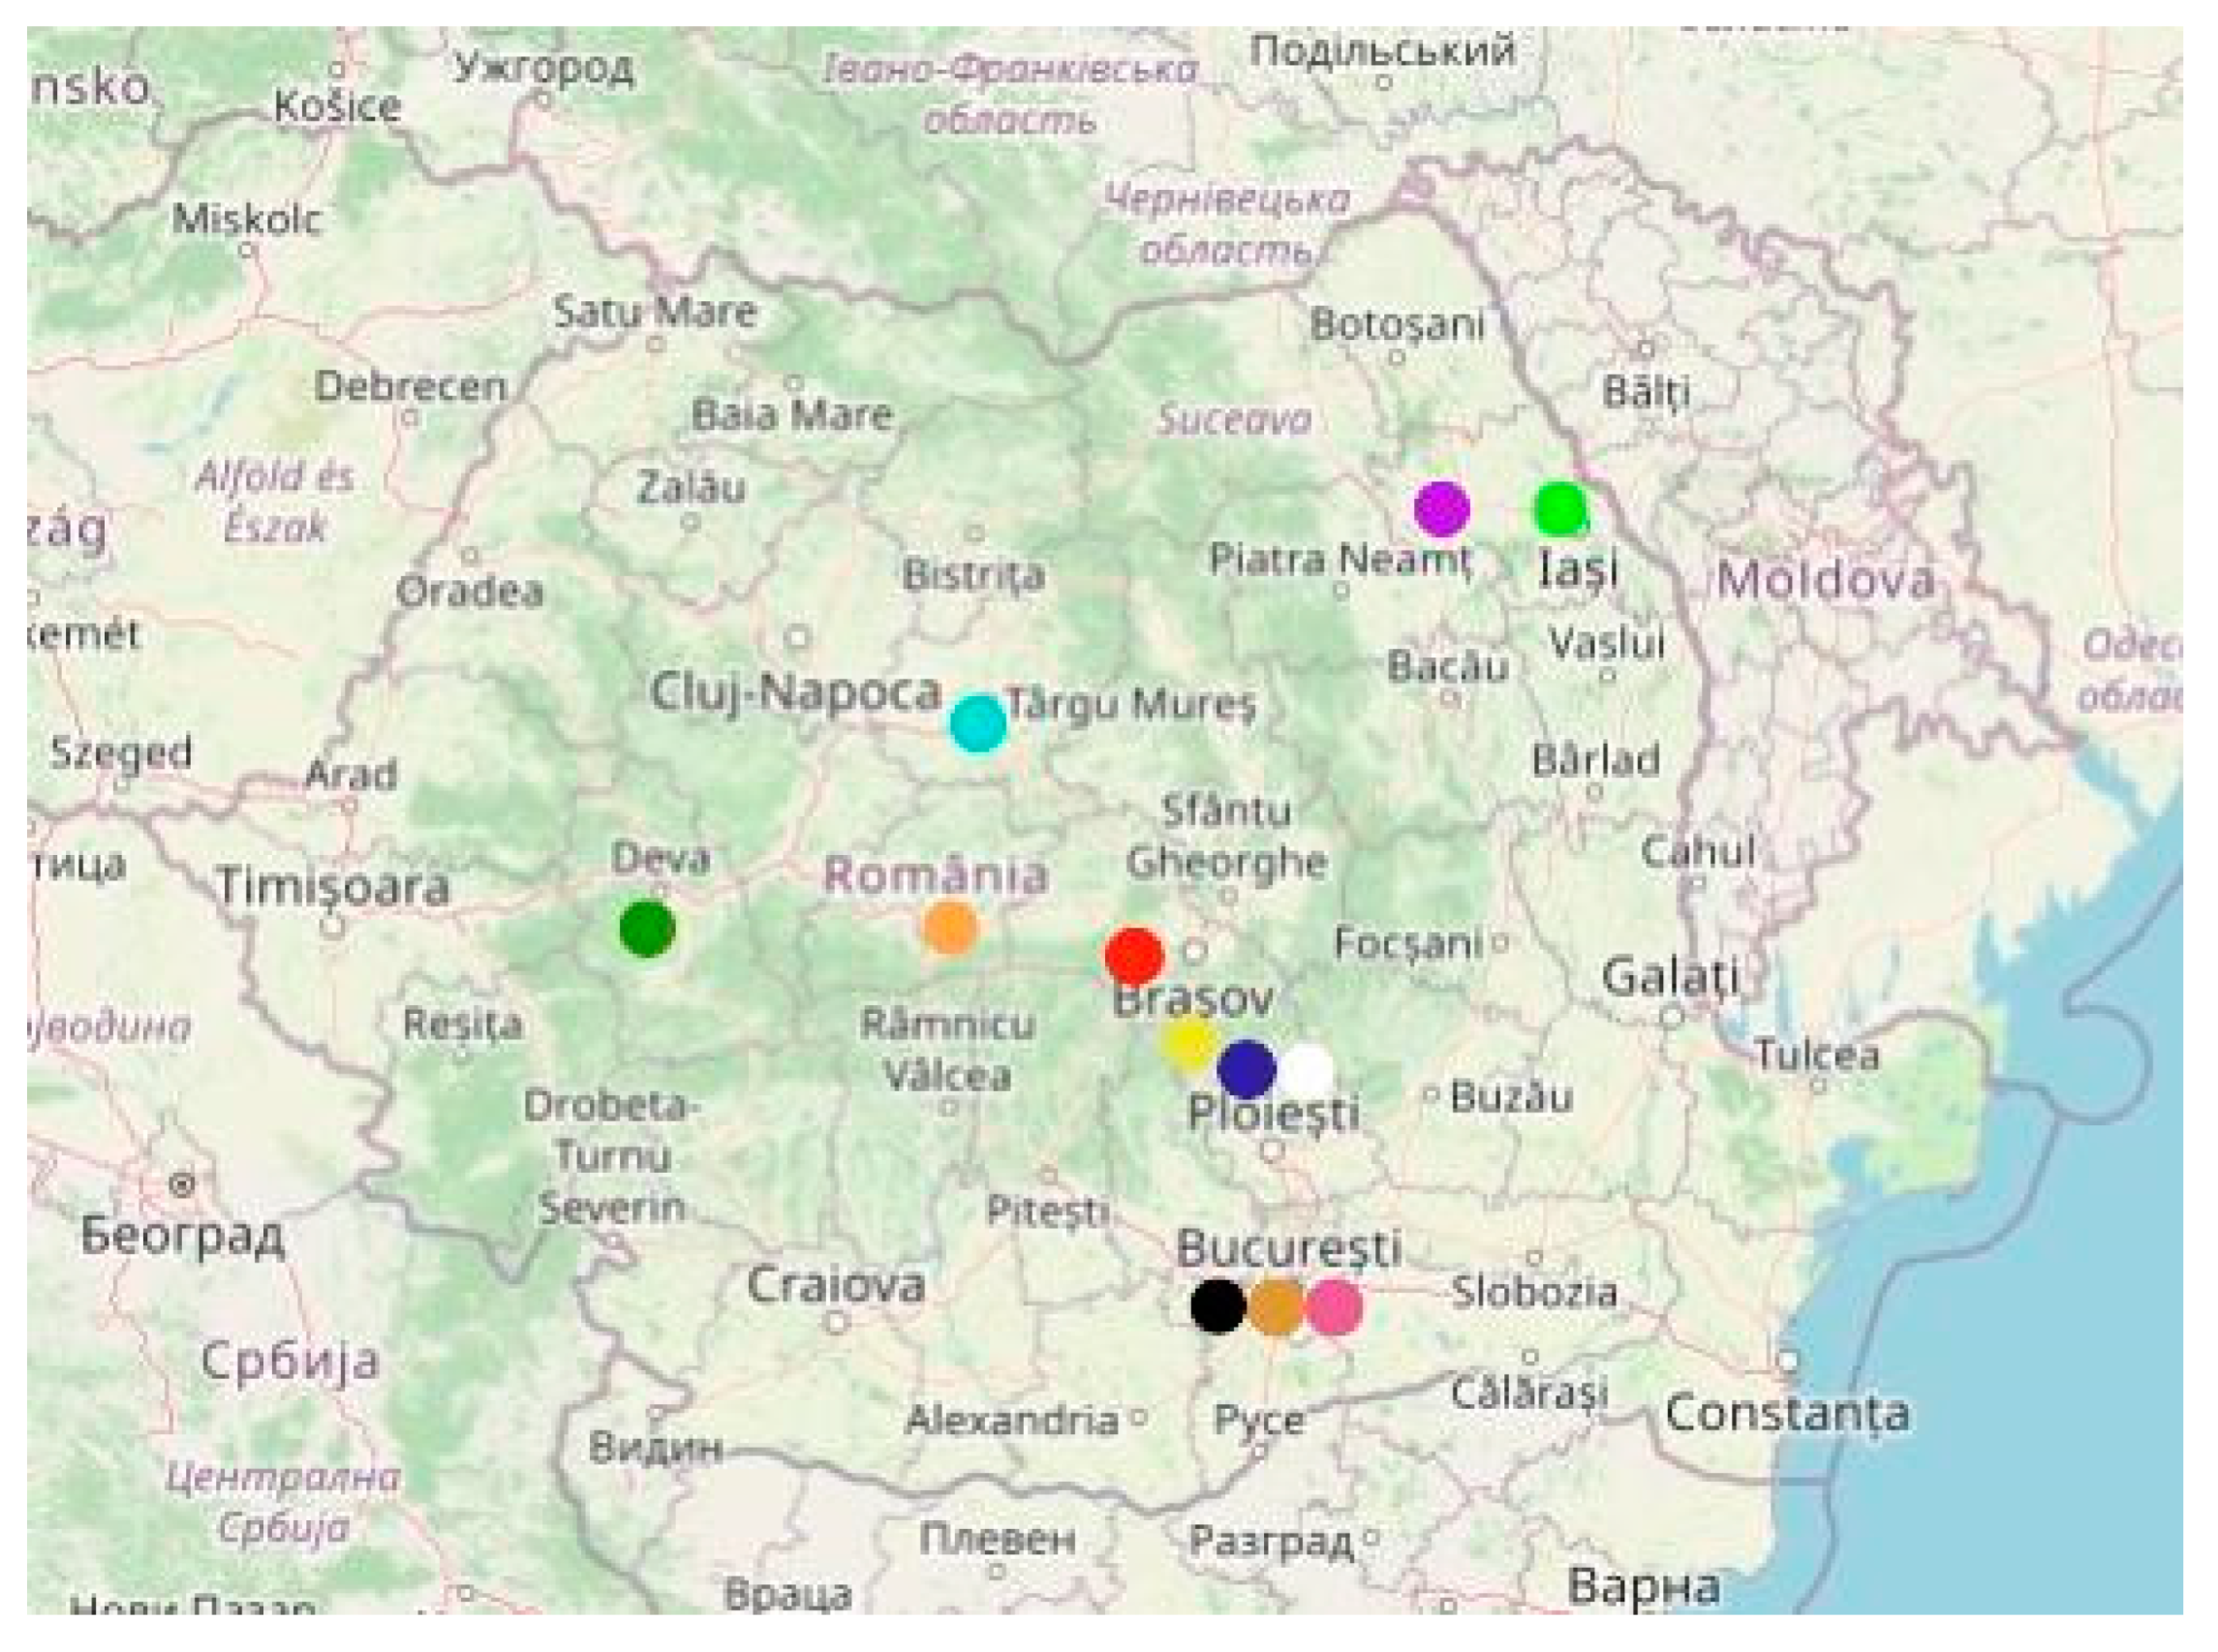
The initial analysis identified 18 castles and palaces with a TripAdvisor account. These castles and palaces are geographically positioned in three Romanian historical regions: Moldavia, Muntenia, and Transylvania (
Figure 4).
Each castle or palace selected for this study has unique characteristics. They have their own stories, which highlight the social, political, and cultural aspects of their times.
Palaces and castles in Romania have a rich and varied history, spanning different periods of architectural development. Each building tells a story about the progress of construction techniques over the centuries and about the eras in which they were built (
Table 1).
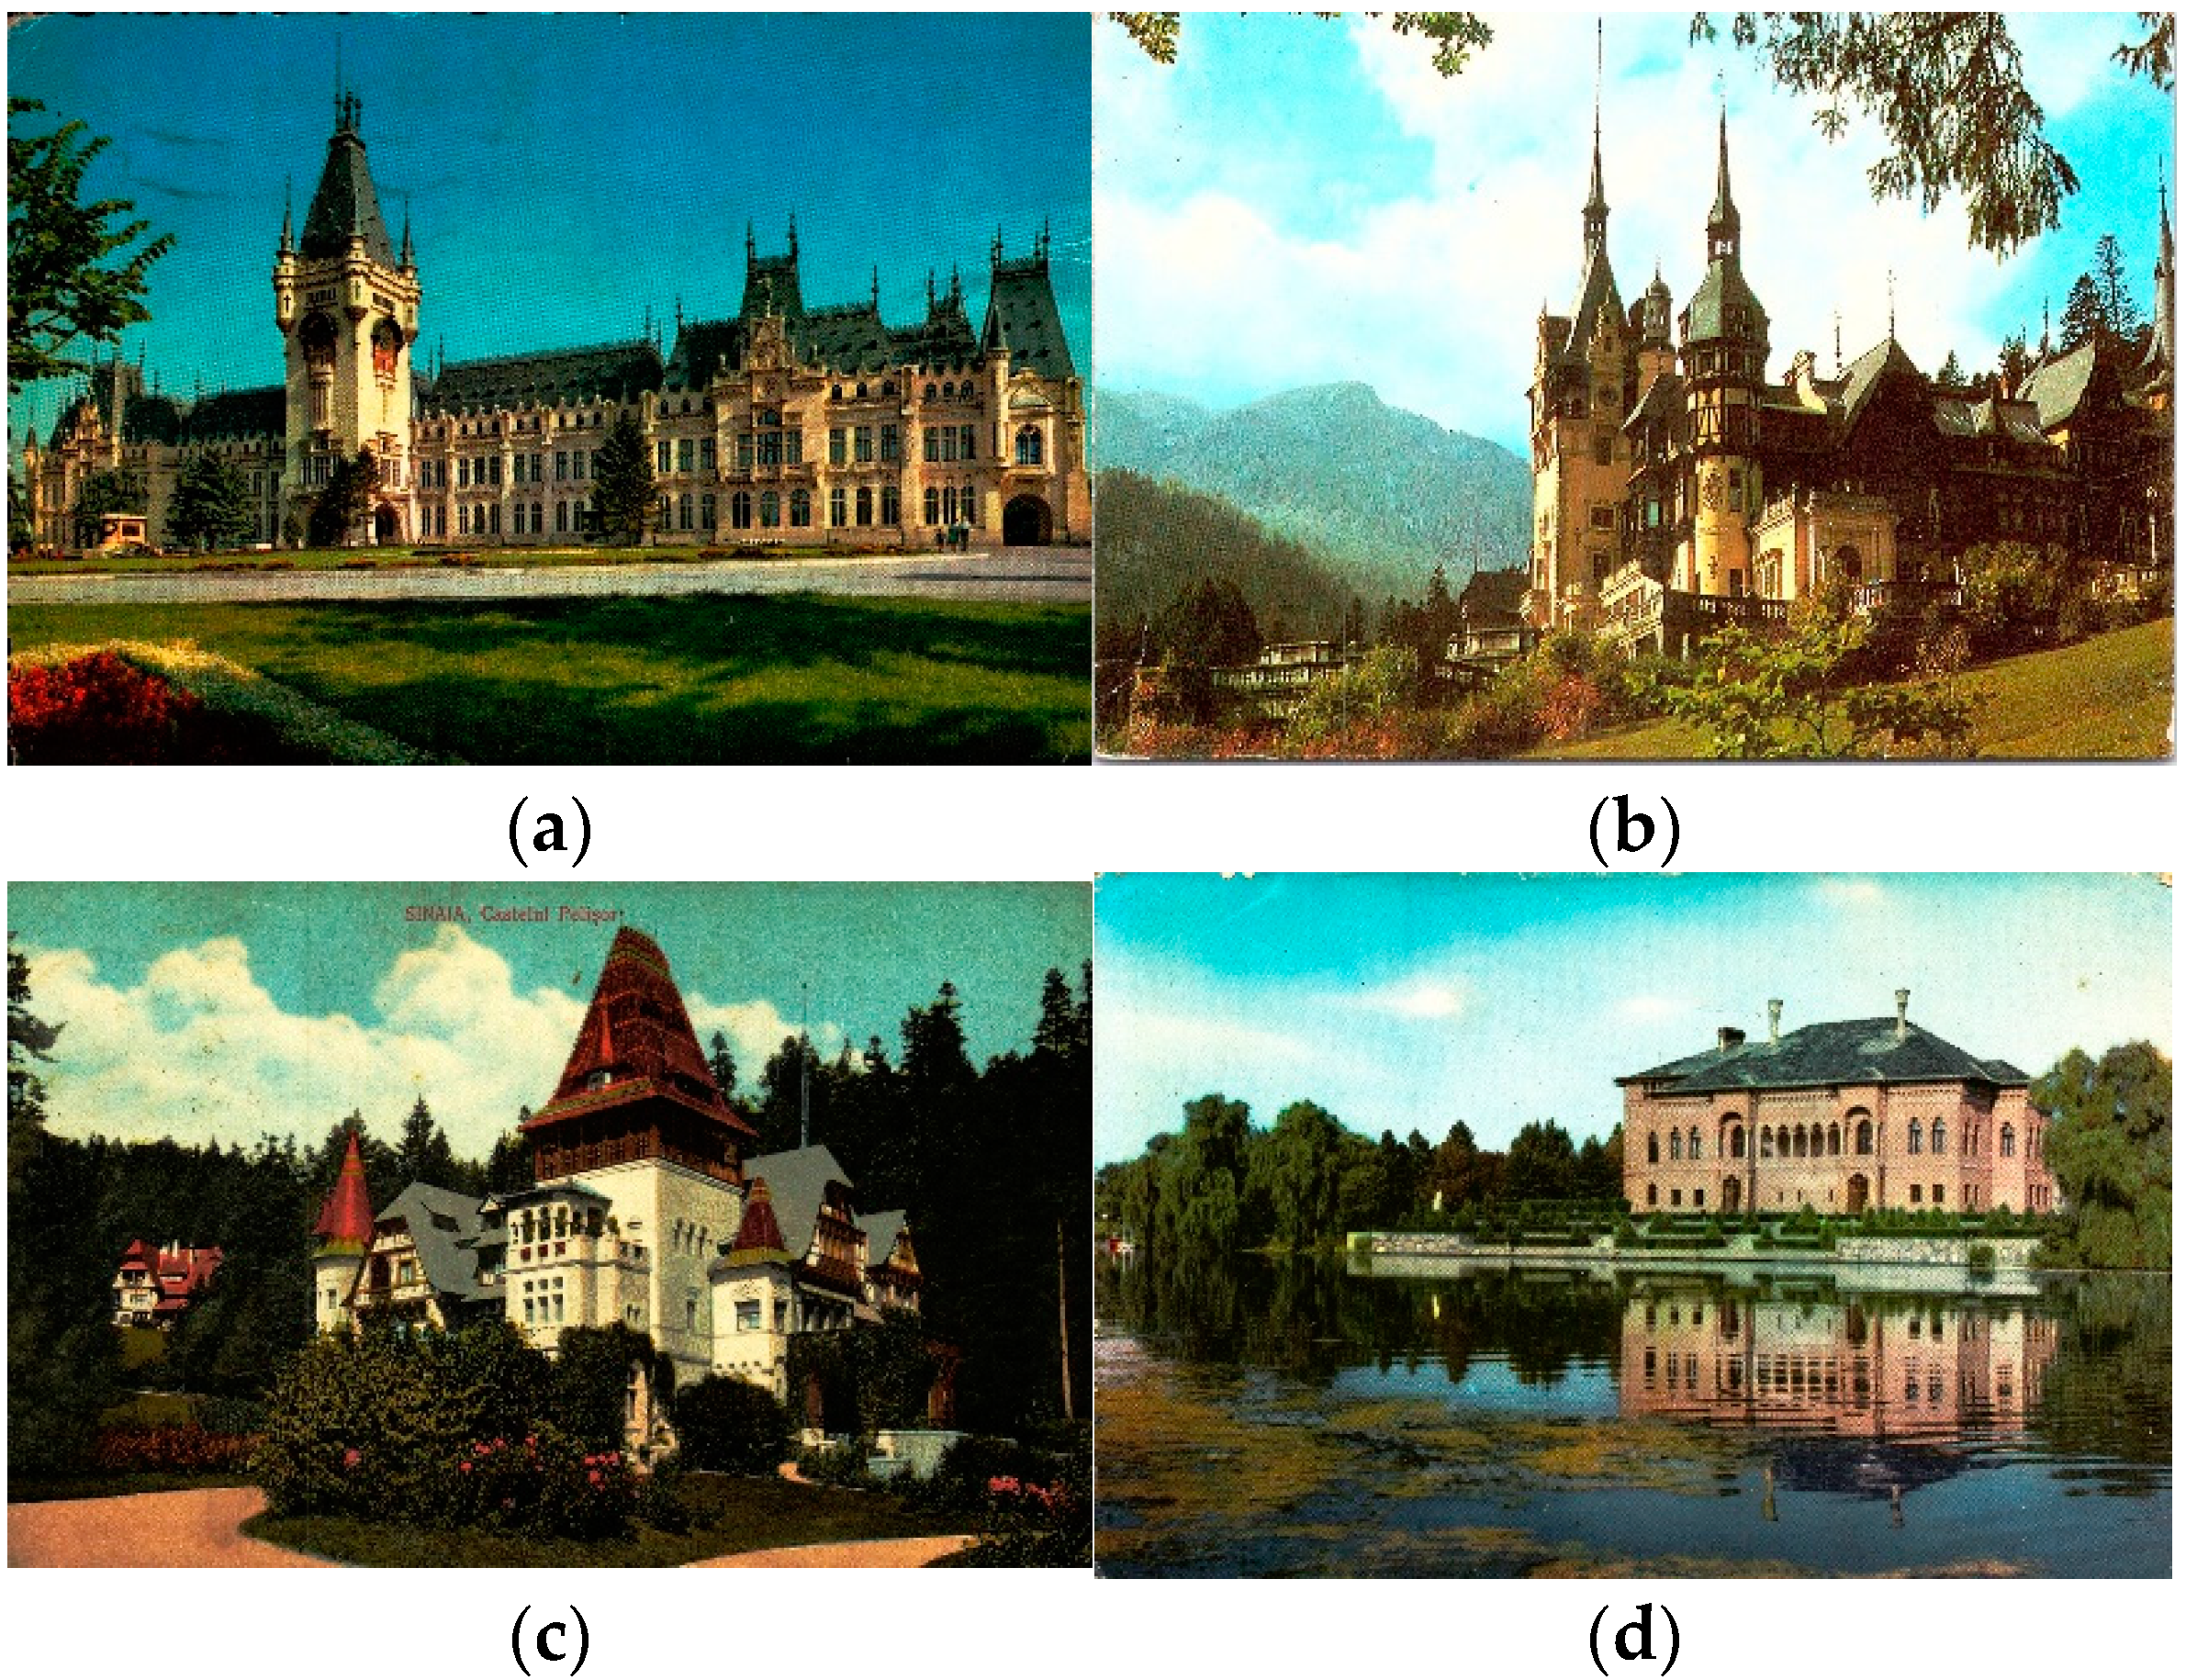
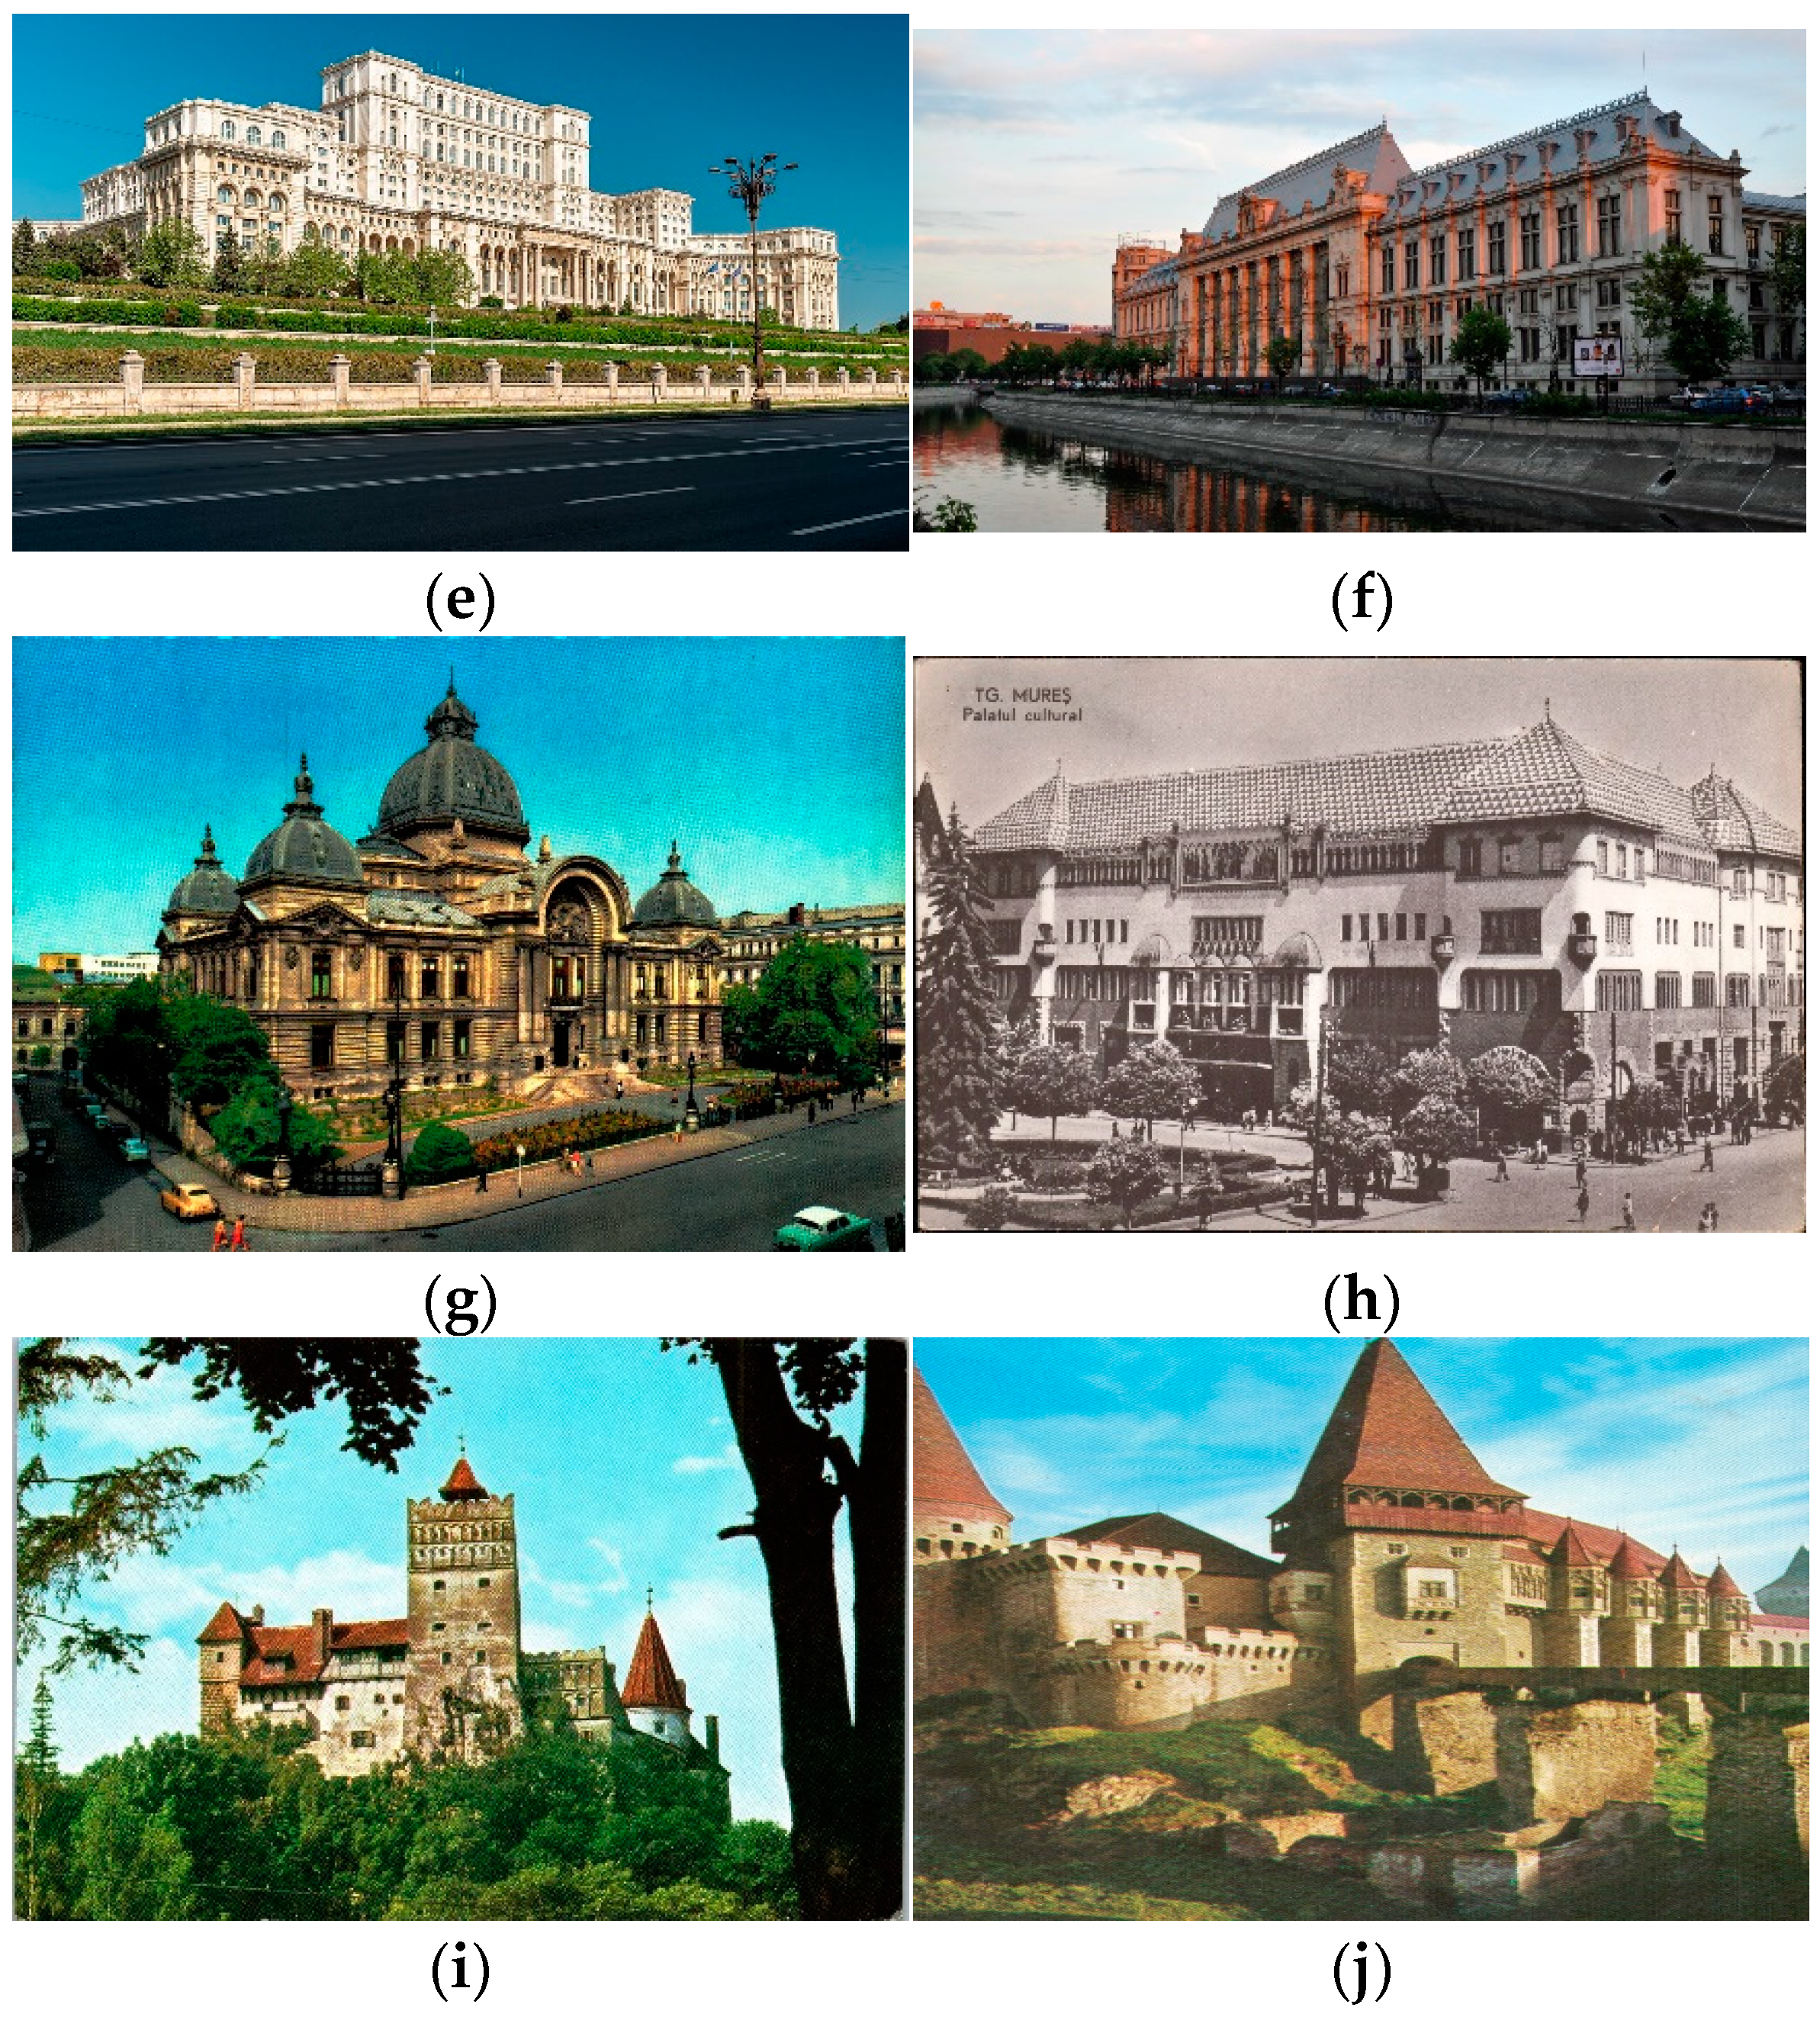
The following images present some of the castles and palaces of Romania (
Figure 5).
These constructions had a central role in the social and cultural life of the eras in which they were built. Palaces and castles were not only residences of nobles but also places where special events such as balls, art exhibitions, and meetings of intellectuals were organized, thus contributing to defining the cultural identity of the era.
Many of these buildings housed and still house impressive art collections. The paintings, sculptures, and other precious works of art displayed in these places add cultural value and reflect the tastes and interests of their owners. Entering these castles, visitors are greeted by exceptional art collections, from paintings and sculptures to precious decorative objects.
The location of these constructions in picturesque natural landscapes contributed to each place’s beauty and unique character. They are integrated into their environment, providing unique visual experiences. The local economy was influenced by the construction and maintenance of these palaces and castles. Craftsmen, artisans, and maintenance personnel play an important role in these activities.
These palaces and castles are landmarks of Romanian cultural tourism. The country’s cultural values are also promoted by tourists who explore these buildings and their stories and enjoy the atmosphere they evoke.
These castles are testimonies of the lives of some outstanding personalities in history. By visiting these places, people can explore the world where these remarkable people lived and acted, discovering their stories and contributions to Romania’s history. These palaces and castles are an invaluable part of the country’s cultural heritage. They are evidence of the evolution of society and contribute to promoting Romanian cultural values.
4. Methodology
In the beginning, sentiment analysis (SA) was employed. The information was completed to support/nuance the comments regarding the results obtained with cluster analysis and qualitative focus group research associated with in-depth interviews applied to experts in the field. In this way, the results of the study using SA and the informational limits of the database used (extractions from the TripAdvisor platform of the free/non-structural comments of the tourists associated with 18 cultural assets—castles and palaces) were adjusted with the opinions of experts regarding the optimization of business and the capitalization of heritage assets, with their conservation and responsible exploitation.
4.1. Sentiment Analysis (SA)
Three types of techniques for sentiment analysis can be distinguished: lexicon-based techniques; artificial intelligence (AI) or ML-based; and hybrid techniques, which combine the strengths of the first two types (
Alslaity & Orji, 2022;
Xi et al., 2022). Dictionary-based, corpus-based, and hybrid approaches have all been employed in lexicon-based methods to assess sentiment polarity. A sentiment lexicon is a collection of well-known and precompiled phrases (
Xi et al., 2022). Also, to perform SA, specialists deploy ML algorithms to scrutinize the subjective reviews of individuals and extract the sentiment polarity (i.e., positive or negative categories) (
Baniya et al., 2020).
Sentiments consider characteristics connected to polarity (positive, neutral, or negative) and intensity. This is in contrast to emotions like happiness, sadness, anger, fear, and surprise (
Luo et al., 2021). The R software (version 4.3.0), with various packages, is used, including Tm (for text processing), Snowballc (to reduce words to their base form), Wordcloud (for word cloud visualizations), RColorBrewer (to select plot color schemes), Syuzhet (for sentiment scoring and emotion classification), and ggplot2 (for graphs).
In this paper, the lexicon-based technique was used. This method relies on dictionaries or lexicons to identify emotions and sentiments. The technique is simple and effective in analyzing texts. The disadvantages of Syuzhet include limitations in the coverage of the lexicon.
Syuzhet is designed to detect not only sentiment polarity (positive or negative) but also specific emotional states (such as joy, anger, sadness, and anticipation), which is valuable for analyzing consumer emotions toward experiences. SA can be developed with other R packages (like tidytext). Additional customization is necessary for tidytext to identify specific emotions. Another alternative is SentimentR. This package is less focused on specific emotional categories. Syuzhet was chosen for this analysis due to its ability to detect emotions with minimal initial setup.
Extracting reviews or any other textual information of interest is often how text mining begins (
Nave et al., 2018). Palace and castle reviews were collected from TripAdvisor. The final dataset includes 1399 reviews.
The steps of the analysis are importing the text file (with visitors’ comments) into R and data cleaning. The last step is focused on removing special characters. The text is then transformed into lowercase and the words into their base form.
The analysis showed the feelings of travelers regarding their experiences. These feelings influenced their satisfaction regarding palaces and castles. To emphasize the structure of visitors’ experiences, the positive and negative opinions were compared.
The SA provided an assessment of the emotional tone of the reviews. Key emotions and opinions expressed by visitors were extracted during the analysis. This result showed the general sentiment toward castles and palaces.
4.2. Cluster Analysis (CA)
Cluster analysis (CA) grouped the reviews based on various characteristics. Identifying trends in visitor experiences was enabled by segmenting the datasets into subgroups. The analysis provided a deeper understanding of visitors’ perceptions and emotions.
The SA’s results were further deployed into a cluster analysis. One data reduction method is cluster analysis (
Yim & Ramdeen, 2015). The SPSS software (version 29) was used for cluster analysis. Hierarchical clustering is performed, and a dendrogram of the identified sentiments is displayed. A dendrogram is mainly used to determine how to assign objects to clusters. The stages of the agglomeration schedule are represented by vertical lines in the dendrogram’s cluster groupings; these lines separate two connecting clusters. Horizontal lines represent variations in these distances. The dendrogram shows that the most extended horizontal lines represent the most significant disparities (
Yim & Ramdeen, 2015).
The Ward method for creating clusters was preferred. Ward’s method calculates the sum of squared Euclidean distances between each example in a cluster and the mean of all variables. The cluster that raises the sum the least is the one that is combined. According to Ward’s method, distance separates each cluster from the sample’s average. In this method, the distance between two clusters equals the sum of their squares for all the variables. The error sum of squares (ESS) is provided by (
Ward, 1963):
In the above equation, xi is the score of the ith individual.
The earliest stages of a cluster analysis utilizing Ward’s method involve N clusters and an ESS of zero. Second, two N clusters with the smallest ESS value are chosen to create the initial cluster. Third, by re-identifying the N − 1 clusters and analyzing two of them, it is possible to reduce heterogeneity and gradually reduce the number of clusters to N − 1. The fourth phase repeats the second and third processes until one cluster is obtained (
Ridwan & Retnawati, 2021).
K-means cluster analysis can identify relatively homogeneous groupings of cases based on selected features (
IBM Corp., 2023). The basic principle is that of least squares. Thus, the aim is to identify a partition of the dataset into k groups, which minimizes the total of the squared deviations of the partitions (
Kriegel et al., 2016).
In the above equation, WCSS is the within-cluster sum of squares, ‖xij − yij‖ is the Euclidean distance between xij and yij, ci is the number of data points in the ith cluster, and c is the number of cluster centers. Grouping observations by minimizing the Euclidean distances between them is used in the K-means clustering method.
4.3. The Econometric Models
Econometric modeling was used for the relationship between sentiments and emotions. The aim was to analyze how visitors’ positive and negative sentiments are influenced by emotions.
The EViews software (version 13) was used to investigate the relationships between emotions and sentiments. The ordinary least square method (OLS) was used for linear regression. Linear regression is a model with one or more regressors (independent variables) related to a response (dependent variable). The equation is the following:
In the equation above, β0 is the intercept, β1 is the slope, and ε is the random error component.
4.4. Focus Group and In-Depth Interviews
In the last part of the analysis, a focus group of experts was organized to refine and complete the preliminary conclusions. At the same time, it was used to identify the extent to which social media platforms and the free opinions of customers can significantly adjust the offer to the consumer in order to see to what extent such information can be used to develop integrative management at the community level (based on partnerships). The qualitative research was completed with the application of an in-depth questionnaire. Open-ended questions represented 1/3 of the total and focused on identifying openings for future research and possible managerial tools for monitoring business efficiency based on the facilities offered by digital technologies and consumer applications.
Based on the results obtained by applying the previously mentioned methods (SA and CA), a focus group of experts was organized to analyze the relevance of the information obtained for the managerial decision at the company level. The experts’ answers to questions were completed with the additional personal opinions of the experts regarding the relevance of the research and its limits. In this way, the conclusions were adjusted, and at the same time, we identified possible ways to continue the study, including using other methodologies that would allow for better suitability in strategic management and consumer products developed for tourists.
To identify the information consumers share after exploring the offers, we developed focus group discussions and in-depth interviews. This approach was adopted to capture the perspective of consumers, which may not always be evident in written feedback.
The combination of analysis methods adopted in this paper reflects a comprehensive approach that allows for a thorough understanding of the topic. Thus, an overview of visitors’ emotions was provided, the data were segmented into meaningful groups, the relationships between sentiments and emotions were analyzed, and a deeper understanding of the visitors’ experiences was obtained. The methods led us to obtain results regarding cultural consumption patterns.
The following hypotheses were used in this research:
Hypothesis 1. Castles and palaces attract a high level of interest and satisfaction from visitors.
Hypothesis 2. The predominant themes in visitors’ comments reflect a strong interest in visiting castles/palaces and exploring the history of these sites.
Hypothesis 3. The highest proportion of emotions falls within the trust–joy–anticipation–surprise group rather than the sadness–fear–anger–disgust group.
Hypothesis 4. The bubble ratings indicate a higher percentage of positive opinions.
Hypothesis 5. There are several distinct clusters in the data, each reflecting different characteristics in the visitors’ comments.
Hypothesis 6. Emotional responses have a statistically significant impact on both positive and negative visitor sentiments.
5. Data Analysis
5.1. Sentiment Analysis
The tourists expressed their opinions online not only regarding their visits to the respective castles and palaces but also regarding the restaurants visited in the areas of the respective castles/palaces and the quality of the accommodation services offered by the locations.
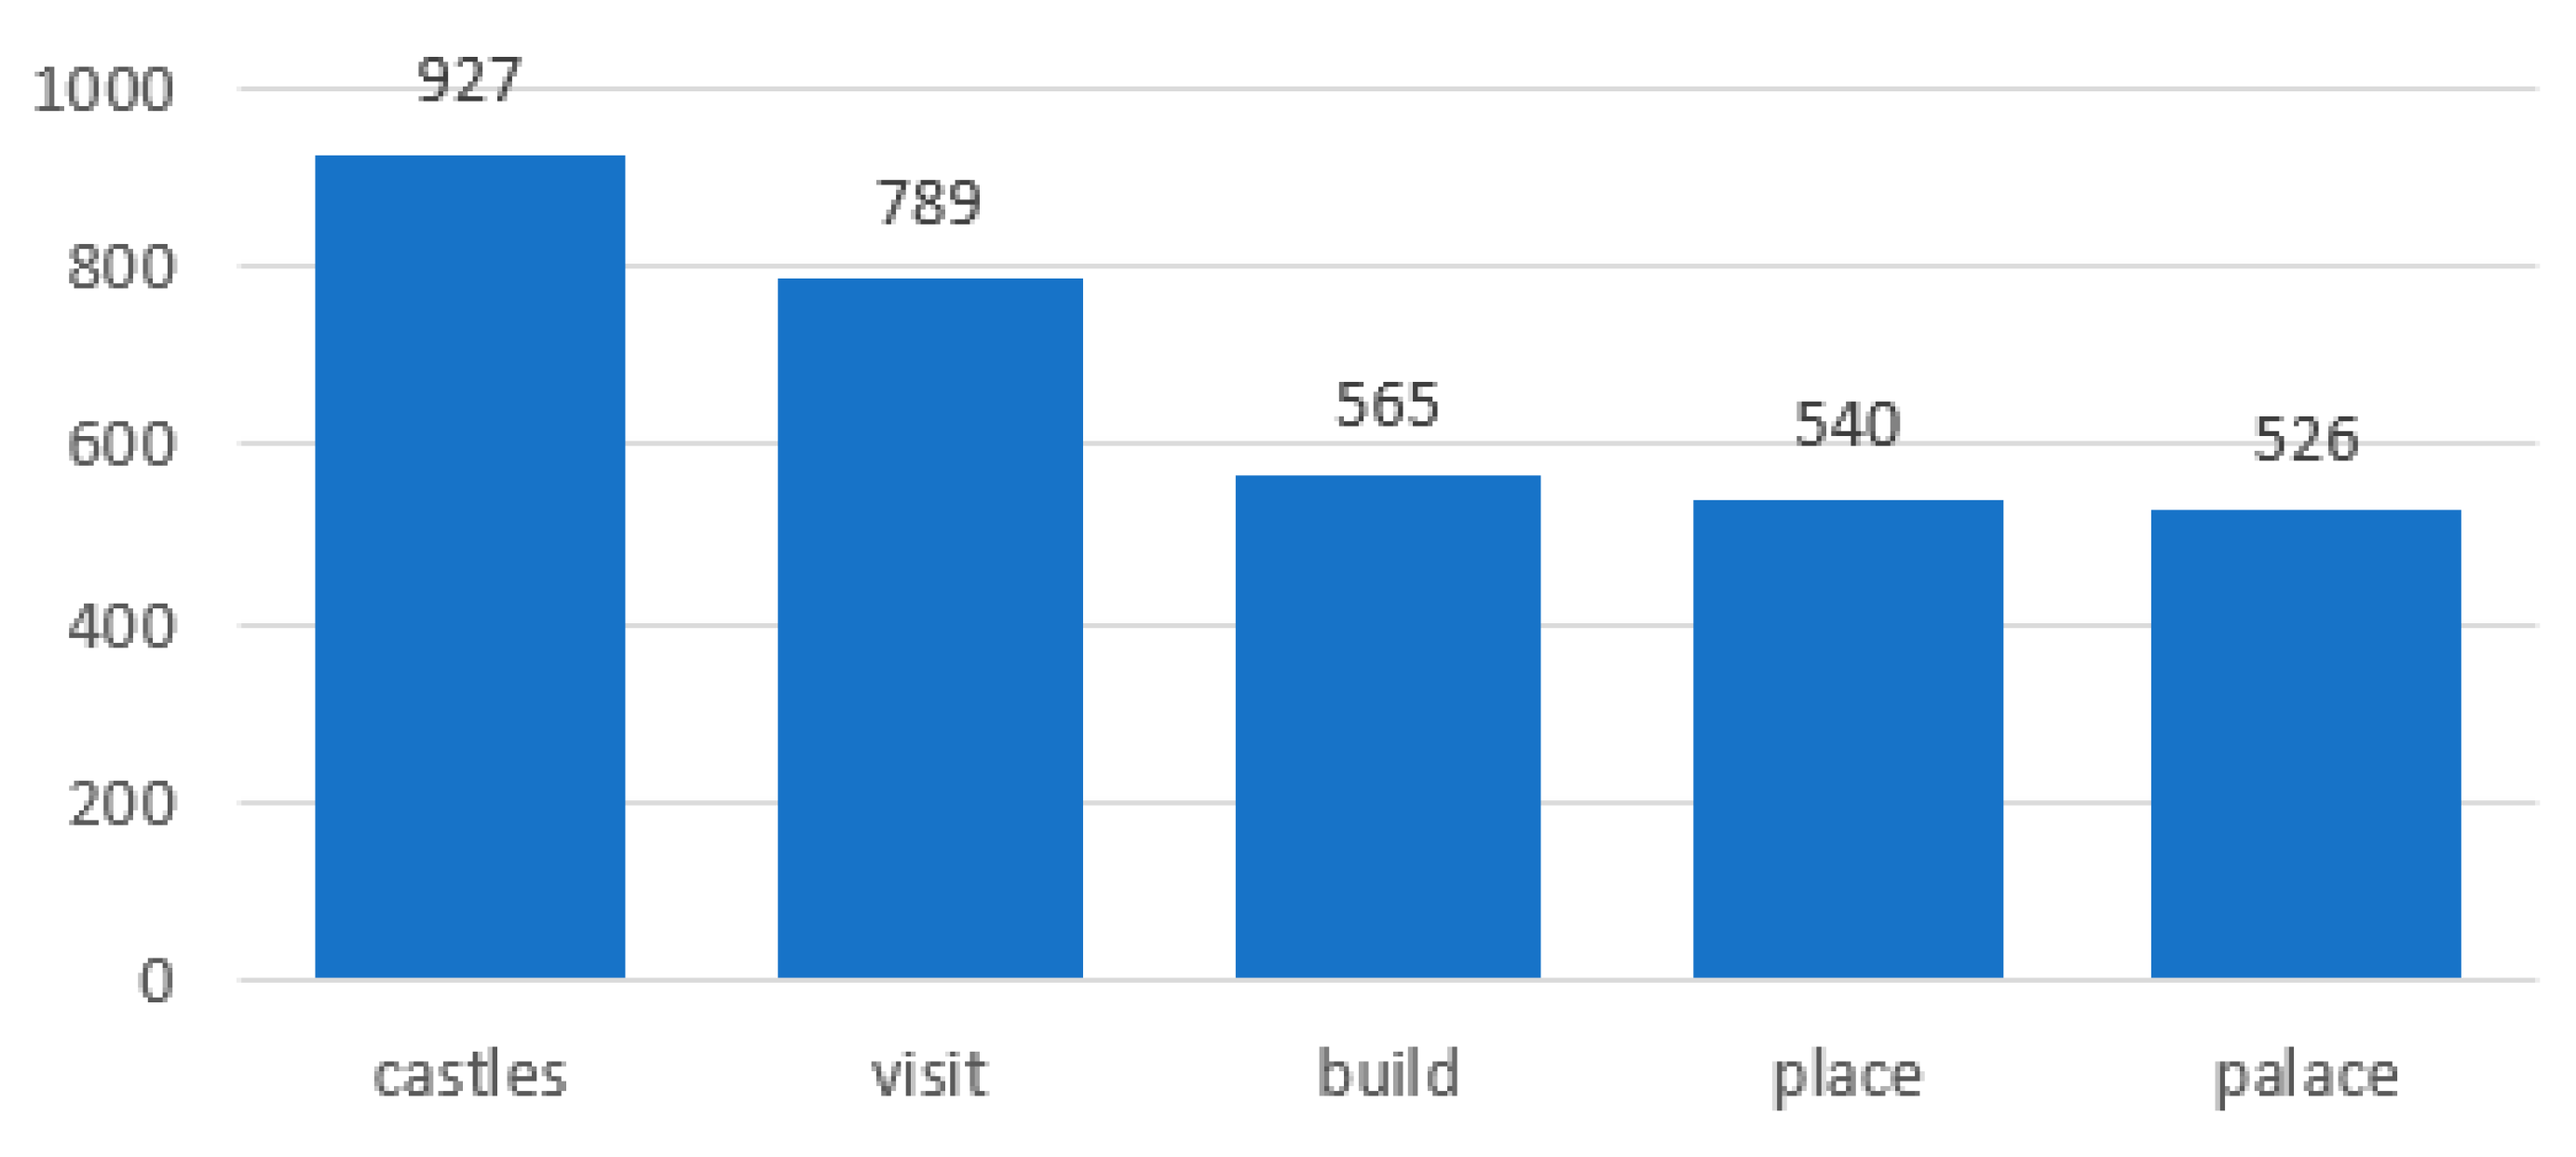
An essential stage in the examination involved tallying the frequency of individual words to pinpoint the most significant ones. The most frequently occurring words were “castl(es)”, followed by “visit(ing/s)”, “build(ings)”, “place(s)” and “palac(es)”, which indicate that most people are interested in visiting Romanian castles and palaces, built heritage assets with history and stories (see
Figure 6). This result confirms Hypothesis 1.
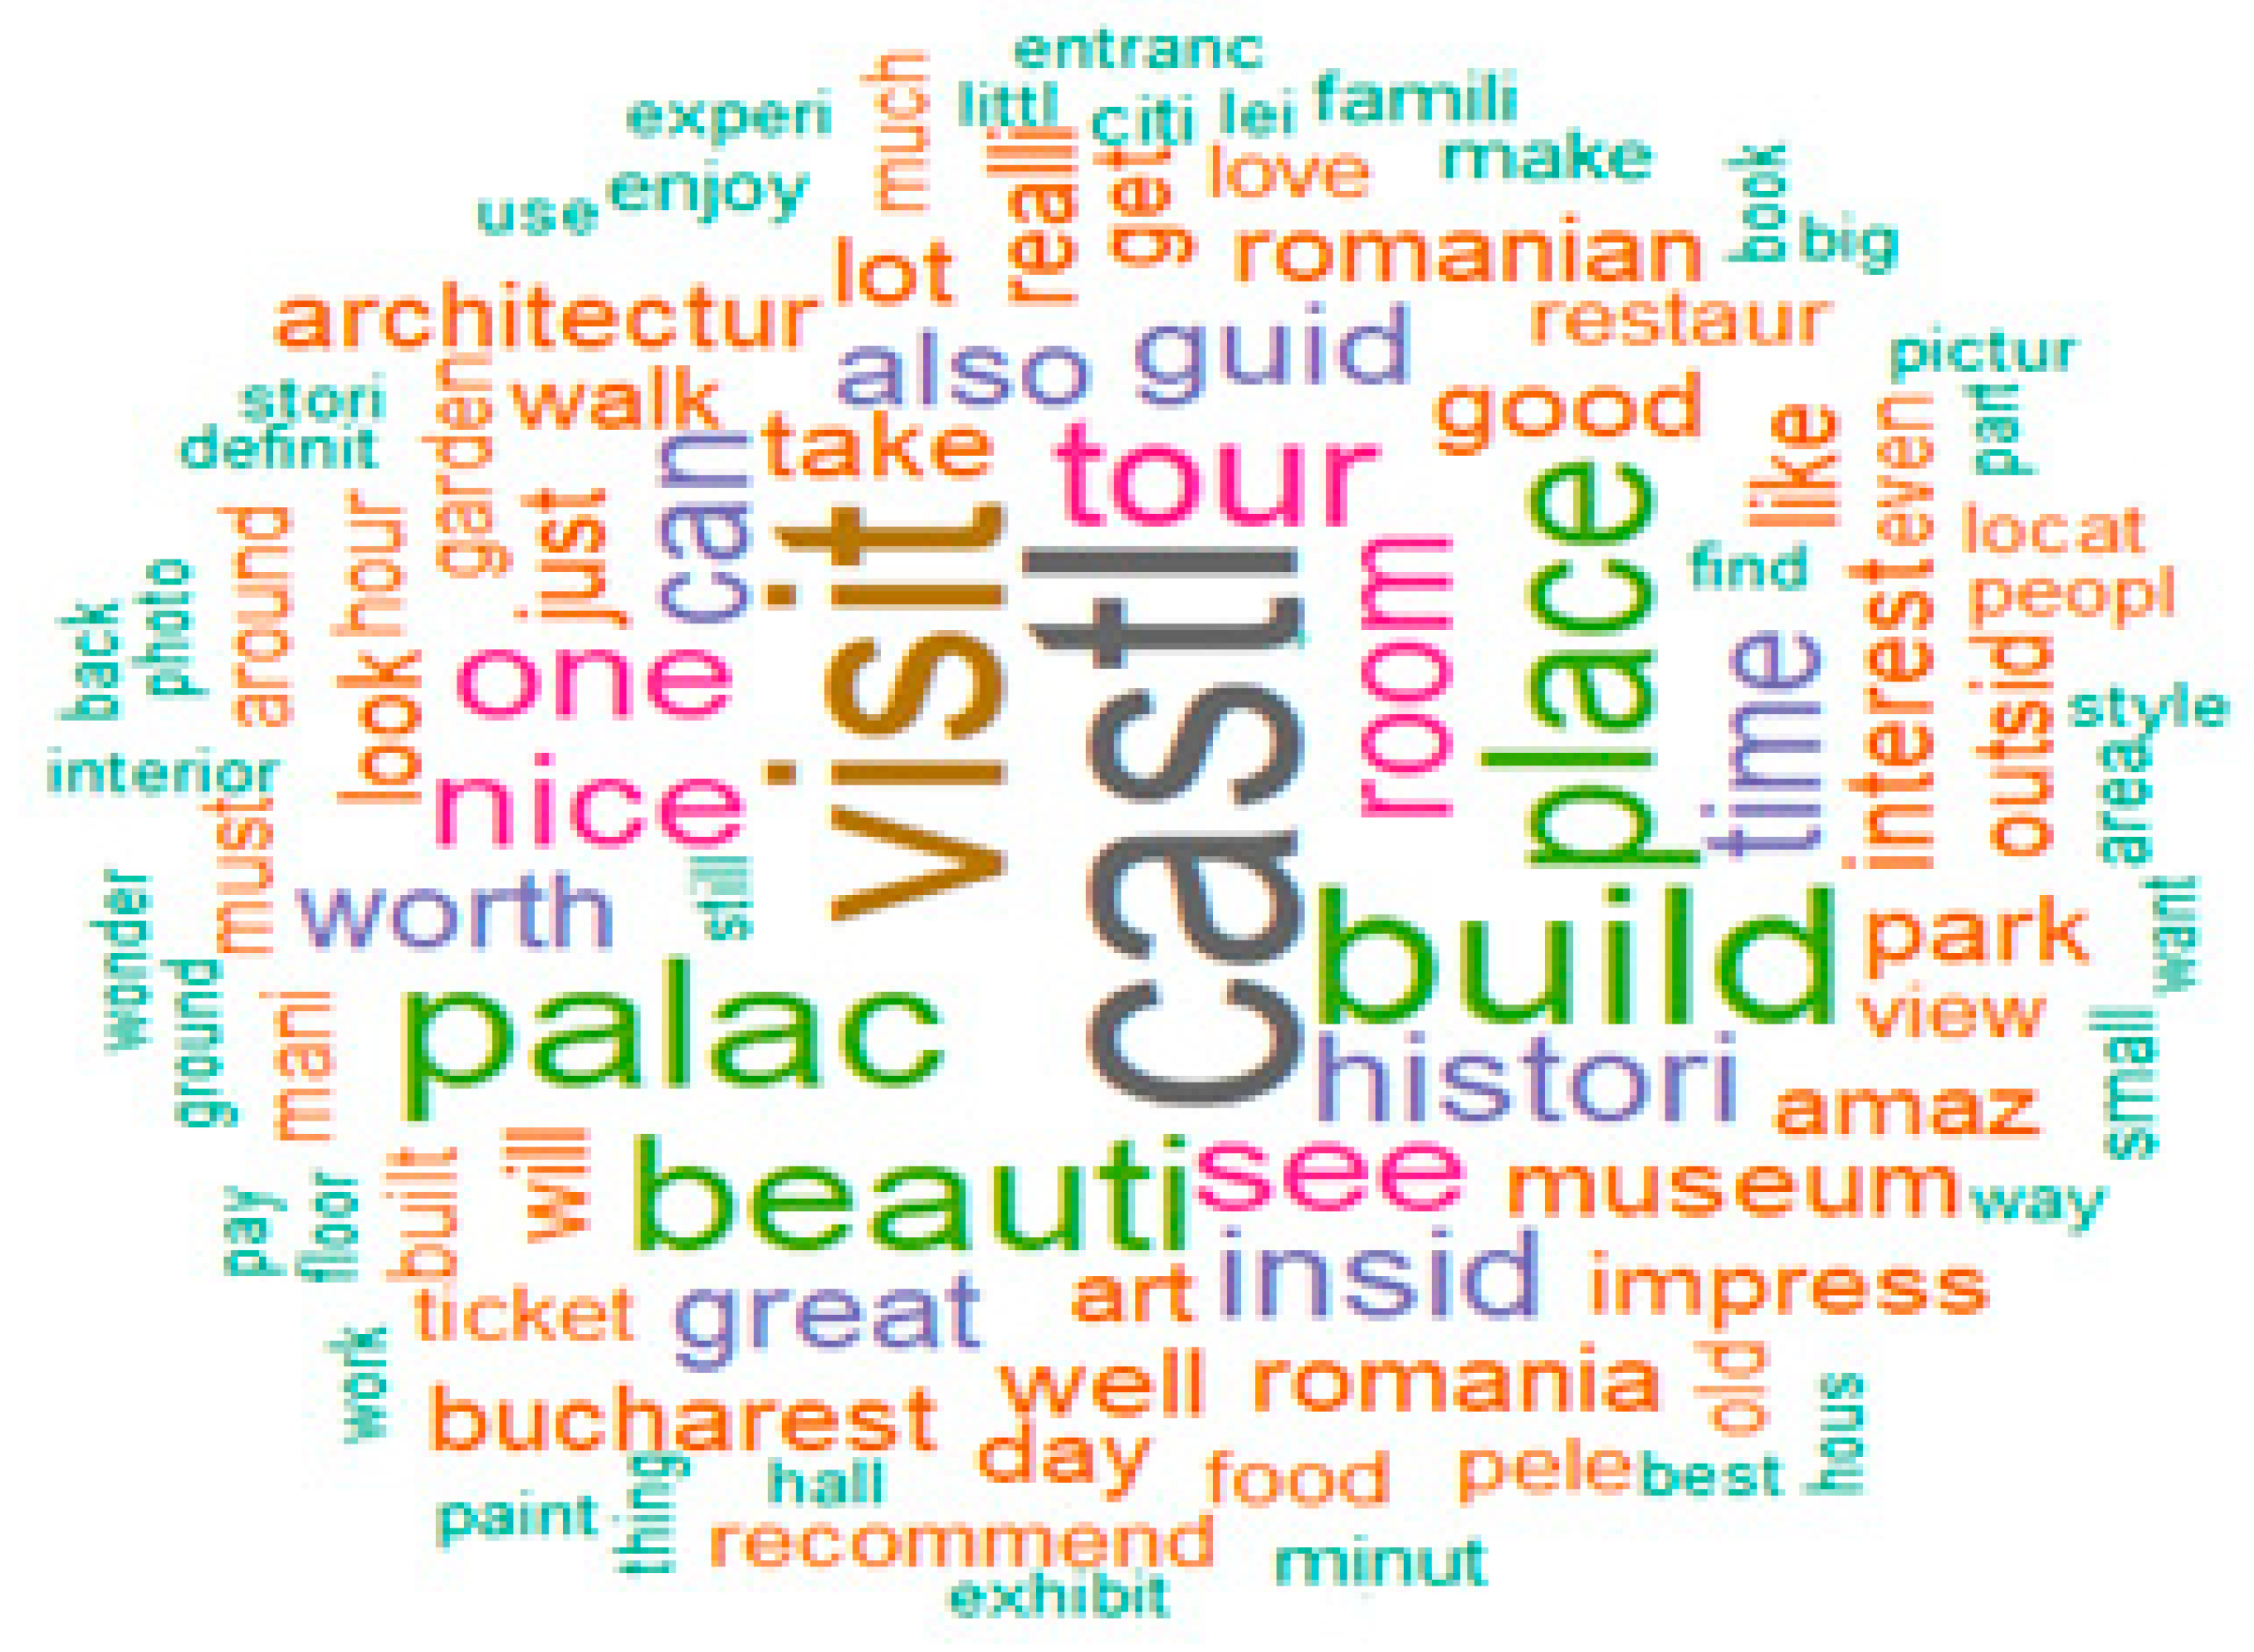
The keywords extracted from visitors’ comments (
Figure 7) are presented in a word cloud (displaying up to 100 words). The occurrence frequency (equal to or exceeding a value of five) within the text is indicated by the word size. The most prevalent words are “castl(es)”, “palac(es)”, “visit(ing/s)”, “beauti(ful)”, “nice”, “worth”, “histori(es)”, and “great”. The results offer a picture of the predominant themes discussed, confirming Hypothesis 2.
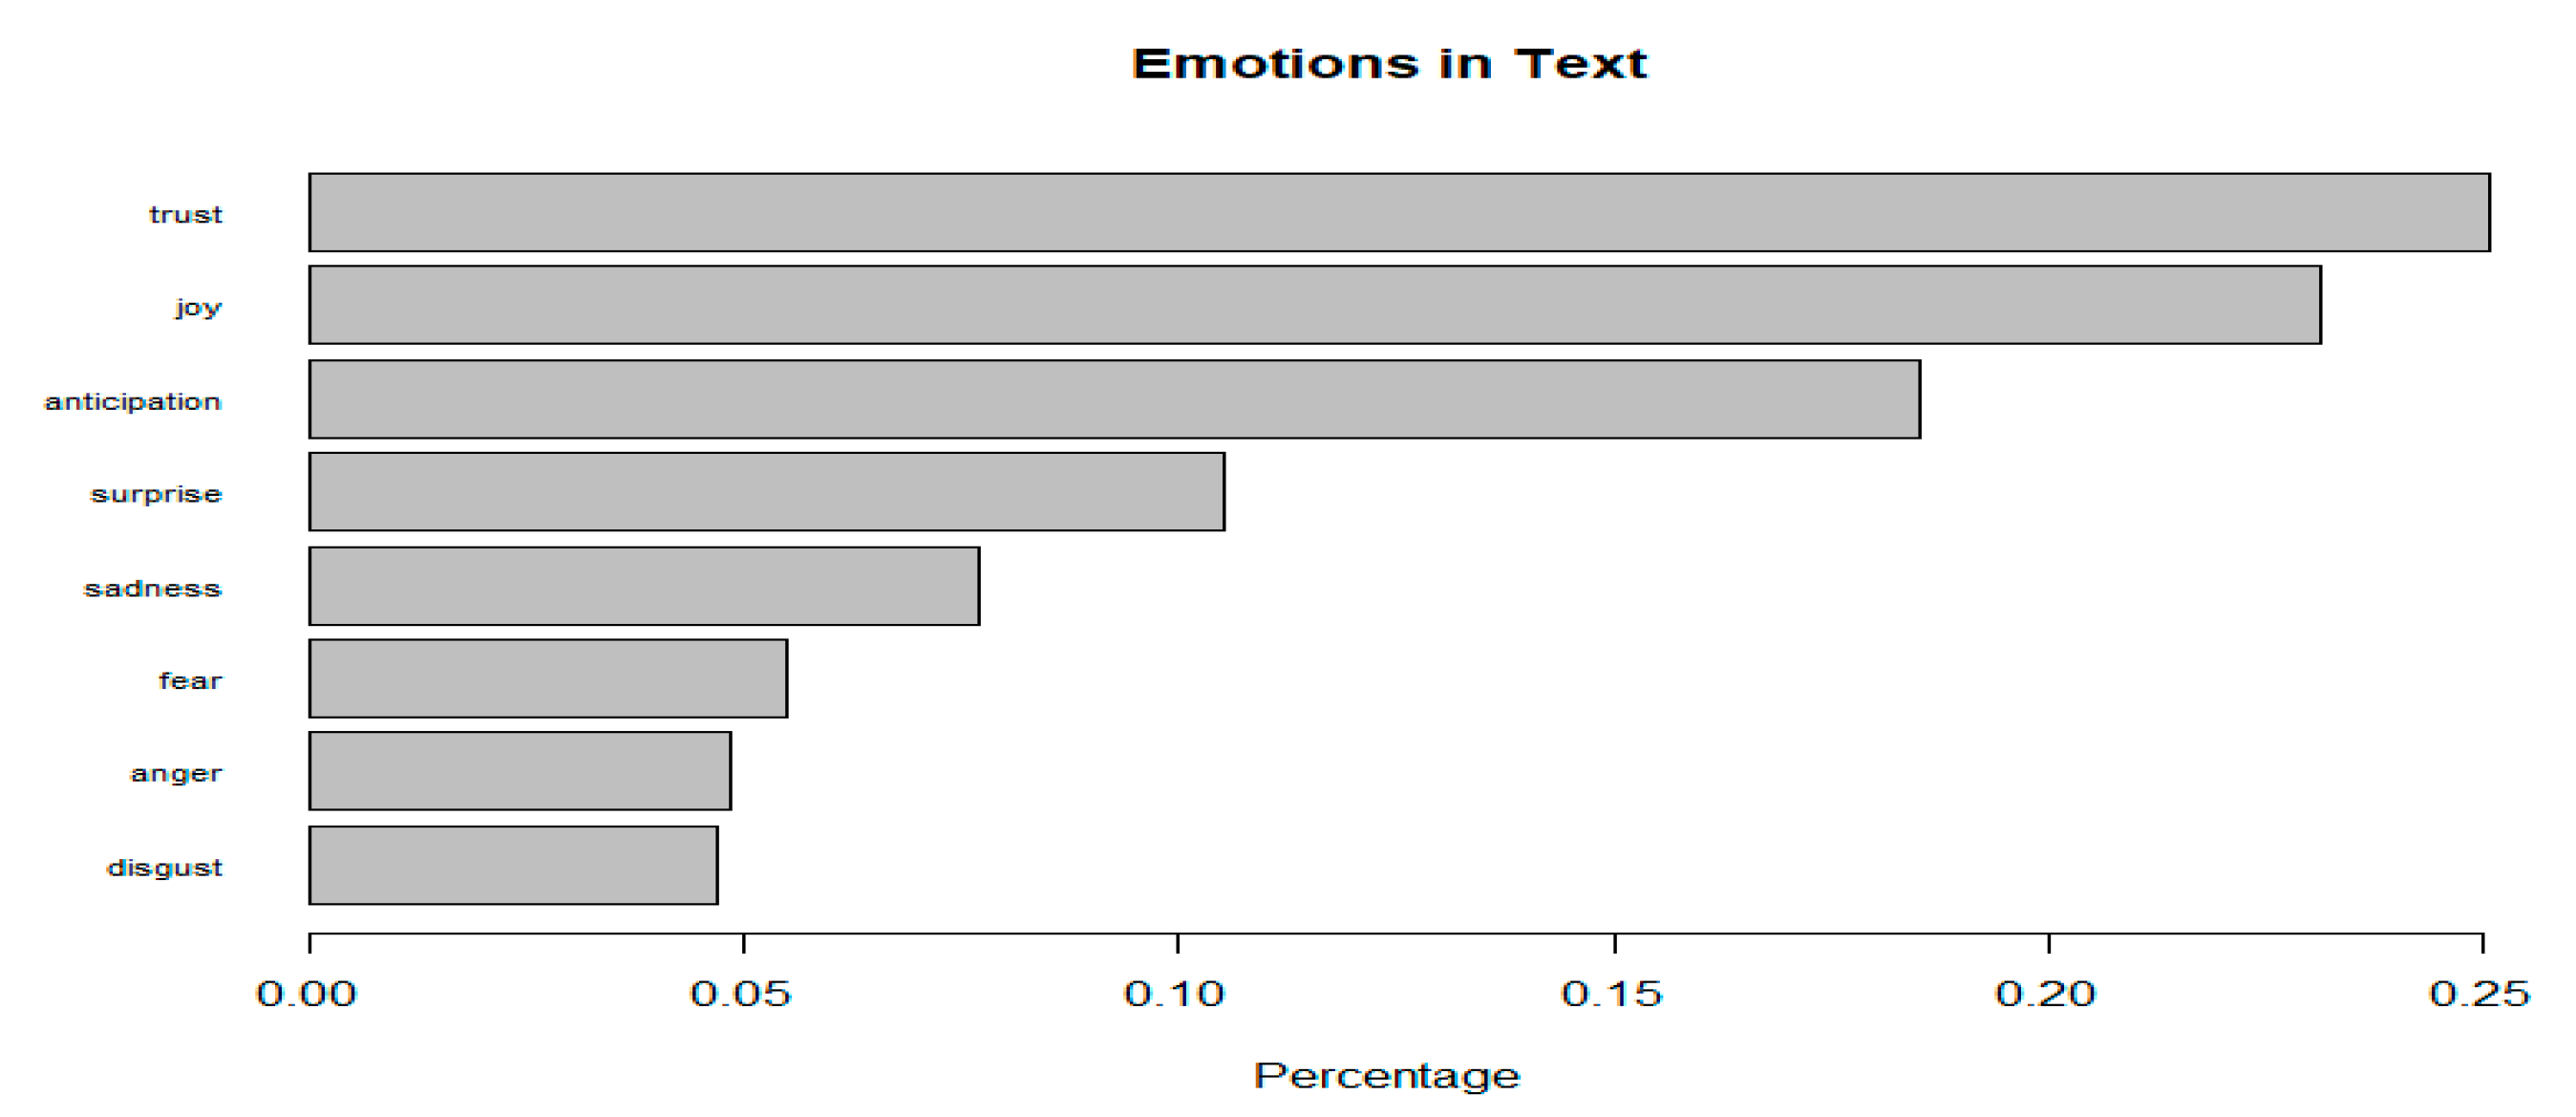
Anger, fear, anticipation, trust, surprise, sadness, joy, and disgust are the emotions connected to the comments. The analysis also considers positive and negative sentiments.
When analyzing the proportions of individual emotions (
Figure 8), the findings indicate that the emotion “trust” accounts for the most significant portion, comprising approximately 25.2% of all the meaningful words within the text. On the other hand, “disgust” and “anger” have the lowest shares. In each case, the words related to these emotions represent less than 5%. This result confirms Hypothesis 3.
The evaluation method considering the quality, quantity, and age of individual travelers’ ratings and reviews is the TripAdvisor bubble rating. A single bubble means “terrible”, and five bubbles mean “excellent” (
Figure 9). Based on the text reviews, 50 reviewers awarded one bubble, 40 awarded two bubbles, 155 awarded three bubbles, 392 awarded four bubbles, and 762 awarded five bubbles. These findings show that the opinions were primarily positive, with the vast majority rating the castles and palaces as five-bubble experiences. This result confirms Hypothesis 4.
Even if the visitors pointed out some negative aspects following their experiences, they were still left with a positive overall impression (
Table 2). According to the SA, 54.5% of visitors gave the attractions five bubbles, while 28% offered four bubbles. Anger emotions were expressed mainly by visitors who offered one bubble (7.3%), as they were unhappy with their experiences. Emotions of “disgust” were less present, and their highest percentages were encountered in two-bubble reviews (6.5%). Reviews with four bubbles had the most significant percentage of “sadness” emotions (8.1%). The highest number of ”joy” emotions were expressed in five-bubble reviews (1377). Visitors who provided five bubbles in their reviews also expressed the highest number of “trust” emotions (1483 representing 29.1% of the total expressed emotions). “Surprise” emotions represented around 10% in two- to five-bubble reviews and just 8% in one-bubble reviews. ”Anticipation” emotions were mostly present in four- and five-bubble reviews. The largest ratio of ”positive” emotions (87.4%) was found in two-bubble reviews, which surprised us because we expected them to be more prevalent in four- and four-bubble evaluations. Even so, the total positive sentiments in five-bubble reviews were 3379, 16 times more than in one-bubble reviews. The bubble ratings corresponded to the SA generated from the reviews.
5.2. Cluster Analysis
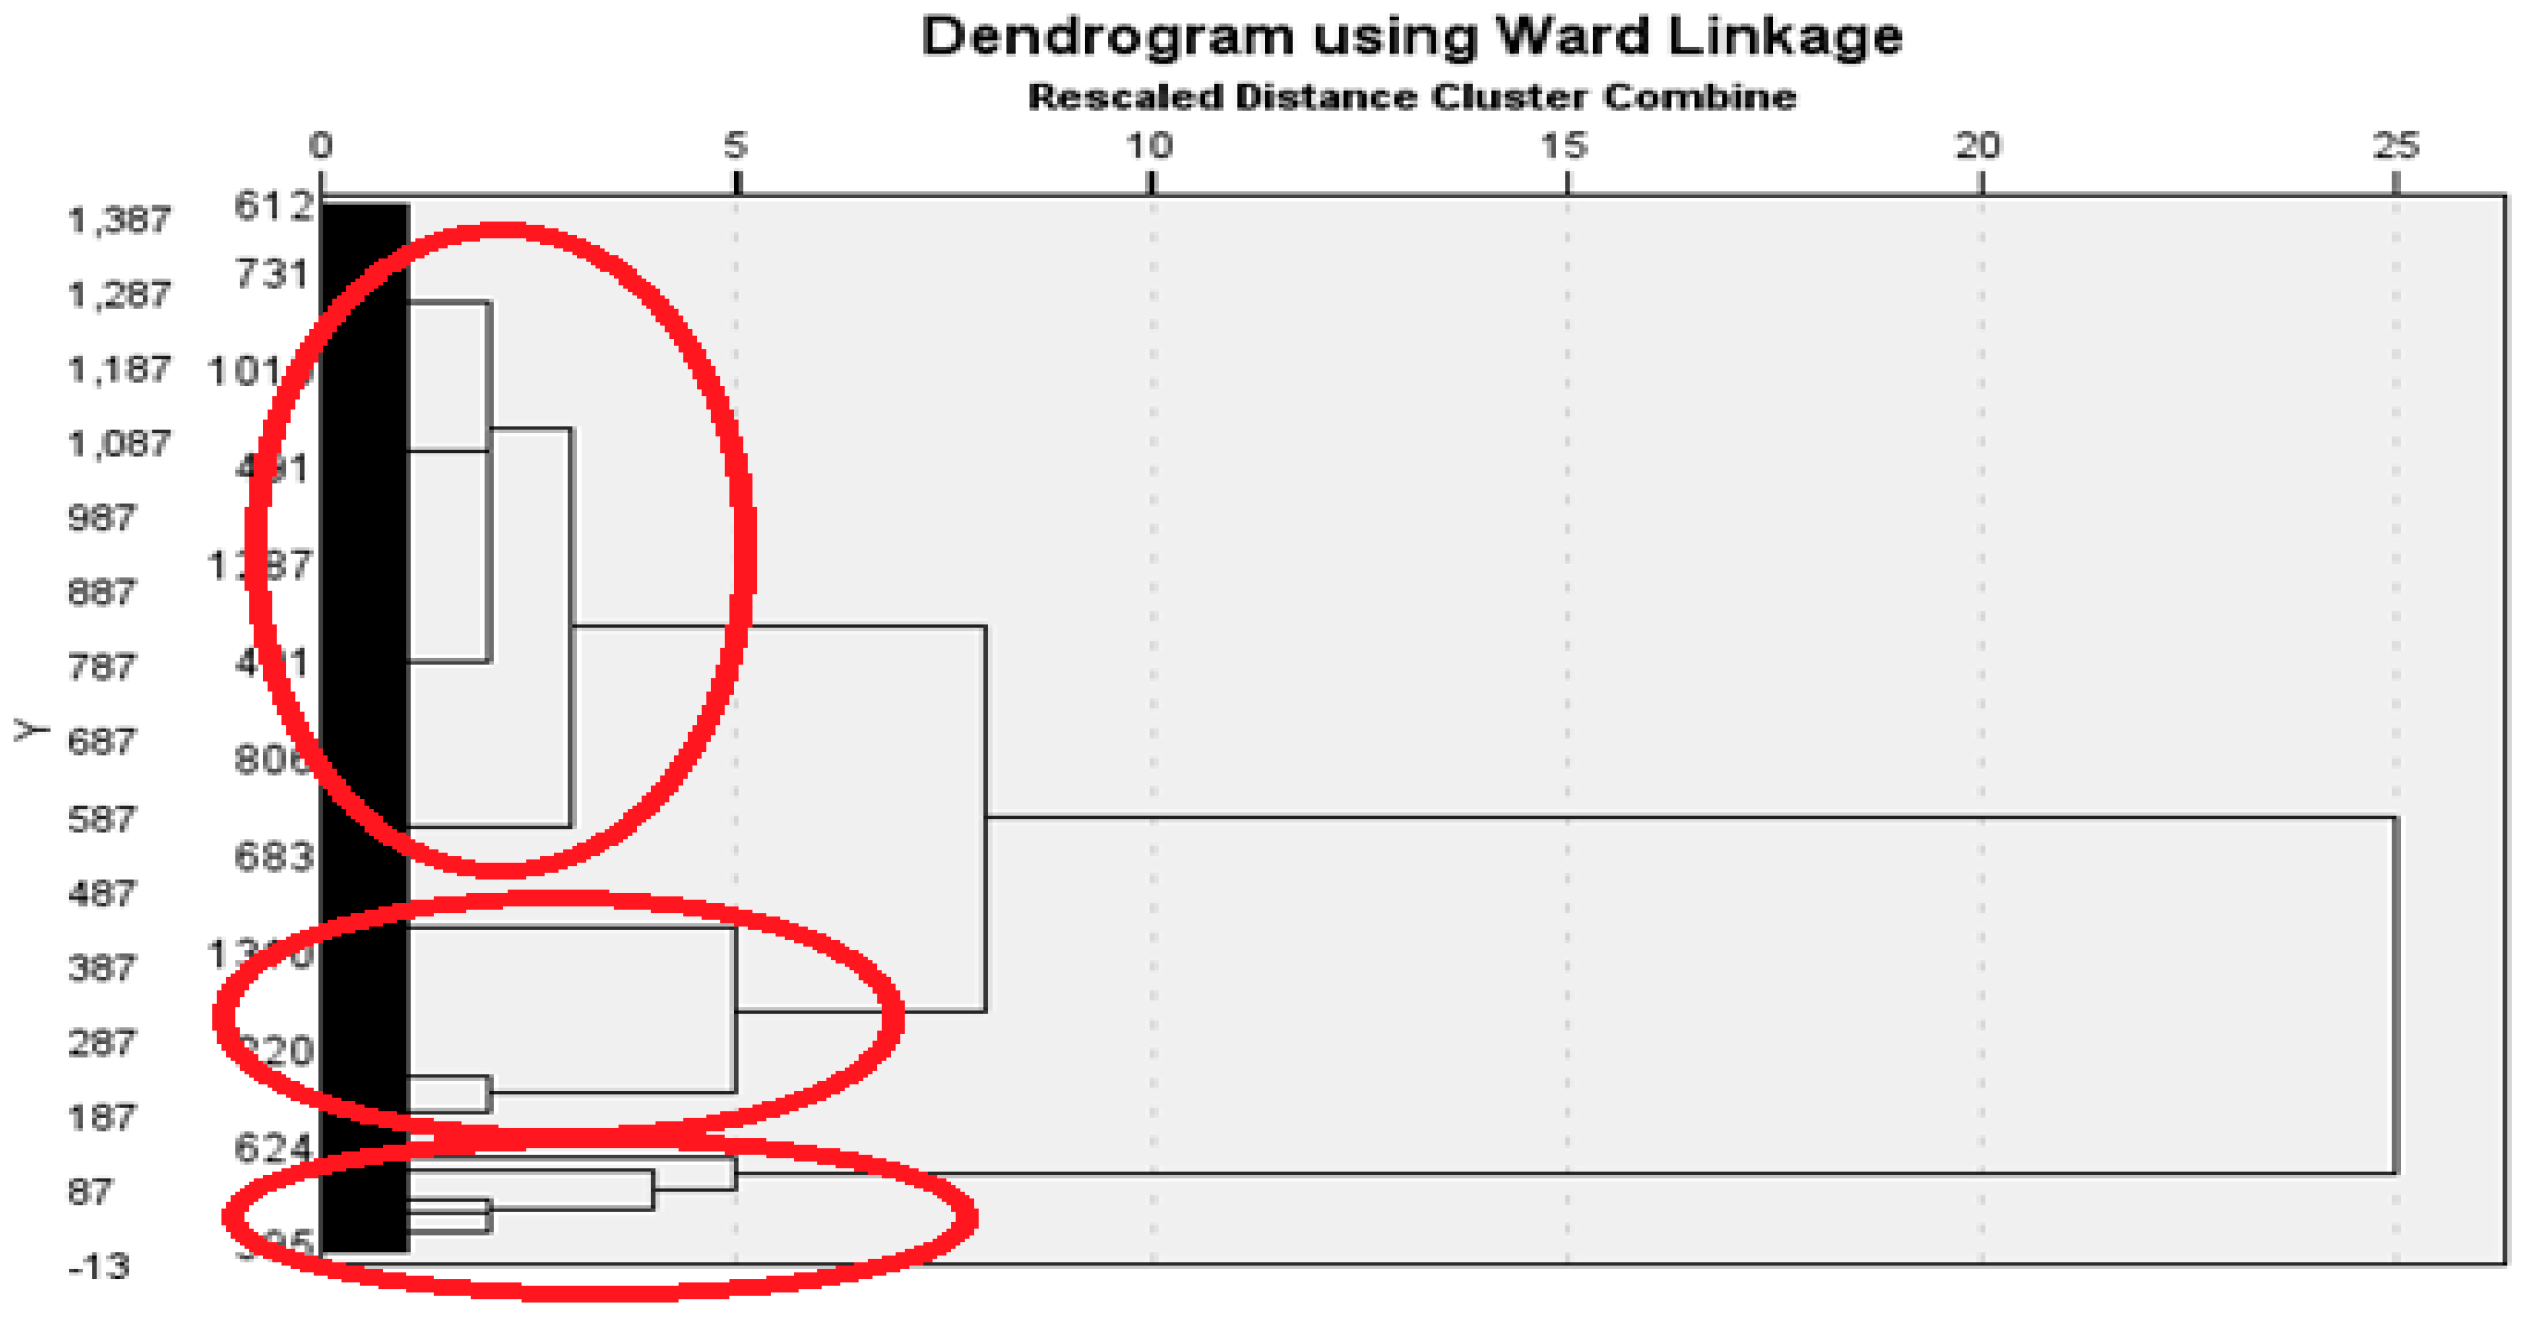
We counted the number of significant clusters in the data using the generated dendrogram.
Figure 10 shows the dendrogram produced by the SPSS differences. The dendrogram analysis revealed three significant clusters with relatively homogeneous groups of variables. This result confirms Hypothesis 5.
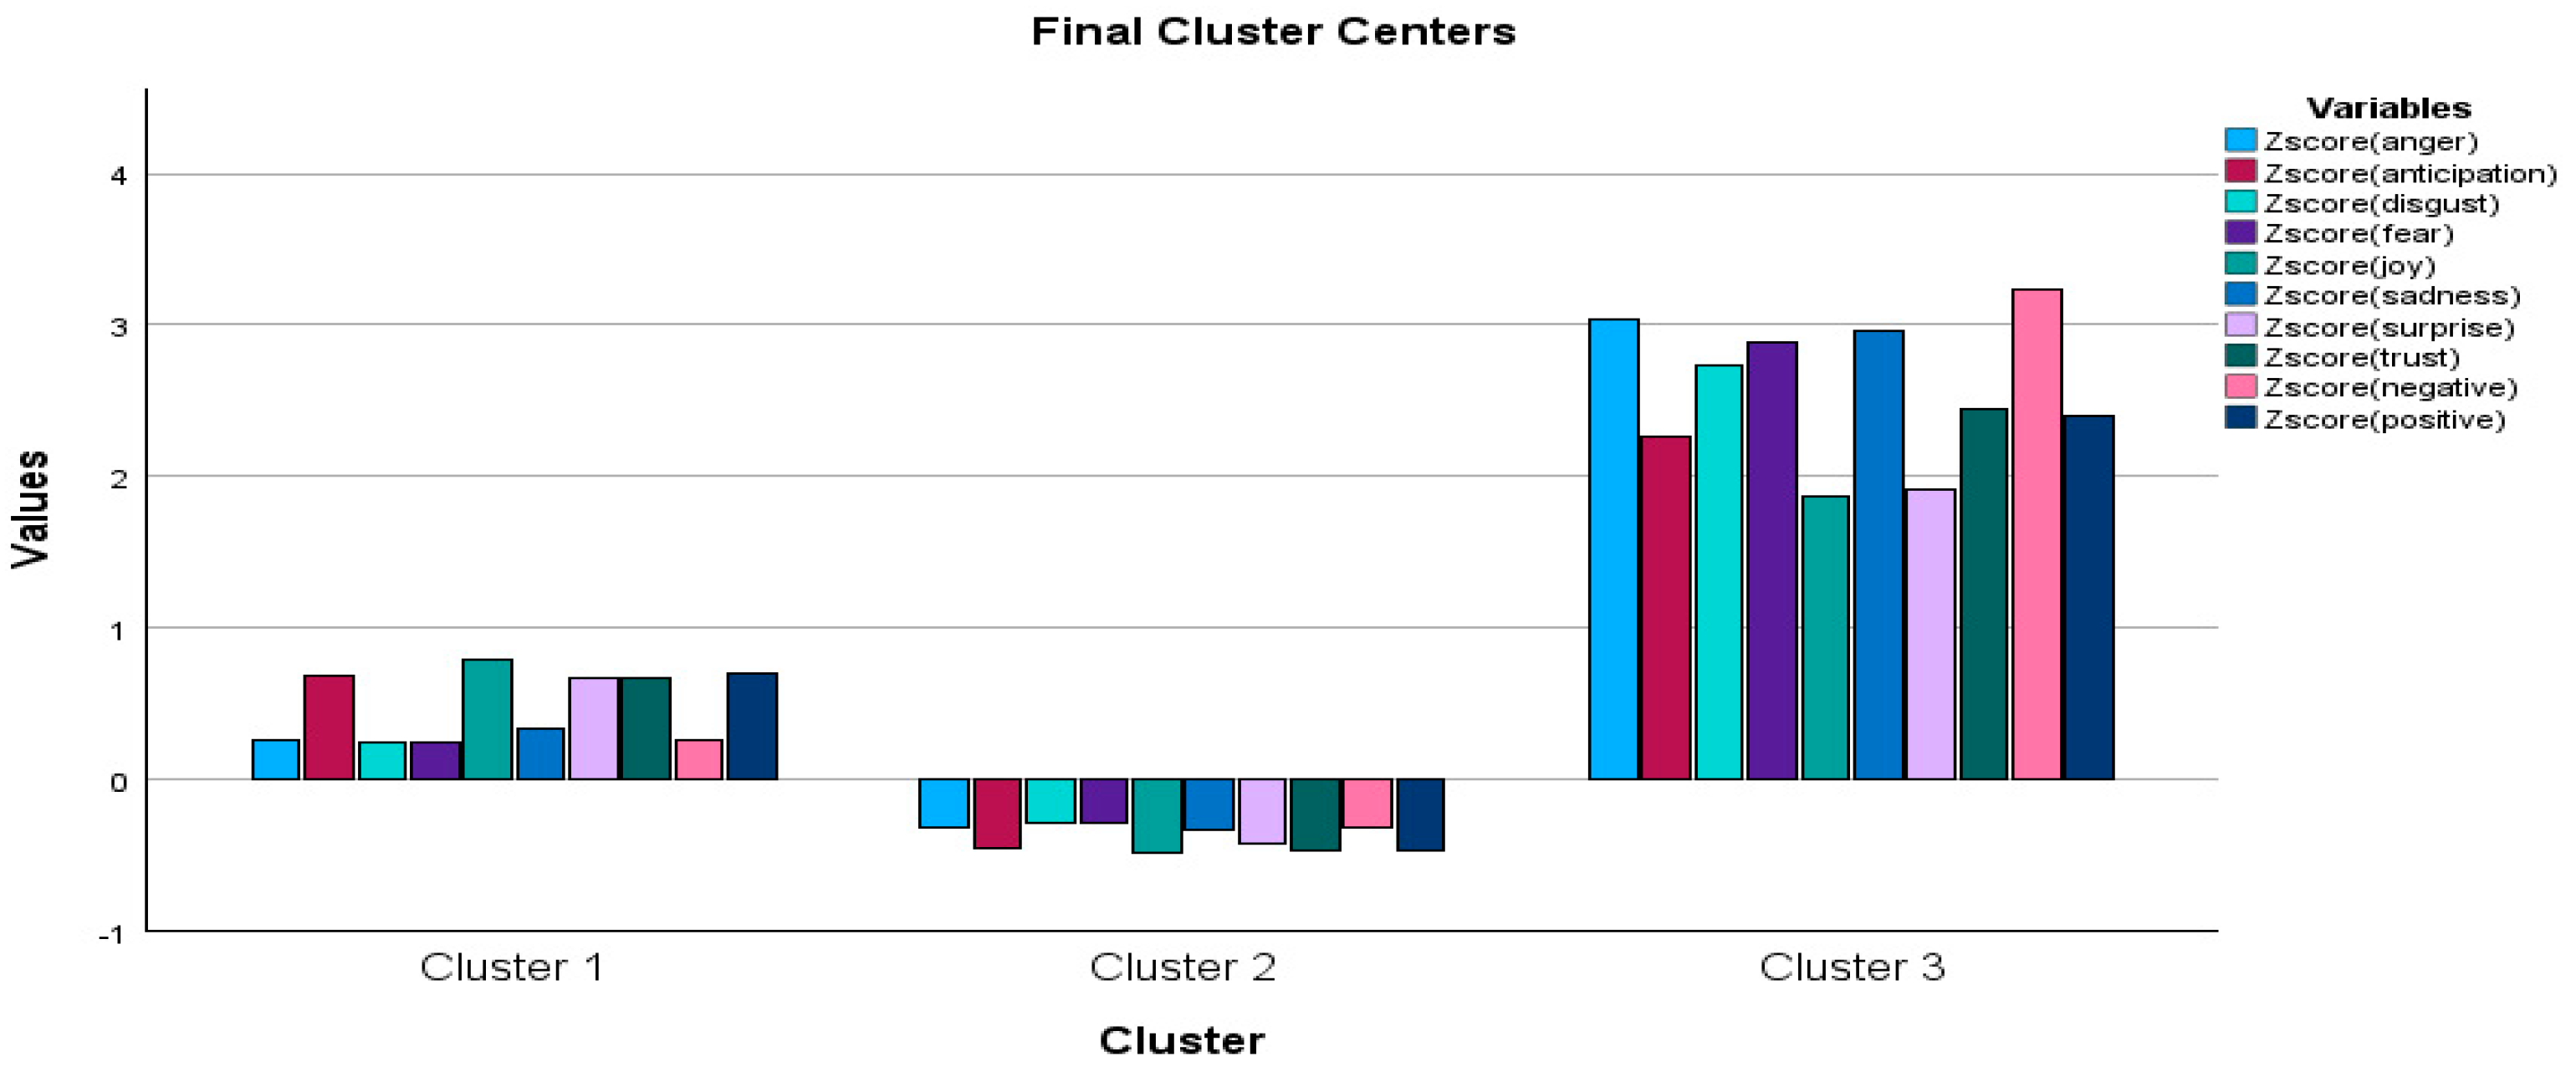
Secondly, we performed a K-means cluster analysis. According to the previous dendrogram, we specified the number of clusters to be three. In an analysis, it is essential to deal with the Z-scores of variables if they have different levels of variability. Otherwise, clustering will be dominated by factors with higher variability. The standardized values are displayed in
Table 3. The generated Z-score variables were used for clustering.
The current iteration of the K-means cluster analysis was 24. The minimum distance between initial centers was 17.967. The number of cases in each cluster was as follows: Cluster 1—425; Cluster 2—917; Cluster 3—57.
In Cluster 1, we have one set of data where the “joy”, “anticipation”, “surprise”, “trust”, and “positive” use scores are very high (0.66–0.78), but the “fear”, “disgust”, “anger”, and “negative” use scores are low. In the third cluster, which is also the smallest, the “anger”, “sadness”, “fear”, and “disgust” emotions and “negative” sentiments have the highest use scores (2.74–3.23). The most significant cluster, Cluster 2, is also dominated by positive sentiments and emotions such as trust, joy, anticipation, and surprise.
An ANOVA analysis (
Table 4) shows the impact of the variables on the cluster solution. All the variables—“anger”, “anticipation”, “disgust”, “fear”, “joy”, “sadness”, “surprise”, and “trust” emotions—and both “positive” and “negative” sentiments, had a powerful impact on the clusters’ solution.
Figure 11 displays a graphical representation of the identified clusters.
Consequently, we might conclude that positive sentiments prevail in the reviews, and most of the emotions expressed are joy, trust, surprise, and anticipation. Still, we cannot neglect Cluster 3. Even if they are outnumbered, the negative emotions of disgust, fear, anger, and sadness might spread on social media platforms and negatively influence the opinions of other online viewers.
5.3. Econometric Models
The outcomes of the regression analysis conducted within this section are offered through the EViews software (version 13). It operates under the assumption that a sentiment constitutes a more enduring and intricate process or attitude compared to an emotion. This examination aims to evaluate the influence of emotions on sentiments. The initial model examines the effects of emotions on positive sentiments, with the results presented in
Table 5.
The second model evaluates the influence on negative sentiments (
Table 6). Two emotions (anticipation and surprise) are included in both models.
The findings indicate that comments associated with every emotion hold statistical significance. Moreover, the outcomes emphasize the significance of “anticipation” and “surprise” as noteworthy emotions for both positive and negative sentiments. The results obtained from the econometric analysis confirm Hypothesis 6.
5.4. Focus Group and In-Depth Interviews
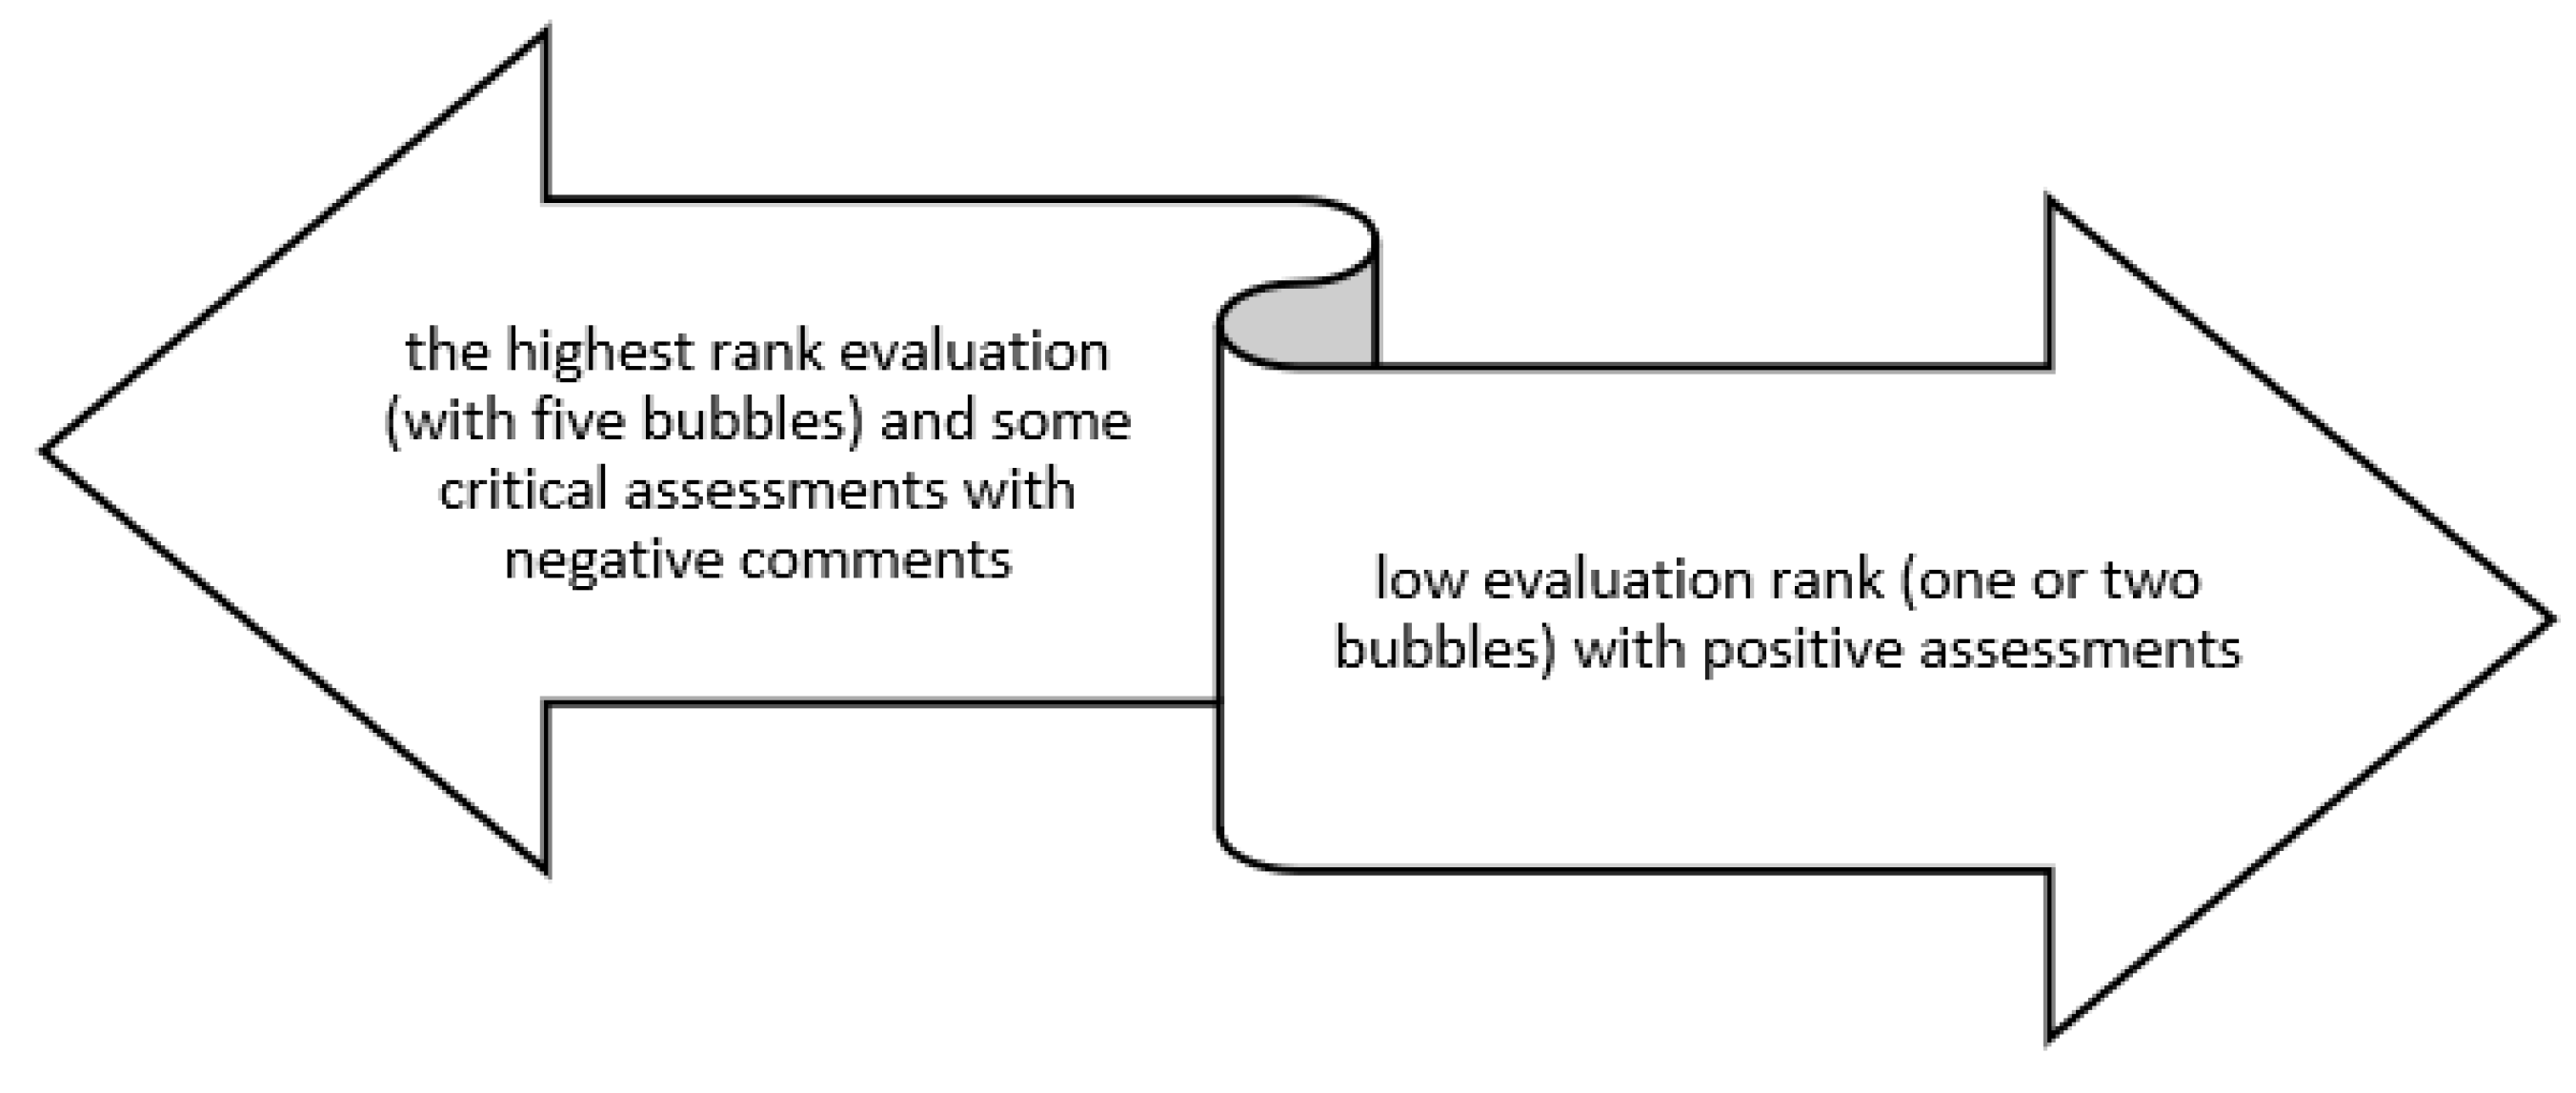
By analyzing the connection between bubble ratings and comments, we identified situations that could be considered superficial evaluations (
Figure 12).
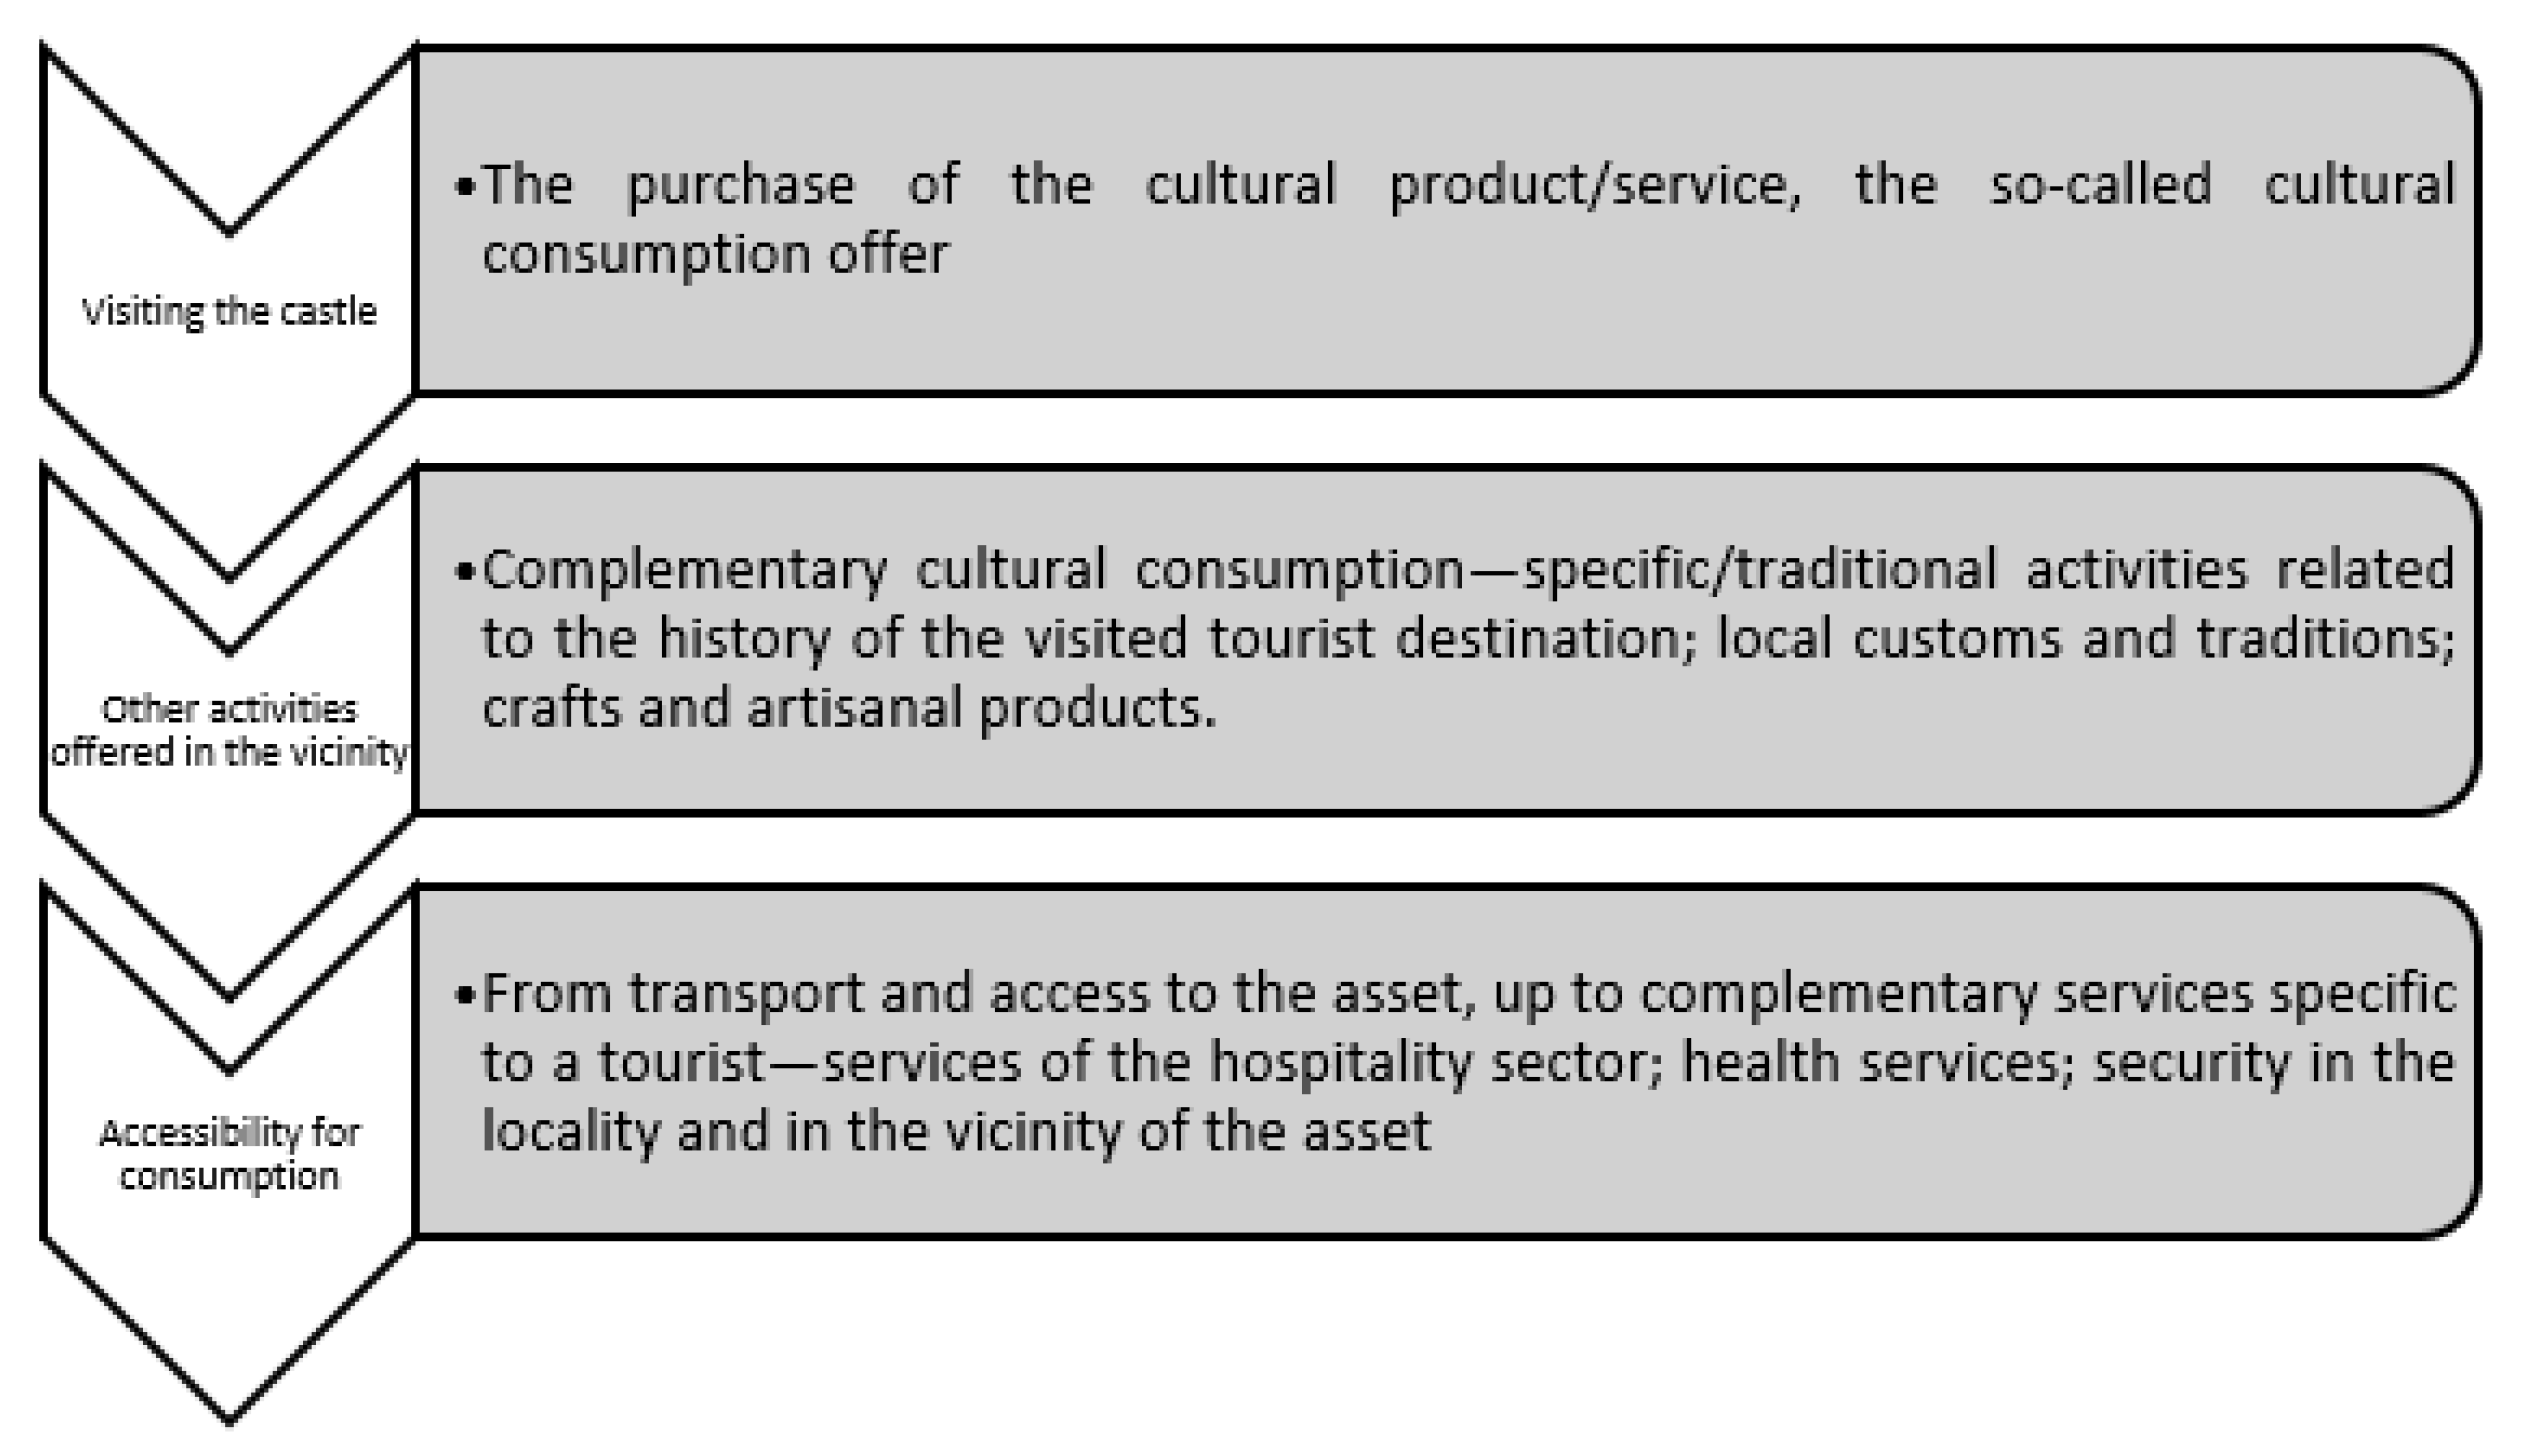
In this respect, it was necessary to deeply analyze not only those eight emotions detailed before but also to focus on the qualitative approach of the integrated cultural consumption service, which can generate satisfaction or not (
Figure 13).
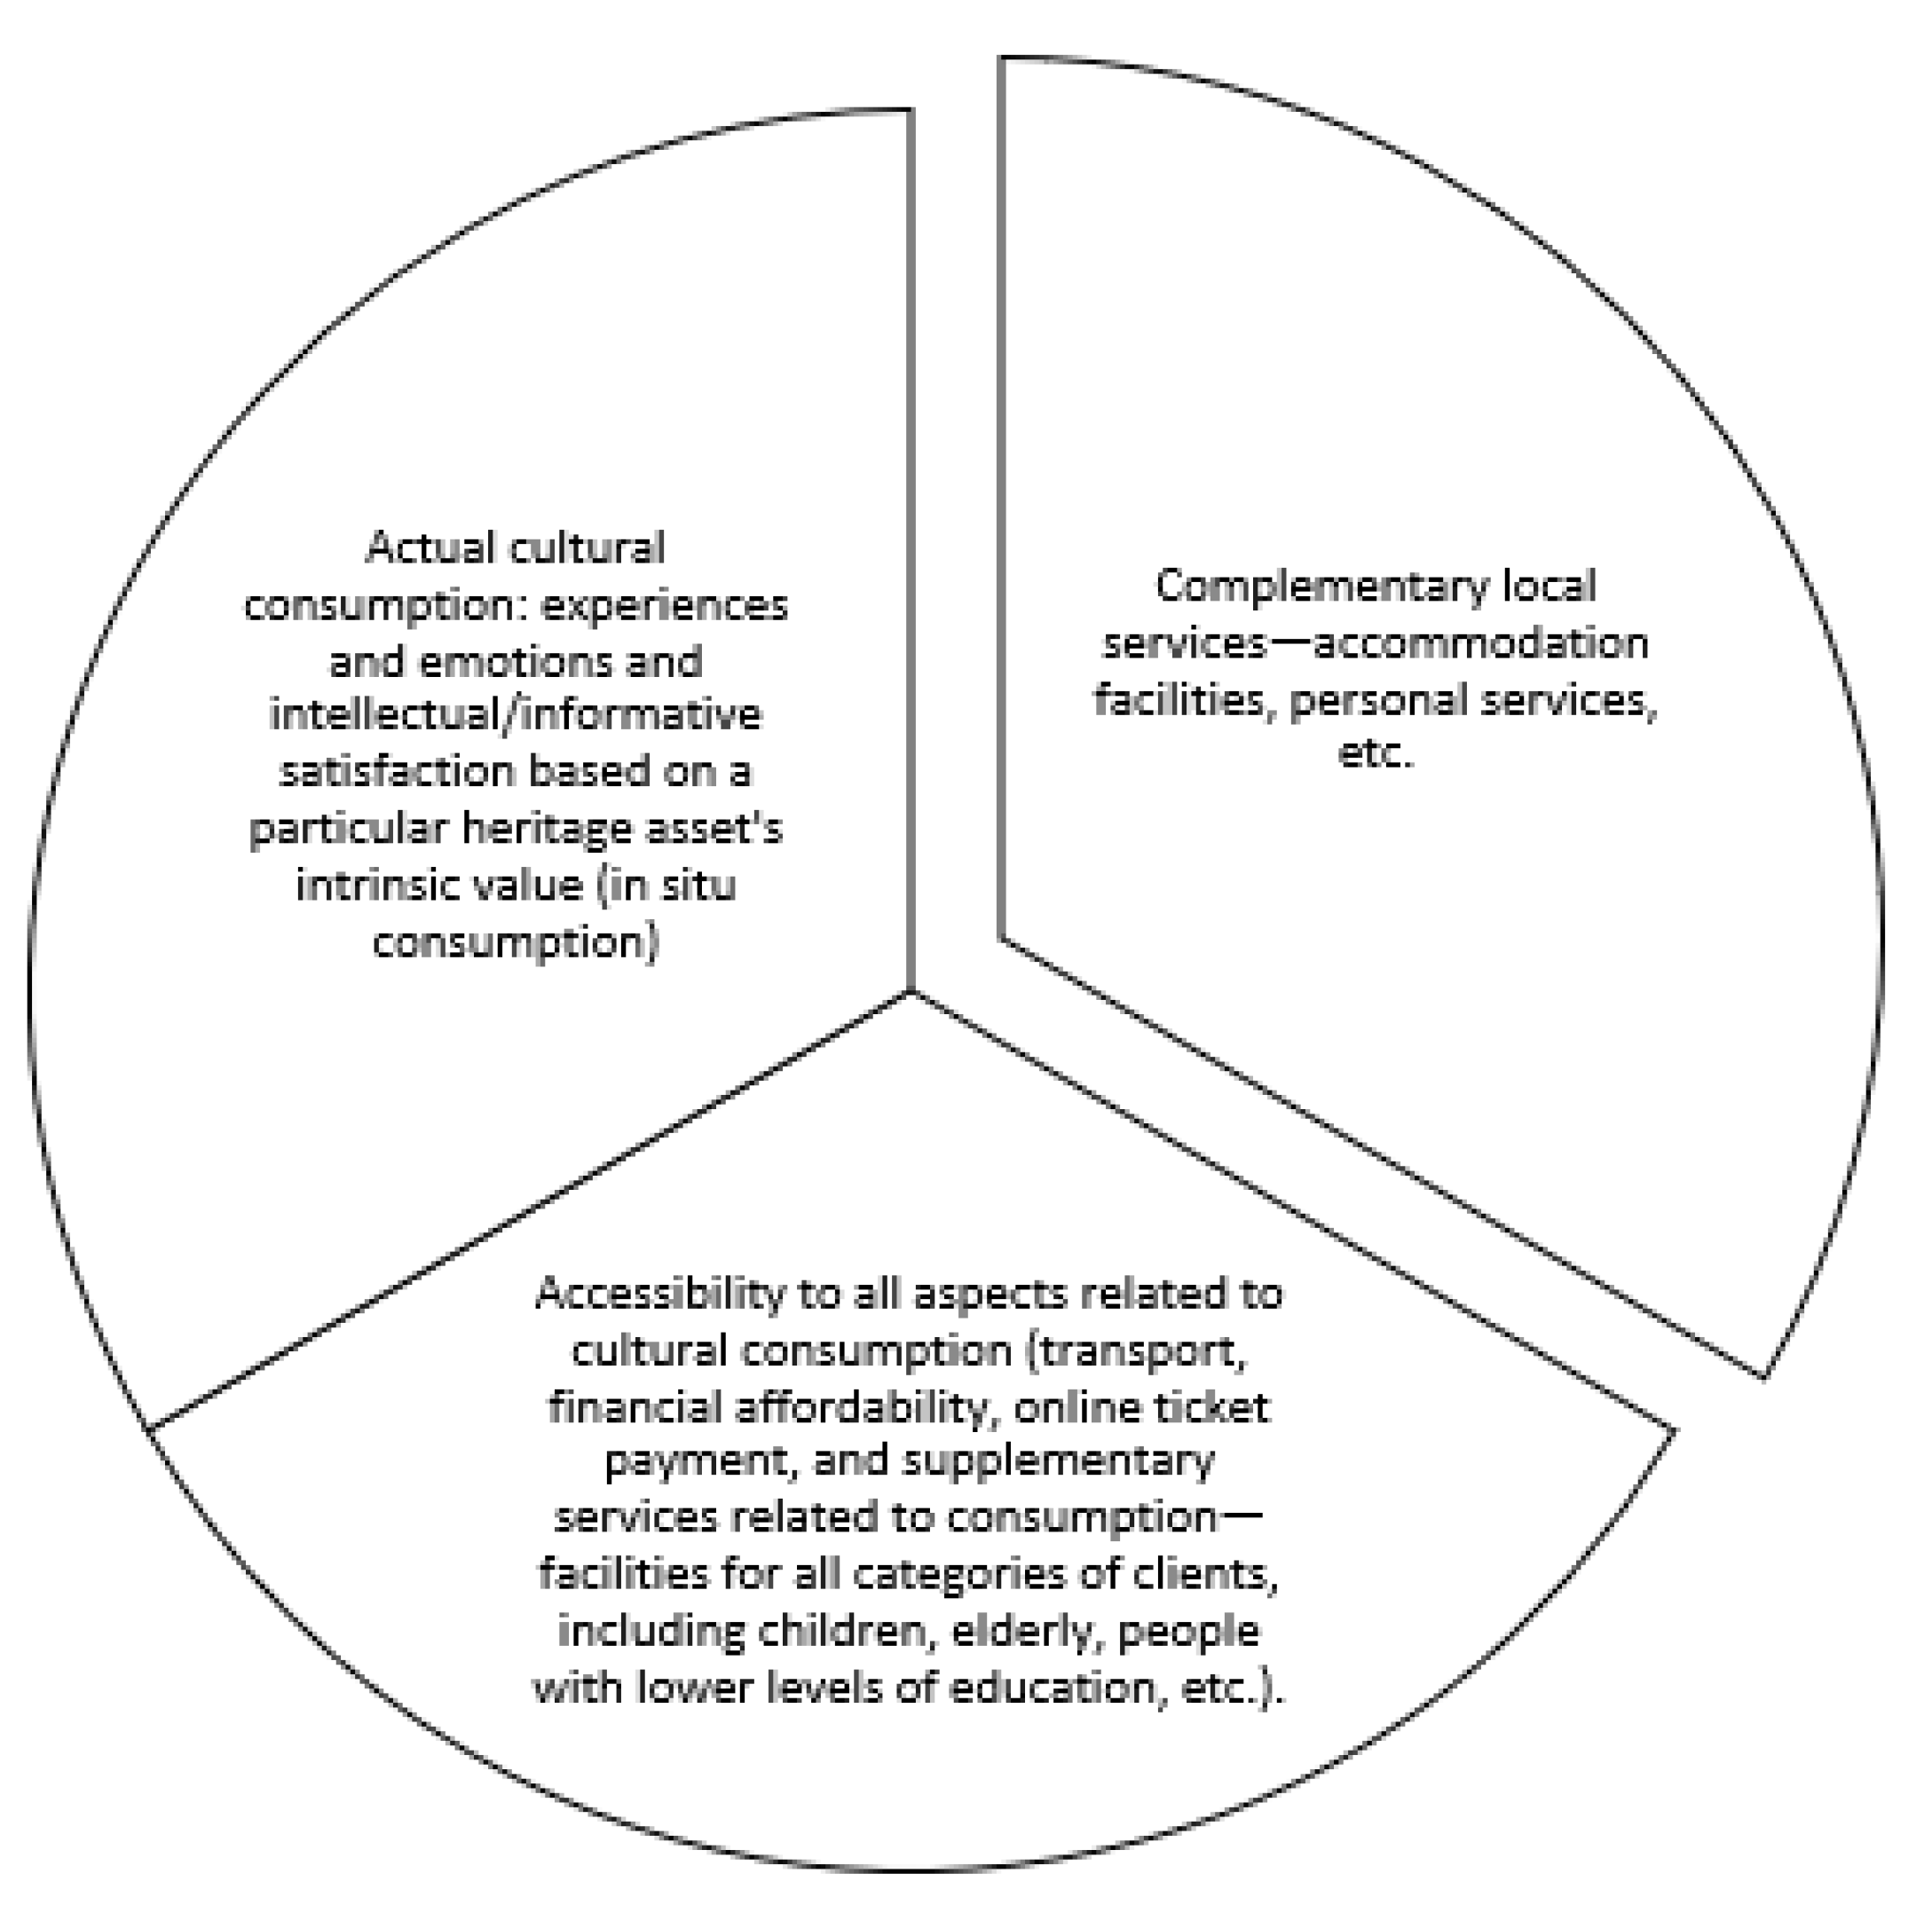
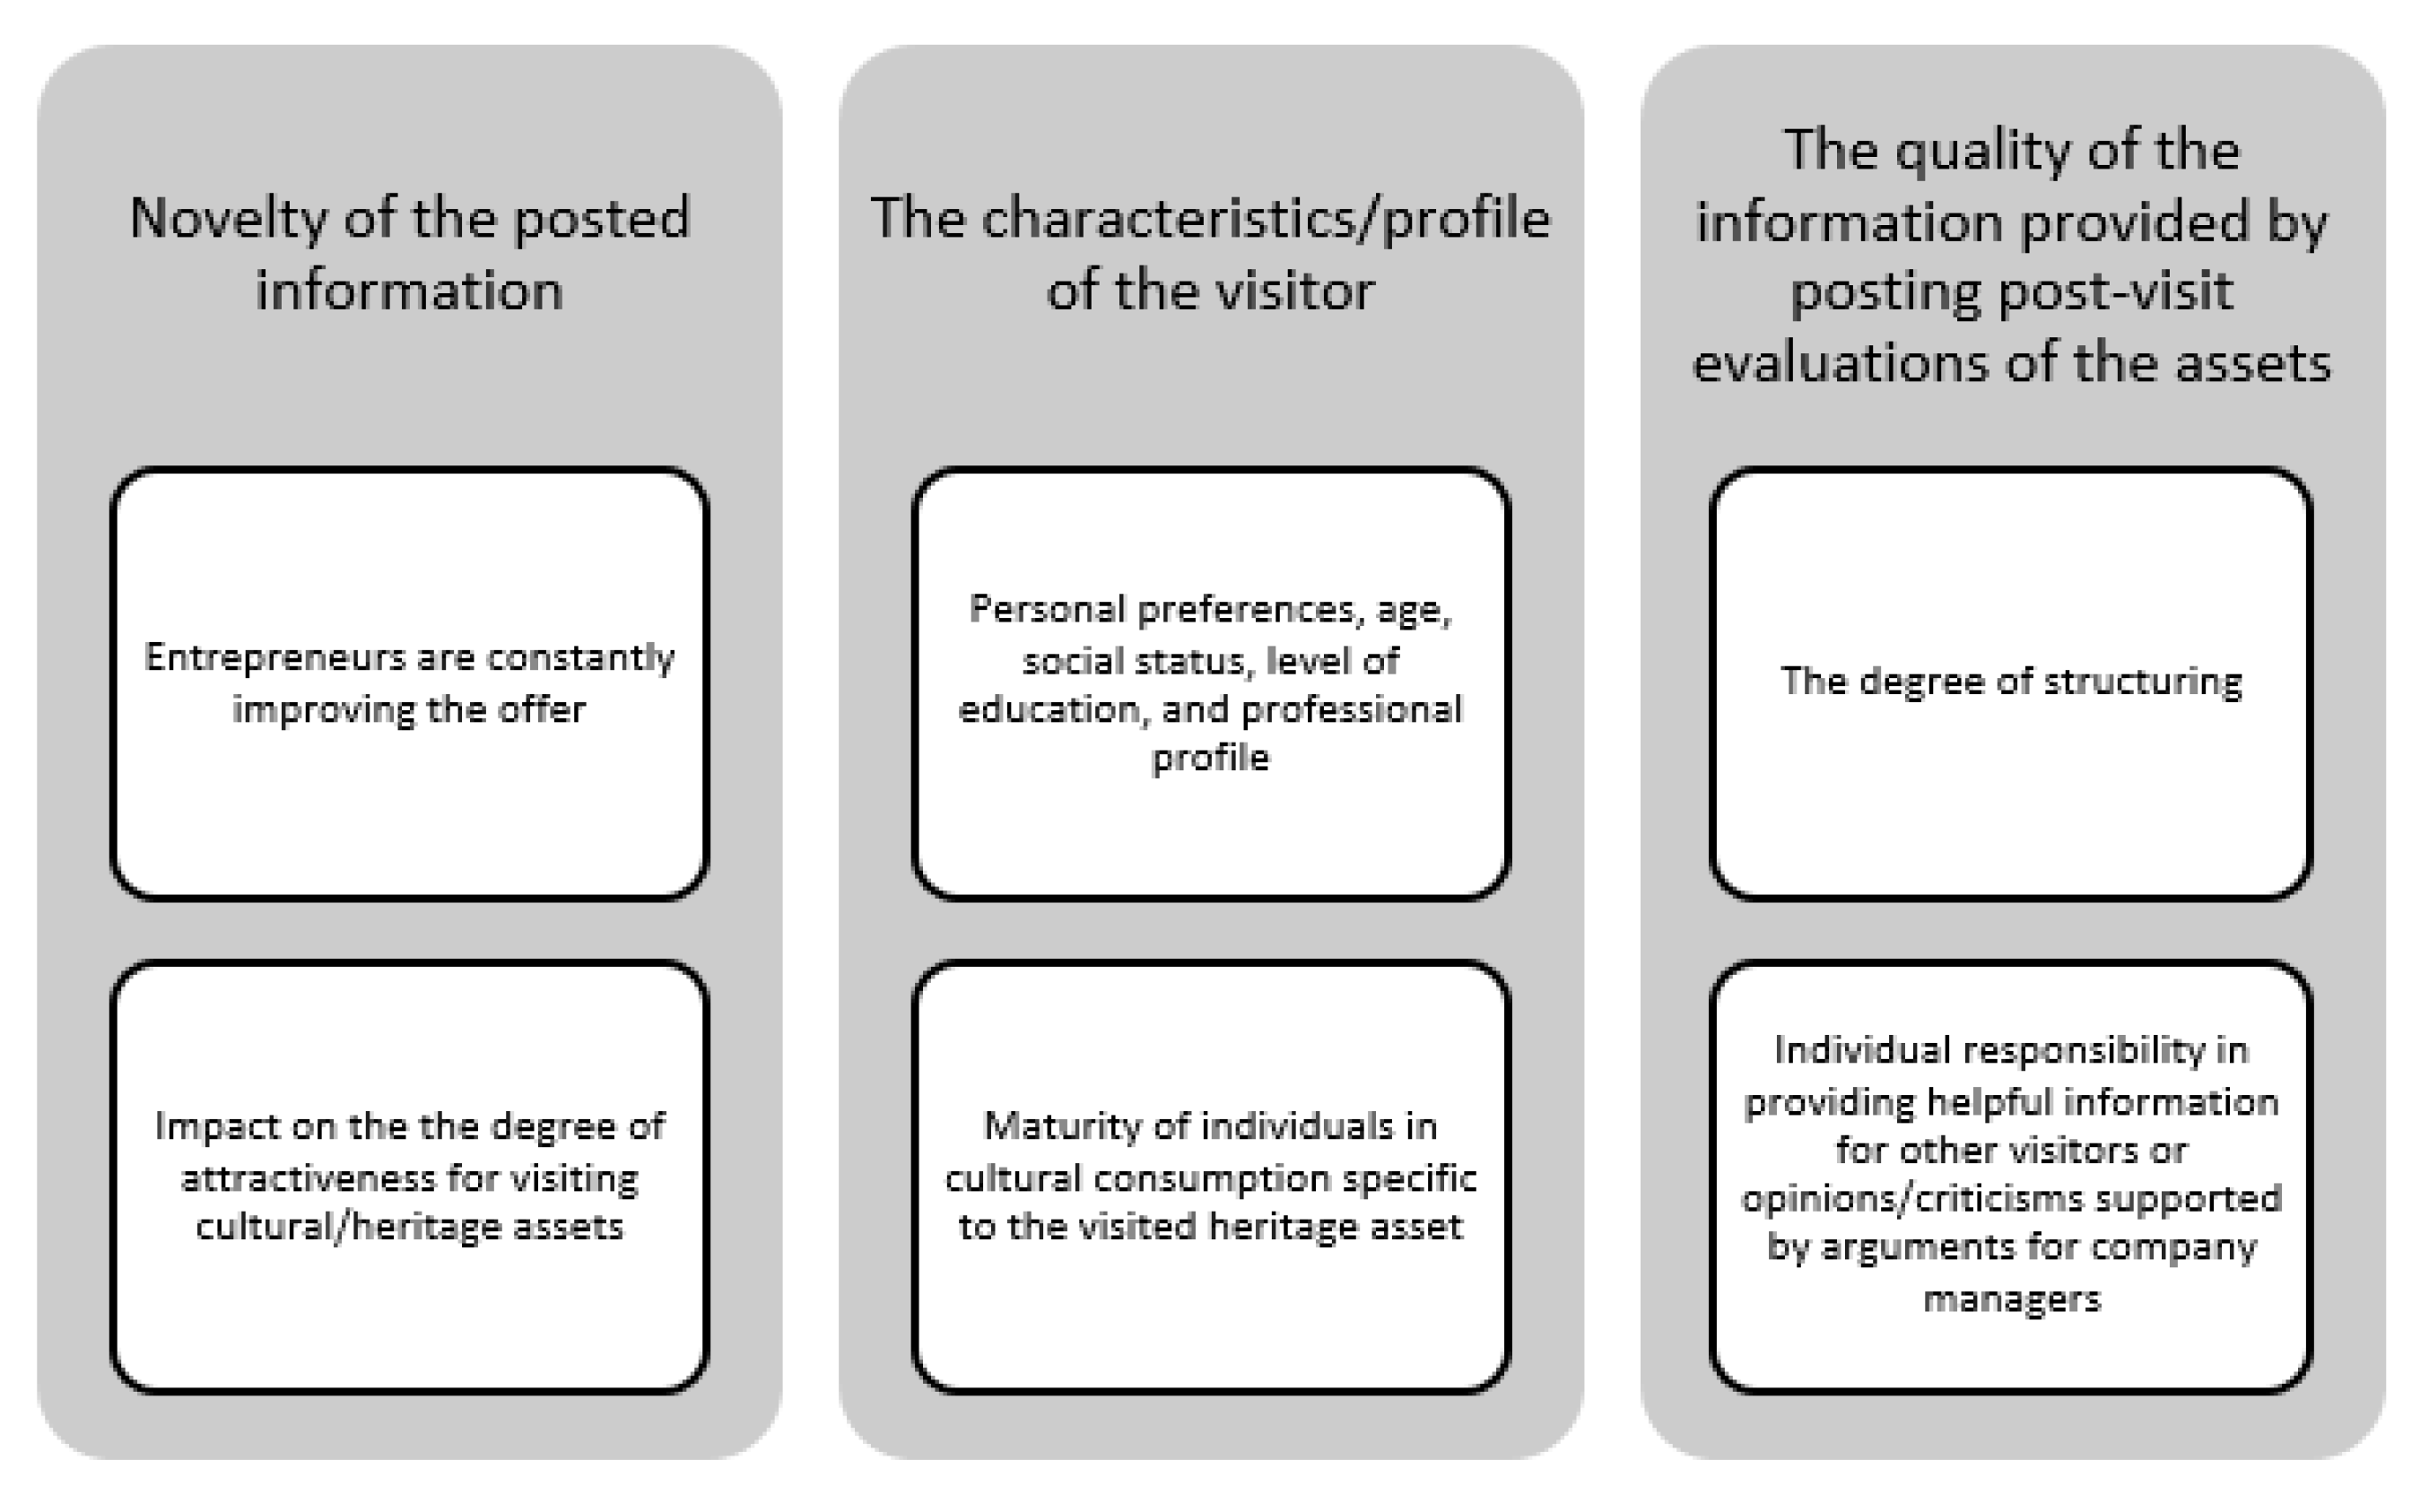
The accurate and detailed expression of sentiment should be a primary concern for managers in their strategic plans for cultural consumption model updates. If the information obtained through unstructured feedback, social networks, or a company’s websites is helpful for the modernization of the consumer offer, the lack of structured information on the consumer characteristics and components of the offer only allows for the development, to a small extent, of comparative advantages compared to similar cultural assets, as in the case of castles. The consumer’s decision to select one of the cultural assets (castles, for example) depends not only on personal preferences and the offer but also on the opinions collected on social media platforms from consumers who already visited the respective locations. At least three factors adjust the quality of the information provided by this last source of information (
Figure 14).
Starting from the previously presented SA and considering the limits of the analysis due to the different qualities and contents of the complimentary comments—with relatively low added value for the entrepreneur concerned with improving the offer—we continued the research with a qualitative analysis of a focus group of experts. Its purpose was to identify the information components provided by the consumer (after accessing the offer and visiting the tourist attraction), which is helpful for a manager. We had in mind the integrated perception of any consumer who pursues satisfaction via cultural service consumption in a broad sense (
Figure 15).
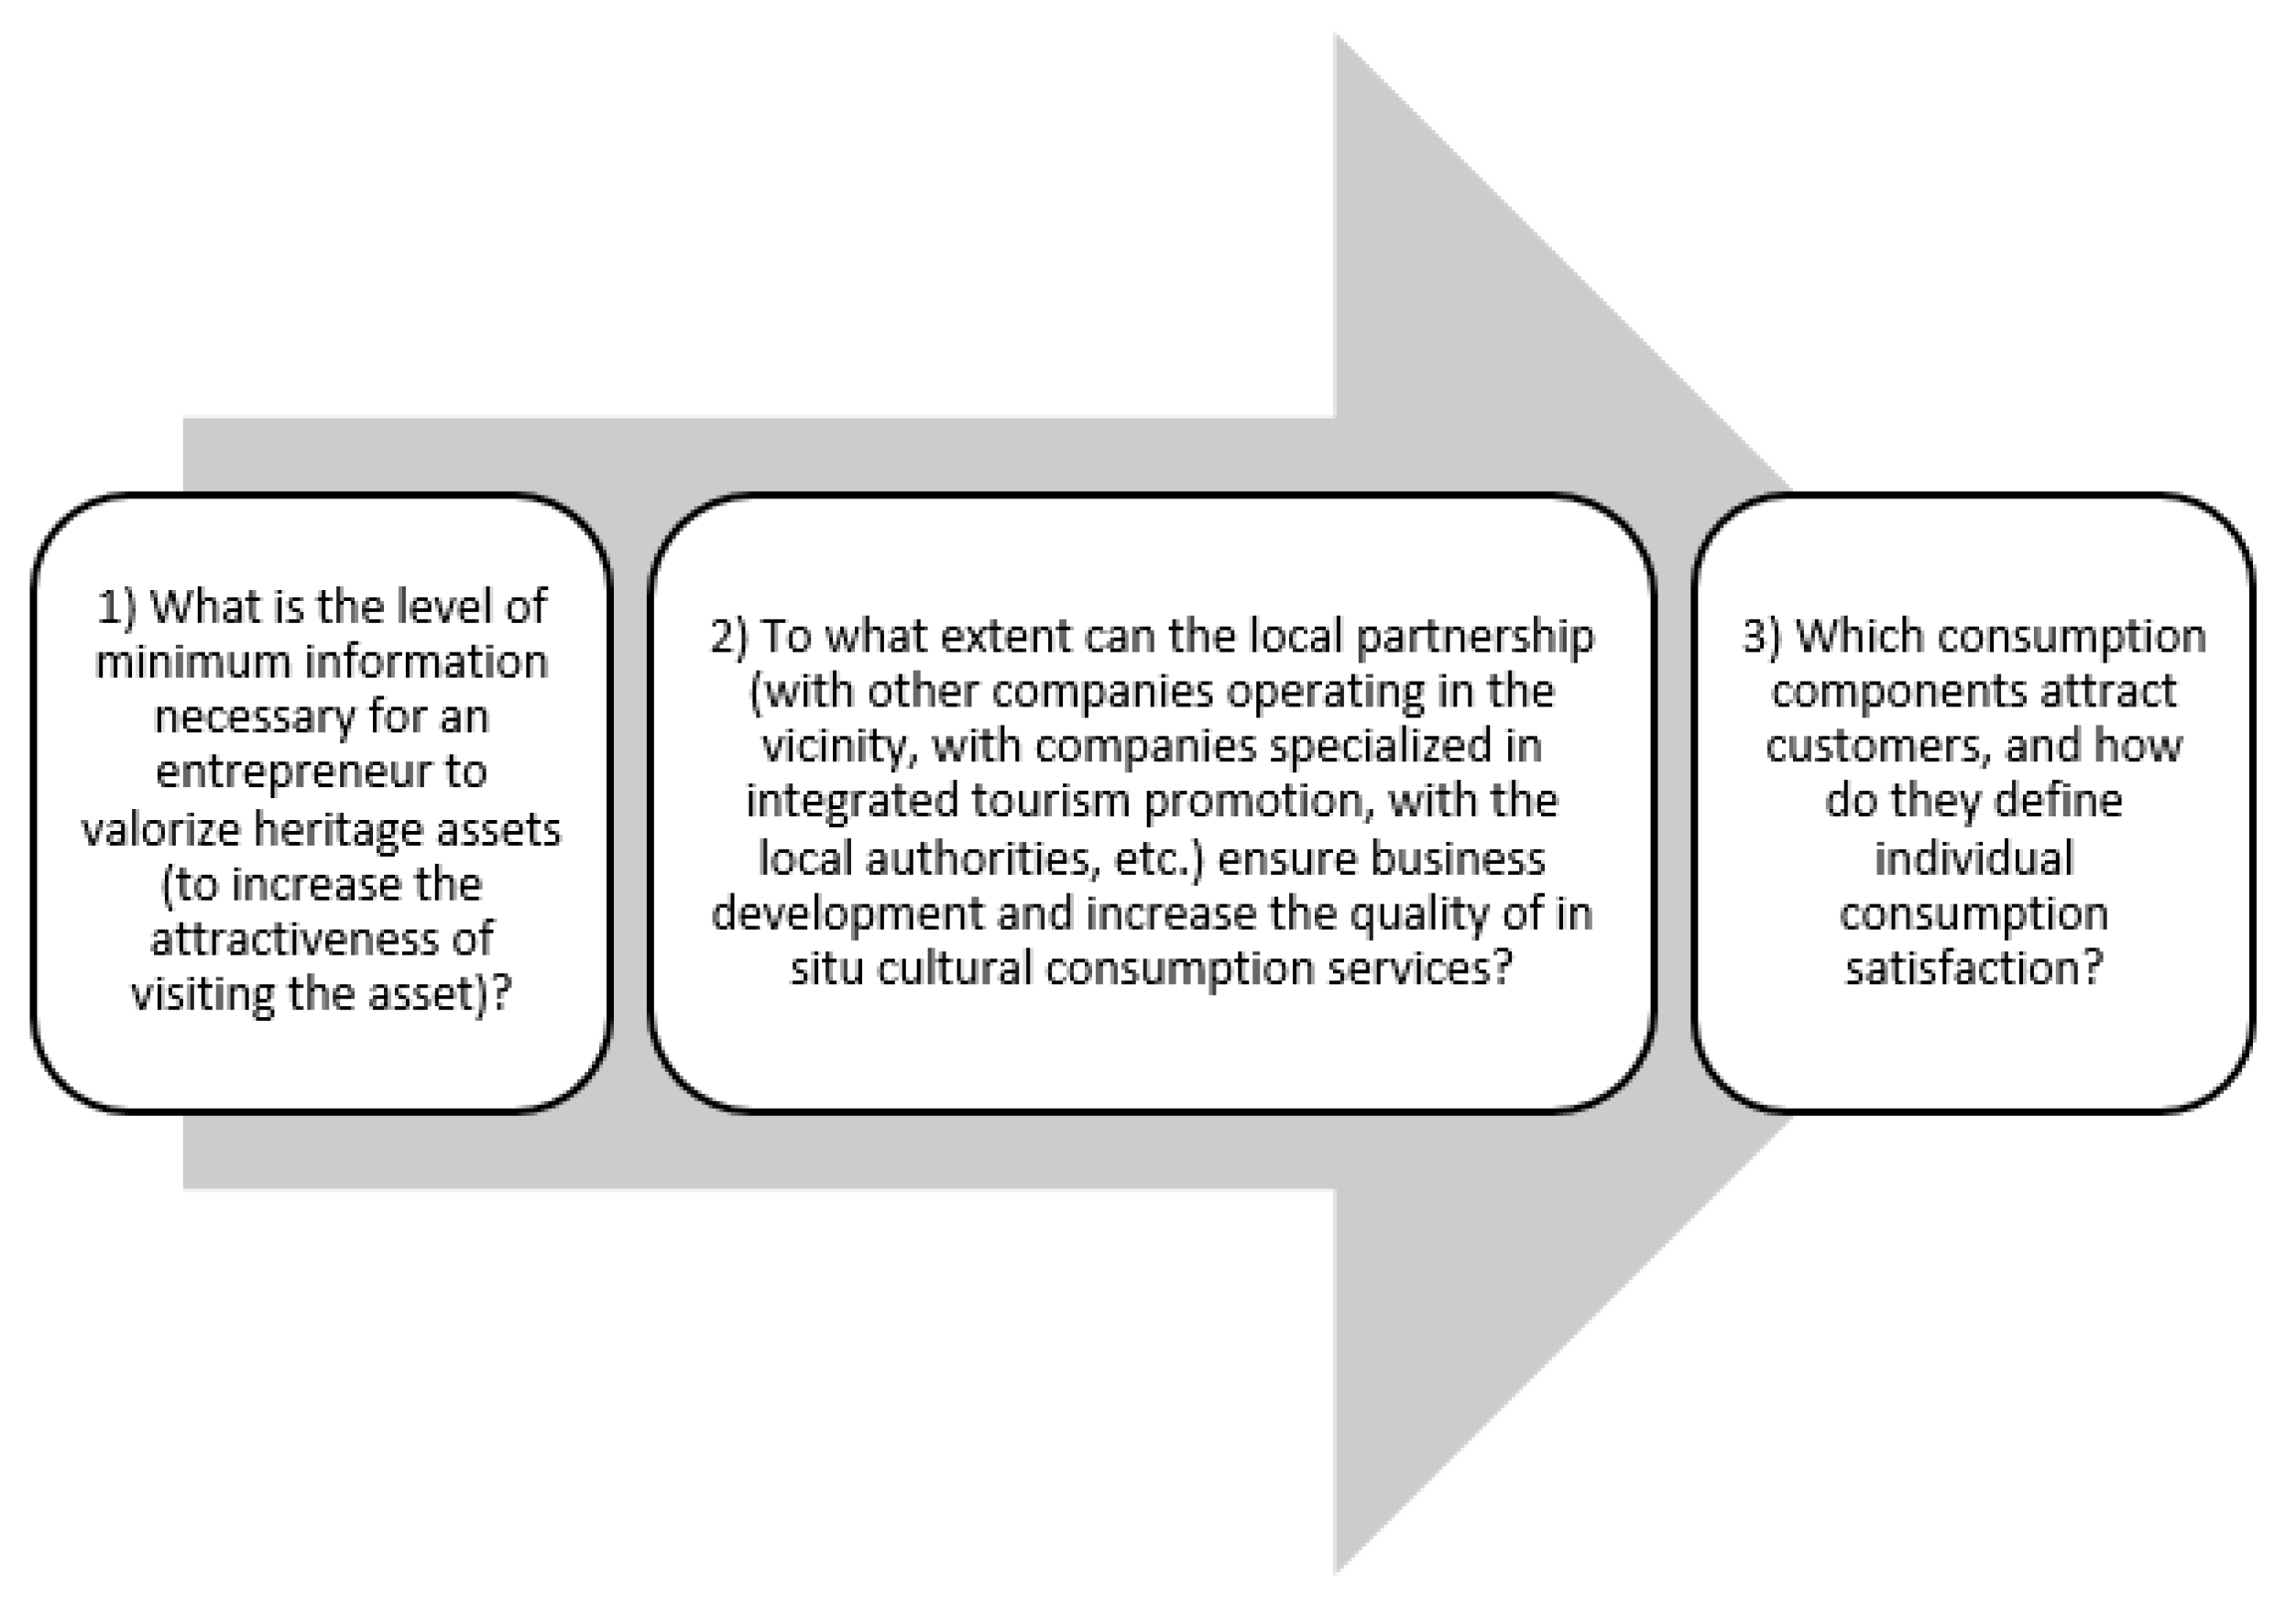
The analysis begins with three research questions that emphasize several key areas related to enhancing the attractiveness and quality of heritage tourism through entrepreneurship and partnerships (
Figure 16).
The experts involved in the session of the focus group are from the following specializations: valorization of cultural heritage, tourism marketing, cultural heritage management, gamification and graphic design, statistics and spatial development, innovative entrepreneurship, social media analytics, strategic management for digital transformation, communication, tour guiding, sociology, and finance.
The results of the rounds of questions highlighted the following:
- -
An analysis of consumer satisfaction, based on the opinions expressed by consumers on social media platforms, is particularly useful for company management if it is carried out periodically.
- -
The information provided from the analysis of these freely expressed and unstructured opinions is limited, and therefore, it would be necessary to supplement it by developing a structured questionnaire that could be available on the company’s website.
- -
Consumer satisfaction refers to the cultural consumption (visit to the castle) and also to the following:
- (a)
The support services offered (additional information, interactive applications during the visit to the asset, and complementary activities in the vicinity of the asset).
- (b)
Accessibility (transportation and facilities for vulnerable people, costs and financial facilities for various categories of consumers, discounts for the purchase of an integrated package of services, etc.).
- (c)
The integration of cultural consumption services in thematic routes with local activities (festivals, sports competitions, craft activities, etc.).
- -
Local partnerships between public authorities and entrepreneurs are needed to ensure integrated consumer services, such as local transport (access to assets), various local services, etc.
- -
Diversification of promotion, with an emphasis on the facilities provided by digitalization: virtual tours, online package acquisitions, marketing on social platforms, the company’s website, etc.
- -
Diversification of the offering based on consumer categories (age groups, income, etc.)
- -
There is a need to (periodically) conduct economic and social impact studies using various types of analysis.
6. Discussion
In this paper, we highlighted the emotional reactions toward castles and palaces in Romania using text mining, including sentiment scores and emotion categorizations. Also, we checked the relationships between sentiments and emotions. Various methods were used, such as bibliographic analysis; bibliometric analysis; sentiment analysis (SA); cluster analysis (CA); focus groups and in-depth interviews with experts in business model development; and econometric models.
The findings show that visitors exhibit a pronounced interest in cultural tourism. The visitors were interested in heritage assets (castles and palaces), finding their narratives captivating, astonishing, and aesthetically pleasing. As a result of these interactions, visitors have emotions such as joy, trust, and surprise, which are increasingly used in qualitative perception analyses, such as SA. Nonetheless, among the primary challenges visitors face are an outdated booking system, a lack of language translations, insufficient information about museum exhibits, and a lack of available parking spaces. These limitations contribute to the emergence of negative emotions. Negative emotions are identified in various works in the literature. This is why it is important for tourism professionals to understand these emotions and to work to improve visitor experiences (
Gulati, 2021).
The emotions that emerge are joy, trust, surprise, and anticipation. Positive sentiments dominate the reviews. On the other hand, emotions such as disgust, fear, anger, and sadness could influence the perceptions of other members of the audience from social media. The SA developed shows that most reviews have a positive tone, which agrees with the previous literature (
Nave et al., 2018;
Baniya et al., 2020;
Jiang et al., 2021;
Zhang et al., 2021;
Lee et al., 2022;
Hashimoto et al., 2023).
The cluster analysis identifies three clusters, where the first one is characterized by high scores in emotions and positive sentiments and low scores in negative ones. The largest cluster, the second one, mirrors the first cluster’s dominance of emotions and positive sentiments. The highest score for emotions and negative sentiments is found in Cluster 3. This is the smallest cluster. Emotions of disgust, fear, anger, and sadness can easily spread on social networks. They can negatively influence the opinions of other visitors. ANOVA analysis showed that the cluster solution is significantly influenced by variables (emotions and sentiments).
The econometric models emphasized the statistical significance of the relationships between variables. Emotions with a significant impact on both positive and negative sentiments are “anticipation” and “surprise”. Thus, the overall sentiment in online reviews is characterized by these emotions. Businesses can use the results to adapt their strategies and better engage their visitors.
Following the focus group result analysis, the authors propose further research on applying complex qualitative analysis to achieve the same objectives, for example, the AHP or A’WOT method and the extension of SA to other databases offered by social platforms. Subsequent research could delve into the exploration of alternate social media platforms. It could combine the information obtained from tourist surveys with sentiment analyses of reviews posted on online platforms.
The results of this research are helpful for the management of heritage assets. This shows the need for similar studies to become tools in strategies for improving cultural offerings. One perspective could be the integration of traditional offerings with facilities offered through digital transitions, with the involvement of visitors in interactive activities/games, providing unique experiences. Thus, businesses could effectively engage the target audience and align with its preferences and interests.
7. Conclusions
The study contributes to the literature by analyzing online opinions on Romanian castles and palaces. The results can be used by businesses to improve their offers to visitors.
7.1. Main Results
The results obtained refer to the following aspects:
- -
Analyzing the opinions of visitors posted on social networks is important for businesses in the field. In order to obtain an overall picture, structured questionnaires easily accessible on the companies’ websites can be used.
- -
In the comments posted online, visitors not only refer to the cultural experience (a visit to a castle) but also to various services (information and interactive applications) and accessibility (transport, facilities, discounts, and financial options). Reference is also made to additional benefits in the vicinity (accommodation, restaurants, and local activities), packages with various activities, and integration into thematic routes.
- -
Businesses could design cultural packages to boost consumption, including various support services tailored to satisfy the preferences of different customer segments.
- -
An integrated tourism approach involves a partnership between the public sector (local authorities) and the private sector (entrepreneurs, travel agencies, etc.) operating in accommodation, transportation, food and beverages, trade, etc.
- -
Businesses can use various tools for promotion. Some examples are company websites, online package acquisition, social media marketing, and virtual tours.
- -
Constantly changing consumer behavior demands the development of impact studies to obtain a comprehensive approach to emerging trends. Thus, we recommend combining various analysis methods.
7.2. Study Limitations
The limitations of this study are related to the selection of castles and palaces. This paper uses a limited sample size. Therefore, the results do not apply to the entire cultural heritage of Romania. The content of visitors’ comments may not encompass the whole range of their experiences. Also, variations in online engagement and accessibility among different heritage assets could introduce biases in the analysis.


 ,
, 


