Abstract
In times of COVID-19, trust in safety and security measures in the hospitality industry has become a key variable for destination management and recovery; but what are the main measures that should be applied to ensure visitors’ confidence? This paper seeks to understand and identify the main tools proving efficient in ensuring the return of visitors. With this aim, the perception of tourists visiting the Region of Murcia (Spain) during 2021 is analyzed. Main results state that the adoption of anti-COVID measures by establishments positively influences user’s satisfaction and their intention to repeat. Moreover, disinfection and hygienic measures along with capacity restrictions are identified as the preferred measures. Visitors were also asked about how new technology measures recently developed by the industry could influence their intention to return. Results show that those aimed at monitoring air quality and cleaning and disinfection of spaces are crucial. These findings contribute relevant recommendations for the hospitality industry and destination managers in a post-COVID horizon.
1. Introduction
The crisis caused by the COVID-19 pandemic has had a significant influence on the international economy, from the beginning to the current stage of recovery. After more than two years of the pandemic, the tourism sector and all its sub-sectors have suffered an additional impact, due to the situation of limited mobility. Given the cessation of activity at the beginning of the pandemic in Spain, and other restrictions on personal mobility, compulsory quarantines and capacity restrictions in HORECA establishments (hotels, restaurants, cafeterias), this sector has suffered an unparalleled drop in its level of activity and employment. In this context, it is worth remembering that before the pandemic, the tourism sector contributed 12.3% of national GDP and 12.7% of employment, which shows the weight of the sector in the Spanish economy [1]. At the regional level, its direct and indirect contribution to regional GDP was around 11.5% in 2019 [2].
The crisis caused by COVID-19 has also changed tourists’ needs significantly. Therefore, it is essential to analyze the new demand and habits of tourists, as well as the factors affecting their travel satisfaction in a post-pandemic environment. In the aftermath of the pandemic, several authors have focused on analyzing tourist perceptions. In their study, [3] showed that during the pandemic, Chinese, Japanese, and Korean tourists experienced negative emotions such as worry, anxiety, fear, panic, and nervousness. Pappas and Glyptou [4] analyzed the factors influencing users’ decision-making when booking accommodation after the pandemic outbreak. The results of this study show that, during the pandemic, the main consideration of participants was self-protection and avoiding the spread of infection, given the high value they place on measures to combat health risks and improve hygiene. In the same vein, Li et al. [5] after studying the Chinese touristic market, concluded that the preferences of the tourists have changed markedly. Indeed, these authors highlight the strengthening of the preference for destinations close to home and recommend managers take measures to reduce tourists’ perceived risk of COVID-19 contagion (that is, new cleaning standards, use of contactless technologies, etc.) as well as providing potential customers with positive signals about safety at the destination. Based on the above, it can be observed that risk and hygiene aspects play an important role in tourists’ decision making in a post-COVID scenario. Thus, in a context where risk cannot be completely eliminated, it is important to examine how customers’ perceived risk affects their perception and decision to travel. Foroudi et al. [6] base their study on analyzing how, through the theory of perceived risk, customers’ perceptions affect their beliefs, and how these, in turn, influence their anticipated emotions (e.g., going to a restaurant). The results clearly show the change in consumers’ behavior, who continuously adapt to the new situation and adhere to a new lifestyle. In this sense, the authors state that the high level of uncertainty that exists in society as a consequence of COVID-19 has caused restaurant customers to have a higher judgement of risk and to develop a high level of negative emotions. It is therefore necessary to continue innovating and adapting to new consumer requirements in order to generate peace of mind and confidence, clearly communicating the security measures adopted by each establishment.
Thus, it is crucial that strategies are developed and designed to help with the recovery. Indeed, studies on crises and tourism stress the importance of adopting measures that generate security and confidence during post-crisis periods [7]. Faced with this context, this study aims to obtain a better understanding of the perception of security by tourists. We consider data from a survey on tourists visiting the Spanish region of Murcia during 2021 and address their perception regarding a wide list of anti-COVID measures implemented by hotels, restaurants, and cafés. The main underlying hypothesis of the present research states that tourists’ satisfaction is connected with loyalty to destination and thus with the willingness to revisit.
2. Data
Data for this study were collected by surveying visitors to the Region of Murcia, in the southeast Mediterranean coast of Spain, between September and October of 2021. The survey was conducted within the territory of the Region of Murcia as the study was carried out as part of a regional project. The Region of Murcia is a small Spanish region with a population of approximately 1.5 million people, located in southeastern Spain, on the shore of the Mediterranean Sea. As a tourism destination, the region is traditionally specialized in the sun and beach segment, although recently new kinds of tourism are gaining relevance as it is the case of cultural related products. Before the pandemic outbreak, the region received about 1.6 million tourists per year (24% of which were international visitors). The incidence of COVID-19 in the tourism activity of the region has reduced the total number of visitors, but especially those of international arrivals (in 2021, the region received 1.2 million tourists, while international tourists now represent 17% of the total). Therefore, for tourism managers in the region, the priorities are both a recovery of the global figures of visitors and, especially, attracting international tourists. Accordingly, the Region of Murcia is to a large extent a convenient case study as it shares with other destinations the same problems and managerial objectives for the post-pandemic era. The questionnaire was completed by tourists who use hotels, restaurants, and cafés. The questions of the survey are related to the level of implementation of COVID-19 measures in hospitality establishments, their confidence in these measures, their perception of new measures that could be implemented according to available technology, and the level of satisfaction and their propensity to repeat the experience in case new technological measures were implemented. Moreover, the survey also collected information on the personal profile of the tourist and characteristics of the trip.
To examine the data, two main analyses were carried out. The first was a descriptive analysis which stresses the relative importance of the perception of the measures being implemented, the confidence they generate among users, and possible measures to be implemented. The second part of the analysis followed an econometric approach to identify the most relevant factors driving the customers’ satisfaction with anti-COVID measures and their intention to return. This analysis was based on an empirical model that has the ability to accommodate the special features characterizing the variables of interest in this study (i.e., its discrete and ordinal nature).
The dataset includes responses from a sample of 306 tourists with descriptives shown in Table 1. Regarding the socio-economic characteristics of the tourist, 58% of the users were females, with range of age 16–45 years old (39%), 46–65 years (42%), or older (19%). In addition, 60% of the sample travelled with their partner, 19% with their family or in a group, and just 2% of them did it alone or individually. In terms of level of education, it can be seen that visitors showed primary education (12%), secondary education (47%) and higher education (41%). Regarding the residence of the respondents, 64% were domestic tourists and 36% lived outside Spain (mainly in England). In relation to the visited establishment, the bulk of respondents went to hotels (64%), while the remaining were customers of restaurants and cafés (36%).

Table 1.
Sociodemographic characteristics of the sample.
Table 2 shows the opinion of visitors in the sample about the “level of implementation” of the measures. Customers were required to express their perception regarding the level of implementation of anti-COVID measures by selecting one out of five alternatives ranging from “low” to “high”. To analyze the response data, a numeric value was assigned to each option from 1 for “low” to 5 for “high”. This type of question is known as a Likert scale and is widely used in the literature to measure attitudes and opinions. Responses to this question summarized in Table 2 suggest that customers considered that the measures most frequently applied in HORECA establishments in the Region of Murcia are hygiene and disinfection measures applied by employees (4.01 points), followed by disinfection of the facilities (4.00). On the other hand, with a medium level of applied measures, we see those related to indoor air renewal systems (3.02). Some additional measures that received an upper-intermediate rating were capacity restrictions (3.87), specific furniture (3.85), social distancing (3.56), and the use of new “contactless” technologies (3.51 points).
Table 2.
Perception of the level of implementation of safety and security measures in HORECA establishments for the Region of Murcia (in number of users surveyed).
Table 3 shows the confidence level that the implementation of these measures generates among users. As before, data were collected from a Likert scale with options ranging from 1 (no confidence) to 5 (high confidence). From the distribution of the users’ responses, it can be seen that hygiene and disinfection measures by employees, followed by capacity restrictions, disinfection of facilities, and specific furniture measures that minimize the risk of contagion generated higher confidence in the visitors.
Table 3.
Level of confidence generated by the measures implemented (in number of users).
Table 4 shows details of the level of satisfaction declared with the establishment according to the service received and the safety context perceived during the stay and the intention of users to repeat the experience at this very same establishment. The overall satisfaction was measured with a Likert scale where the possible responses are scaled from 1 (very dissatisfied) to 5 (very satisfied). Most of the users interviewed expressed a high degree of satisfaction with the establishment visited of values 4–5 (76.8% of users), while at the other end, only 6.5% of users declared themselves to be very dissatisfied in values 1–2 of the scale. Additionally, the likelihood of repeating the experience in this very same establishment was measured on a scale of 1 to 5 equally, with value 1 being very unlikely to repeat and value 5 very likely to do it. The results show that 76.5% of users would return with high likelihood to such establishment in the near future, with values 4–5 in the scale. Such a result indicates that the current measures seem to be in line with the requirements and concerns of the users. On the other side, only 3.9% of them stated they would not be eager to repeat this same visit.
Table 4.
Level of satisfaction and probability of repeating the experience in this very same establishment.
Subsequently, a descriptive analysis of the level of confidence of users in case of application of new measures was carried out, with a scale between 1 (no confidence) and 5 (full confidence). Further, users were also asked about their likelihood of repeating the experience in the establishment if a set of new measures proposed were subsequently applied (see Table 5). Results show that, in general, the application of new measures would generate greater confidence among users. The aspects of monitoring and reporting information to customers were quite well rated, for example in being applied to monitor cleaning and disinfection (4.14), air and ambient quality (4.13), specific furniture once more (3.93), or applied technologies to follow social distancing measures (3.97), or the detection of thermal anomalies in customers at establishments (3.89). Detection in wastewaters and use of mobile devices to receive instant feedback were also valued by customers as new measures reporting more safety and security to visitors as shown in Table 5.
Table 5.
Level of confidence and likelihood of repeating the experience in case of applying the following measures.
Regarding the likelihood of repeating the experience, findings show a high probability if all the proposed new measures were implemented. In this case, the mean is of 4.28 (out of a maximum of 5 points), which shows that if the new measures were adopted, the probability of repeating the experience would increase regarding the current situation rated previously on a 3.95 value of Table 4.
3. The Impact of Anti-COVID Measures on Tourists’ Behavior
Growing competition amongst tourist destinations and firms in the hospitality sector highlights the strategic importance of customers’ loyalty. The benefits of loyalty are related to the ability of converting a tourist’s visit into a stable relationship with a crucial impact on profitability and continuity of the organizations [8,9,10,11]. In marketing research, loyalty is analyzed as a multidimensional concept including behavioral and attitudinal components. In this vein, consumers’ loyalty is defined as the “intention to repeat purchase” or “the intention to revisit” under the behavioral approach; while the attitudinal approach stresses the positive attitude towards the product and interprets loyalty as “willingness to recommend the product to others”. Notably, this dimension of loyalty, i.e., the intention to recommend, is of special interest provided that opinions and recommendations by others count between the most relevant sources of information used by tourists in the process of choosing a particular destination to be visited. In this research, we adopted a behavioral point of view, and customer loyalty was measured by “the intention to repeat the visit”.
Academic and empirical literature has also emphasized the relationship between customer satisfaction and loyalty issues. In this way, positive experiences tend to become specific in behavior as an increased willingness to repeat the visit or repurchase the product [12,13,14]. Thus, customers’ satisfaction likely acts as a precursor variable for loyalty, or at least as the literature has remarked, they show a quite closer relationship and co-evolution (see, i.e., [15]). Therefore, we first examine an initial hypothesis regarding the positive effect of overall satisfaction with anti-COVID measures on revisiting intentions.
Figure 1 depicts a scatterplot of the responses obtained for these two variables in the survey, suggesting the existence of a positive relationship. The strength of this association was also evaluated by computing the polychoric correlation coefficient between the variables. The coefficient was shown to be of 0.7931. This value is quite high, which indicates that there is a strong positive association of around 80% between the likelihood of repeating the visit and previous overall level of satisfaction of customers with the anti-covid measures applied. In fact, it appears that higher levels of satisfaction relate to higher intention to return.
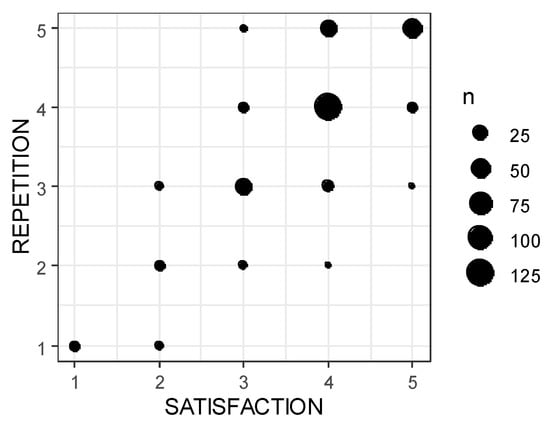
Figure 1.
Relationship between consumers’ overall satisfaction and intention to repeat.
3.1. Anti-COVID Measures and Tourist’ Satisfaction
Once the positive influence of overall satisfaction with anti-COVID measures with the willingness to repeat was established, we turned the focus on the empirical relevance of each of the adopted measures previously defined. In doing so, the overall level of satisfaction expressed by customers of HORECA establishments was related to the user’s confidence arising from the application of each individual measure plus individual profiles of visitors. The aim was to ascertain two key aspects related to consumer satisfaction: which measures do tourists actually rate, and how do they rate them.
To relate the degree of user satisfaction to a set of factors of interest, we considered an ordered logit modeling approach, which allows us to consider the discrete and ordered nature of the dependent variable [16]. In this model, the response variable is viewed as the discrete realizations of an underlying, unobservable continuous variable that depends on the confidence generated by the anti-COVID measures (MEASURES) and a set of control variables (CONTROL),
The observable categories are assumed to arise from as follows: , where the µ’s are unknown categories boundaries in the distribution of , with and . Finally, and are vectors of coefficients, and is a random error term.
The main estimation findings are shown in Table 6. Given that most of the responses obtained were concentrated in only three categories of the proposed response scale, in the subsequent analysis, the first three categories are integrated into a single one. Consequently, for estimation of the ordinal logit specification, the dependent variable was defined by three possible levels of satisfaction which are shortlisted as “high”, “moderate”, and “relatively low”. The control variables were, in general, statistically insignificant, despite adding joint explanatory power to the estimated equation. In this regard, only the type of establishment visited appeared to be significant in shaping the level of user’s satisfaction, which was lower for restaurants and cafeterias than for hotels. In contrast, other factors defining the user’s profile, such as age, gender, level of education, or whether they travel alone or accompanied did not exert a clear influence on the level of perceived satisfaction. As for the impact of anti-COVID measures on satisfaction, the results show that disinfection measures, use of specific isolation furniture among clients, capacity or crowdedness avoiding restrictions, social distancing, hygiene of employees, and ICTs for post-COVID scenario appeared to be the most related to satisfaction of customers. Air renewal was also significant, as well as the rest named before, despite lower relevance shown. All these findings were computed according to the relative importance of each of the variables from their impact on the predictive ability of the model, included in Table 6 as the relative importance metric (r.i.) for each of the explanatory variables in the model (see [17]).
Table 6.
Ordinal logit model for consumers’ overall satisfaction.
The indicators of relative importance for the explanatory variables in the model confirm that the different variables characterizing the profile of users were hardly relevant in explaining the level of satisfaction obtained and, once again, the type of establishment visited was the only significant factor. However, the findings related to the anti-COVID measures now show a different scenario, where they all play a relevant role as predictors of the level of satisfaction achieved by users. Finally, it is noteworthy that, as a whole, the anti-COVID measures were responsible for approximately 91% of the explanatory power of the ordered logit model for user’s satisfaction (the remaining 9% corresponds to the control variables included in the specification, so they still play a role, and consequently stay in the final specification of the model).
3.2. New Anti-COVID Measures and the Probability of Repeating the Visit
As we have previously shown, anti-COVID measures increase the user’s satisfaction, with a higher degree of satisfaction being associated with a higher probability of repeating the visit to the establishment. In the case of measures that have not yet been implemented, it is not possible to include the satisfaction items, as information is absent on these data. On the other hand, we do have information on the intention to repeat the visit to the establishment in case new anti-COVID measures are implemented. Since the latter probability level is clearly influenced by the satisfaction obtained in the visit already made, the specific effect of the new measures can be assessed by examining the difference between the probability of repetition based on the current measures, REPEATA, and the probability of repetition in case of implementing the new measures considered, REPEATN,
The interpretation of this new variable is immediate. Since the interviewed users evaluated the likelihood of repeating the experience on a scale of 5 levels (from 1—not very likely to 5—very likely), the variable ΔREPEAT only takes values in the range between −4 and +4. Negative (positive) values are indicative of a negative (positive) effect of the implementation of the new measures on user’s satisfaction, while a value of 0 is representative of a situation of indifference (the new measures would not condition users’ decisions).
The distribution of the values of the variable ΔREPEAT suggests that for a significant part of users (58.1%), the eventual implementation of new anti-COVID measures would not alter their intention to repeat visits to the establishment. Alternatively, for 33.66% of users, the new measures would lead to an increased likelihood of repeating their visit. Finally, the new measures reduce the likelihood of repeating visits to the establishment for only 8.18% of users.
The next question we considered is related to the individual effect of each of the new anti-COVID measures included in the questionnaire on the probability of repetition. For this purpose, the variable ΔREPEAT was recoded into three categories (−1, 0, +1) comprising negative, null, and positive values, respectively. Since ΔREPEAT is an ordered discrete variable, the econometric specification chosen was again an ordered logit model where the confidence in each of the new measures expressed by users were included as explanatory variables. The structure of this specification is analogous to that in Equations (1) and (2) and, additionally, the latent indicator (of the effect on the probability of repetition in this case) is represented as follows:
where stands for the new anti-COVID measures; and are vector of coefficients; and is a random error term.
The estimation of the ordered logit model for the dependent variable ΔREPEAT is shown in Table 7. We also present the relative importance measures associated with each of the explanatory variables in the model. These results suggest that the new measures aimed at monitoring air quality, and cleaning and disinfection of the spaces were the most important drivers of the likelihood of repeating willingness. Measures for detecting the presence of viruses in the wastewater of the establishment also appear to be a factor favoring subsequent visits by users. Finally, it is somewhat surprising that the rest of the proposed measures either did not affect the likelihood of repeat visits significantly or did it negatively. This is, in fact, the situation for sensor monitoring of compliance with social distance measures or the introduction of furniture that minimizes the risk of contagion, which were interpreted by users as an added annoyance and not as actions aimed at containing transmissions.
Table 7.
Ordinal logit model for changes in consumers’ intention to repeat.
4. Discussion
In the previous section, we analyzed the effect of the anti-COVID measures implemented by hospitality establishments in response to the challenges posed by the pandemic to the activity in the tourism HORECA sector. The analysis focused on the impact on satisfaction of the users, which is understood as a precursor of tourist loyalty. In this regard, the literature has acknowledged the link between satisfaction with the tourist experience and an increase in the intention to repeat the visit to the establishment or even revisiting the destination. Moreover, tourists’ satisfaction is also related to their perception of the quality and image of a destination and favors word-to-mouth comments and recommendation.
From the point of view of managers, a better insight into the factors that influence satisfaction among their customers is fundamental since this variable determines their future intentions. Noteworthily, customers’ satisfaction is related to their expectations, i.e., their predictions and beliefs about the service, as well as to aspects that are under the control of the supplier. In this regard, the ability to identify effective measures is a key element for the design of business strategies aimed at fostering higher levels of client loyalty.
Our results support previous ones in the literature, regarding the relationship between tourists’ satisfaction and the likelihood of revisiting an establishment. As a novelty, the focus was on the impact of measures designed to ensure the safety and security perceptions of customers, while minimizing the likelihood of contagium in a post-pandemic context. Taken together, the measures yet implemented by the establishments reveal themselves effective as a means to improve satisfaction and the willingness to repeat. However, measures related to disinfection of facilities are found to be the most influential on customers’ satisfaction, whereas those involving indoor air renewal system were revealed as the least effective. This result is likely explained by the preference for consumption outside the premises in cafés and restaurants along with the efforts made by the hotels to keep contact between their customers to a minimum. In general, however, it is important to note that many of the proposed measures, such as isolation, furniture, control of the state of the establishment, and health condition of the customer at the entrance, were quite valued along the stages of the study, with particular disinfection monitored and transmitted to customers being very important at these first “new normality stages”, and even Information and Communication Technologies (ICTs)-related measures could play their role at this extent, either providing new information to customers instantly, or transmitting it to their smart phone devices.
This study also pays attention to the potential effect that new measures might have on customers’ behavior. By analyzing their impact on the probability of repetition, the results suggest that measures aiming to monitor air quality and cleaning and disinfection of premises are the most relevant in practice once again, so people’s behavior is still in a stage of fear of a rapid virus contagion (in this case, maybe anticipating the return to on-premise consumption). The remaining anti-COVID measures were found to be either less relevant or sometimes detrimental when their objective was raising customers’ repeating behavior. The latter, although surprising at first glance, is an interesting result that reflects an increasing preference of consumers for enjoying their leisure time in normalized environments. Here, the conclusion is that once the risks posed by COVID are controlled for, customers do not much appreciate the implementation of new measures that might even be perceived as intrusive. For managers, this finding is a warning against the consequences of over-intervention, as new anti-COVID measures might prove to be social and individually intrusive, an undesired collateral effect of the COVID episode.
5. Conclusions
Taking into account the general context generated by the COVID-19 pandemic, and regarding the impact on tourism, this work has explored the potential contribution that a range of measures implemented by establishments of the hospitality industry (HORECA) could provide to safety and security perceptions of visitors in a recovery setting. In particular, we analyzed how these anti-COVID measures influence tourists’ satisfaction with the service and stimulate their willingness to repeat. As it is widely acknowledged, repetition of the visit may be considered as an indicator of customer loyalty, so our findings are of special relevance for destination managers. In this regard, loyalty emerges as a key pillar in increasing competitiveness and success of destinations, since repeat visits would help to recover and consolidate the flow of tourists to harmed destinations. It would also ease the matching between the preferences and needs of the users and the characteristics of the tourism supply in a secure setting.
Empirical findings presented in this study drew on a survey to tourists visiting the Spanish Region of Murcia in 2021, who were asked about their perception of a comprehensive list of anti-COVID measures, such as disinfection, social distancing, capacity restrictions, contactless technologies, air renewal systems, or the use of specific furniture aimed to minimize the risk of contagion. Once confirmed the positive link between overall satisfaction of the tourist with the application of these measures and their intention to repeat, the question of which specific measures were the most relevant was evaluated through an ordered logistic regression model. Summarizing, our main results suggest that all of these measures play a relevant role in increasing satisfaction and promoting tourists’ loyalty. Interestingly, among the list of measures presented, those associated with disinfection, social distance, and monitoring and reporting instant information to the customer have been revealed as the most effective. However, all of them seem to play a role in this setting, at one stage or another, despite more invasive and tech-related measures not being very well understood by visitors, fearing to be too much scanned in their daily lives, and particularly when on vacation. In a second stage, we also addressed the effect of applying additional anti-COVID measures on satisfaction and repetition. In this case, we found that its impact on the tourists’ intention to repeat would be rather negligible or even detrimental. For managers, this result should be interpreted as a warning of the potential risks of excessive intervention and calls for continuous monitoring of consumers’ perception of as yet implemented measures when the objective is fostering their confidence and loyalty to a destination or service.
From a managerial point of view, all these results would be showing that direct measure are still at the top of the ranking in terms of a customer’s perception of safety and security, including social distancing, control of crowds at establishments, cleanliness by employees, and reports to the smart phones of customers. Water and air control would be gaining room as we think in a second stage of the recovery, while more ICT-related measures perhaps will not become so necessary at all, or could even bring a negative perception from users. In sum, all the findings in the present research have allowed us to give a wide picture of the feelings of tourists in the summer-autumn of 2021, so we hope that current developments of the pandemic at a global and EU scale give shape to all these recommendations in the mid-run, when visitors start to look to another side of the establishments’ competitiveness and related factors driving their satisfaction and repeating intentions.
Author Contributions
Conceptualization, A.A.-T. and J.M.N.-A.; data curation, P.J.-M.; formal analysis, J.M.N.-A., C.C.-P. and A.A.-T.; investigation, J.M.N.-A. and A.A.-T.; supervision, P.J.-M.; writing—original draft, J.M.N.-A., C.C.-P. and A.A.-T.; writing—review and editing, J.M.N.-A. and A.A.-T. All authors have read and agreed to the published version of the manuscript.
Funding
This research was funded by Dirección General de Comercio e Innovación Empresarial de la Consejería de Empresa, Industria y Portavocía, Región de Murcia, grant number 2120SAE00082 del Programa Estrategia RIS3MUR. Proyecto HORECOV2- Sistema Inteligente en Sector HORECA para minimizar el riesgo de contagios víricos tipo SARSCOV2.
Institutional Review Board Statement
Not applicable.
Informed Consent Statement
Not applicable.
Data Availability Statement
The data presented in this study is not available given confidentiality issues.
Conflicts of Interest
The authors declare no conflict of interest.
References
- Ministry of Industry, Trade and Tourism. Available online: https://www.mincotur.gob.es/es-es/COVID-19/Paginas/COVID-19.aspx (accessed on 13 December 2021).
- ITREM. Balance del Turismo en la Región de Murcia 2019; Instituto de Turismo de la Región de Murcia (ITREM): Murcia, Spain, 2020.
- Cheung, C.; Takashima, M.; Choi, H.H.; Yang, H.; Tung, V. The impact of COVID-19 pandemic on the psychological needs of tourists: Implications for the travel and tourism industry. J. Travel Tour. Mark. 2021, 38, 155–166. [Google Scholar] [CrossRef]
- Pappas, N.; Glyptou, K. Accommodation decision-making during the COVID-19 pandemic: Complexity insights from Greece. Int. J. Hosp. Manag. 2021, 93, 102767. [Google Scholar] [CrossRef]
- Li, X.; Gong, J.; Gao, B.; Yuan, P. Impacts of COVID-19 on tourists’ destination preferences: Evidence from China. Ann. Tour. Res. 2021, 90, 103258. [Google Scholar] [CrossRef]
- Foroudi, P.; Tabaghdehi, S.A.H.; Marvi, R. The gloom of the COVID-19 shock in the hospitality industry: A study of consumer risk perception and adaptive belief in the dark cloud of a pandemic. Int. J. Hosp. Manag. 2021, 92, 102717. [Google Scholar] [CrossRef]
- Araújo, N. Repercusión económica de la pandemia originada por el COVID-19 a nivel mundial. Análisis de sectores más afectados. Quipukamayoc 2020, 28, 85–93. [Google Scholar] [CrossRef]
- Chi, C.; Qu, H. Examining the structural relationships of destination image tourist satisfaction and destination loyalty: An integrated approach. Tour. Manag. 2008, 29, 624–636. [Google Scholar] [CrossRef]
- Gursoy, D.; Chen, J.S.; Chi, C.G. Theoretical examination of destination loyalty formation. Int. J. Contemp. Hosp. Manag. 2014, 26, 809–827. [Google Scholar] [CrossRef]
- Oppermann, M. Tourism destination loyalty. J. Travel Res. 2000, 39, 78–84. [Google Scholar] [CrossRef]
- Petrick, J.F. Are loyal visitors desired visitors? Tour. Manag. 2004, 25, 463–470. [Google Scholar] [CrossRef]
- Yoon, Y.; Uysal, M. An examination of the effects of motivation and satisfaction on destination loyalty: A structural model. Tour. Manag. 2005, 26, 45–56. [Google Scholar] [CrossRef]
- Baker, D.A.; Crompton, J.L. Quality satisfaction and behavioral intentions. Ann. Tour. Res. 2000, 27, 785–804. [Google Scholar] [CrossRef]
- Chen, C.; Tsai, D. How destination image and evaluative factors affect behavioral intentions. Tour. Manag. 2007, 28, 1115–1122. [Google Scholar] [CrossRef]
- Artal-Tur, A.; Sanchez-Casado, N. Exploring tourist satisfaction and destination loyalty. In Tourist Destination Management; Tourism, Hospitality & Event Management Series; Kozak, N., Kozak, M., Eds.; Routledge: London, UK, 2019; Chapter 5; pp. 75–100. [Google Scholar] [CrossRef]
- Agresti, A. Categorical Data Analysis; John Wiley & Sons: Hoboken, NJ, USA, 2003. [Google Scholar]
- Johnson, J.W. A heuristic method for estimating the relative weight of predictor variables in multiple regression. Multivar. Behav. Res. 2000, 35, 1–19. [Google Scholar] [CrossRef] [PubMed]
Publisher’s Note: MDPI stays neutral with regard to jurisdictional claims in published maps and institutional affiliations. |
© 2022 by the authors. Licensee MDPI, Basel, Switzerland. This article is an open access article distributed under the terms and conditions of the Creative Commons Attribution (CC BY) license (https://creativecommons.org/licenses/by/4.0/).