
The Influence of the Resident Subsidy on Regional Carrier Economies and the Environment in the Canary Interisland Air Traffic Network

Departamento de Análisis Económico Aplicado, Campus Universitario de Tafira, Universidad de Las Palmas de Gran Canaria, Edificio Departamental de CC. EE. y EE. Módulo D., 35017 Las Palmas de Gran Canaria, Spain
Tour. Hosp. 2022, 3(3), 558-572; https://doi.org/10.3390/tourhosp3030034
Submission received: 15 April 2022
/
Revised: 18 June 2022
/
Accepted: 21 June 2022
/
Published: 27 June 2022
Abstract
:The existence of aviation subsidies can exacerbate congestion in airports that operate near their maximum threshold. One of the main operational issues in airports, that is, aircraft taxiing operations, could become more difficult and, therefore, produce negative effects on airport capacity management. Air carrier economies, touristic mobility (leisure travel), and the environment could also be negatively affected. Greenhouse gas emissions, passenger travel time, and air carriers’ fuel costs, for example, might rise due to aircrafts’ increased taxiing time. This paper seeks to analyse the impact of regional aviation subsidies for regional hub airports in the Canary Island air traffic network; specifically, the effect it has on airports’ capacity in terms of LTO (landing and taking off) cycle delays and its repercussions for passenger travel time, air carrier economics, and the environment. Therefore, to quantify the extent that the increased traffic from subsidies cause airport ground operations to delay flights, the disturbance between aircraft categories in landing and taking off operations must be considered. The disturbance between aircrafts will be evaluated by employing a simple model of landing intervals considering two aircraft categories (i.e., ATRs-72, ATRs-42, and B737/A320 aircraft families). The above-mentioned methodology provides an approximation of the average processing rate for take-off using the ultimate capacity concept for a variety of aircrafts landing on a single runway of the airport. As a result, it must be noted that there is a potential economic and environmental impact associated with the implementation of the subsidy increase for residents’ interisland travel and from the Canary Islands to the mainland. There is also a negative effect on runways for both airports due to the capacity constraints. These impacts, however, have to be balanced with the social and economic benefits that each regional inhabitant derives from the subsidy in terms of improvement of their mobility for any purpose.
1. Introduction
Tourism refers to mobility for leisure, as well as several other purposes such as business, healthcare, and visiting friends and relatives. By definition, all visitors must stay at least one night at their destination. Such trips are related to the tourism sector and have associated emissions generated by this mobility. There is international evidence, despite the rate of improvement in aircraft fuel efficiency, that the carbon dioxide emissions from air transport will increase steadily after the COVID-19 pandemic period. The emissions from air transport, in the medium term, will continue to grow rapidly [1]. In the absence of any environmental policies oriented to decoupling the growth of the air transport volume related to tourism, both sectors will face the potential risk of being considered the main contributor to climate change. In addition, the slow development in air technology means it is urgent to address the efforts required for regulation to ensure that the air travel demand does not exceed the sustainable rate of growth. The aviation and tourism industries must show interest in improving their environmental performance in order to cultivate a positive image and avoid drastic policy actions in the future [2].
The IPCC recommends reducing worldwide emissions by approximately 50–80% if the target objective is to be reached by 2050. However, as pointed out above, air technology improvements will not be enough to achieve this emission-reduction margin. Hence, solutions must be focused on the demand side. In this sense, the pricing structure and other incentives become relevant [3].
Air transport for peripheral areas such as the Canary Islands has been recognized as a fundamental factor in their development. The Trans-Insular Axis (the subsidiary of the Trans-European Network) in the Canary Islands is a factor of territorial cohesion in the sense that it provides greater accessibility for air passengers from peripheral islands [4]. As pointed out in [5], “social exclusion is not due to a lack of social opportunities but a lack of access to those opportunities”. The Canary Islands have seven islands, and almost all of them are connected by air and sea. The two central islands, Gran Canaria and Tenerife, are the most important in economic terms and therefore have a better connection between each other, as well as with peripheral islands. Except for a few connections with shorter distances of 50–60 miles (Tenerife–Gran Canaria, Tenerife–La Gomera, and Lanzarote–Fuerteventura), where high-speed sea transport is competitive with respect to air transport, in terms of travel time, the rest of the interisland connections, which exceed distances of 80–100 miles, require air transport for inhabitant mobility [4].
The importance of regional (interisland) air transport at Canary airports is remarkable, even at airports with international traffic. In fact, in 2019, 71% of air traffic at Canary airports was of the interisland variety. Obviously, the fragmented territory of the Canary Islands is the determining factor in the importance of regional (interisland) air traffic. Insularity increases the access costs to social and economic opportunities for Canary Island inhabitants. In that sense, the Spanish government has always given priority to the disadvantaged to facilitate the movement of inhabitants, both in connection to the mainland and in terms of interisland mobility. For this reason, air and sea traffic from the islands to the mainland and between the islands has been subsidized since 1982. The purpose is to compensate for the extra costs incurred by freight and passenger traffic as a result of the Canary Islands’ remoteness from the Spanish mainland and Europe. Recently, this allowance has increased from 50% to 75% of the travel price [6].
One of the main objectives of subsidizing regional air transport is improving the population’s air mobility between peripheral regions. Easier access to better job opportunities, health services, and leisure travel is a reasonable argument for subsidizing aviation. This may encourage regional air market development in peripheral areas [7]. However, these kinds of policies can also have perverse effects on airport services management, the environment, and the regional aviation market [8].
In the Canary Island context, in the absence of any climate regulation scenarios, this means that domestic tourism or mobility for any purpose will increase substantially in the coming years, mainly due to the lack of aviation emissions regulations and the incentivization to travel via the resident subsidy. Thus, the consequences in terms of environmental issues for airports must be considered. One of the main operational issues in airports, namely aircraft taxiing operations for landing and taking off, can become more difficult if the airport is congested. At an airport, bottleneck areas where congestion occurs include departure gates, the apron area, taxiways, and the runway. Congestion during taxiing is very common and depends on several factors, such as weather variability, turbulence, runway capacity, aircrafts landing and taking off at the airport, the skills of air control services, and so on [9]. It is crucial to reduce the time required for taxiing at airports in order to provide air services in optimal conditions and avoid congestion. The author in [10] used a simulation approach based on a car congestion model (NS model) to optimize taxiing time. The author estimated an economic benefit in terms of kerosene use of approximately 2.3 million US dollars and a reduction in CO2 emissions of approximately 7000 tons for Tokyo international airport after one year. On the one hand, the approach proposed in [11] makes taxiing for ATRs aircrafts family flows autonomous from any other aircraft processed at the LPA airport. The airport-within-airport approach involves two separate subsystems for landing and take-off that avoid disturbance between aircrafts types in surface operations. The authors pointed out that this mechanism produces an annual reduction in CO2 emissions at the LPA airport by around 1397 tons and a fuel cost saving of EUR 303,911 for regional carriers (Binter Canarias). On the other hand, the extra demand generated by the subsidy increase from 50% to 75% in June 2018 made the traffic flow in LPA airport busier and caused congestion in surface operations. It was estimated that the congestion for the peak month (December 2018) in LPA airport caused an annual fuel cost increase of about EUR 2.47 million and an increase of about 5002 tons of CO2 emissions [6]. Therefore, estimating the magnitude of delays caused by congestion in airports is paramount because they cause economic losses for airlines and environmental impacts, specifically in terms of increasing greenhouse gas emissions.
Delays occur when demand for runway use is greater than those available. Delays occur in the taxi-out phase mainly due to departure air space congestion. The cost of these delays is one of the greatest losses for airlines. In terms of environmental sustainability, it has to be taken into account that, according to the European Green Deal and Flightpath 2050, Europe has to become the first “climate-neutral” continent. The aviation industry is responsible of several environmental impacts. It is considered one of the main contributors to the climate change. For instance, the aviation industry contributes between 1% and 2% of human-made CO2 emissions and other forms of emissions such as NOx. Some efforts have to be made if the goal is to achieve a more sustainable aviation sector [2]. In this aim, it is paramount to establish emissions targets for the aviation industry. In this sense, the subsidy could be a counterproductive policy that acts against those objectives. In the case of the Canary Islands, a balanced analysis has to be implemented to evaluate mobility economic benefits against environmental global objectives. Regional aviation, in the case of archipelagos, is essential in enabling the desired level of residential mobility to incentivise economic activities such as tourism, and to provide health and education services for residents in peripheral islands. The subsidy was justified by the regional government in this way 30 years ago. However, any perverse effect of the resident subsidy has to be taken into account if environmental sustainability principles are to be considered. This might be considered as an externality caused by state aid.
In addition, several studies [12,13,14] found that subsidizing routes reduces competition in the air market and produces higher costs for regional air carriers. The price discounts for residents serve as a direct revenue for regional air carriers and simultaneously mean that non-resident passengers can drop out of the regional air market. In other words, price discount is directly transferred to the airlines, increasing their monopoly power in the air market [12,14]. Nowadays, Binter Canarias is the air carrier that operates all interisland routes in the Canary Islands under public service obligations (PSOs). In 2021, they moved more than 2 million interisland passengers and exerted a monopoly in the regional air market [15]. Binter showed good resilience during the COVID-19 pandemic because of its low dependence on tourism. There are two regional hub airports in the Canary Islands, Gran Canaria and Tenerife Norte. In 2019, these two airports handled around 60% of the total ATM verified by the Canary Island airport network [15]. The price discount for Canary Island residents given by the Spanish government (75%) created an incentive within the Canary Island air market to offer new routes and increase the frequency of flights. Hence, the PSOs regime generates extra demand for flights despite the alternatives such as sea routes between the islands. Finally, one of the main consequences of the implementation of the PSO routes in the Canary Islands is that the airport capacities of the two Canary Island hub airports are being used more intensively than before [13].
In general terms, this study examines the impact of aviation subsidies on the available capacities of the two main regional airport hubs of the Canary Island airport network and the associated environmental and economic impacts. More specifically, we analyse the impact of aviation subsidies on taxiing operations for both Gran Canaria (LPA) and Tenerife North (TFN) airports. Those two airports comprise the main regional aviation infrastructure in the archipelago and the use of their available capacity acts as a bottleneck for the regional air traffic network. The structure of this paper is as follows. Section 2 describes the importance of the airport network in the Canary Islands and describes the methodology of the current study. Here, as we have seen above, two airports are featured from the Canary Islands regional airport network: Las Palmas and Tenerife North. Section 3 estimates, analyses, and discusses the impact of such subsidies on these two airports by calculating the taxiing delay caused by congestion in its ground operations. The airport delay has several implications in terms of economic and environmental issues. Thus, this section calculates the economic and environmental impact of delays in ground operations on the regional air network. Finally, Section 4 highlights the main findings of the study.
2. Materials and Methods
2.1. Airport Network in Canary Island
The Spanish Civil Aviation authority placed the Canary Islands third in a list recording areas with the highest passenger traffic movement in 2018 in Spain. Canary Island airports managed 45.3 million passengers, which represents 17% of the total passenger traffic managed by the Spanish airport network. At the AENA, the top-10 ranking for the highest passenger volume in 2018 included Lanzarote (7.3 million), Tenerife Sur (11 million), and Gran Canaria (13.6 million) airports. In 2018, the Canary Island airports received more than 18 million non-interisland passengers (foreigners and passengers from the rest of Spain). Nearly 14 million of these inflowing passengers were from Europe. However, the interisland passenger volume for the same year was about 4.4 million [15]. This represents an increase of at least 40.6% from the previous year. Tourism depends on people’s mobility and has a strong role to play in the economic development of the islands; air transport and, therefore, airport infrastructure play an essential role to support this economic development [6].
The Canary Islands have eight airports, with two of them being in Tenerife. Those airports can be classified into two different groups, those with heavy international traffic (Gran Canaria, Tenerife Sur, Fuerteventura, and Lanzarote), and the other four (Tenerife Norte, La Gomera, El Hierro, and La Palma), comprising mainly national and local traffic. All interisland routes are operated by Binter Canarias under the Public Service Obligations (PSOs) regime [14]. The 75% allowance for air traffic in the Canary Islands started in June 2018. At the end of 2018, the interisland air traffic had increased by 30% compared with the previous year [15]. The increase in interisland traffic has mainly been seen in the flow of ATR-72 and ATR-42 turboprop aircrafts. The special operational characteristics of these kinds of aircraft could affect operational issues for any airport on the islands. These factors can influence the airport network’s capacity to accommodate the foreseeable increase in traffic volume through Canary Island airports. Table 1 shows some features for the air traffic movements in Canary airports in the last four years.
The growth in air traffic movements between 2017 and 2018 was 24.7%. This was due to the increase in the allowance for resident air traffic in the Canary Islands that started in June 2018. For all the years represented in Table 1, Gran Canaria (LPA) and Tenerife Norte (TFN) airports contributed around 60% of the total interisland air traffic in the Canary Islands. Those two infrastructures could have capacity restrictions in the future due to the growth of interisland air traffic. However, the COVID-19 pandemic brought an inflection point to this traffic growth. LPA and TFN airports verified substantial traffic decreases of about 39.1% and 37.3%, respectively. Despite this, the global air transport market hopes to return to the situation which existed before pandemic. The capacity problems in LPA and TFN will remain for the foreseeable future.
TFN and LPA are hub airports for interisland traffic. They are the only airports that verify direct connections with the rest of the Canary Island airports. Table 2 shows some characteristics for the most passenger-dense routes in the Canary archipelago. The number of passengers per flight for those routes is still low and there is a potential margin for growth. In June of 2018, the subsidy increased for interisland traffic from 50% to 75%, this has acted as an incentive for regional air carriers to offer more flights for interisland routes, mainly the routes between LPA and TFN and between TFN and SPC.
TFN airport has one runway adjacent to the terminal area and is not always available because of special climatological conditions that may affect visibility and therefore the use capacity. This airport is placed on Tenerife Island and it is almost exclusively used for interisland air traffic. Tenerife Island has a second airport that it is used to receive international traffic only. LPA airport has two parallel runways, but they do not allow for simultaneous take-off and landing. The airport uses the runway adjacent to the terminal building because it is always available. LPA airport has a disputed distribution between short-range aircraft and regional turboprop aircraft. This distribution is understandable because of the environment in which the airport is placed; that is, in an archipelago where aircraft are of great importance in the transportation of people and cargo. This is one of the main operational singularities of LPA airport that must be taken into account. In 2018 there were 59,597 ATM (turboprop aircraft) flights, mainly from the ATR72 and ATR42 families. In contrast, short-range aircraft, mainly B737 and A320, verified 71,430 ATMs [15]. In terms of percentage, 45.4% of all aircraft movements at LPA airport were ATRs. Turboprop aircraft have characteristics, such as slow-speed landing, that might affect the operations of other aircraft families and cause congestion at LPA. Consequently, the interisland traffic at LPA airport can interfere with traffic from elsewhere. In addition, after the subsidy increase, the interisland air transport movement for TFN and LPA airports comprised 59.7% of the total traffic in the Canary Island airport network in 2019 [15]. These conditions can pose severe capacity restrictions to operate from both airports.
Subsidizing regional traffic can exacerbate congestion and can produce delays at the airports. Therefore, to quantify the extent to which the increased traffic from subsidies causes delays in airport ground operations and flights, the disturbance between aircraft categories in landing and take-off operations must be considered. The disturbance between aircraft will be evaluated by employing a simple model of landing intervals [16,17,18] considering two aircraft categories (i.e., ATRs and B737/A320 aircraft families). TFN and LPA are seasonal airports with peak periods where the demand is very close to saturation level. This means that taxiing operations could become congested at peak periods, causing delays for air carriers and passengers, and increasing fuel consumption and greenhouse gas (GHG) emissions. Next, taxiing time will be estimated for both LPA and TFN airports.
2.2. Airport Ground Operations Delay Model
The subsidy increase implemented in the air transport market in the Canary Islands could have some implications for the use of the available capacity of airports, mainly for those airports with seasonal capacity restrictions. Congestion occurs due to the concentration of departures near to the runway. Thus, the taxiing ground operation, performed before take-off, is a key factor in managing airport capacity use. Next, an analytical approach to determine the delays of taxiing operations for TFN and LPA airports was implemented. Taxiing operations are affected by runway capacity. In that sense, there are a large number of factors that influence the capacity of the runway: (1) air traffic control, (2) characteristics of demand, (3) weather conditions, and (4) the layout and design of the runway system. However, since no two airplanes are allowed on the runway at the same time, the runway occupancy time may also influence the available airport capacity [18].
The aircraft category used in the regional aviation market is, specifically, turboprop aircraft. The ATR 72-600 is the most advanced turboprop aircraft landing technology produced by ATR aircraft (France). On average, for normal conditions, landing and take-off speeds are about 130 and 160 knots, respectively. The take-off and landing distances are 1333 and 914 m, respectively. The maximum take-off weight is 22,800 kgs. The average operating cost per block-hour can vary depending on how much the aircraft is used during the year. For 100 h a year, the cost is around EUR 5495 per block-hour, and for 1000 h a year, the cost decreases to EUR 2359 per block-hour [19].
Airport ground operations delay is analysed through aircraft congestion during taxiing departure operations. Congestion occurs due to the concentration of departures near to the runway heading. A simple model of landing intervals was developed to estimate the average rate of processing aircraft on runway [6]. This model is a standard delay model that allows the determination of runway capacity. The conditions under the performed model were analysed, considering the mix of aircraft landing at airports, which are mainly turboprop ATR aircraft and B737/A320 aircraft families. There was only one runway serving both arrivals and departures, with different exit taxiway configurations and environmental conditions of VFRs (visual flight rules). This means that the aircraft operate in visual meteorological conditions (VMC, i.e., nice, clear weather).
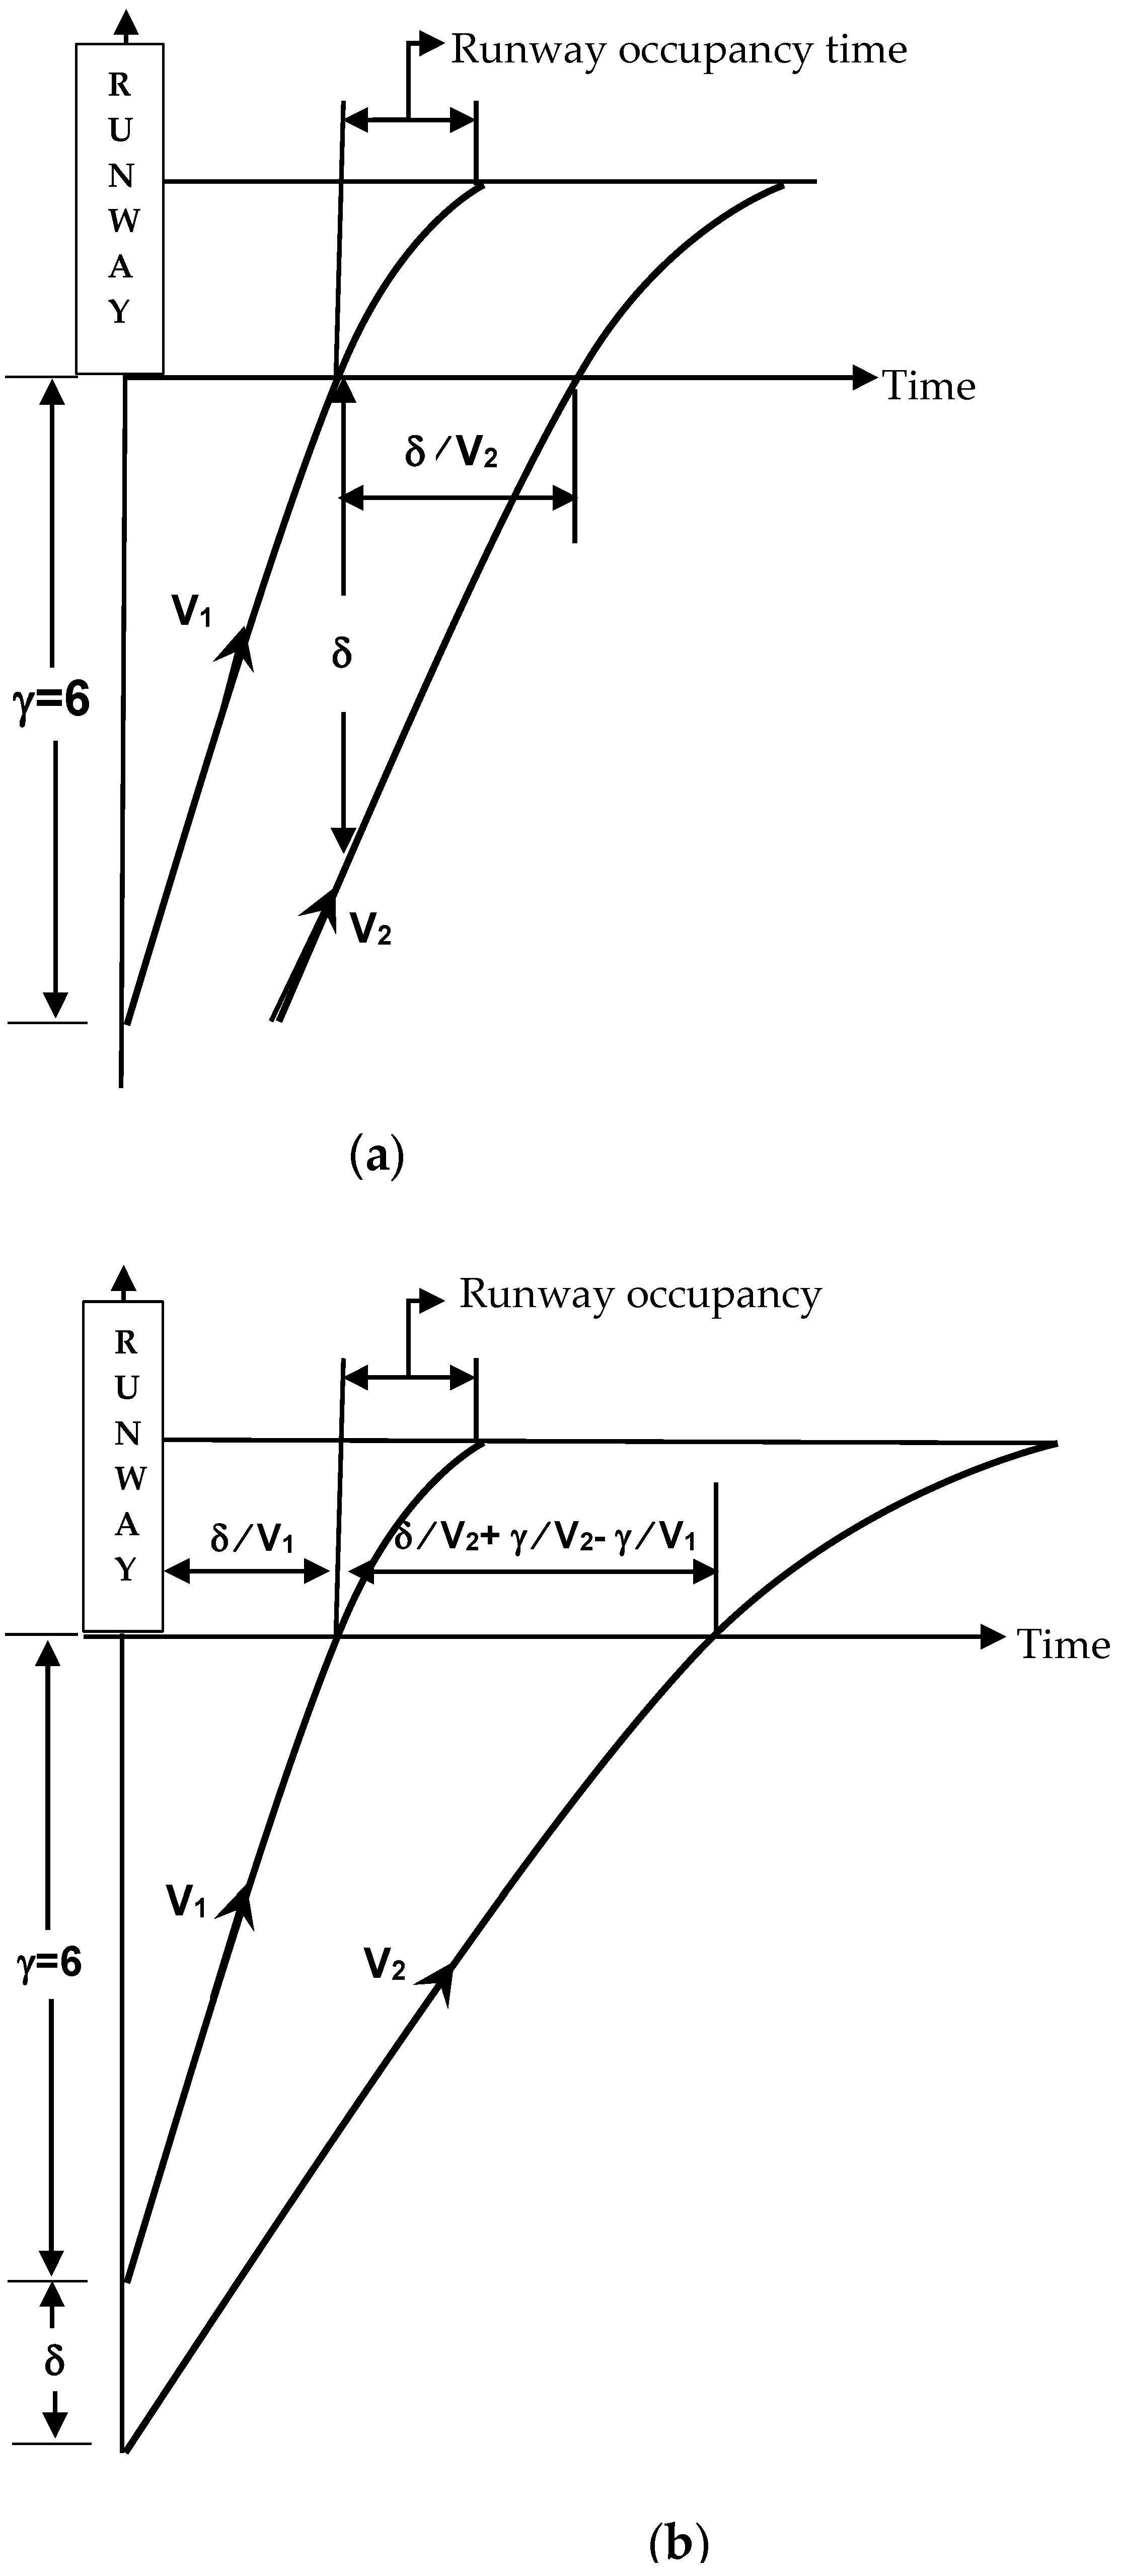
The abovementioned methodology gave an approximation of the average processing rate for taking off using the “ultimate capacity concept” for a mix of aircraft landing on a single runway of the airport. The landing interval model assumes an error-free approach and that pilots are able to precisely maintain the required separations and speeds. Two situations were considered: the “overtaking case”, in which the trailing aircraft has a speed equal to or greater than that of the lead aircraft; and the “opening case”, in which the speed of the lead aircraft exceeds that of the trailing aircraft [6,20]. Figure 1 presents those two schemes.
The following minimum separation function can be applied. In this function, aircrafts are grouped into n discrete speed classes and a matrix of minimum intervals, so that the minimum time separation for each combination of approach speeds can be estimated:
where is the speed of aircraft i; γ is the length of common approach path; δ is the minimum safety separation between aircraft; is the error-free minimum time separation over the threshold for aircraft j following aircraft i. The matrix of minimum intervals is formed for aircraft with speed class i following aircraft with speed class j.
This matrix associates each one of the n speed aircraft classes with a probability of occurrence . These probabilities are the percentages of the various speed classes in the aircraft mix divided by 100. Thus, the expected minimum landing interval or weighted mean service time can be approximated by the following formula:
Finally, the hourly saturation capacity (ultimate capacity) is the inverse of the weighted mean service time:
This model assumes that the runway occupancy times during landing are less than the time separations during approach, and that they have no effect on capacity. The ultimate capacity, C, can be used as a proxy of the waiting time for taking off. The total taxiing delay is estimated through adding the waiting time before taking off and the taxiing time of the route. The expression used to estimate the taxiing time of the route for all kinds of aircraft was:
The ground delay model (Formulas (1)–(6)) was applied to analyse the impact of the resident subsidy on LPA and TFN airport congestion. On the one hand, LPA airport shows an ATR aircraft operations flow of about 63.8% and 36.2% for B737/A320 aircraft families. This aircraft mix is a crucial factor affecting the operational capacity of this airport. The speeds at which different aircraft approach a runway are neither equal nor constant along the approach path. Frequently, separations between aircraft categories which are longer than the minimum allowed by aircraft rules must be tolerated to accommodate a mixture of slow and fast aircraft. In that sense, LPA airport has an additional challenge in managing the landing approach because a margin of safety must be allowed to ensure that the minimum separation is not violated at any point along the approach path. Heavy jet aircraft generate wing-tip vortices that create problems of manoeuvrability and control for smaller aircraft operating in their wake. On the other hand, it has to be pointed out that Tenerife Island has two airports; one of them, TFN airport, is almost entirely dedicated to managing the regional air traffic. Hence, this airport does not show or shows a few the same problems that affect LPA airport. A compromise solution has to be adopted to take into account the interaction effect between aircraft categories [21].
3. Estimations and Results
The subsidy applied to travel between the islands, and from the Canary Islands to mainland Spain, now represents about 75% of market price. The subsidy increased from 50% to 75% in June 2018. From Table 1, in 2018, traffic flow increased by about 34% for both the regional hub airports compared with 2016. This increase was not only due to the subsidy. However, after this increase in subsidy, Binter airlines start developing an aggressive expansion strategy. As is apparent from Table 2, news routes and frequency structures were established, generating new demand. All these routes have an operation base in the two regional hub airports (LAP and TFN). As a consequence, congestion may appear, as a perverse effect, at those two airports. Delays at airports depend on several factors, the main factors include the weather conditions and the traffic congestion in terminal areas. Aircraft taxiing time is associated with aircraft ground operations in the terminal area before take-off and after landing. This time depends on several factors, one of them is the available airport capacity, specifically the number of runways; this, in turn, depends on the aircraft mix using the airport, among other factors. Congestion of aircraft during taxiing is a common occurrence in airports. Hence, when airport congestion occurs, the taxiing phase becomes a key issue. Most research about the taxiing phase is based on the simulations model and queuing theory [6,9,10,16,17,20]. The main objective of such research involves simulating a taxiing model in order to improve taxiing time operations and to avoid delays at airports. In [8], authors estimated the annual economic benefit of simulating reduction in taxiing time.
Therefore, it must be pointed out that the emissions and fuel costs estimated for those two airports in this study, during the taxiing phase, cannot be considered as additional emissions and fuel costs due to the subsidy increase. The aim was to show the worst congestion situation at the two busiest airports in a peak month of the year. However, to make a comparison between two situations before and after the subsidy increase, a sensitivity analysis was performed. The model was estimated with the parameters for the year 2017. This made it possible to verify changes in the estimated parameters before and after the increase in the allowance. Moreover, the objective was not to compare emissions and fuel costs before and after the subsidy increase; the main objective was to simulate a peak situation for the busiest airports in the Canaria airport network after the subsidy increase, using real data. Therefore, the ground delay model was implemented for a peak month, which was established by inspecting the flow data for the last three years at LPA and TFN airports. December was the peak month for those three years. Thus, the model was implemented in December for 2018, just six months after the subsidy increase, and for 2017. The results were estimated in a context of no conflicts between aircraft categories. The annual results for the two airports and for the two years of the study are presented in Table 3 and Table 4.
3.1. Waiting Time before Take-off
Different aircraft categories interact at the airport during landing and take-off operations and compete for airport capacity use. Thus, the mix of aircraft is crucial in optimizing capacity and allowing air services to be adequately controlled [6,17]. The disturbance between aircraft was evaluated by employing the model of landing intervals (see above) considering two aircraft categories (i.e., ATRs and B737/A320 aircraft families) for LPA and TFN airports. The LPA matrix of minimum intervals was estimated using an average mix of aircraft by 36.8% for ATRs and 63.2% for B737/A320 families. TFN airport manages mainly interisland traffic and the matrix used has an average aircraft mix of 69.2% for ATRs and 30.8% for B737/A320 families. The length of the common approach path considered was about 6 nautical miles, with a minimum separation of 3 nautical miles. The approach speed for ATRs was 130 knots, and for B737/A320 families this was about 160 knots [6]. The complete matrices, M, and the ultimate capacity, C, computed for LPA and TFN airports, respectively, were as follows:
The average peak hour operations for LPA and TFN airports in December 2018 were about 53 and 38 operations per hour, respectively, including landing and taking off [21]. The model estimated around 26 arrivals/h for LPA and 21 arrivals/h for TFN airport. Those values are just half the hourly saturation capacity for both airports. In other words, if we consider landing and taking off conjointly, then we approach the maximum saturation level in December 2018. Those values are very near the hourly saturation capacity of both airports. This means that the available capacity of those airports was reduced; therefore, taxiing delays could occur. Formula (5) gives us the weighted mean service time for the airport. LPA verifies a weighted mean of the landing time of 138 s, for TFN this value is 168 s. As long as an aircraft landing runway remains occupied, aircraft cannot take off. Thus, those times can be approximated as the waiting time on the head of the runway before take-off.
3.2. Taxiing Time in Route
With respect to the taxiing time of a route, certain aspects must be clarified. ATR aircraft very often have “power-back unassisted” technology, in contrast to the B737/A320 aircraft families. It will be assumed that ATRs take 31.89 s on each power-back, and on 30% of occasions, ATR aircraft perform power-backs before taxiing, while B737/A320 aircraft families take 205.83 s and perform push-back on about 50% [11]. With respect to other ground operations for taxiing, both ATRs and B737/A320 aircraft are restricted to a maximum speed of 20 m/s [11]. The estimation of taxiing time was performed by taking the distances as a reference, with respect to the farthest parking stand from the runway, for the two categories of aircraft and both airports. In LPA airport, the ATRs’ farthest stand is about 1200 m from the runway. For the B737/A320 family of aircrafts, the farthest stand is around 2375 m from the runway. At TFN airport, those distances for each kind of aircraft are 425 m for ATRs and 755 m for B737/A320 aircrafts [21].
The configuration of the taxiing route at both airports implies the existence of a common route where disturbance between aircraft might appear. However, if a natural segregate subsystem to separate the taxiing of ATRs from the B737/A320 aircraft is applied, then potential interference between taxiing aircraft is removed [11]. Hence, to estimate taxiing time of a route for both aircraft families, the “no disturbances” scenario was considered for both airports. In this case, the taxiing time of a route only depends on the distance from the spot and aircraft speed taxiing. The overestimation that could result from considering the farthest parking stand could compensate the hypothesis of the “no disturbances” scenario. In other words, the farthest parking stand was selected considering the worst-case scenario for compensating an aircraft’s common route without conflict effects. Therefore, the taxi time of a route with the previously viewed dates above, for each kind of aircraft, and for LPA and TFN airports, respectively, would be:
LPA airport:
Taxi time of a route ATR = (1200 m/20 m/s) + (31.89 seg. × 0.3) = 69.57 seg.
Taxi time of a route 737s/A320 = (2375 m/20 m/s) + (205.83 seg. × 0.5) = 221.66 seg.
TFN airport:
Taxi time of a route ATR = (425 m/20 m/s) + (31.89 seg. × 0.3) = 30.82 seg.
Taxi time of a route 737s/A320 = (755 m/20 m/s) + (205.83 seg. × 0.5) = 140.67 seg.
According to data published in [19], the fuel consumption for taxiing an ATR 72-600 aircraft is about 6 kg/min. For B737/A320 aircraft, the fuel consumption for taxiing is approximately 13.6 Kg/min [22]. The stoichiometries relationship of 3.15 kg of CO2 per kg of fuel burnt allowed us to estimate the volume of CO2 emissions [23]. Additionally, the fuel price published in [24], for December 2018, was 1.81 EUR/kg (using a conversion factor of 1 US dollars = EUR 0.84 and a kerosene density of 817 kg/m3). Using those values, it is possible to estimate the values for the waiting time before take-off, taxiing time, fuel cost, and CO2 emissions for both airports and for the periods of this study. These results are shown in Table 4 and Table 5.
These values have been estimated per air traffic movement (ATM) through considering those values as an average and multiplying them per annual ATM for each airport; thus, the annual fuel cost and CO2 emissions for each of the aircraft categories may be obtained. Table 4 shows those estimations. As is apparent from Table 4, there is a potential economic and environmental impact associated with the implementation of the subsidy increase for resident interisland travel and for travel from the Canary Islands to the mainland. There is also a negative effect on the runway for both airports due to the capacity constraints. In addition, the subsidy given by the government must be quantified and its opportunity cost must be estimated. In terms of PSO routes, with the dates from Table 2 and Table 3, the main PSO route between LPA and TFN airports verified an annual emissions volume of about 1200 tons: 30.8% and 36.3% of the total annual emissions for LPA and TFN airports, respectively. In order to perform a sensitivity analysis, Table 4 was reproduced for 2017. Considering all the parameters for that year, Table 5 shows the results. The LPA matrix of minimum intervals was estimated using an average mix of aircraft by 31.3% for ATRs and 68.7% for B737/A320 families. The TFN airport manages mainly interisland traffic and the matrix used has an average aircraft mix of 62% for ATRs and 38% for B737/A320 families. As can be seen, in 2018, the percentage of flights between islands with ATR technology increased with respect to the short-run aircraft for both airports. In contrast, the proportion of B737/A320 aircraft families also decreased for the two airports.
As can be seen in Table 5, for 2017, the estimated amounts are lower than those in 2018. This means that, when there is an increase in the subsidy for residents of the Canary Islands, airports experience a substantial change in fuel cost and annual emissions for the two categories of aircraft considered in the study. It should be noted that, in 2018, demand for interisland flights increased substantially. For example, the increase in ATMs for the ATR category at both airports increased by 26.6% for LPA and by 23.05% for TFN. The airlines also increased their offer, encouraged by the increase in the subsidy. There are therefore effects on both sides of the market.
3.3. Discussion
Congestion is viewed as the most immediate problem facing aviation in Europe. It has been estimated that delays in the air and on the ground have huge financial costs for the aviation industry. In addition, the growing concern over global warming and greenhouse gas emissions means that the pollution from aircraft is under increased scrutiny. As was pointed out in [7], when one considers the consequences of subsidies in combination with the growing capacity of aviation systems and climate-change-related impacts, the subsidy mechanism does not seem to be an adequate measure for the aviation sector. For instance, one historical tendency in the aviation sector is to take the view that the economic benefits of the sector outweigh its costs in terms of contamination and congestion. However, significant empirical evidence shows that this is not true [2,3,8]. Therefore, internalizing such costs is the first step towards a change in the current scenario.
On the one hand, in economic terms and in the absence of technological change, pollution and congestion can be internalized through several mechanisms (for instance, kerosene tax, emissions trading systems). Those mechanisms also could generate an incentive for technological change. On the other hand, such mitigation policies could make air transport more expensive and, in the near future, less available. The consequences for the tourism industry are clear. The increased share of air transport in international and domestic trips could compromise the growth of a labour-intensive sector such as the tourism industry.
Therefore, policymakers have to estimate tourists’ willingness to pay (WTP) for mitigating climate change before actuating on the demand side. The authors of [25] found that the WTP for airline passengers depends on their personal income and the number of flights. The WPT for the carbon offset was around 39 US dollars. This means there is room to implement carbon-offset policies. This demand-side policy is related to supply-side policies. If ticket prices are increased, with airlines passing the carbon cost to their passengers, then demand could be affected and cause the supply to decrease. This could incentivise airlines to invest in technological development, for instance, through fleet renewal with investments in more fuel-efficient jet engines. One further suggestion, when they become commercially available, is the use of hybrid–electric aircraft or hydrogen aircraft. In [26], the authors point out that there are a lot of challenges to be overcome before this kind of technology becomes commercially available. However, they believe that such technology could deliver substantial benefits to small-scale regional aircraft.
One way to optimize airport capacity could be to change taxiing operations. The conflict between aircraft categories was noted as a relevant factor for the management of airport capacity and for improvements to taxi operations. The authors of [11] found that using the airport-within-airport procedure in LPA airport could produce economic and environmental benefits in terms of saving fuel costs and reducing emissions. This approach can reduce the interference between aircraft categories, and taxiing time was shown to decrease by about 76% in the case of the ATR category.
4. Conclusions
On the one hand, this study has shown that the implementation of a subsidy increase for Canary Island residents has produced substantial economic and environmental impacts. If we compare the data obtained in this study for the year 2017, just before the increase in the mobility subsidy for residents of the Canary Islands, and the data for the year 2018, we can conclude that there has been a significant increase in the activities of the two airports studied. From the airline’s point of view, this subsidy causes an increase in fuel costs and carbon dioxide. The cost of fuel and CO2 emissions grew by approximately EUR 2.8 million and 3.097 tons, respectively. These results are consistent with those found in empirical evidence [9,10,11]. In addition, it must be pointed out that this subsidy produces an increase in ground operation time and, therefore, an increase in runway occupancy. On the other hand, we have to keep in mind that those impacts are underestimated because the disturbance in taxiing route operations between aircraft was not considered; consequently, the waiting time before taking off would probably be higher.
Subsidizing air transport and PSOs implementation has generated extra demand for flight in the Canary Island’ interisland air traffic market. Furthermore, it has to be taken into account that the most of those subsidies go to those Canary Island inhabitants who have a higher-than-average income and fly frequently. Therefore, the policy results in regressive income redistribution. In that sense, a possible solution could establish a discount system for the airfare related to the income level of the passenger [27]. This also could be a way to charge according to the willingness to pay for the emissions impact of current aircraft technologies. This new discount system could evaluate the inclusion of the non-resident tourists.
On the other hand, subsidies can attract new operators to the air market; however, existent air companies often implement an aggressive pricing strategy to make it difficult for new operators to start up, thus driving them out from the market. The final outcomes include increased market concentration and monopoly power, which have been shown through empirical evidence [12,13,14]. Binter Canaria S.L., an air operator in the Canary Islands, began to develop through an aggressive expansion strategy after the subsidy increased to 75%. The main strategies have been to develop new routes and to increase flight frequency to attain the subsidies.
This study shows the importance of evaluating the impacts of new economic regulations and their potential to distort the market mechanism. The aviation sector has been excluded from carbon policies, which leads to, at least, a kind of cross subsidy (negative tax). The surface transport sector perhaps pays for their environmental impact more than they should. The argument has always been that mitigation measures might be more expensive compared with other sectors [27]; subsidizing pricing to incentivise resident mobility could produce perverse effects in terms of increased emissions and airport congestion. However, no one of the aviation industry blames public administration for the inefficiency of their economic regulations—the eternal double measuring stick. In this sense, these environmental impacts caused by resident subsidies must be balanced with the social and economic benefits that each regional inhabitant derives from the subsidy in terms of the improvement in their mobility. This is a necessary extension of this research.
In a complementary way, as it was established in [26], a natural extension of this work would be to implement a cost/benefit analysis for the introduction of hybrid–electric aircraft for regional mobility in the Canary Islands. Analysing whether this kind of technology could decrease the perverse effects of the subsidy, which is valuable in incentivising increased air mobility among Canary Island inhabitants. However, this advanced technology is slow to become commercially available and, in the meantime, any regulation to compensate for the perverse effects of the subsidies is needed to limit the environmental impacts. Additionally, further work needs to determine and quantify the need for additional runway capacity in the airports. This would allow us to determine how the increase in the subsidy affects congestion and thus the quality of airport services. Finally, a more technical analysis might explore the implementation of similar procedures considering interferences between aircraft categories in taxiing route operations.
Funding
This research received no external funding.
Institutional Review Board Statement
The study was conducted in accordance with the Declaration of Helsinki, and approved by the Institutional Review Board.
Informed Consent Statement
Not applicable.
Acknowledgments
We want to give thanks to the Las Palmas University to use their infrastructure for this research.
Conflicts of Interest
The authors declare no conflict of interest.
References
- Mayor, K.; Tol, R. Scenarios of carbon dioxide emissions from aviation. Glob. Environ. Chang. 2010, 20, 65–73. [Google Scholar] [CrossRef] [Green Version]
- Rothengatter, W. Climate change and the contribution of transport: Basic facts and the role of aviation. Transp. Res. Part D 2010, 15, 5–13. [Google Scholar] [CrossRef]
- Bows, A.; Anderson, K.; Peeters, P. Air transport, Climate Change and Tourism. Tour. Hosp. Plan. Dev. 2009, 6, 7–20. [Google Scholar] [CrossRef]
- Hernández, J.A. The role of inter-island air transport in the Canary Islands. J. Transp. Geogr. 2014, 12, 235–244. [Google Scholar] [CrossRef]
- Preston, J.; Rajé, F. Accessibility, mobility and transport-related social exclusion. J. Transp. Geogr. 2007, 15, 151–160. [Google Scholar] [CrossRef]
- Rendeiro-Martín-Cejas, R. Resident air transport subsidy impact on airport ground operations: Gran Canaria airport case study. Case Stud. Transp. Policy 2021, 9, 1097–1105. [Google Scholar] [CrossRef]
- Gössling, S.; Fichert, F.; Forsyth, P. Subsidies in Aviation. Sustainability 2017, 9, 1295. [Google Scholar] [CrossRef] [Green Version]
- Dubois, G.; Peeters, P.; Ceron, J.-P.; Gössling, S. The future tourism mobility of the world population: Emission growth versus climate change. Transp. Res. Part A 2011, 45, 1031–1042. [Google Scholar] [CrossRef]
- Kariya, Y.; Mase, T.; Yoshihara, S.; Ota, J. Analysis of congestion of taxiing aircraft at a large airport. In Proceedings of the 2011 IEEE International Conference on Robotics and Biomimetics, Phuket, Thailand, 7–11 December 2011. [Google Scholar]
- Mori, R. Aircraft taxiing model at congested airports. In Proceedings of the 28th International Congress of The Aeronautical Sciences, Brisbane, Australia, 23–28 September 2012. [Google Scholar]
- Lorenzo-Aparicio, F.; Rendeiro Martín-Cejas, R. The economic and environmental benefits of runway capacity optimization: The case of Gran Canaria airport. J. Airpt. Manag. 2017, 11, 420–435. [Google Scholar]
- Calzada, J.; Fageda, X. Competition and public service obligations in European aviation markets. Transp. Res. Part A 2014, 70, 104–116. [Google Scholar] [CrossRef]
- Calzada, J.; Fageda, X. Discounts and Public Service Obligations in the Airline Market: Lessons from Spain. Rev. Ind. Organ. 2012, 40, 291–312. [Google Scholar] [CrossRef]
- Santana, I. Do Public Service Obligations hamper the cost competitiveness of regional airlines? J. Air Transp. Manag. 2009, 15, 344–349. [Google Scholar] [CrossRef]
- Aeropuertos Españoles y Navegación Aérea (AENA). Air Traffic Statistics Report. Available online: https://wwwssl.aena.es/csee/Satellite?pagename=Estadisticas/Home (accessed on 2 April 2020).
- Kariya, Y.; Yahagi, H.; Takehisa, M.; Yoshihara, S.; Ogata, T.; Hara, T.; Ota, J. Modeling and designing aircraft taxiing patterns for a large airport. Adv. Robot. 2013, 27, 1059–1072. [Google Scholar] [CrossRef]
- Ignaccolo, M. A simulation model for airport capacity and delay analysis. Transp. Plan. Technol. 2003, 26, 135–170. [Google Scholar] [CrossRef]
- Eisenhat, D.; Moebs, N.; Windels, E.; Bergmann, D.; Geib, I.; Reis, R.; Strohmayer, A. Aircraft requirements for sustainable regional aviation. Aerospace 2021, 8, 61. [Google Scholar] [CrossRef]
- Aerocorner: ATR 72-600 Airplane Characteristics. Available online: https://aerocorner.com/aircraft/atr-72-600/ (accessed on 2 April 2020).
- Yu, C.; Lau, H. Integrated Optimization of Airport Taxiway and Runway Scheduling. J. Autom. Control Eng. 2013, 2, 338–342. [Google Scholar] [CrossRef] [Green Version]
- Aeropuertos Españoles y Navegación Aérea (AENA). Plan Director of Las Palmas and Tenerife Norte Airports. 2015. Available online: https://www.mitma.gob.es/areas-de-actividad/aviacion-civil/politicas-aeroportuarias/integracion-territorial-aeroportuaria/planes-directores/norte/plan-director-del-aeropuerto-de-tenerife (accessed on 16 April 2022).
- ICAO. Doc 8168 OPS/611 Aircraft Operations. Volume I Flight Procedures. 2006. Available online: http://www.chcheli.com/sites/default/files/icao_doc_8168_vol_1.pdf (accessed on 22 April 2020).
- IPCC Guidelines for National Greenhouse Gas Inventories. Institute for Global Environmental Strategies (IGES). Hayama, Japan. 2006. Available online: https://www.osti.gov/etdeweb/biblio/20880391 (accessed on 15 April 2020).
- International Air Transport Association (IATA). 2019. Available online: https://www.iata.org/contentassets/c81222d96c9a4e0bb4ff6ced0126f0bb/iata-annual-review-2019.pdf (accessed on 15 April 2020).
- Rong-Chang, J.; Chen, T.-Y. Willingness to pay of air passengers for carbon-offset. Sustainability 2015, 7, 3071–3085. [Google Scholar] [CrossRef] [Green Version]
- Flecther, S.; Flynn, M.-C.; Jones, C.E.; Norman, P.J. Hybrid Electric Aircraft: State of the Art and Key Electrical System Challenges. The Transportation Electrification. eNewsletter, September 2016, 1–6. Available online: https://tec.ieee.org/newsletter/september-2016/hybrid-electric-aircraft-state-of-the-art-and-key-electrical-system-challenges (accessed on 14 April 2022).
- Martínez, A.; González-Sánchez, V. Efficiency and Sustainability of Regional Aviation on Insular Territories of the European Union: A case Study of Public Service Obligations on Scheduled Air Routes among the Balearic Islands. Sustainability 2021, 13, 3949. [Google Scholar] [CrossRef]
Figure 1.
Landing interval model: “overtaking case” (a) and “opening case” (b).

Table 1.
Interisland air traffic movement (ATM) evolution.
| Airports/Years | 2020 | 2019 | 2018 | 2017 | 2016 |
|---|---|---|---|---|---|
| Gran Canaria (LPA) | 36,254 | 59,570 | 59,597 | 47,054 | 39,382 |
| Tenerife Norte (TFN) | 33,796 | 53,872 | 52,927 | 43,010 | 34,442 |
| Lanzarote (ACE) | 14,865 | 24,335 | 23,893 | 20,387 | 16,729 |
| Fuerteventura (FUE) | 12,152 | 19,907 | 20,019 | 16,518 | 13,499 |
| La Palma (SPC) | 12,040 | 19,002 | 18,250 | 13,771 | 12,424 |
| Tenerife Sur (TFS) | 3308 | 5337 | 4368 | 3032 | 2385 |
| El Hierro | 4010 | 5204 | 4930 | 4066 | 3267 |
| La Gomera (GMZ) | 1918 | 2641 | 2648 | 1778 | 1378 |
| Total | 118,343 | 189,868 | 186,632 | 149,616 | 123,506 |
Source: Compiled by author with data from AENA [15].
Table 2.
High-density routes (2019).
| PSO Routes | ATM 1 | Pax 2 | LF 3 |
|---|---|---|---|
| TFN–LPA | 18,665 (24.4%) | 1000,646 (26.2%) | 53.6 |
| TFN–SPC * | 14,951 (36.8%) | 759,096 (24.4%) | 50.8 |
| LPA–ACE * | 15,137 (23.2%) | 806,996 (22.7%) | 53.3 |
| LPA–FUE * | 12,885 (26.3%) | 667,879 (24.5%) | 51.8 |
* SPC—Santa Cruz de La Palma; ACE—Lanzarote; FUE—Fuerteventura. 1 ATR—annual air traffic movements (in brackets percental increases respect to 2017). 2 Annual resident passenger number (in brackets percental increases respect to 2017). 3 Number of passengers per flight. Source: Compiled by author with data from AENA [15].
Table 3.
Total time delay, fuel cost, and CO2 emissions per ATM.
| Airport | Aircraft Categories | Waiting Time 1 (seg.) | Taxiing Time 2 (seg.) | Fuel (kg) | Fuel Cost (EUR) | CO2 (kg) |
|---|---|---|---|---|---|---|
| LPA | ATRs | 138 | 69.57 | 20.76 | 37.6 | 65.4 |
| B737/A320 | 138 | 221.66 | 81.6 | 147.7 | 257 | |
| TFN | ATRs | 168 | 30.82 | 19.86 | 35.9 | 62.5 |
| B737/A320 | 168 | 140.67 | 69.36 | 125.5 | 218.5 |
1 Waiting time before take-off is considered the same for both aircraft categories. 2 Taxiing time considers the segregated subsystem for taxiing. Source: own elaborated data.
Table 4.
Annual fuel cost and CO2 emissions for taxiing operations (2018).
| Airports | Aircraft Categories | Annual Fuel Cost (EUR) | Annual CO2 (ton.) |
|---|---|---|---|
| LPA | ATRs | 2,240,847.2 | 3897.6 |
| B737/A320 | 10,550,211 | 18,357.5 | |
| Total | 12,791,058.2 | 22,255.1 | |
| TFN | ATRs | 1,051,130.2 | 3307.9 |
| B737/A320 | 2,959,290 | 5152.2 | |
| Total | 4,010,420.2 | 8460.1 |
Source: own elaborated data.
Table 5.
Annual fuel cost and CO2 emissions for taxiing operations (2017).
| Airports | Aircraft Categories | Annual Fuel Cost (EUR) | Annual CO2 (ton.) |
|---|---|---|---|
| LPA | ATRs | 1,353,711.87 | 2665.35 |
| B737/A320 | 9,347,157.1 | 18,002.03 | |
| Total | 10,700,868.9 | 20,667.38 | |
| TFN | ATRs | 930,271.8 | 2421.27 |
| B737/A320 | 2,300,631.4 | 4529.36 | |
| Total | 3,230,903.2 | 6950.63 |
Publisher’s Note: MDPI stays neutral with regard to jurisdictional claims in published maps and institutional affiliations. |
© 2022 by the author. Licensee MDPI, Basel, Switzerland. This article is an open access article distributed under the terms and conditions of the Creative Commons Attribution (CC BY) license (https://creativecommons.org/licenses/by/4.0/).
Share and Cite
MDPI and ACS Style
Martín-Cejas, R.R. The Influence of the Resident Subsidy on Regional Carrier Economies and the Environment in the Canary Interisland Air Traffic Network. Tour. Hosp. 2022, 3, 558-572. https://doi.org/10.3390/tourhosp3030034
AMA Style
Martín-Cejas RR. The Influence of the Resident Subsidy on Regional Carrier Economies and the Environment in the Canary Interisland Air Traffic Network. Tourism and Hospitality. 2022; 3(3):558-572. https://doi.org/10.3390/tourhosp3030034
Chicago/Turabian StyleMartín-Cejas, Roberto Rendeiro. 2022. "The Influence of the Resident Subsidy on Regional Carrier Economies and the Environment in the Canary Interisland Air Traffic Network" Tourism and Hospitality 3, no. 3: 558-572. https://doi.org/10.3390/tourhosp3030034