Abstract
Climate change is impacting the distribution of climate resources upon which nature-based tourism and recreation depends. Accordingly, we examine the global distribution of climate resources from 1948 to 2016 using the Camping Climate Index (CCI), a composite index previously validated for camping and national parks visitation for 80% of the world’s major climate types found in the United States. Calculating the CCI globally, spatial and temporal analysis indicates that climate suitability differs greatly for nature-based tourism and that changes have occurred over the last 50 years in many destinations. Locations with higher latitudes and altitudes have primarily experienced shifts towards more favorable climate conditions. Conditions have worsened in tropical and subtropical regions such as central Africa, central Australia, and Southern Asia. Results demonstrate that the redistribution of global climate resources for nature-based tourism and recreation is primarily driven by warming temperatures and the increased frequency of extreme weather events in some regions. Study findings are of particular interest to destination managers and planners of outdoor locations susceptible to weather and climate change.
1. Introduction
Tourism is a trillion-dollar industry that contributed approximately 10.4% to the global GDP in 2019 [1]. International tourism has increased 56-fold from 25 million tourist arrivals in 1950 to 1.4 billion in the year prior to the COVID-19 pandemic [2], with nature-based tourism being one of the fastest-growing tourism segments globally [3]. Nature-based tourism and recreation rely on the natural environment and wildlife, and include activities like camping, hiking, and sightseeing, often in parks and protected areas [4,5]. The outdoor nature of such tourism and recreation activities makes them susceptible to weather, climate, and, over the course of decades, climate change. In the tourism climatology literature, meteorological variables (i.e., temperature, precipitation) that influence tourist behaviors are referred to as climate resources [6,7,8]. To inform destination management and planning, the goal of this study is to (1) document the global spatial and temporal distributions of climate resources for nature-based tourism and recreation, and (2) examine how these resources have changed over the last seven decades.
1.1. Camping: Nature-Based Tourism and Recreation
We focus on camping because of its representativeness of the nature-based tourism industry as a nature-based tourism accommodation and a form of recreation activity [9,10,11]. Camping involves travel with one or more nights away from home in a temporary dwelling such as a tent or mobile recreational vehicle (RV) [12]. Camping has significantly increased in popularity over the last 20 years, particularly during the pandemic, and stimulates economic activities around the globe.
International interest in camping is highlighted by camping review articles by Brooker and Joppe [9] and more recently by Rogerson and Rogerson [11]. In Canada, the RV industry has grown over 200% from 2010 to 2017, contributing to over $7 billion in retail sales annually [13]. In the US, there were over 86 million active camping households in 2020, and the proportion of first-time campers grew from 4% to 21% from 2019 to 2020 [14]. A study [15] foresees a stable growth rate of 7.6% between 2019 and 2029 for the camping and caravanning markets in countries such as Thailand, the Philippines, India, Brazil, and the UAE. Among all, the European region is expected to retain a leading position in the global camping industry with growing trends in mobile homes and billions of tent turnovers in the region [16]. With an increasing number of millennial campers and the rise in global demand for camping facilities, the camping segment is anticipated to show a relatively higher growth rate compared to some other tourism segments. Yet, camping—a sub-sector of nature-based tourism and recreation—remains understudied in many countries throughout the world, particularly in developing markets [11,17].
There have been two major developments that have increased the popularity and demand for camping around the world. First, the variety of accommodations, services, and amenities available to camping tourists has greatly expanded in the last 20 years (e.g., [18,19,20]). For instance, camping and its recent modern extensions (e.g., ‘glamping’, RV life) “offers modern amenities (e.g., WIFI) available in a variety of accommodation structures including cabins, treehouses, and tents thus removing many of the discomforts of traditional camping.” [21] (p. 1). Traditionally, tourists needed to have access to their own equipment, but recent innovations (e.g., cabin-camping, shared economy) have also made camping more accessible to a diverse range of new and experienced campers [11,19]. Second, the demand for camping increased globally during the COVID-19 pandemic due to international and domestic travel restrictions and relative health safety (e.g., socially distant, outdoors) compared to other accommodations and holiday activities [22,23,24].
1.2. Weather and Climate
Weather and climate significantly influence the length and comfort of nature-based tourism and recreation seasons [7,25,26,27,28,29], destination choice [30,31,32], and the willingness to pay [33,34]. Tourism vulnerabilities of park and nature-based tourism to climate change are well documented [8,35,36], where recent studies have highlighted that climate change creates both threats and opportunities (e.g., [37]). Warmer temperatures are generally associated with higher outdoor tourism activities [38,39]. Travel frequency and tourism expenditure increase as temperature increases [40,41]. Observed changes in climate have already expanded camping and park operation seasons in parts of North America and north and central Europe, in some instances by over a month, due to improved spring and fall shoulder seasons [6,37,42,43,44,45,46]. Others have raised concerns about intense heat reducing park and camping visits [38,47,48] and empirically demonstrated that the higher frequency and intensity of extreme weather (a consequence of climate change) can adversely affect camping [49]. For instance, intense heat and wildfire in California, United States necessitated the evacuation of more than 200 campers from the Sierra National Forest in summer 2020 [50,51]. Climate change-induced extreme weather (e.g., record-breaking heatwaves, heavy rainstorms) are exposing the individual campers to higher risks [52,53]. Despite being a global phenomenon highly dependent on weather and climate variability, there have been no studies on a global scale to (1) measure climate resources for camping, (2) assess ongoing changes in climate resources for camping/camping seasons, or (3) examine changes in the frequencies of extreme weather events of importance to camping safety and experience.
We address these research gaps as the first study to globally quantify the long-term distribution of climate resources for camping. Climate resources are holistic measures of multiple meteorological variables that influence tourist comfort, experience, and decision-making as well as tourism operator organizational performance (e.g., camping occupancy or sales) [8]. We utilize the Camping Climate Index (CCI) [54] to quantify long-term averages and changes for camping climate resources from 1948 to 2016 globally. The CCI is a data-driven tourism climate index that combines seven meteorological variables and threshold levels (e.g., extreme precipitation and temperature) that influence camping and other nature-based tourism activities [54]. The CCI has been validated at for-profit [54] and non-profit campgrounds [6] across the US. Validation efforts occurred in the United States using daily and monthly nature-based tourism data [6,54] for locations in four of the world’s five major Köppen climate types (i.e., tropical, dry, temperate, continental) that occur in the USA. Studies have matched the CCI with survey data about travel plans in addition to observed camping occupancy. Responses from a national survey in the USA revealed that travelers who experience better CCI are more likely to take camping trips in the USA [24]. Retrospective time-series analysis suggested the inclusion of the exogenous CCI variable improved the forecast accuracy for camping occupancy at 36 US National Parks by an average of 9.23% for tent camping and 8.61% for RV camping [55]. In addition, the identified weather thresholds within CCI are highly consistent with the camping [47,56] and park visitation [39,57,58] in other studies (see Supplemental Table S1), suggesting the suitability of applying the CCI in other countries and diverse geographical markets.
2. Materials and Methods
2.1. Climate Data
Seven climate variables are required to calculate the CCI, including daily maximum temperature, minimum temperature, mean temperature, dew point temperature, precipitation, wind speed, and sunshine hours. Sunshine hours and cloud cover share similar properties and can be used interchangeably based on data availability. Sunshine hours are not readily accessible on the global scale. Therefore, we used downward incoming solar radiation and geo-coordinates to calculate sunshine hours using the Allen et al. [59] methodology, a method widely recognized by varied disciplines [60,61,62]. The near-surface meteorological data for the seven variables were obtained from the hybrid reanalysis-observational dataset (version 3 updated to 2016) [63], which has been extensively validated and utilized in other climatological studies (e.g., [64,65,66]). The dataset was downloaded from Terrestrial Hydrology Research Group (http://hydrology.princeton.edu/data/pgf/v3/0.25deg/daily/, accessed on 21 November 2021). The dataset has a daily frequency from 1 January 1948 to 31 December 2016 and covers the global land area with 0.25 ∗ 0.25-degree spatial resolution.
2.2. The Camping Climate Index
The CCI captures the suite of climate resources (i.e., meteorological variables and extremes) of importance to camping and other comparable nature-based tourism activities (e.g., national park visitation). The CCI was developed and validated based on revealed preferences determined from daily camping occupancy data between 2007 and 2016 at 29 business campgrounds [54] and monthly visitation data between 1981 and 2019 at 11 National Parks [6] throughout the United States. As outlined by Ma et al. [54], thermal comfort and aesthetic appeal (i.e., sunshine hours) are of approximately equal importance to camping. Physical states of the atmosphere (i.e., precipitation and wind speed) and extreme thermal states (i.e., maximum and minimum temperature) can cause an overriding effect regardless of thermal comfort and aesthetic appeal. The weather variable threshold values were determined by a series iterative correlation where the highest correlation between camping occupancy and unfavorable CCI occurred. In other words, the method identifies weather extreme values that have the most salient adverse impact on camping occupancy. Therefore, the CCI takes both additive and multiplicative terms to express which meteorological variables influence tourist behaviors. The final CCI scores rank from 0 (unfavorable) to 10 (optimal). See Ma et al. [54] for a more detailed explanation of the CCI development.
3. Results and Analysis
3.1. Spatial Distribution of Climate Resources for Camping
To evaluate the spatial distribution of climate resources for camping, daily CCI scores were averaged on each grid cell for the duration of the study period. Figure 1 shows the annual spatial distribution of CCI scores from 1948 to 2016 based on the daily observational climate data. The CCI scores exhibit a strong spatial variation from region to region across the globe, depending on the relative locations of land and ocean, the distance to the equator, altitude, and landscape. In general, coastal regions demonstrate relatively stable CCI scores due to the moderating influence of oceans. For instance, similar CCI scores extend along the ocean coast in western United States, South America, western and eastern Africa, and western Europe. Tropical and sub-tropical regions, in general, have the highest CCI scores, which decrease poleward as the overall thermal comfort declines in temperate climate zones. Elevation is also an important parameter for the CCI on a global scale. For instance, the CCI score is much lower along the Tibet plateau (southern China) and Andes Mountain (South America) than comparable latitudes due to the comparatively higher altitudes and cooler climate. Moreover, the impact of regional landscape on micro-level climate contributes to the variations in CCI score on a location-based scale.
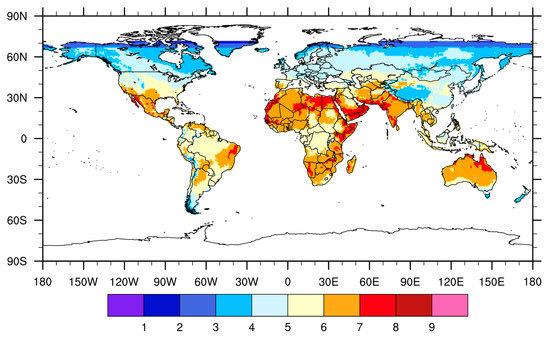
Figure 1.
Spatial distribution of the annual averaged CCI scores during 1948–2016.
While the annual CCI score provides insight into the global geography of climate resources for camping and nature-based tourism activities, seasonal scale scores provide greater insight into tourism operations. To understand the seasonal variations of climate resources, the CCI score was calculated for the months that define the four meteorological seasons (MAM, JJA, SON, DJF). Figure 2 shows the spatial distribution of averaged daily CCI from 1948 to 2016 for individual seasons. As expected, the highest rated season is summer (JJA for northern hemisphere; DJF for the southern hemisphere), while winter is the lowest rated. This is consistent with other studies that have examined climate preferences for nature-based tourism (including camping) [38,39,67]. The CCI score in mid- to higher-latitude northern hemisphere regions has the largest variation during the shoulder seasons (MAM and SON) due to the frequently changing weather patterns during the transition seasons. The northern hemisphere has the lowest variation during winter as much of North America, Europe, and Asia are too cold for camping. A global dataset of camping market indicators (e.g., visitor nights, spending) is not available to compare with the geography of climate resources.
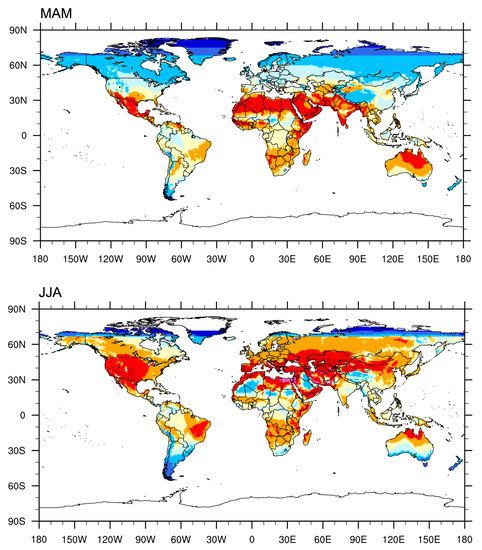
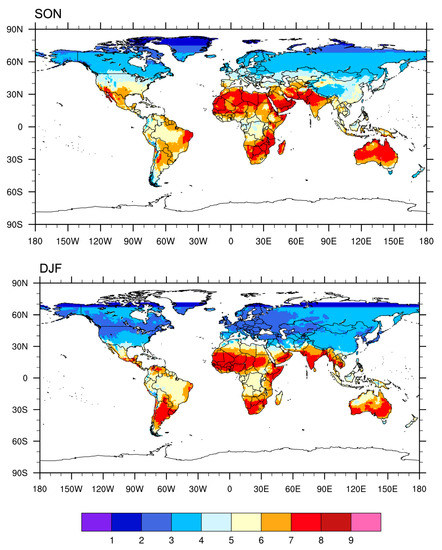
Figure 2.
Spatial distribution of the seasonal averaged CCI scores during 1948–2016.
3.2. Temporal Redistribution of Climate Resources
To understand the impact of ongoing climate change for tourism climate resources, changes in CCI scores across the four meteorological seasons were analyzed. A two-sided Mann-Kendall trend test at 0.95 confidence level was applied to determine if the CCI changes were significant. Figure 3 shows the spatial distribution of the long-term trends in seasonally averaged CCI in individual grid cells during the study period. The mean CCI changes in four seasons combined are positive, suggesting that climate resources for camping have become more favorable on a global scale. However, changes in CCI scores are not homogenous. Northern Europe, Russia, Canada, Alaska (United States), inner Mongolia, northeast and western China, northern India, eastern Africa, and southern South America are regions that experienced improved climatic conditions for all seasons. In contrast, the climate conditions for camping in northern and western Africa, central South America, and central Australia became less favorable. The most substantial changes in CCI scores are in Africa, where significant changes are observed in four seasons in either direction.
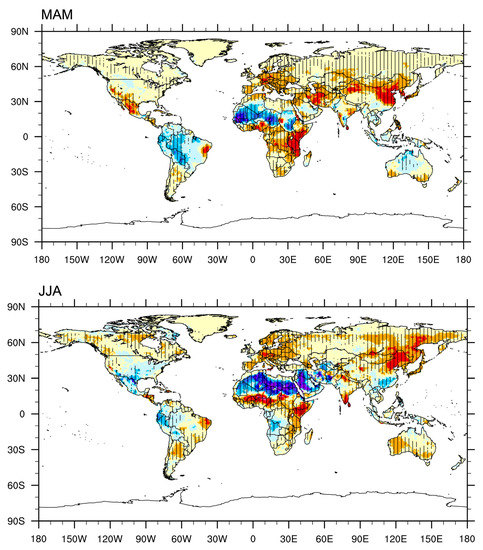
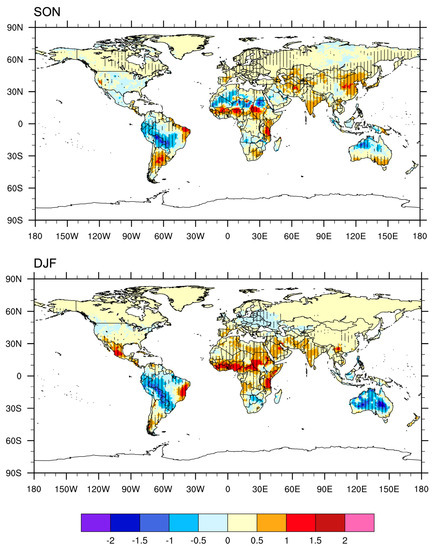
Figure 3.
Long-term trends in seasonal CCI scores over 1948–2016. Note. The unit is the CCI scores per 69 years. Regions hatched indicate the changes are significant at 95% confidence level by 2-sided Mann-Kendall trend test.
3.3. Changing Weather Extremes
To evaluate changes in extreme weather events, we compared the mean annual frequency of extreme weather (as defined for camping—see Supplemental Table S1) in 1948–1957 to 2007–2016. A two-sided t-test at 0.95 confidence level was used to determine if there was a significant difference between the two decades. As noted in Ma et al. [54], extreme weather for camping is considered when at least one of the meteorological variables surpass a threshold that defines an extreme event that influences camping activity (i.e., when the daily maximum temperature exceeds 34 °C, daily minimum temperature drops below 8 °C, daily precipitation is higher than 10 mm, or the daily wind speed is higher than 23 km/h). As shown in Figure 4, positive values suggest a higher frequency of weather extremes impacting camping and negative values suggest a declining frequency of weather extremes. The mean of the global annual weather extremes frequency change is −0.629, indicating that the frequency of extreme weather influencing camping has slightly decreased in the recent decade (2007–2016) compared to seven decades ago (1948–1957). Most of the Southern hemisphere has experienced increased extreme weather over the study period. On the contrary, the majority of land areas in the Northern hemisphere have experienced less extreme weather that influences camping activity in 2007–2016 compared with 1948–1957, with the exception of the Arabian Peninsula, Mexico, southeast US, Greenland, and Baffin Island in Canada. The most intensive increase in the number of extreme weather days is observed in sub-Saharan Africa, while the largest decline is manifested in Central Europe and the Rocky Mountain region in the US.
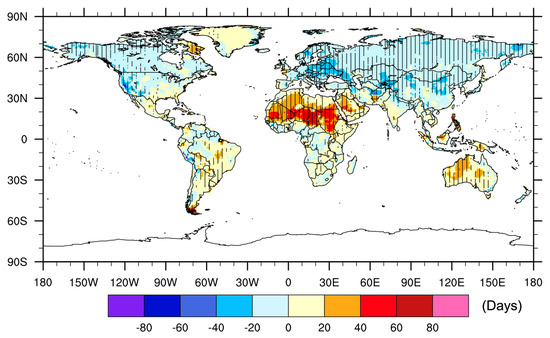
Figure 4.
Differences in the frequency of extreme weather events important to camping between 2007–2016 and 1948–1957. Note. Regions hatched indicate the changes are significant at 95% confidence level by 2-tailed t-test.
4. Discussion
Climate resources are a type of natural resource that are often the most salient determinant of outdoor tourism and recreation decisions (e.g., [8,68,69]). For destination managers of outdoor tourism and recreation locations, it is imperative that they understand (1) the favorability of climate resources that influence tourists’ behaviors and (2) the changes of favorability due to climate change. There are significant differences in climate suitability for camping and nature-based tourism around the world, which have important implications for the tourism and recreation industries. As the first known study to quantify the distribution and redistribution of climate resources for camping and related nature-based tourism more broadly, this paper has established that observed climate change has already altered climate resources, creating both risks and opportunities. The results are broadly consistent with regional tourism climatology studies using indices conducted in North America [29,54,70], Europe [7,71], Australia [72,73], China [74,75], the Mediterranean [76,77], and South Africa [78]. Nature-based tourism activities are very sensitive to the weather; thus, the changing climatic conditions may very well lead to changes in tourism demand patterns as has already been observed by Monahan et al. [45] in US national parks.
The CCI trends revealed in this study bode well for popular camping market segments such as Europe and North America, as the climate conditions in those regions demonstrated a positive increase in CCI from climate change. Conversely, north and sub-Saharan Africa have experienced a pronounced decline in climate suitability associated with a higher frequency of extreme weather, negatively impacting tourism assets and nature-based tourism seasons. Post-hoc examination shows that the warming temperature over the past seven decades is the main influence of shifts in CCI (Supplemental Figure S1), particularly the northern hemisphere summer (June, July, and August) (Figure 3, JJA). The intensified warming trend in Africa and the Rocky Mountain region in the US leads to less favorable climate resources in the already hot arid region and more favorable climate resources in the cool mountainous climate region. The southern hemisphere’s summer (December, January, and February) demonstrates the smallest CCI increase for the season (Figure 3, DJF) lesser warming trend [79].
The forces that are driving changes to the frequency of extreme weather events vary on a regional scale, which is understandable given the CCI quantifies the impacts of four extreme weather events (i.e., hot temperature, cold temperature, extreme precipitation, and high wind). For example, regions experiencing more hot days usually experience fewer cold nights. In terms of wind, the slowdown in near surface-wind speeds is observed across the globe [80], which could lead to fewer wind extremes. The changes in extreme precipitation are less homogenous than other climate variables, creating diverse impacts on CCI [79]. Altogether, the frequency of extreme weather events important to camping depends on the competing regional impacts of the four types of extremes.
We observed both positive and negative trends in frequency of extreme weather events relevant to camping behavior depending on the region. For instance, the near-tropic and extensive desert regions (e.g., sub-Saharan Africa) exhibit significant trends toward a higher frequency of weather extremes, which is likely driven by more days with temperatures surpassing the maximum temperature thresholds for camping. Fewer days with extreme cold in mid- to higher-latitude regions (e.g., Central Europe and the Rocky Mountain region in the US) likely contributed to lower frequencies of extreme weather events [79,81]. Overall, the spatial distribution of extreme weather is consistent with the observed increase in warm days and decrease in colds days on the global scale [79,81]. Despite potential inter-decadal variability, the decadal comparison of extreme weather frequency from 1948 to 1957 and 2007 to 2016 provides useful insights about the regional trajectories of long-term magnitude changes of events. Taken together, our results provide tourism researchers and practitioners with the most robust retrospective analysis of climate conditions—including extreme weather—for camping and related nature-based tourism activities to date.
4.1. Limitations and Future Research
Though novel, this study is not without limitations. First, the CCI was validated in the United States. Despite using camping data and National Park visitation from regions of the US with four of the five Köppen climate types, which provides a layer of geographic generalizability, it would be beneficial for researchers and/or practitioners with high-resolution nature-based tourism data (e.g., daily camping occupancy or daily parks visitor counts) to validate the CCI for other continents, countries, regions, and locations throughout the world. This is particularly true for the Southern hemisphere and developing markets where there have been fewer tourism studies using climate indices.
Another limitation is that even though the CCI is a more predictive index for camping and parks visitation in some climate regions in the United States [6,54], there are instances where other indices outperformed the CCI. It is important to acknowledge the application of activity-tailored indices for specific location/region characteristics. For instance, the HCI-beach [82] and urban [83] were developed and validated specific to beach and urban tourism and would be a more appropriate climate indicator for these activities. A comprehensive analysis of climate resources for tourism globally would utilize the range of indices tailored to tourism market segments, including CCI and HCI-urban and beach.
Third, the study is retrospective in nature providing the first global documentation of historical climatic conditions of importance to camping and related nature-based tourism activities. Future research should consider expanding this analysis to also include future global projections based on climate change scenarios. There are important questions regarding how climate resources for tourism will evolve and whether some of the improved CCI conditions observed will be reversed as changes in climate accelerate.
4.2. Conclusions
Camping is a global phenomenon, but previous studies have yet to quantify climate resources for the sub-sector of nature-based tourism on the global scale. In fact, camping remains generally understudied globally despite its salient economic impacts [11]. Accordingly, this study took a novel approach as the first known to use a tourism index approach to quantify climate resources for camping and natural park activities globally, while also quantifying the trends in extreme weather conditions that influence camping tourism. The study provides material contributions to the tourism climatology and nature-based tourism literatures. A key contribution to tourism climatology is methodological. Specifically, using the Camping Climate Index (CCI) [54], we globally quantified the weather/climate favorability for camping and nature-based tourism from 1948 to 2016. This addressed a knowledge gap where a revealed index for camping and nature-based tourism has not previously been calculated on a global scale. Investigating the distribution of climate resources throughout the world, results demonstrate an uneven distribution of climate resources across the globe, which favors warmer temperatures. Camping and nature-based tourism in areas of higher latitude and altitude appeared to be beneficiaries of changing climate. These areas are experiencing more warm days as temperatures increase, and the increasing temperature is the major driver of improved climate suitability. The frequency of extreme weather for camping and nature-based tourism increased in the hot-arid climate regions and decreased in the warm-cold climate regions.
A second key contribution is to the practice and management of nature-based tourism and camping. This is because study findings serve to enhance our understanding of the distribution and redistribution of climate resources—including frequency and intensity of extreme weather—for camping and other forms of nature-based tourism globally. The results provide a spectrum of decision-relevant climate information for outdoor recreation and tourism destination managers throughout the world. Based on the analyses developed in this study, several adaptation strategies for the tourism segment are available. For instance, the regional gains to climate comfortability creates opportunities for tourism organizations to expand business seasons and improve performance. Conversely, the increased climate-related risks (e.g., increased intensity or frequency of weather extremes) in other regions highlight the importance of taking preemptive adaptation strategies (e.g., enhanced infrastructure, marketing promotions) to improve resilience to climate change. Weather extremes also pose health and safety risks. For example, extreme heat and resultant wildfire in the western United States in 2020 required rescuers to airlift stranded campers so safety [50]. Craig et al. [24] reported temperature preceding the wildfire was as much as 15 °C above the heat threshold for the CCI (i.e., 34 °C), and “despite the dangerous wildfire conditions, many campers, destination managers, and authorities did not heed warnings” (p. 360). The overarching finding—that climate resources and weather extremes are changing over time dependent on region—provides research-based evidence for destination measures to monitor and respond to changing climatic conditions as a process of climate change.
Supplementary Materials
The following are available online at https://www.mdpi.com/article/10.3390/tourhosp2040024/s1, Figure S1: Time series of the annual and seasonal global average CCI score. Table S1: Comparison of the identified weather threshold values for camping and park visitation.
Author Contributions
S.M.: Conceptualization, Methodology, Formal analysis, Writing—original draft preparation. C.C.: Writing-review and editing, Investigation, Supervision. D.S.: Methodology, Writing—review and editing, Investigation. S.F.: Methodology, Supervision. All authors have read and agreed to the published version of the manuscript.
Funding
This research received no external funding.
Institutional Review Board Statement
Not applicable.
Informed Consent Statement
Not applicable.
Data Availability Statement
Data are contained within the article.
Conflicts of Interest
The authors declare no conflict of interest.
References
- World Tourism and Travel Council (WTTC). Travel & Tourism Economic Impact Reports. 2021. Available online: https://wttc.org/Research/Economic-Impact (accessed on 5 August 2021).
- World Tourism Organization (WTO). International Tourism Highlights, 2020 Edition. Available online: https://www.e-unwto.org/doi/pdf/10.18111/9789284422456 (accessed on 7 August 2021).
- Margaryan, L.; Fredman, P. Bridging outdoor recreation and nature-based tourism in a commercial context: Insights from the Swedish service providers. J. Outdoor Recreat. Tour. 2017, 17, 84–92. [Google Scholar] [CrossRef]
- Webster, D. Recreation. In Introduction to Tourism and Hospitality in BC, 2nd ed.; Wescott, M., Ed.; BCcampus: Victoria, BC, Canada, 2020; Available online: https://opentextbc.ca/introtourism/ (accessed on 14 December 2021).
- World Bank. Tools and Resources for Nature-Based Tourism; World Bank: Washington, DC, USA, 2020; Available online: https://openknowledge.worldbank.org/handle/10986/34433 (accessed on 11 August 2021).
- Ma, S.; Craig, C.A.; Feng, S.; Liu, C. Climate resources at United States National Parks: A tourism climate index approach. Tour. Recreat. Res. 2021, 8, 1–5. [Google Scholar] [CrossRef]
- Perch-Nielsen, S.L.; Amelung, B.; Knutti, R. Future climate resources for tourism in Europe based on the daily Tourism Climatic Index. Clim. Chang. 2010, 103, 363–381. [Google Scholar] [CrossRef] [Green Version]
- Scott, D.; Lemieux, C. Weather and climate information for tourism. Procedia Environ. Sci. 2010, 1, 146–183. [Google Scholar] [CrossRef] [Green Version]
- Brooker, E.; Joppe, M. Trends in camping and outdoor hospitality—An international review. J. Outdoor Recreat. Tour. 2013, 3-4, 77–83. [Google Scholar] [CrossRef]
- Doğantan, E.; Emir, O. Determination of trailer park criteria in rural areas. J. Tour Gastron. Stud. 2019, 7, 2383–2398. [Google Scholar] [CrossRef]
- Rogerson, C.M.; Rogerson, J.M. Camping tourism: A review of recent international scholarship. Geoj. Tour. 2020, 28, 349–359. [Google Scholar] [CrossRef]
- Brooker, E.; Joppe, M. A critical review of camping research and direction for future studies. J. Vacat. Mark. 2014, 20, 335–351. [Google Scholar] [CrossRef]
- Canadian Recreational Vehicle Association (CRVA). Statistics about How Often Canadians Go RVing and Where. 2020. Available online: https://crva.ca/3459-2/ (accessed on 20 August 2021).
- Cairn Consulting Group (CCG). The 2021 North American Camping Report. Sponsored by Kampgrounds of America. 2021. Available online: http://koa.uberflip.com/i/1362448-2021-north-american-camping-report (accessed on 21 August 2021).
- Business Communications Company (BCC). Camping and Caravanning Market—Global Industry Analysis and Opportunity Assessment, 2019–2029. Future Market Insights: Pune, India, 2020; Available online: https://www.bccresearch.com/partners/future-markets-insights/camping-and-caravanning-market.html (accessed on 13 December 2021).
- ReportLinker. Camping Tent Market in Europe—Industry Outlook and Forecast 2020–2025. 2020. Available online: https://www.reportlinker.com/p05442032/?utm_source=GNW (accessed on 21 August 2021).
- Rice, W.L.; Park, S.Y.; Pan, B.; Newman, P. Forecasting campground demand in US National Parks. Ann. Tour. Res. 2019, 79, 424–438. [Google Scholar] [CrossRef]
- Brochado, A.; Brochado, F. What makes glamping a great experience? J. Hosp. Tour. Technol. 2019, 10, 15–27. [Google Scholar] [CrossRef]
- Cairn Consulting Group (CCG). The 2019 North American Camping Report. Sponsored by Kampgrounds of America. Available online: https://koa.com/north-american-camping-report/ (accessed on 11 August 2021).
- Lyu, S.O.; Kim, J.W.; Bae, S.W. Family vacationers’ willingness to pay for glamping travel sites: A family functioning segmentation. Int. J. Tour. Res. 2020, 22, 155–167. [Google Scholar] [CrossRef]
- Craig, C.A.; Karabas, I. Glamping after the coronavirus pandemic. Tour. Hosp. Res. 2021, 21, 251–256. [Google Scholar] [CrossRef]
- Gossling, S.; Scott, D.; Hall, M. Pandemics, tourism and global change: A rapid assessment of COVID-19. J. Sustain. Tour. 2021, 29, 1–20. [Google Scholar] [CrossRef]
- Ranahan, J. In a socially distant world, camping is gearing up to become more popular than ever. Forbes. 22 June 2020. Available online: https://www.forbes.com/sites/jaredranahan/2020/06/21/camping-is-more-popular-than-ever/?sh=5edf787e7d19 (accessed on 10 August 2021).
- Craig, C.A.; Ma, S.; Karabas, I.; Feng, S. Camping, weather, and disasters: Extending the Construal Level Theory. J. Hosp. Tour. Manag. 2021, 49, 353–363. [Google Scholar] [CrossRef]
- Amelung, B.; Nicholls, S.; Viner, D. Implications of global climate change for tourism flows and seasonality. J. Travel Res. 2007, 45, 285–296. [Google Scholar] [CrossRef]
- Martín, M.B.G. Weather, climate and tourism a geographical perspective. Ann. Tour. Res. 2005, 32, 571–591. [Google Scholar] [CrossRef]
- Matthews, L.; Scott, D.; Andrey, J.; Mahon, R.; Trotman, A.; Burrowes, R.; Charles, A. Developing climate services for Caribbean tourism: A comparative analysis of climate push and pull influences using climate indices. Curr. Issues Tour. 2021, 24, 1576–1594. [Google Scholar] [CrossRef]
- Mieczkowski, Z. The tourism climatic index: A method of evaluating world climates for tourism. TCG 1985, 29, 220–233. [Google Scholar] [CrossRef]
- Scott, D.; McBoyle, G.; Schwartzentruber, M. Climate change and the distribution of climatic resources for tourism in North America. Clim. Res. 2004, 27, 105–117. [Google Scholar] [CrossRef] [Green Version]
- Lise, W.; Tol, R.S. Impact of climate on tourist demand. Clim. Chang. 2002, 55, 429–449. [Google Scholar] [CrossRef]
- Scott, D.; Jones, B.; Konopek, J. Implications of climate and environmental change for nature-based tourism in the Canadian Rocky Mountains: A case study of Waterton Lakes National Park. Tour. Manag. 2007, 28, 570–579. [Google Scholar] [CrossRef]
- Wilkins, E.; de Urioste-Stone, S.; Weiskittel, A.; Gabe, T. Weather sensitivity and climate change perceptions of tourists: A segmentation analysis. Tour. Geogr. 2018, 20, 273–289. [Google Scholar] [CrossRef]
- Clemente, F.; Lopes, A.; Ambrósio, V. Tourists’ Perceptions on Climate Change in Lisbon Region. Atmosphere 2020, 11, 297. [Google Scholar] [CrossRef] [Green Version]
- Richardson, R.B.; Loomis, J.B. Adaptive recreation planning and climate change: A contingent visitation approach. Ecol. Econ. 2004, 50, 83–99. [Google Scholar] [CrossRef]
- Reidmiller, D.R.; Avery, C.W.; Easterling, D.R.; Kunkel, K.E.; Lewis, K.L.M.; Maycock, T.K.; Stewart, B.C. (Eds.) Impacts, Risks, and Adaptation in the United States: Fourth National Climate Assessment; U.S. Global Change Research Program: Washington, DC, USA, 2018. [CrossRef]
- Scott, D.; Hall, C.M.; Gössling, S. Global tourism vulnerability to climate change. Ann. Tour. Res. 2019, 77, 49–61. [Google Scholar] [CrossRef]
- Fisichelli, N.A.; Schuurman, G.W.; Monahan, W.B.; Ziesler, P.S. Protected area tourism in a changing climate: Will visitation at US national parks warm up or overheat? PLoS ONE 2015, 10, e0128226. [Google Scholar] [CrossRef] [PubMed]
- Hewer, M.J.; Scott, D.J.; Gough, W.A. Differences in the importance of weather and weather-based decisions among campers in Ontario parks (Canada). Int. J. Biometeorol. 2017, 61, 1805–1818. [Google Scholar] [CrossRef]
- Matthews, L.; Scott, D.; Andrey, J. Development of a data-driven weather index for beach parks tourism. Int. J. Biometeorol. 2019, 65, 749–762. [Google Scholar] [CrossRef]
- Wilkins, E.; de Urioste-Stone, S.; Weiskittel, A.; Gabe, T. Effects of weather conditions on tourism spending: Implications for future trends under climate change. J. Travel Res. 2018, 57, 1042–1053. [Google Scholar] [CrossRef]
- Liu, P. The Effect of Temperature on Outdoor Recreation Activities: Evidence from Visits to Federal Recreation Sites. 2021. Available online: https://papers.ssrn.com/sol3/papers.cfm?abstract_id=3945744 (accessed on 14 December 2021).
- Buckley, L.B.; Foushee, M.S. Footprints of climate change in US national park visitation. Int. J. Biometeorol. 2012, 56, 1173–1177. [Google Scholar] [CrossRef]
- Grillakis, M.G.; Koutroulis, A.G.; Tsanis, I.K. The 2 °C global warming effect on summer European tourism through different indices. Int. J. Biometeorol. 2016, 60, 1205–1215. [Google Scholar] [CrossRef]
- Jones, B.; Scott, D. Implications of climate change for visitation to Ontario’s provincial parks. Leisure 2006, 30, 233–261. [Google Scholar] [CrossRef]
- Monahan, W.B.; Rosemartin, A.; Gerst, K.L.; Fisichelli, N.A.; Ault, T.; Schwartz, M.D.; Gross, J.E.; Weltzin, J.F. Climate change is advancing spring onset across the U.S. national park system. Ecosphere 2016, 7, e01465. [Google Scholar] [CrossRef] [Green Version]
- Wall, G.; Harrison, R.; Kinnaird, V.; McBoyle, G.; Quinlan, C. The implications of climatic change for camping in Ontario. Recreat. Res. Rev. 1986, 13, 50–60. [Google Scholar]
- Hewer, M.J.; Scott, D.J.; Gough, W.A. Differential temperature preferences and thresholds among summer campers in Ontario’s southern provincial parks: A Canadian case study in tourism climatology. Theor. Appl. Climatol. 2018, 133, 1163–1173. [Google Scholar] [CrossRef]
- Gstaettner, A.M.; Kobryn, H.T.; Rodger, K.; Phillips, M.; Lee, D. Monitoring visitor injury in protected areas-analysis of incident reporting in two Western Australian parks. J. Outdoor Recreat. Tour. 2019, 25, 143–157. [Google Scholar] [CrossRef]
- Craig, C.A.; Feng, S. A temporal and spatial analysis of climate change, weather events, and tourism businesses. Tour. Manag. 2018, 67, 351–361. [Google Scholar] [CrossRef]
- Freedman, A. California endures record-setting ‘kiln-like’ heat as fire rages, causing injuries. The Washington Post. 6 September 2020. Available online: https://www.washingtonpost.Com/weather/2020/09/06/California-wildfires-heat-wave/ (accessed on 10 December 2021).
- Aratani, L. More than 200 campers rescued from California lake as wildfire spread. The Guardian. 6 September 2020. Available online: https://www.theguardian.com/us-news/2020/sep/05/us-west-coast-heatwave-california (accessed on 10 December 2021).
- Kim, M.K.; Jakus, P.M. Wildfire, national park visitation, and changes in regional economic activity. J. Outdoor Recreat. Tour. 2019, 26, 34–42. [Google Scholar] [CrossRef] [Green Version]
- Schwartz, J. Climate Change is making it harder for campers to beat the heat. New York Times. 9 July 2021. Available online: https://www.nytimes.com/2021/07/05/climate/global-warming-summer-camp.html (accessed on 10 December 2021).
- Ma, S.; Craig, C.A.; Feng, S. The Camping Climate Index (CCI): The development, validation, and application of a camping-sector tourism climate index. Tour. Manag. 2020, 80, 104105. [Google Scholar] [CrossRef]
- Craig, C.; Ma, S.; Poggioli, N. A Climate Resource Approach to Weather and Climate Change. In Academy of Management Proceedings; Academy of Management: Briarcliff Manor, NY, USA, 2021; Volume 2021, p. 16358. [Google Scholar]
- Hewer, M.J.; Scott, D.; Gough, W.A. Tourism climatology for camping: A case study of two Ontario parks (Canada). Theor. Appl. Climatol. 2015, 121, 401–411. [Google Scholar] [CrossRef]
- Hewer, M.J. Determining the effect of extreme weather events on human participation in recreation and tourism: A case study of the Toronto Zoo. Atmosphere 2020, 11, 99. [Google Scholar] [CrossRef] [Green Version]
- Hewer, M.; Scott, D.; Fenech, A. Seasonal weather sensitivity, temperature thresholds, and climate change impacts for park visitation. Tour. Geogr. 2016, 18, 297–321. [Google Scholar] [CrossRef]
- Allen, R.G.; Pereira, L.S.; Raes, D.; Smith, M. FAO irrigation and drainage paper: Crop evapotranspiration. Irrig. Drain. 2006, 300, 333. [Google Scholar]
- Verstraeten, W.W.; Veroustraete, F.; Feyen, J. Assessment of evapotranspiration and soil moisture content across different scales of observation. Sensors 2008, 8, 70–117. [Google Scholar] [CrossRef] [Green Version]
- Baroni, G.; Tarantola, S. A General Probabilistic Framework for uncertainty and global sensitivity analysis of deterministic models: A hydrological case study. Environ. Model Softw. 2014, 51, 26–34. [Google Scholar] [CrossRef]
- Li, Z.; Fang, G.; Chen, Y.; Duan, W.; Mukanov, Y. Agricultural water demands in Central Asia under 1.5 °C and 2.0 °C global warming. Agric. Water Manag. 2020, 231, 106020. [Google Scholar] [CrossRef]
- Sheffield, J.; Goteti, G.; Wood, E.F. Development of a 50-year high-resolution global dataset of meteorological forcings for land surface modeling. J. Clim. 2006, 19, 3088–3111. [Google Scholar] [CrossRef] [Green Version]
- He, J.; Yang, K.; Tang, W.; Lu, H.; Qin, J.; Chen, Y.; Li, X. The first high-resolution meteorological forcing dataset for land process studies over China. Sci. Data 2020, 7, 1–11. [Google Scholar] [CrossRef] [PubMed] [Green Version]
- Lutz, A.F.; Immerzeel, W.W.; Shrestha, A.B.; Bierkens, M.F.P. Consistent increase in High Asia’s runoff due to increasing glacier melt and precipitation. Nat. Clim. Chang. 2014, 4, 587–592. [Google Scholar] [CrossRef] [Green Version]
- Ortiz-Bobea, A.; Ault, T.R.; Carrillo, C.M.; Chambers, R.G.; Lobell, D.B. Anthropogenic climate change has slowed global agricultural productivity growth. Nat. Clim. Chang. 2021, 11, 306–312. [Google Scholar] [CrossRef]
- Rutty, M.; Scott, D. Comparison of climate preferences for domestic and international beach holidays: A case study of Canadian travelers. Atmosphere 2016, 7, 30. [Google Scholar] [CrossRef] [Green Version]
- Horne, L.; De Urioste-Stone, S.; Seekamp, E.; Rahimzadeh-Bajgiran, P.; Rickard, L. Determinants of visitor climate change risk perceptions in Acadia National Park, Maine, USA. J. Outdoor Recreat. Tour. 2021, 35, 100401. [Google Scholar] [CrossRef]
- Olefs, M.; Formayer, H.; Gobiet, A.; Marke, T.; Schöner, W.; Revesz, M. Past and future changes of the Austrian climate𠅃Importance for tourism. J. Outdoor Recreat. Tour. 2021, 34, 100395. [Google Scholar] [CrossRef]
- Ma, S.; Craig, C.A.; Feng, S. Camping climate resources: The camping climate index in the United States. Curr. Issues Tour. 2021, 24, 2523–2531. [Google Scholar] [CrossRef]
- Hein, L.; Metzger, M.J.; Moreno, A. Potential impacts of climate change on tourism; a case study for Spain. Curr. Opin. Environ Sustain. 2019, 1, 170–178. [Google Scholar] [CrossRef]
- Amelung, B.; Nicholls, S. Implications of climate change for tourism in Australia. Tour. Manag. 2014, 41, 228–244. [Google Scholar] [CrossRef] [Green Version]
- Shiue, I.; Matzarakis, A. Estimation of the tourism climate in the Hunter Region, Australia, in the early twenty-first century. Int. J. Biometeorol. 2011, 55, 565–574. [Google Scholar] [CrossRef]
- Yu, D.D.; Matthews, L.; Scott, D.; Li, S.; Guo, Z.Y. Climate suitability for tourism in China in an era of climate change: A multiscale analysis using holiday climate index. Curr. Issues Tour. 2021, 1–16. [Google Scholar] [CrossRef]
- Fang, Y.; Yin, J. National assessment of climate resources for tourism seasonality in China using the tourism climate index. Atmosphere 2015, 6, 183–194. [Google Scholar] [CrossRef] [Green Version]
- Rutty, M.; Scott, D. Will the Mediterranean become “too hot” for tourism? A reassessment. Tour. Hospit. Plann. Dev. 2010, 7, 267–281. [Google Scholar] [CrossRef]
- Amelung, B.; Viner, D. Mediterranean tourism: Exploring the future with the tourism climatic index. J. Sustain. Tour. 2006, 14, 349–366. [Google Scholar] [CrossRef]
- Fitchett, J.M.; Robinson, D.; Hoogendoorn, G. Climate suitability for tourism in South Africa. J. Sustain. Tour. 2017, 25, 851–867. [Google Scholar] [CrossRef]
- IPCC. Climate Change 2021: The Physical Science Basis. Contribution of Working Group I to the Sixth Assessment Report of the Intergovernmental Panel on Climate Change; Masson-Delmotte, V., Zhai, P., Pirani, A., Connors, S.L., Péan, C., Berger, S., Caud, N., Chen, Y., Goldfarb, L., Gomis, M.I., et al., Eds.; Cambridge University Press: Cambridge, UK, 2021; in Press. [Google Scholar]
- Wu, J.; Zha, J.; Zhao, D.; Yang, Q. Changes in terrestrial near-surface wind speed and their possible causes: An overview. Clim. Dyn. 2018, 51, 2039–2078. [Google Scholar] [CrossRef] [Green Version]
- IPCC. 2014: Climate Change 2014: Synthesis Report. Contribution of Working Groups I, II and III to the Fifth Assessment Report of the Intergovernmental Panel on Climate Change; Core Writing Team, Pachauri, R.K., Meyer, L.A., Eds.; IPCC: Geneva, Switzerland, 2014; 151p. [Google Scholar]
- Rutty, M.; Scott, D.; Matthews, L.; Burrowes, R.; Trotman, A.; Mahon, R.; Charles, A. An Inter-Comparison of the Holiday Climate Index (HCI: Beach) and the Tourism Climate Index (TCI) to explain Canadian tourism arrivals to the Caribbean. Atmosphere 2020, 11, 412. [Google Scholar] [CrossRef] [Green Version]
- Scott, D.; Rutty, M.; Amelung, B.; Tang, M. An inter-comparison of the holiday climate index (HCI) and the tourism climate index (TCI) in Europe. Atmosphere 2016, 7, 80. [Google Scholar] [CrossRef] [Green Version]
Publisher’s Note: MDPI stays neutral with regard to jurisdictional claims in published maps and institutional affiliations. |
© 2021 by the authors. Licensee MDPI, Basel, Switzerland. This article is an open access article distributed under the terms and conditions of the Creative Commons Attribution (CC BY) license (https://creativecommons.org/licenses/by/4.0/).