Article

Exploring the Impact of Educational Quizzes and Stamp Collecting Trails on Zoo Visitor Learning and Exhibit Observation

School of Agriculture and Animal Science, Obihiro University of Agriculture and Veterinary Medicine, Obihiro 080-8555, Japan
*
Author to whom correspondence should be addressed.
J. Zool. Bot. Gard. 2021, 2(3), 445-452; https://doi.org/10.3390/jzbg2030032
Submission received: 21 June 2021 / Revised: 4 August 2021 / Accepted: 18 August 2021 / Published: 20 August 2021
(This article belongs to the Special Issue Zoos as a Tool for Re-Connecting People with Nature)

Abstract

:
Visitors observe diverse animals during zoo visits and learn more about animals by reading information boards that provide conservation education on animal behavior and habitats. This study revealed differences in effects between reading and understanding during stamp collection and a quiz game focused on “animal observations” and “perception of information boards”. Stamp collection and the quiz game were both effective for reading and observing. These were interesting techniques for learning about various captive species. The quiz game that urged observing target species and reading information boards was found to be a more effective tool to learn about the ecology and conservation of captive species.

1. Introduction

Zoos provide conservation, education, research, and recreation for visitors, with conservation education being one of the most important provisions [1]. When deviating from the main viewing route, zoo visitors tend to be uninterested in captive animals and information boards [2,3] Visitor interests are known to differ by the type, activity, and size of captive animal species [4,5,6,7,8]. Visitors tend to observe more visible and active animals [4,5,6,7,8,9,10,11,12], and large-bodied animals seem to be preferred [2,4]. Many visitors understand that a necessary role of zoos is to educate the public; however, the main aim of the visitors seems to be that of recreation [13,14,15]. Having knowledge of the learning behavior of animals and the natural habitats of captive animals can lead to a better understanding of animal conservation [16]. This requires non-structural methods wherein zoo visitors visit and develop an interest in various animals, because it is difficult for all kinds of visitors learn animals’ behaviors and habitats at the same time, and the construction of preferred exhibits involves high costs.
It is necessary that visitors observe a diverse array of animal species and read information boards to obtain a conservation education [14,17,18]. To observe diverse animals and have an interest in information boards, visitors might be motivated the conduction of some recreational and educational programs [17]. It is known that visiting zoos and the education provided by guides are effective for conservation education [19]; however, providing guidance for all kinds of people who visit zoos is too difficult. Programs such as stamp collection and quiz games attract visitors to targeted educational points because these activities are easy to perform and have a recreational function [20,21,22]. However, the differences in visitor behavior and the effectiveness of the two programs are not obvious when observing and learning about captive animals in zoos.
The objective of this study was to reveal the differences between the effects of guiding zoo visitors towards specific animals and learning about animal characteristics through the use of a stamp collection and a quiz game.

2. Materials and Methods

A control, and each program, were implemented on weekends from July 2018 to October 2018 at Obihiro Zoo, Hokkaido, Japan (Figure 1). These surveys were conducted on different days. Fifty-five species are raised in the zoo. We surveyed using 9:30 to 16:00 as an open time period of Obihiro Zoo. Visitors who were older than 10 years old were included in the study.

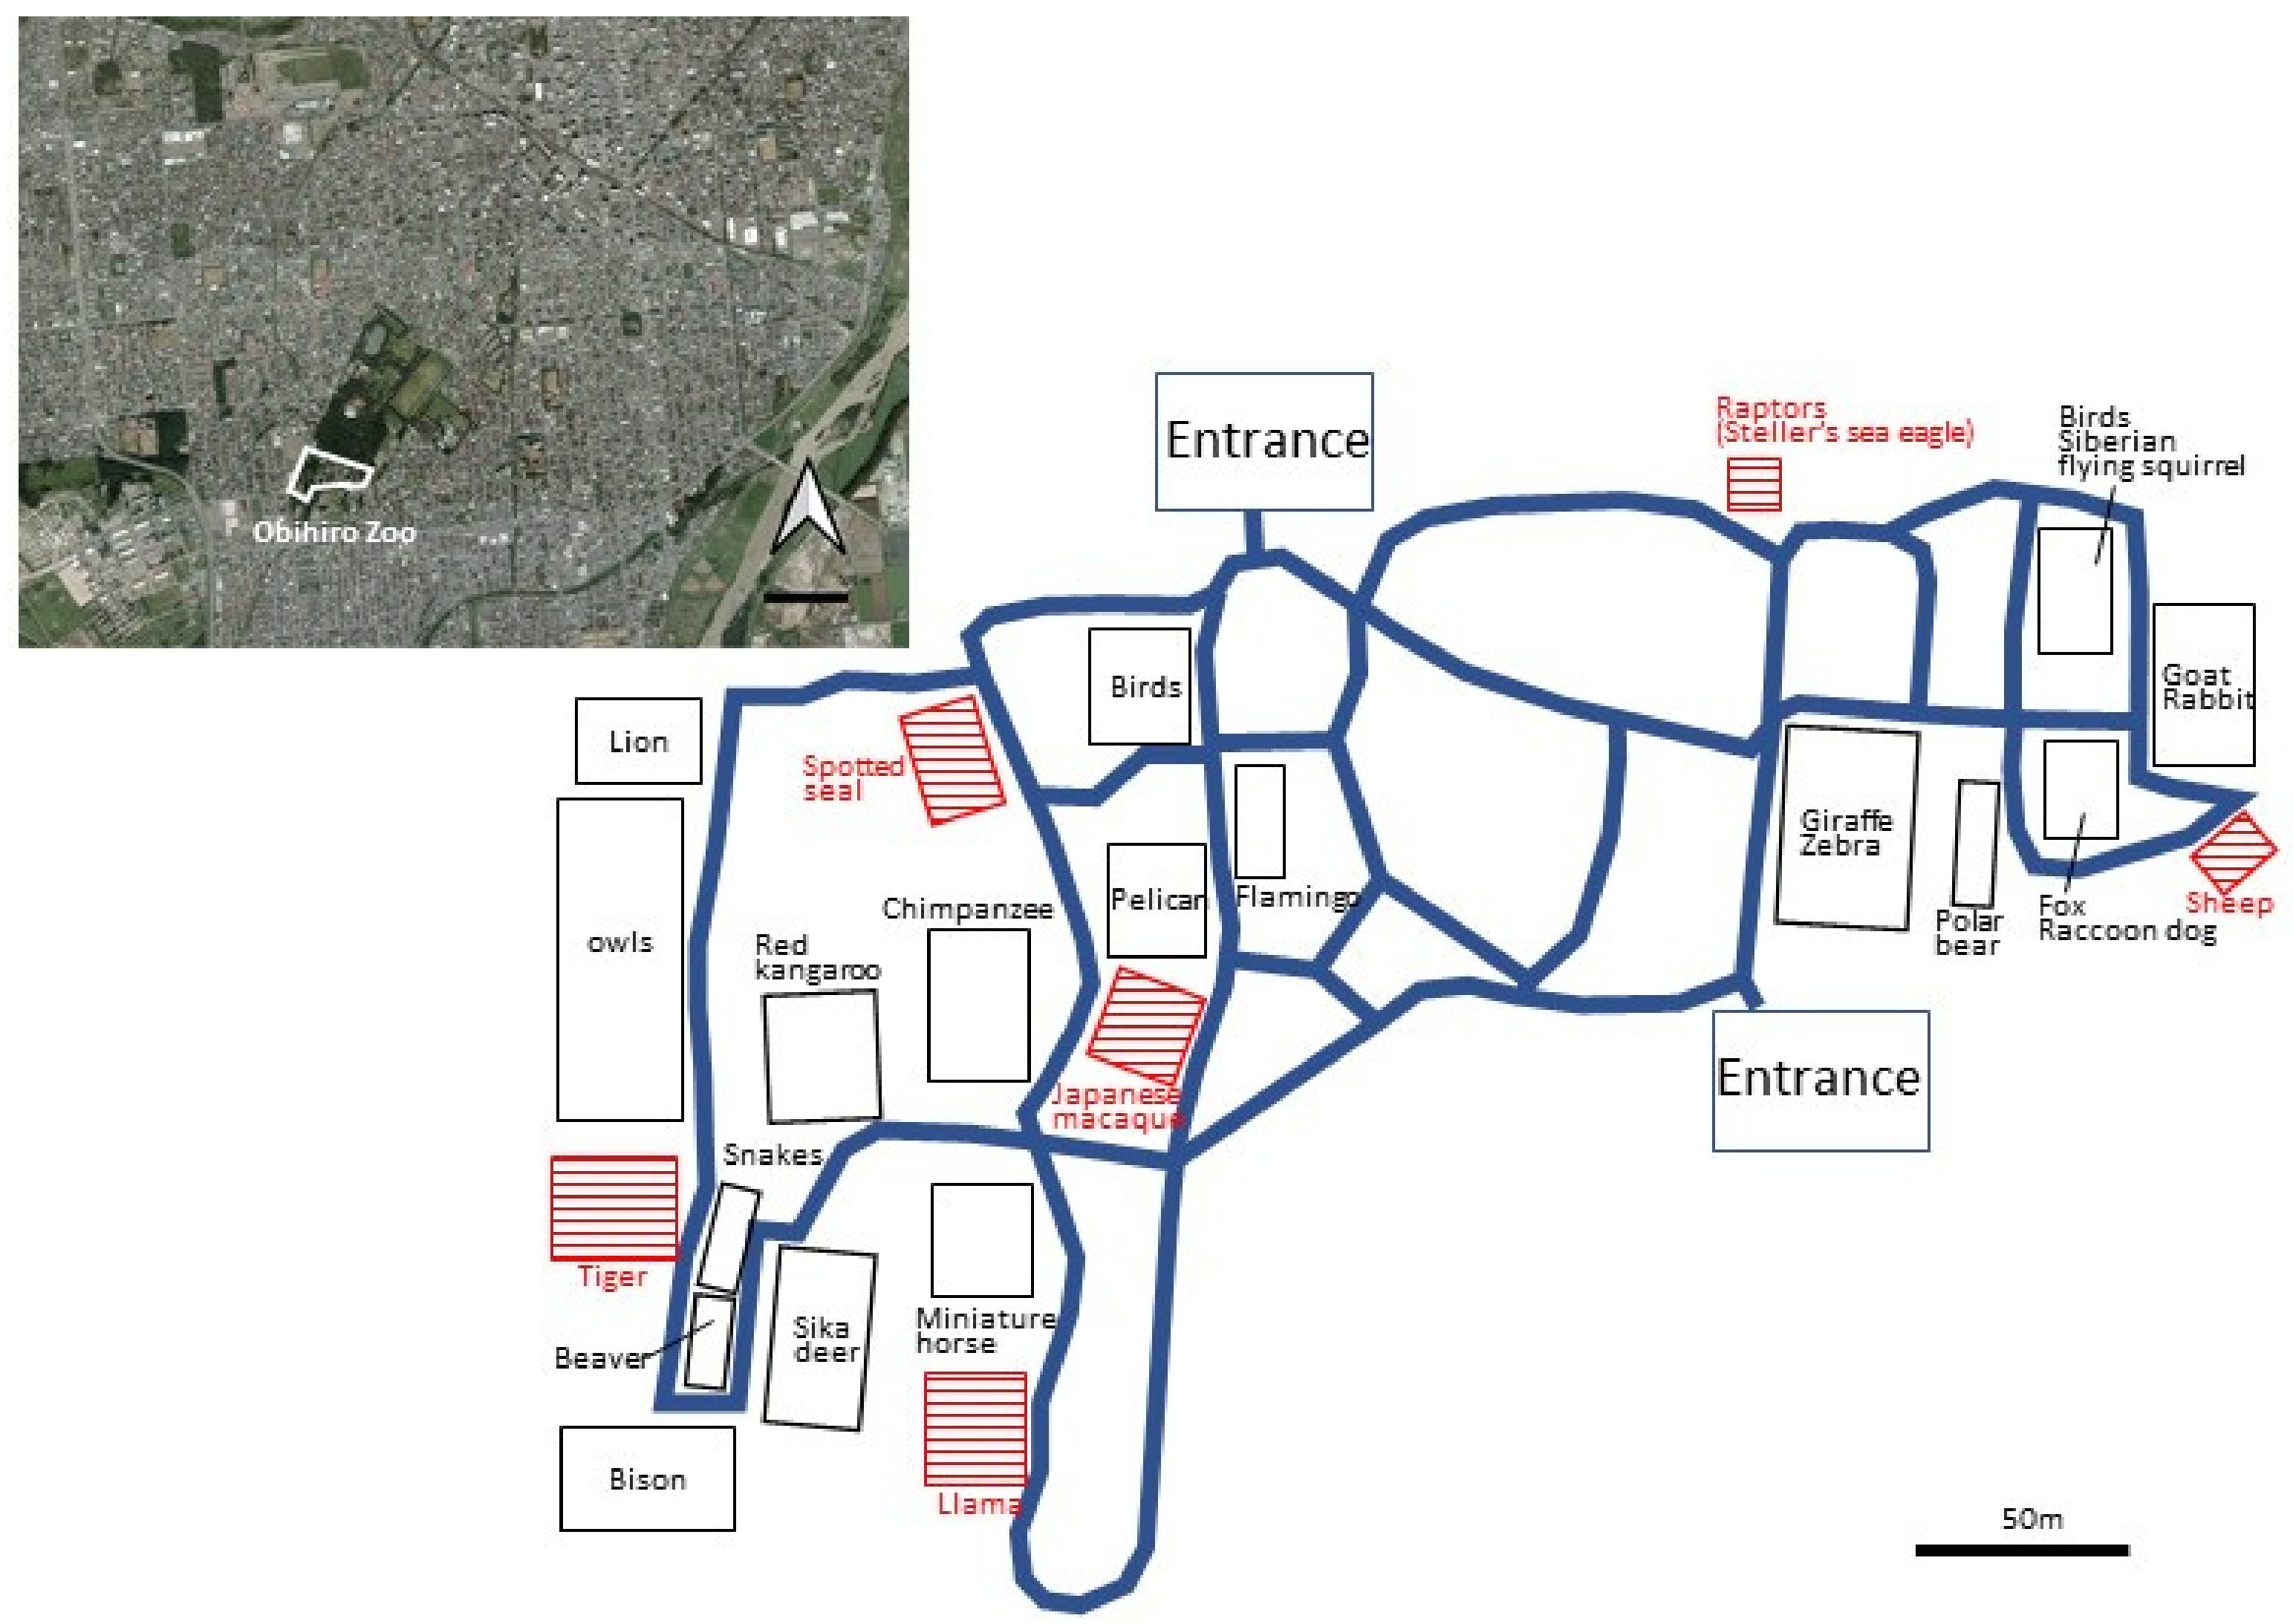
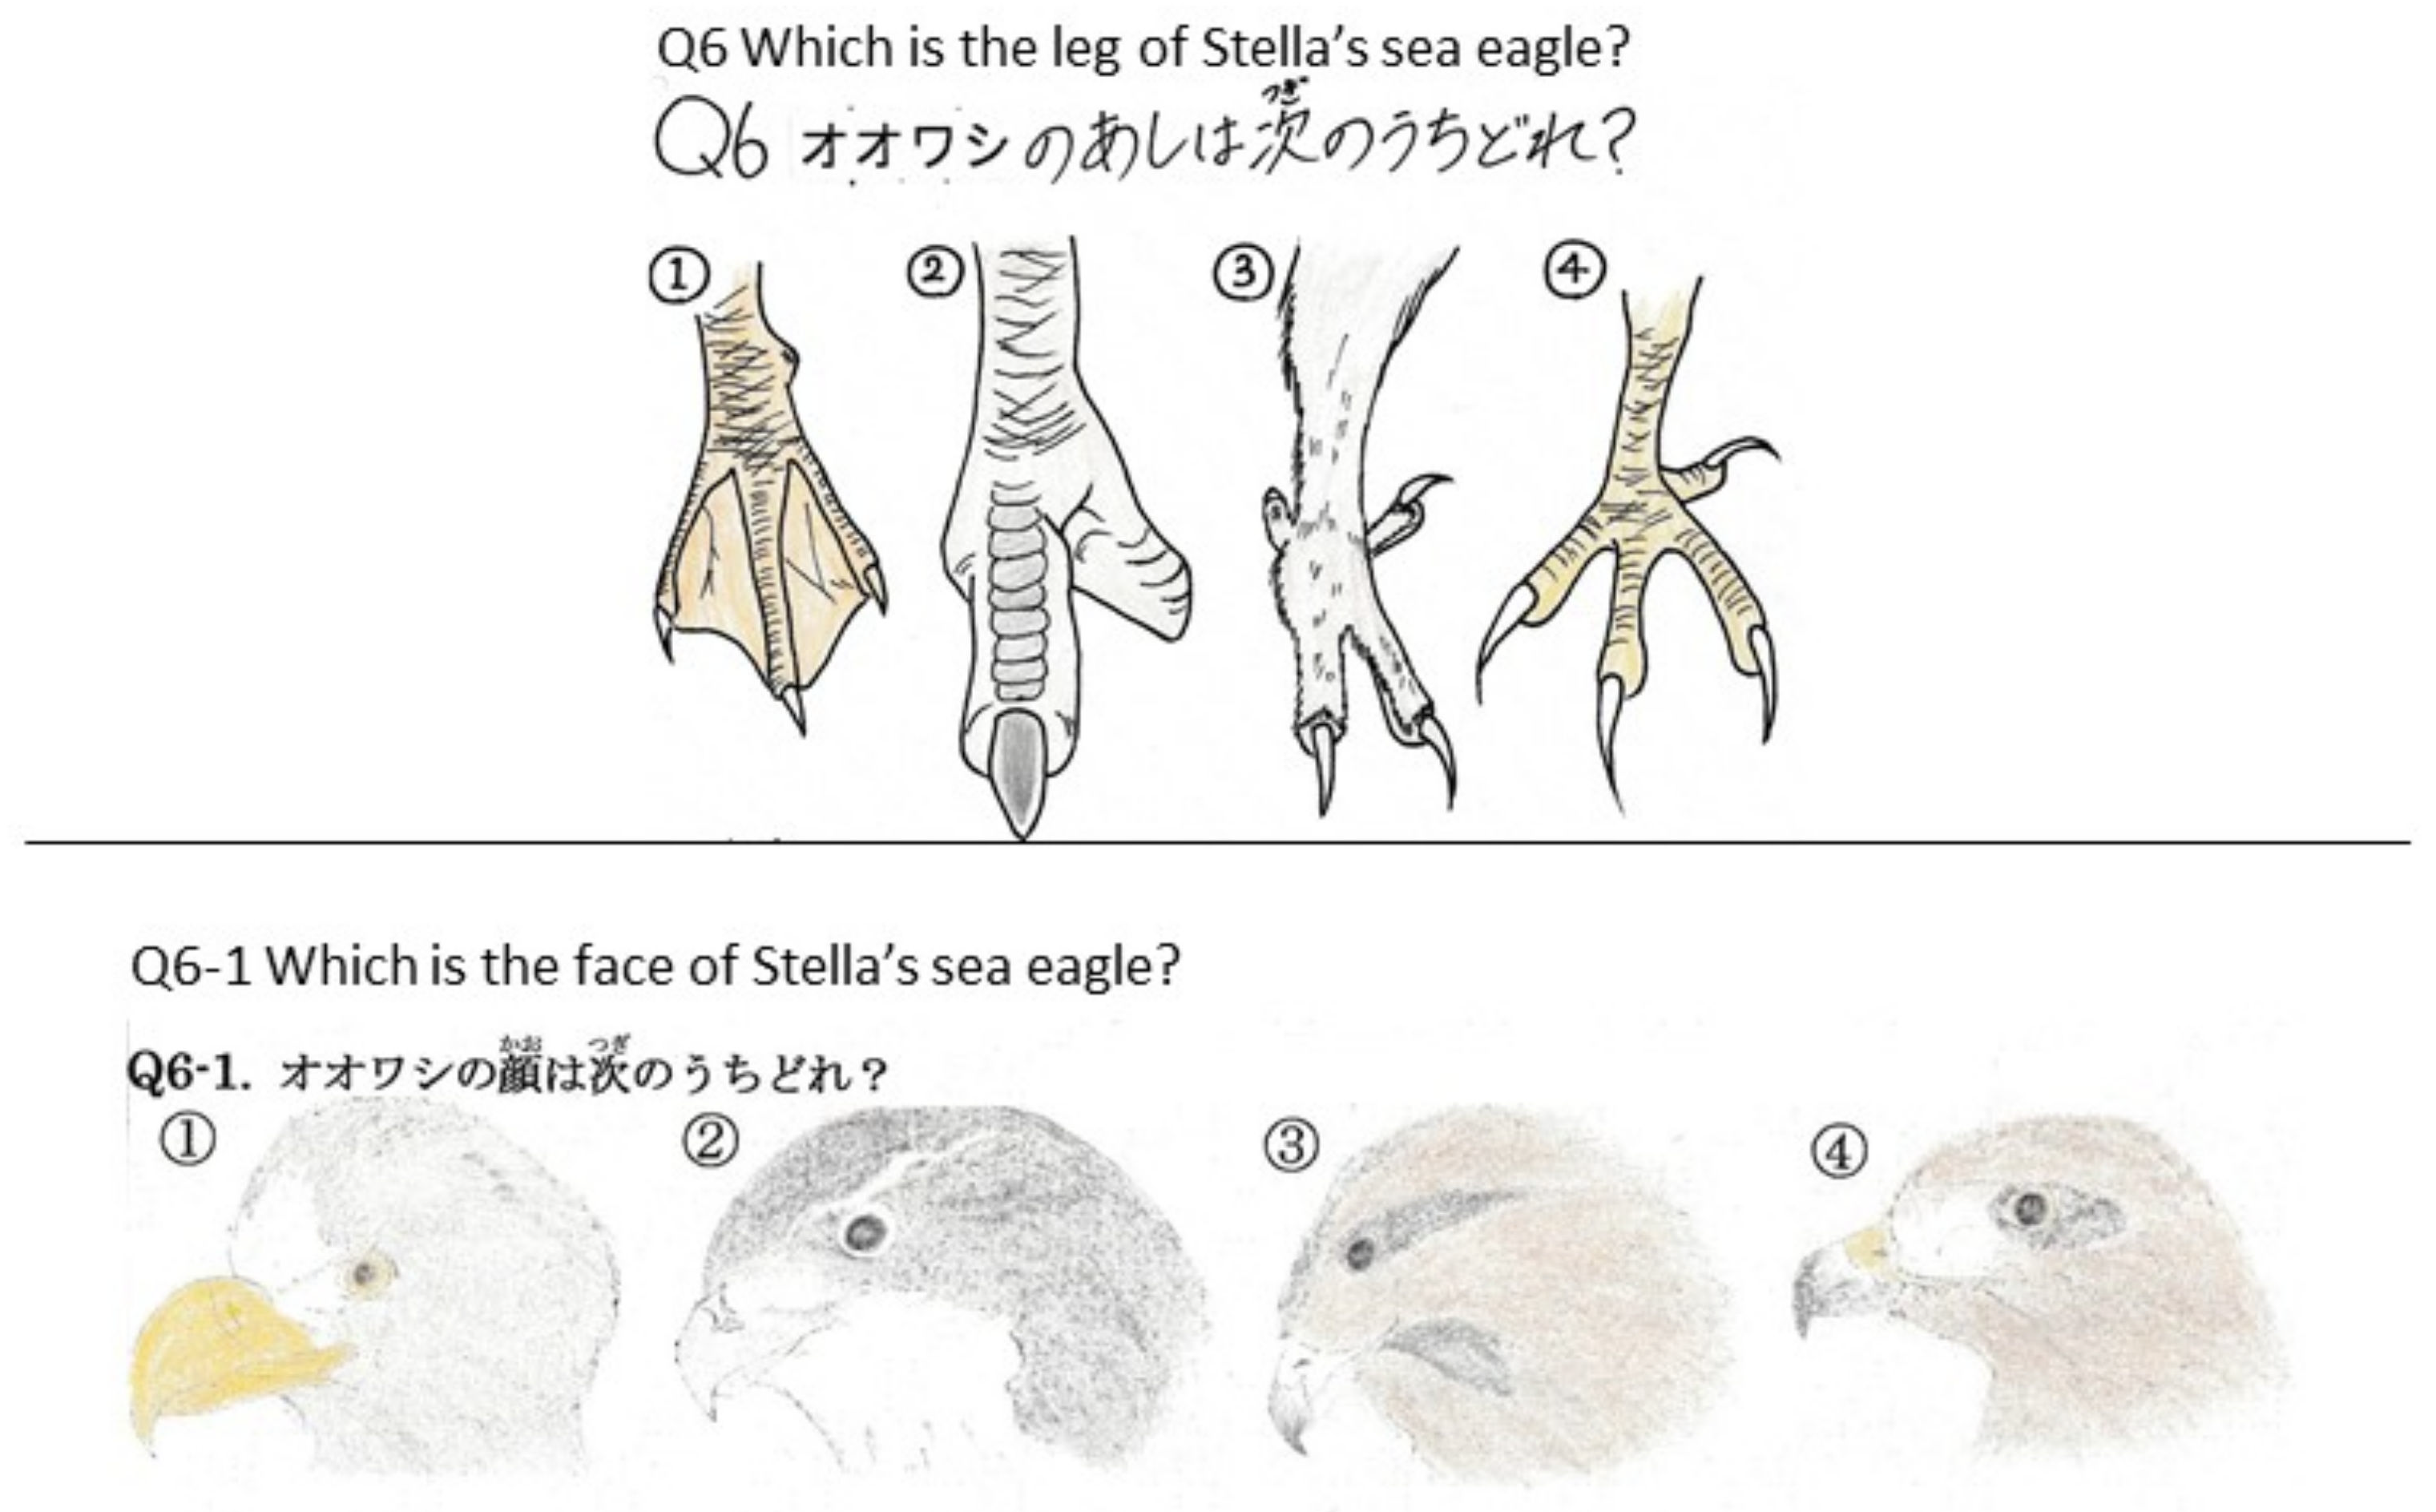
2.1. Design of Stamps and Questions for Quiz Games

Considering their arrangement and taxonomic group, six animals were randomly selected from the zoo (Figure 1). The stamp-collecting trail was designed as a collection of ink-stamped illustrations (4 cm × 4 cm) of the six animals (spotted seal Phoca largha, Japanese macaque Macaca fuscata, tiger Panthera tigris, sheep Ovis aries, llama Lama glama, and Steller’s sea eagle Haliaeetus pelagicus) that were collected by visitors as they went through the zoo and stopped at each animal’s enclosure or cage. For the quiz game, we created questions on the morphological characteristics (shape or pattern of leg or face) of each of the six animals (e.g., Stella’s sea eagle, Figure 2). Each morphological question was easy to answer for any visitor, because visitors could find immediately these characteristics when they observed the animals. The stamps and questions were set in front of each enclosure or cage.

2.2. Evaluation of Animal Observation and Perception of Information Boards

The questionnaire method was widely used to evaluate the educational effects of zoo animals [23,24]. To evaluate the degree of animal observation, we developed questions about the morphological features of the six animals that differed from the animals in the quiz game (e.g., Stella’s sea eagle, Figure 2). Morphological questions were the body patterns of spotted seal, ear shape of Japanese macaque, ear patterns of tiger, eye shape of sheep, ear shape of llama and face shape of Steller’s sea eagle. Careful observation was required to answer correctly. We asked these questions to visitors after they finished observing animals when the programs were not in place (control) and when the two programs were in place (experiment). In addition to the questions on animal characteristics, we asked two other questions: whether visitors observed animals after stopping and whether visitors noticed and read information boards.

2.3. Statistical Analysis

We used a chi-square test to compare the control and experimental data. If there was a significant difference, we used a post-hoc test (Ryan’s method). These analyses were documented using the R version 3.3.2 software [25]. We did not consider visitors’ education level in this analysis, because our questions were very easy to answer.

3. Results

3.1. Sampling Size

Of the 931 visitors, we recorded valid responses from 910 visitors, of which 307 were in the control group, 294 in the stamp collection group, and 309 in the quiz game group. A total of 387 visitors were male and 517 were female. Family visitors with children and the other group visitors were 617 and 293 (including solo visitors of 14), respectively.

3.2. Animal Observation

3.2.1. Effectiveness of Guidance to Animals

In the control group, the number of visitors who observed the six target animals varied with animal species (Table 1). The number of visitors who observed the sheep, llama, and Steller’s sea eagle was lower (<70% visitors) than those who observed the spotted seal, Japanese macaque, and tiger (>80% visitors). However, at least 90% of visitors in both the experimental programs visited all six target animals. For all animals, the percentages of visitors in both program groups who visited the target animals were significantly higher than those of visitors in the control group who visited the target animals (p < 0.05).

3.2.2. Observational Effectiveness

Over 73% of the visitors observed the spotted seal, Japanese macaque, and tiger by stopping at their enclosures (Figure 3). There was no significant difference between the control and each of the two programs (p > 0.05). The percentage of visitor observations when stopping at the sheep (78.3%) and Steller’s sea eagle (81.7%) enclosures were significantly higher for those participating in the quiz game than those in the control (51.3% and 67.2%, respectively) and stamp collection groups (57.6% and 67.2%, respectively) (p < 0.05). The proportion of visitors at the llama enclosures that were participants in the stamp collection (74.6%) and quiz game (79.2%) was significantly higher than that of the control group (59.0%) (p < 0.05).

3.2.3. Percentage of Questions Answered Correctly

The percentage of visitors with correct answers after observing the target species was 42.0% ± 22.4% (mean ± SD, range: 10.0–67.2%) in the control group and those participating in the stamp collection and quiz game were 44.4% ± 23.1% (9.5–76.5%) and 43.4% ± 24.1% (8.3–75.1%), respectively (Table 2). There was no significant difference between the control, stamp collection, and quiz game groups. However, the percentage of correct answerers tended to differ for each species. The percentages of questions answered correctly were as follows: tiger (control: 10.0%, stamp collection: 9.5%, and quiz game: 8.3%), sheep (39.7%, 45.1%, and 40.5%, respectively), llama (26.6%, 29.3%, and 24.9% respectively) and Steller’s sea eagle (67.2%, 57.2%, and 57.9%, respectively). These did not differ significantly between the control and each of the two programs, while the percentages for spotted seal (75.1%) and Japanese macaque (53.6%) in the quiz game were significantly higher than those in the control (66.7% and 42.0%, respectively) (p < 0.05).
The number of correct answerers who observed animals by stopping in front of the target species was more than those who did not stop in the control and the two programs (Table 2). The mean percentage of correct answerers who observed after stopping appeared to be higher in those participating in the quiz game (84.2% ± 2.7%) than those participating in stamp collection (76.9% ± 9.2%) and the control (72.1% ± 8.2%); however, there was no significant difference.

3.3. Perception of the Information Boards of Target Species

3.3.1. Effectiveness of Perception

The percentage of visitors who noticed the information boards was the highest in the quiz game group, at 90.1% ± 2.3% (mean ± SD, range: 86.7–93.1%), compared with the stamp collecting group (83.5% ± 3.7%, 78.5–87.5%) and control group (76.7% ± 6.9%, 65.3–83.9%) (Table 3). For five species, excluding llama, the percentage of visitors in the quiz game group who noticed the information boards was significantly higher than that in the control group (p < 0.05). For Japanese macaque, tiger, sheep, and Steller’s sea eagle, the percentage of visitors in the quiz game group who noticed the information boards was significantly higher than that in the stamp collecting group (p < 0.05).

3.3.2. Effectiveness of Reading Information Boards

The percentage of visitors in the quiz game group who read the information boards (mean ± SD: 59.6% ± 6.7%, range: 51.0–69.9%) was higher than that in the control group (50.7% ± 11.8%, 34.4–66.1%) and stamp collecting group (52.4% ± 7.8%, 42.2–62.4%). The percentage of visitors in the quiz game group who read the information boards was greater than 50% for all target species. For spotted seal and sheep, the percentage of visitors in the quiz game group who read the information boards (69.9% and 54.2%, respectively) was significantly higher than that in the control group (52.0% and 34.4%, respectively) and stamp collecting group (56.2% and 43.7%, respectively) (p < 0.05). For Japanese macaque, tiger, and Stella’s sea eagle, the percentage of visitors in the quiz game group (51.0%, 59.5%, and 63.5%, respectively) who read the information boards tended to be higher than that in the control group (41.2%, 50.0%, and 60.7%, respectively); however, there was no significant difference.

4. Discussion

Stamp collection and the quiz game affected how visitors observed and became interested in various captive species in the zoo, because both the programs used a different approach to guiding visitors towards the target species. The quiz game was a more effective tool for learning about the biology and conservation of captive species than stamp collection, because the quiz game guided visitors to most of the animals, and the quiz game was associated with stopping to observe and understand the characteristics of most of the target species.

4.1. Effectiveness of Induction to Target Species

The percentage of visitors in the control group who observed each of the six target species differed for each species, showing a lower percentage for sheep, llama, and Stella’s sea eagle; however, the percentages of visitors observing these species were higher in the experimental stamp collection and quiz game program groups. It was shown that visitors hesitate to visit animals where enclosures are not visible from the main viewing route [6,22,26]. The reason for the low percentage of observation of the three mentioned animals in the control group might be due to the distance of the enclosures from the main route of the zoo. In fact, the enclosures of sheep, llama and Stella’s sea eagle are located at the edge of the zoo. Therefore, we considered that stamp collection and the quiz game were effective in guiding visitors to various animals, distant from the main route. We also determined that the effects of both the experimental conditions were similar because the percentage of visitors did not significantly differ between them.

4.2. Observational Effectiveness

Many visitors stopped to observe spotted seal, Japanese macaque, and tiger along the main route. This might be because people prefer human-like animals [27], large animals [8,11], and animals that are more active [11]. Stamp collection and the quiz game facilitated stopping to observehe t llama. Furthermore, the quiz game was associated with stopping to observe sheep and Stella’s sea eagle. Therefore, we recommend both the programs, especially the quiz game, as effective approaches to promote and improve visitor observations of zoo animals.

4.3. Questions Answered Correctly

Overall, the percentage of visitors who answered the questions correctly did not significantly differ among the three groups (the control and two experimental programs). However, the percentages of questions answered correctly were higher for two species (spotted seal and Japanese macaque) in the quiz game group than that in the control. Godinez et al. [28] revealed that the observational behavior of visitors was longer in duration when animals were active. We considered that visitors may have understood their morphological features by observing their behavior and gestures, because spotted seal and Japanese macaque were relatively more active than the other four species.
Our results indicated that most visitors who correctly answered the questions stopped to observe the target species. In addition, the percentage of visitors in the quiz game was the highest among the control and the two programs. The observation of live animals facilitated memory recall of animal features [29]. Therefore, we suggested that the quiz game motivated observation and learning about animal features.

4.4. Effectiveness of Perception and Reading of Information Boards

The percentage of visitors who found the information boards during the quiz game for five target species and stamp collection for four target species were significantly higher than those of the control group. The percentage of visitors who read the information boards in the quiz game was also higher than that in the control and stamp collection groups, regardless of the target species. Therefore, we concluded that visitors were interested in the target species and information boards after observing animals, because visitors had to observe the target species carefully to answer the questions correctly. Clayton et al. [3] demonstrated that stimulating intellectual curiosity forced visitors to read information boards. The induction and observation of animals might play a role in visitors reading information boards.

5. Conclusions

Our results showed that the educational quiz and stamp collection trail were effective tools to guide visitors. The quiz game would be more effective to learn about the biology and behavior of zoo animals. Understanding the biology and behavior of zoo animals could raise the conservational attributes of visitors [8,29]. Therefore, the two programs, especially the quiz game, would be useful for increasing conservational attitudes towards wildlife.

Author Contributions

Conceptualization, C.I. and Y.A.; methodology, C.I. and Y.A.; formal analysis, C.I.; investigation, C.I.; data curation, C.I.; writing–original draft preparation, C.I.; writing–review and editing, Y.A.; visualization, Y.A.; supervision, Y.A.; project administration, Y.A. Both authors have read and agreed to the published version of the manuscript.

Funding

This research received no funding.

Institutional Review Board Statement

We followed the ethical code of Obihiro University of Agriculture and Veterinary Medicine. However, ethical review and approval were waived for this study, due to a lack of personal information such as name, address and telephone number.

Informed Consent Statement

Informed consent was obtained from all subjects involved in the study.

Data Availability Statement

The data presented in this study are available on request from the corresponding author.

Acknowledgments

We thank Yuhara, K. and the staffs of Obihiro Zoo and Zooful as a voluntary group for cooperating with our study. We also thank Kikuchi, S. for illustrating animals to quiz game and questions, and students of wildlife laboratory of Obihiro University of Agriculture and Veterinary Medicine for advising.

Conflicts of Interest

The authors declare no conflict of interest.

References

  1. Kreger, D.M.; Mench, A.J. Visitor–animal interactions at the zoo. Anthrozoös 1995, 8, 143–158. [Google Scholar] [CrossRef]
  2. Bitgood, S. Environmental psychology in museums, zoos, and other exhibition centers. In Handbook of Environmental Psychology; Bechtel, R., Churchman, A., Eds.; John Wiley and Sons: Hoboken, NJ, USA, 2002; pp. 461–480. [Google Scholar]
  3. Andersen, L.L. Zoo education: From formal school programmes to exhibit design and interpretation. Int. Zoo Yearb. 2003, 38, 75–81. [Google Scholar] [CrossRef]
  4. Ward, I.P.; Mosberger, N.; Kistler, C.; Fischer, O. The relationship between popularity and body size in zoo animals. Conserv. Biol. 1998, 12, 1408–1411. [Google Scholar] [CrossRef]
  5. Margulis, W.S.; Hoyos, C.; Anderson, M. Effect of felid activity on zoo visitor interest. Zoo Biol. 2003, 22, 587–599. [Google Scholar] [CrossRef]
  6. Puan, L.C.; Zakaria, M. Perception of visitors towards the role of zoos: A Malaysian perspective. Int. Zoo Yearb. 2007, 41, 226–232. [Google Scholar] [CrossRef]
  7. Moss, A.; Esson, M. Visitor interest in zoo animals and the implications for collection planning and zoo education programmes. Zoo Biol. 2010, 29, 715–731. [Google Scholar] [CrossRef] [PubMed]
  8. Carr, N. An analysis of zoo visitors’ favorite and least favorite animals. Tour. Manag. Perspect. 2016, 20, 70–76. [Google Scholar] [CrossRef]
  9. Carr, N. Ideal animals and animal traits for zoos: General public perspectives. Tour. Manag. 2016, 57, 37–44. [Google Scholar] [CrossRef]
  10. Sellinger, R.L.; Ha, J.C. The effects of visitor density and intensity on the behavior of two captive jaguars (Panthera onca). J. Appl. Anim. 2005, 8, 233–244. [Google Scholar] [CrossRef]
  11. Davey, G. Relationships between exhibit naturalism animal visibility and visitor interest in a Chinese zoo. J. Appl. Anim. Behav. Sci. 2006, 96, 93–102. [Google Scholar] [CrossRef]
  12. Godinez, A.; Fernandez, E.J.; Morrissey, K. Visitor behaviors and perceptions of jaguar activities. Anthrozoös 2013, 26, 613–619. [Google Scholar] [CrossRef]
  13. Clayton, S.; Fraster, J.; Saunders, D.C. Zoo experiences: Conversations, connections, and concern for animals. Zoo Biol. 2009, 28, 377–397. [Google Scholar] [CrossRef] [PubMed]
  14. Reade, S.L.; Waran, K.N. The modem zoo: How do people perceive zoo animals? Appl. Anim. Behav. Sci. 1996, 47, 109–118. [Google Scholar] [CrossRef]
  15. Lee, H.-S. Measurement of visitors’ satisfaction with public zoos in Korea using importance-performance analysis. Tour. Manag. 2015, 47, 251–260. [Google Scholar] [CrossRef]
  16. Patric, G.P.; Mattews, E.C.; Ayers, F.D. Conservation and education: Prominent themes in zoo mission statements. J. Environ. Educ. 2007, 38, 53–60. [Google Scholar] [CrossRef]
  17. Fernandez, J.E.; Tamborski, A.M.; Pickens, R.S.; Timberlake, W. Animal–visitor interactions in the modern zoo: Conflicts and interventions. Appl. Anim. Behav. Sci. 2009, 120, 1–8. [Google Scholar] [CrossRef]
  18. Luebke, J.F.; Watters, J.V.; Packer, J.; Miller, L.J.; Powell, D.M. Zoo visitors’ affective responses to observing animal behavior. Visit. Stud. 2016, 19, 60–76. [Google Scholar] [CrossRef]
  19. Jensen, E. Evaluating children’s conservation biology learning at the Zoo. Conserv. Biol. 2014, 28, 1004–1011. [Google Scholar] [CrossRef] [Green Version]
  20. Abe, M.; Hasegawa, N.; Koba, K.; Moriya, K.; Sakai, T. Development and evaluation of information providing system using PDA and GPS for nature observation. Jpn. J. Educ. Technol. 2004, 28, 39–47. (In Japanese) [Google Scholar]
  21. Katayama, T.; Murao, K.; Tanaka, K.; Terada, T.; Nishio, S. Construction of a navigation system with a route planning algorithm using body-worn sensors. IPSJ J. 2009, 50, 2350–2359. (In Japanese) [Google Scholar]
  22. Ogino, T.; Hatono, I.; Ifuku, K.; Suzuki, M.; Kusumoto, F. Animal observation support system with the use of GPS cellular phones for general visitors in a zoo. IPSJ SIG Tech. Rep. 2009, 26, 71–77. (In Japanese) [Google Scholar]
  23. Lindemann-Matthies, P.; Kamer, T. The influence of an interactive educational approach on visitors’ learning in a Swiss Zoo. Sci. Educ. 2005, 90, 296–315. [Google Scholar] [CrossRef]
  24. Counsell, G.; Moon, A.; Littlehales, C.; Brooks, H.; Bridges, E.; Moss, A. Evaluating an in-school zoo education programme: An analysis of attitudes and learning. J. Zoo Aquar. Res. 2020, 8, 99–106. [Google Scholar]
  25. R Development Core Team. R: A Language and Environment for Statistical Computing; R Foundation for Statistical Computing: Vienna, Austria, 2019; Available online: https://www.R-project.org/ (accessed on 1 March 2019).
  26. East, D.; Osborne, P.; Kemp, S.; Woodfine, T. Combining GPS & survey data improves understanding of visitor behavior. Tour. Manag. 2017, 61, 307–320. [Google Scholar]
  27. Colléony, A.; Clayton, S.; Couvet, D.; Jalme, M.S.; Prévot, A.-C. Humanity preferences for species conservation: Animal charisma trumps endangered status. Biol. Conserv. 2017, 206, 263–269. [Google Scholar] [CrossRef] [Green Version]
  28. Kimble, G. Children learning about biodiversity at an environment centre, a museum and at live animal shows. Stud. Educ. Eval. 2014, 41, 48–57. [Google Scholar] [CrossRef]
  29. Pearson, E.; Dorrian, J.; Litchfield, C.A. Measuring zoo visitor learning and understanding about orangutans: Evaluation to enhance learning outcomes and to foster conservation action. Environ. Educ. Res. 2013, 19, 823–843. [Google Scholar] [CrossRef]
Figure 1. Enclosure arrangement of each animals in Obihiro Zoo.
Jzbg 02 00032 g001
Figure 2. Image of morphological question. Upper image is for the quiz game. Lower image is for evaluation of animal observation.
Jzbg 02 00032 g002
Figure 3. Percentage of visitors on different behavior in target species. (A) Control, (B) Stamp collecting, (C) Quiz game. Grey and black of pie chart show animal observation with stopping and without stopping, respectively.
Jzbg 02 00032 g003
Table 1. Number of visitors who observed target species.
CategoriesNumber of VisitorsSpotted SealJapanese MacaqueTigerSheepLlamaSteller’s Eagle
ControlTotal
Animal observation
307
252
307
278
307
242
307
199
307
139
307
183
Stamp collectingTotal
Animal observation
294
289
294
285
294
287
294
269
294
276
294
271
Quiz gameTotal
Animal observation
309
299
309
298
309
294
309
290
309
283
309
289
Table 2. Percentage of questions answered correctly and behavior.
CategoriesVisitor’s BehaviorSpotted SealJapanese MacaqueTigerSheepLlamaSteller’s Eagle
ControlNumber of correct answerers66.7% (252)42.0% (276)10.0% (240)39.7% (199)26.6% (139)67.2% (180)
without stopping29246311433
with stopping1399218482388
Stamp collectingNumber of correct answerers76.5% (281)48.9% (282)9.5% (285)45.1% (266)29.3% (276)57.2% (271)
without stopping42402431544
with stopping17398257766111
Quiz gameNumber of correct answerers75.1% (293)53.6% (293)8.3% (289)40.5% (284)24.9% (277)57.9% (285)
without stopping28273181427
with stopping192130219755138
Number in parentheses shows number of visitors that answered.
Table 3. Perception to information board and behavior of visitors.
CategoriesVisitor’s BehaviorSpotted SealJapanese MacaqueTigerSheepLlamaSteller’s Eagle
ControlVisitor’s noticed
information board
80.6% (248)71.6% (271)79.8% (238)65.3% (196)83.9% (137)78.7% (178)
Read information board52.0% (200)41.2% (80)50.0% (95)34.4% (44)66.1% (76)60.7% (85)
Stamp collectingVisitor’s noticed
information board
86.8% (287)78.5% (284)87.5% (287)80.2% (268)85.4% (274)82.7% (271)
Read information board56.2% (140)42.2% (94)55.4% (139)43.7% (94)62.4% (146)54.5% (122)
Quiz gameVisitor’s noticed
information board
90.9% (296)86.7% (294)93.1% (289)88.4% (284)90.0% (279)91.3% (288)
Read information board69.9% (188)51.0% (130)59.5% (160)54.2% (136)59.8% (150)63.5% (167)
Value in parentheses shows number of valid answers.
Publisher’s Note: MDPI stays neutral with regard to jurisdictional claims in published maps and institutional affiliations.

