Abstract
Penguins are considered among the most popular animals for zoo and aquarium visitors to observe. Swimming is considered a desirable activity, both for the visitor experience and the welfare of the penguins. However, little is known about the amount of time exhibited penguins spend swimming, or how such swimming is related to regular feeding events. We examined the effects of introducing live prey in the form of trout on 22 Humboldt penguins living at the Woodland Park Zoo. Of primary interest was how the live feeds changed (1) daily and hourly swimming activity, and (2) variability in enclosure use. We hypothesized that the live feedings would increase swimming activity prior to and during the delivery of the live trout, as well as create an overall increase in total swimming activity for live feed days compared to non-live feed days. We also predicted that the penguins would be more likely to use the entire exhibit around these live feeds, since they are likely to chase fish throughout the exhibit. Penguins did show an increase in swimming activity in the hour prior to and during the live feed, with a small decrease in swimming activity following the live feed when compared to non-live feed days. There was also a more than 30% increase in the total swimming activity for live feed days when compared to all other non-live feed days. In addition, a single measure of variability in enclosure use (entropy) showed greater overall enclosure use for the live feed days compared to the non-live feed days. These results demonstrate that live fish can be a useful way of enriching the behavioural welfare of Humboldt penguins.
1. Introduction
The taxonomic order of penguins (Sphenisciformes) include 18 living species [1]. In the wild, penguins do all their hunting at sea, and may spend 1/3 or more of their daily activity in the ocean [2,3]. In zoos and aquariums, penguins feed almost exclusively on land [4]. Zoo and aquarium penguins also lead increased sedentary lives compared to their wild counterparts, which has been positively correlated with bacterial infections, such as bumblefoot (ulcerative pododermatitis; [5]). Bumblefoot can be severe enough to result in foot amputation or death [6]. Thus, there is a clear need for the use of exhibition strategies and procedures to increase the swimming activity of exhibited penguins.
One strategy for promoting general activity is with environmental enrichment [7,8,9]. Environmental enrichment can be defined as stimuli and/or procedures that are added to or modify an animal’s environment and result in some measurable improvement in the behavioural and/or physiological well-being (i.e., welfare or wellness) of an exhibited animal [10,11,12,13]. Some examples include the use of foraging devices and feeding schedules, both automated and non-automated [14,15,16,17,18,19,20], changes in enclosure presentations, including choice between enclosures [21,22], the presentation of auditory, olfactory, and/or visual stimuli [23,24,25,26,27], and the use of operant conditioning and various other animal training practices [28,29]. In addition to the welfare benefits for enriched animals, increased animal activity has also been correlated with increased visitor attention to those exhibited animals [30,31,32,33,34,35]. Enrichment thus appears to serve a dual purpose: Increasing the welfare of the animals on exhibit while simultaneously increasing the education and entertainment of visitors viewing the animals.
Some authors have argued for the use of natural prey items, such as carcass feedings, to promote the well-being of predatory animals [36,37]. However, only a few studies have examined the use of prey or prey-like stimuli as enrichment to induce species-typical hunting repertoires. Carcass feedings have been demonstrated to reduce stereotypic activity and increase foraging and general activity in exhibited predatory animals [38,39]. Nonetheless, the obvious restrictions of such practices are that carcasses do not act like prey and are therefore limited in inducing natural hunting behaviour. An alternative strategy has been to present moving prey items, such as using mechanical devices that eject food or require hunting activity to obtain food rewards [19,40,41]. Other researchers have examined the use of live prey itself to induce natural predatory behaviours in carnivores, such as felids. This latter enrichment strategy can be economical and easy to manipulate, since small prey such as fish and insects have been demonstrated to effectively elicit natural predatory behaviours for lengthy periods of time that extend beyond the presentation of such live prey [42,43,44]. As a result, the use of live prey may prove beneficial for a wide array of predatory animals exhibited in zoos.
While introducing live prey may have immediate and long-term benefits for exhibited predatory animals, there are several concerns. First and foremost are the clear and adverse effects on the prey animals themselves [45,46,47]. Live prey introduced into an exhibit may suffer injury and ultimately death, with some facilities and/or countries choosing to restrict or prohibit the use of live prey [48,49]. A second concern for public facilities is the effect on visitors. Visitors may find live prey hunting and consumption unpleasant, and therefore detrimental to the visitor experience. With respect to the latter, several studies have demonstrated that, for the most part, zoo visitors find the use of live prey, both vertebrate and invertebrate, and for a variety of zoo- and aquarium-housed terrestrial and aquatic species on- or off-exhibit, an acceptable form of enrichment [49,50,51,52]. Therefore, facilities using live prey as enrichment should consider the advantages and disadvantages of such introductions on the exhibited animal, the introduced prey, and the visitors.
We examined the use of providing zoo penguins with live trout to increase swimming activity and overall exhibit use. We provided live trout once a week on Fridays at 11:00 h for several months. In addition, and prior to the implementation of live feeds, we measured swimming activity to examine daily and weekday versus weekend differences. During live feeds, we examined swimming activity and enclosure use in terms of hour-to-hour and overall daily effects. We hypothesized two main effects: (1) Live feeds would increase swimming times prior to and during the introduction of the trout, as well as on days (Fridays) that the live feed was introduced when compared to non-live feed days, and (2) Live feeds would increase overall enclosure use on days the fish were introduced.
2. Materials and Methods
2.1. Subjects and Enclosures
Subjects included 22 adult Humboldt penguins (Spheniscus humboldti; 11 males, 11 females). All penguins were captive-born and were between 1–17 years old. An additional 6 penguins were hatched during the study but not included as subjects. The penguins resided in a large, newly developed (2 May 2009) outdoor exhibit at the Woodland Park Zoo in Seattle, WA. The land area of the exhibit was 73 m2 with 27 multi-level nest burrows located in artificial rock formations in the back portion of the exhibit. The exhibit also consisted of a filtered pool (121 kL of water) that had water depths that varied from 0.76–2.7 m throughout the exhibit. Geothermal heating and cooling regulated pool temperature within a range of 5.6–24 °C. A surge wave tank was located on the northern, shallower end of the pool and released ~19 kL of water on timed intervals.
Penguins were hand-fed on land twice a day on exhibit, at 10:00 and 15:00 h. Penguin diets consisted of three species of fish: Herring (Clupea pallasii), capelin (Mallotus villosus), and smelt (Osmerus mordax). Each penguin was fed ~0.7 kg of fish per day.
2.2. Materials
Materials included live rainbow trout (Oncorhynchus mykiss; 20–25 g each; ~3.5–4 kg total) that were placed into the shallow end of the pool (Area IV; see Figure 1) at 11:00 h on Fridays. Other materials included Palm® handhelds used to record behavioural data, an Event-PC program that was run on the Palm® handhelds and designed specifically for this experiment by Dr. James C. Ha at the University of Washington, and a notebook used to record potential errors and additional observations/field notes that occurred during a session.
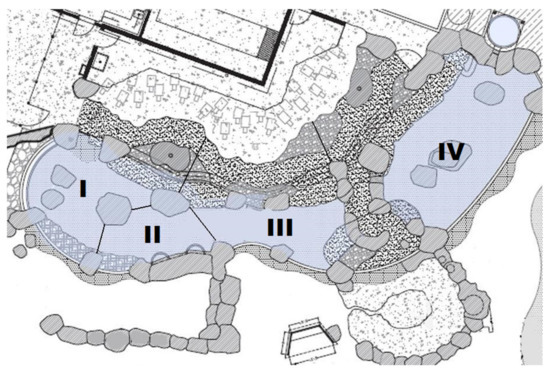
Figure 1.
Diagram of the Humboldt penguin exhibit, as viewed from above. Roman numerals (I–IV) represent each area, and lines represent their boundaries.
2.3. Design and Procedure
Prior to its implementation, the study was approved through Woodland Park Zoo’s Research Committee, as well as the University of Washington’s Institutional Animal Care and Use Committee (IACUC #2858-06). We used a modified scan sampling procedure [53] to record behaviours and exhibit location during all observation sessions. Figure 1 shows the penguin exhibit, which was divided into four possible observation areas (Area I–IV).
Our ethogram consisted of three mutually exclusive behaviours: Swimming (any activity [other than Grooming] in water), Grooming (preening, or beak contact with feathers in the water or on land), or Land Activity (any activity [other than Grooming] on land) (see Figure 2 and Figure 3 for examples). Every 30 s, an observer recorded the behaviour of every individual penguin in the focal area before moving to the next area. Observers began at Area I and moved sequentially through the exhibit areas to Area IV. Upon reaching Area IV, the observer reversed order sequentially back to Area I. The observer repeated this pattern for 30 min (the length of an observational session).
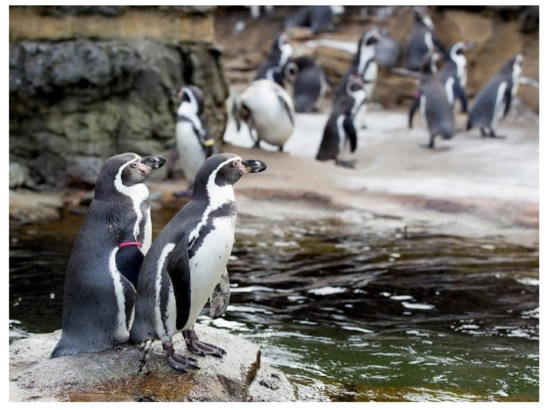
Figure 2.
Several penguins engaged in Land Activity in Area I.
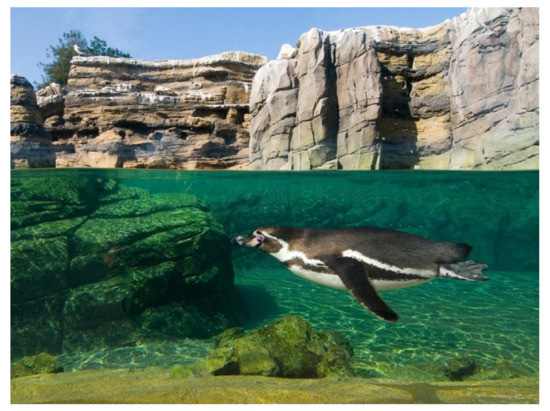
Figure 3.
Individual penguin engaged in Swimming Activity in Area IV.
As penguins were not individually identified, the number of penguins (n = 22) × the total number entire exhibit scans (n = 15) were aggregated to produce a single measure of total number of behaviour and area observations per session (n = 330). A potential limitation of this technique is that individual penguins could be observed in more than one area during each 2-min exhibit scan. For instance, between 30 s observations, a penguin could move from Area I to Area II and thus be observed in both areas. To determine how often this may have occurred, we calculated the total number of behaviours per session. If all penguins were observed only once during each of the 2-min intervals required to observe all four exhibit areas, the total number of behaviours observed in a session would be 330. A number greater than 330 would suggest that one or more penguins were counted more than once during one or more of the 2-min exhibit scan intervals of a session, while a smaller number would suggest the penguins moved so as not to be measured or were missed altogether. On average, 315 observations (~95%) were made per session, suggesting that only a small number of recordings resulted in missing one or more of the penguins.
All observations were conducted between 09:00–17:00 h, seven days a week, between 25 October 2009 and 13 August 2010 (774 total observations for 387 h of observation). Prior to the live trout feeds (25 October 2009–19 March 2010), we assessed the average daily and weekday versus weekend swimming activity. Live trout feeds began on 30 April 2010 and lasted until the end of all observations (334 total observations for 167 h of observation). All live trout feeds occurred every Friday at 11:00 h, with all trout being placed into the shallow end of the pool (Area IV) at that time. The live trout feeding was considered an extra-feeding, with all other feedings occurring per their usual schedule (see above).
A total of 31 observers collected data for the entire study. Observers were typically registered for independent research credit through the Psychology Department at the University of Washington (PSY 499) and received observation training by live training sessions at the beginning of each semester and weekly lab meetings throughout the study. Observations were examined weekly by the first author for consistency across all observers.
2.4. Statistical Analyses
We used SigmaStat™ 11.0 (Systat Software Inc., San Jose, CA, USA) to run all the statistical analyses. As tests for normality failed, a Kruskal–Wallis analysis of variance (ANOVA) on ranks and a Mann–Whitney Rank Sum (U) test were used to examine the daily (Monday–Sunday) and weekday versus weekend swimming activity in the months prior to the trout introduction, respectively. During the live trout introduction, we used standard t-tests (two-tailed) to examine differences in live feed days (Fridays) to all other non-live feed days, both in terms of total daily swimming activity and area use, and hour-to-hour swimming activity and area use. When a t-test failed to pass normality or an equal variance test, we performed a nonparametric Mann–Whitney Rank Sum (U) test. Effect sizes were reported via Cohen’s d (d) for t- or U-tests and eta squared (η2) for ANOVAs.
To examine overall enclosure use, we generated a measure of entropy [54] for each observation session. Entropy measures randomness across a set of variables and therefore produces a single measure of the total variability of enclosure use across the four possible areas. The measures of entropy were calculated by the formula:
where p(i) is the proportion of time spent in ith area. This formula produces a number from 0 to 1, with a higher value of H demonstrating more variability in overall enclosure use. Entropy was selected as a measure of variability in enclosure use (over a spread of participation index [SPI]; [55,56,57]) because it is sensitive to small sets of variables and does not require a modified formula to accurately handle unequal enclosure zones [58]. We applied the same t or U tests, as well as effect size measures, to differences in live feed vs. non-feed days.
H = −Σ p(i) log p(i)
3. Results
3.1. Pre-Trout Daily and Weekday Versus Weekend Swimming Activity
Figure 4 represents the average weekday versus weekend (top graph) and daily (bottom graph) swimming activity prior to the implementation of live trout.
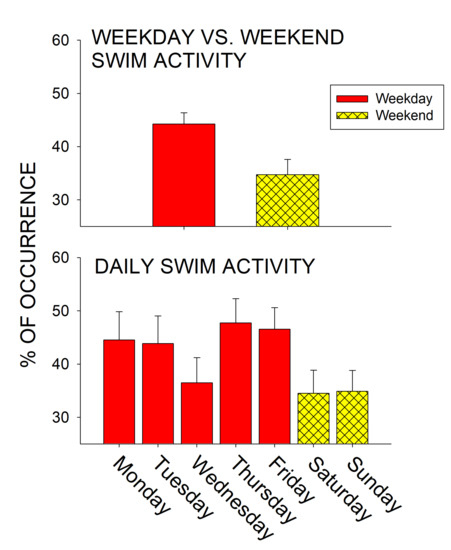
Figure 4.
Average swimming activity (with standard error of the mean bars) in the months prior to the live trout introductions. Overall swimming activity was compared for weekdays vs. weekends (top graph) and for each day of observation (Monday–Sunday; bottom graph).
No significant difference was observed in the average daily activity (x26 = 6.613, p = 0.358, η2 = 0.002). While not significant, penguins spent less time swimming on weekends compared to weekdays in the months prior to the delivery of trout (Weekday: M = 44.3, SE = 2.1; Weekday: M = 34.7, SE = 2.9; U317 = 10,719, p = 0.067, d = 0.254).
3.2. Live Feeding vs. Non-Live Feeding Days
Figure 5 represents the total daily change between the Non-Live Feeding days (Saturday–Thursday) and Live Feeding days (Fridays) for swimming activity (top graph) and exhibit use (Area I–IV; bottom graph).
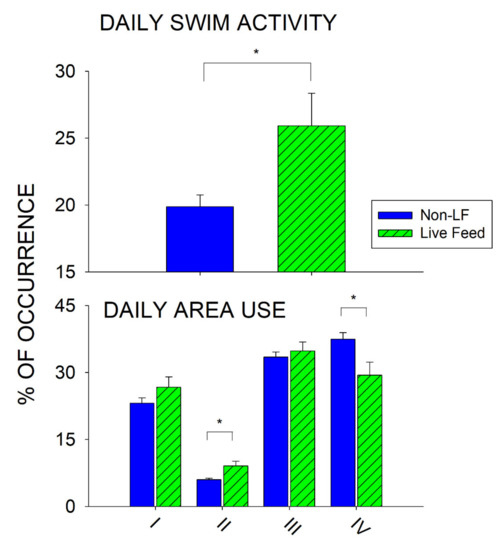
Figure 5.
Changes between the Non-Live Feeding (Non-LF) days (Saturday–Thursday) and Live Feeding days (Fridays) for total average swimming activity (with standard error of the mean bars; top graph) and enclosure use (Area I–IV; bottom graph). Significant differences (p < 0.05) are noted with asterisks and a solid line.
There was a significant increase in total daily swimming activity for Live Feeding days when compared to Non-Live Feeding days (U332 = 6918.5, p = 0.039, d = 0.227). Penguins spent on average 25.92% of their time swimming on Live Feeding days, compared to 19.87% of their time swimming on Non-Live Feeding days. There was also a significant increase in the use of Area II for Live Feeding days when compared to Non-Live Feeding days (U332 = 6428.5, p = 0.005, d = 0.308), and a significant decrease in the use of Area IV (U332 = 0.6645, p = 0.014, d = 0.272). Finally, there was a significant difference in swimming activity when comparing the day prior to a live feed (Thursday) to the Live Feeding day (U108 = 1128.5, p = 0.028, d = 0.429), and a large but non-significant difference when comparing the day following a live feed (Saturday) to the Live Feeding day (U93 = 807, p = 0.075, d = 0.373).
Figure 6 represents the total hourly change (09:00–17:00 h) between the Non-Live Feeding days and Live Feeding days for swimming activity (top graph), and the total daily change in overall enclosure use (entropy; bottom graph).
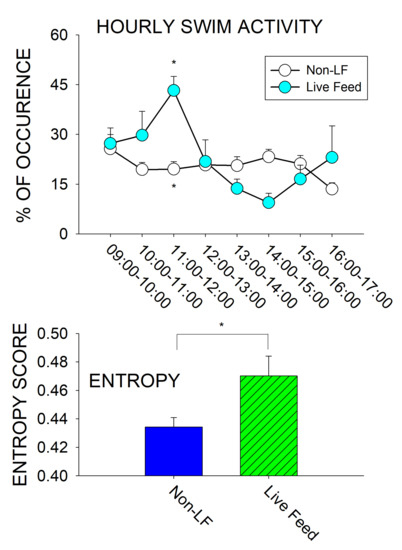
Figure 6.
Changes between the Non-Live Feeding (Non-LF) days (Saturday–Thursday) and Live Feeding days (Fridays) for the average hourly swimming activity (with standard error of the mean bars; 09:00–17:00 h; top graph) and overall enclosure use (entropy; bottom graph). Significant differences (p < 0.05) are noted with asterisks and a solid line.
Swimming significantly increased in the hour following the live trout delivery (11:00–12:00 h) when compared to Non-Live Feeding times (U49 = 52, p < 0.001, d = 1.373). This was preceded by a non-significant increase in swimming in the hour before the live feeding (10:00–11:00 h) and followed by a non-significant decrease in swimming following the live feeding (13:00–14:00 h; 14:00–15:00 h) when compared to Non-Live Feeding times. Overall enclosure use (entropy; bottom graph) increased on Live Feeding days (M = 0.47, SE = 0.01) compared to Non-Live Feeding days (M = 0.43, SE = 0.01; U332 = 6372, p = 0.004, d = 0.318).
Figure 7 represents the total hourly change (09:00–17:00 h) in area use (Area I–IV) throughout the exhibit.
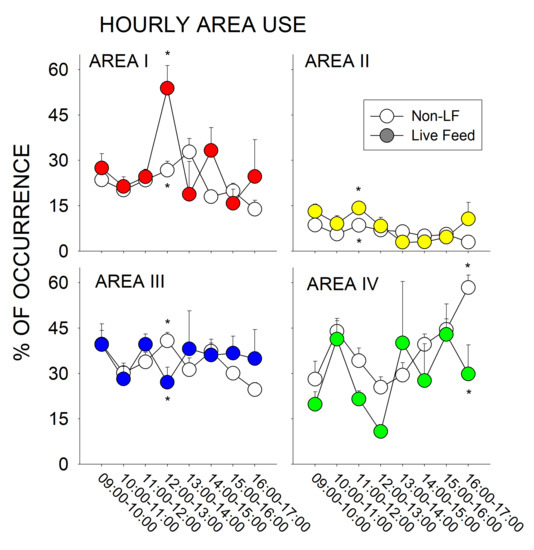
Figure 7.
Changes between the Non-Live Feeding (Non-LF) days (Saturday–Thursday; open circles) and Live Feeding days (Fridays; closed circles) for the average hourly area use throughout the exhibit (with standard error of the mean bars; Area I–IV; 0900–1700 h). Significant differences within a time period (p < 0.05) are noted with asterisks.
There was a significant increase in the use of Area II during Live Feeding days in the hour following the live feed (11:00–12:00 h) when compared to the Non-Live Feeding days (U49 = 120, p = 0.012, d = 0.758). There was also a significant increase in the use of Area I during Live Feeding days in the 12:00–13:00 h of observation and a significant decrease in the use of Area III when compared to Non-Live Feeding days (Area I, U38 = 34, p = 0.004, d = 1.032; Area III, t38 = −2.125, p = 0.04, d = 0.435). Finally, there was a significant decrease in the use of Area IV during Live Feeding days in the 16:00–17:00 h of observation when compared to Non-Live Feeding days (t28 = −3.011, p = 0.005, d = 0.795).
4. Discussion
4.1. Pre-Trout Swimming Activity
In the months prior to the live trout deliveries, we measured daily swimming, with interest in both average daily and weekday versus weekend swimming (see Figure 4). While the decreased swimming observed during weekends compared to weekdays was neither significant or part of the main purpose of our study, it seems noteworthy to mention, as weekends are typically associated with increased visitor presence and other researchers have observed decreased swimming and/or use of areas near visitors in little penguins (Eudyptula minor; [59,60,61]). Similarly, the potential negative effects of zoo visitors on animals have been well documented [62,63,64,65], and such animal-visitor interactions can further adversely impact the visitor experience [66,67,68]. It is therefore imperative to document the effects of visitors and variables associated with high visitor attendance (i.e., weekends) on exhibited penguins and other zoo animals, as well as identify potential enrichment strategies such as live feedings that might successfully deter any negative visitor effects.
4.2. Live Feeding vs. Non-Live Feeding Days
There was a significant increase in overall swimming time when we compared Live Feeding days to Non-Live Feeding days, which amounted to a more than 30% increase in swimming activity for the entire day of observations that live trout were introduced. There was also a significant increase in total variability of enclosure use (entropy) when we compared Live Feeding days to Non-Live Feeding days. Finally, most of the live feeding effect on swimming was limited to the days of the live feed, with Thursdays, the day prior to the live feed, and Saturdays, the day after resulting in significantly lower swimming activity or a large but non-significant difference, respectively.
In relation to the hour-to-hour changes, we observed two major effects: (1) An increase in swimming activity before and during the introduction of the live fish when compared to Non-Live Feeding days (i.e., a significant increase of over 120% in the hour when the trout were delivered) followed by a small decrease in two of the observation hours following the trout delivery, and (2) an immediate shift of the penguins within the exhibit away from Area IV and towards Area I after the delivery of the trout (i.e., a significant increase in Area II from 11:00–12:00 h; a significant decrease in Area III and increase in Area I from 12:00–13:00 h). With respect to the latter, most of the live fish placed into the exhibit at Area IV were quickly consumed by the penguins. The fish that were not consumed typically moved towards the deeper parts of the pool (Area I and II), which provided greater refuge from the predatory penguins. As a result, the penguins followed their potential prey, and thus were more likely to be observed in the hours following a trout delivery in those deeper exhibit areas.
One potential criticism of this study is that the effects observed during the live fish condition were mostly limited to the times before and during the trout delivery, with a small decrement in swimming in the hours following a live fish introduction. However, it is equally worth noting that (a) this still resulted in a more than 30% increase in overall swimming activity on the days of a live fish delivery, and (b) many enrichment studies (including most of the studies cited within this paper) limit their observations to either the times during the delivery of enrichment or the presence versus absence of enrichment across one period (e.g., days). Therefore, it is not clear if this criticism is limited to this study, or the way many enrichment studies are typically administered. Furthermore, fluctuations in activity prior to, during, and after feeding events are well-documented in basic laboratory research [69,70,71]. To better understand the function of enrichment, research should focus on moment-to-moment examinations of the changes that occur prior to and following enrichment deliveries, and not just during one period or event.
5. Conclusions
Taken together, the results suggest that while the live feeding effects observed were limited to the days and times when the trout were delivered, this still produced both a full day of increased swimming activity and overall enclosure use. It is equally worth noting that the live feed itself was easily administered, and that one live feeding provided ~170 g of trout per penguin. Thus, it would be feasible to deliver several live feeds several times a week. Future research could focus on the effects of supplementing portions of penguin diets with live feedings, as well as the potential physiological and behavioural welfare benefits of providing exhibited penguins with the ability to hunt and consume food in the water. While not directly measured, we observed increased porpoising on the part of the penguins while live fish were present, which is directly correlated with foraging activity in wild penguins [72]. Therefore, it is possible that presenting live prey allows penguins to express their natural behavioural repertoires more fully.
Finally, future research should be conducted on the effects of live prey on visitors observing such predator-prey interactions. While anecdotal, we observed increased crowd sizes and individual visitors attending to and talking about the penguins and their hunting of the live fish (see Video S1). Again, while anecdotal, most of the visitor experiences appeared positive, particularly with respect to children observing natural penguin predation. Previous researchers have noted that most visitors surveyed (72–85%) approved of the use of fish as live prey for zoo animals such as penguins and otters [50,51]. What remains unclear is how visitors would adjust their approval of live fish or other potential prey while directly observing predation. Such attempted enrichment strategies could be used as educational tools, and examined for associated factors, such as visitor enjoyment and conservation support. As the modern zoo becomes more directly equated with being an empirical zoo, these types of studies will become increasingly important.
Supplementary Materials
The following is available online at https://www.mdpi.com/2673-5636/2/1/7/s1, Video S1: Penguin Live Feed.
Author Contributions
Conceptualization, E.J.F.; methodology, E.J.F.; software, E.J.F.; formal analysis, E.J.F.; investigation, E.J.F.; resources, E.J.F., M.M., and N.C.H.; data curation, E.J.F.; writing—original draft preparation, E.J.F., M.M., and N.C.H.; writing—review and editing, E.J.F., M.M., and N.C.H.; project administration, E.J.F. All authors have read and agreed to the published version of the manuscript.
Funding
This study was completed while the first author was funded by a National Science Foundation Postdoctoral Fellowship in the Psychology Department at the University of Washington.
Institutional Review Board Statement
The study was conducted according to the guidelines of the Declaration of Helsinki, and approved by Woodland Park Zoo’s Research Committee, as well as the University of Washington’s Institutional Animal Care and Use Committee (IACUC #2858-06).
Data Availability Statement
The data presented in this study are available on request from the corresponding author.
Acknowledgments
The authors would like to thank all the Behavioral Enrichment Animal Research (BEAR) group’s Research Assistants for help in collecting the data. The authors would also like to thank Celine Pardo, John Samaras, and the Woodland Park Zoo for making this research possible and assisting in its implementation.
Conflicts of Interest
The authors declare no conflict of interest. The funders had no role in the design of the study; in the collection, analyses, or interpretation of data; in the writing of the manuscript, or in the decision to the results.
References
- Borboroglu, P.G.; Boersma, P.D. Penguins: Natural History and Conservation; University of Washington Press: Seattle, WA, USA, 2013. [Google Scholar]
- Brown, C. Traveling speed and foraging range of macaroni and rockhopper penguins at Marion Island. J. Field Ornith. 1987, 58, 118–125. [Google Scholar]
- Lynch, W. Penguins of the World; Firefly Books Ltd.: Buffalo, NY, USA, 2007. [Google Scholar]
- Kinley, R. Enrichment training for penguins. Am. Anim. Trainer 2000, 1, 10–13. [Google Scholar]
- Fowler, G.S.; Fowler, M.E. Order Spheniciformes (penguins). In Biology, Medicine, and Surgery of South American Wild Animals; Fowler, M.E., Cubas, Z.S., Eds.; Iowa State University Press: Ames, IA, USA, 2001; Volume 547. [Google Scholar]
- Reidarson, T.; McBain, J.; Burch, L. A Novel Approach to the Treatment of Bumblefoot in Penguins. J. Avian Med. Surg. 1999, 13, 124–127. [Google Scholar]
- Maple, T.L.; Perdue, B.M. Zoo Animal Welfare; Springer: Berlin, Germany, 2013. [Google Scholar]
- Mellen, J.; Sevenich MacPhee, M. Philosophy of environmental enrichment: Past, present, and future. Zoo Biol. 2001, 20, 211–226. [Google Scholar] [CrossRef]
- Young, R.J. Environmental Enrichment for Captive Animals; Blackwell Publishing: Oxford, UK, 2003. [Google Scholar]
- Fernandez, E.J.; Timberlake, W. Mutual benefits of research collaborations between zoos and academic institutions. Zoo Biol. 2008, 27, 470–487. [Google Scholar] [CrossRef]
- Hoy, J.M.; Murray, P.J.; Tribe, A. Thirty years later: Enrichment practices for captive mammals. Zoo Biol. 2010, 29, 303–316. [Google Scholar] [CrossRef]
- Markowitz, H. Behavioral Enrichment in the Zoo; Van Nostrand Reinhold: New York, NY, USA, 1982. [Google Scholar]
- Shepherdson, D.J. Tracing the path of environmental enrichment in zoos. In Second Nature: Environmental Enrichment for Captive Animals; Sherpherdson, D.J., Mellen, J.D., Hutchins, M., Eds.; Smithsonian Institutional Press: Washington, DC, USA, 1998; pp. 1–12. [Google Scholar]
- Andrews, N.L.; Ha, J.C. The effects of automated scatter feeders on captive grizzly bear activity budgets. J. Appl. Anim. Welf. Sci. 2014, 17, 148–156. [Google Scholar] [CrossRef]
- Bashaw, M.J.; Gibson, M.D.; Schowe, D.M.; Kucher, A.S. Does enrichment improve reptile welfare? Leopard geckos (Eublepharis macularius) respond to five types of environmental enrichment. Appl. Anim. Behav. Sci. 2016, 184, 150–160. [Google Scholar] [CrossRef]
- Carlstead, K.; Seidensticker, J.; Baldwin, R. Environmental enrichment for zoo bears. Zoo Biol. 1991, 10, 3–16. [Google Scholar] [CrossRef]
- Fernandez, E.J. Stereotypies and Foraging: Appetitive Search Behaviors and Stereotypies in Captive Animals; VDM Publishing: Saarbrucken, Germany, 2010. [Google Scholar]
- Markowitz Engineering environments for behavioral opportunities in the zoo. Behav Anal. 1978, 1, 34. [CrossRef]
- Markowitz, H.; Aday, C.; Gavazzi, A. Effectiveness of acoustic “prey”: Environmental enrichment for a captive African leopard (Panthera pardus). Zoo Biol. 1995, 14, 371–379. [Google Scholar] [CrossRef]
- Markowitz, H.; LaForse, S. Artificial prey as behavioral enrichment devices for felines. Appl. Anim. Behav. Sci. 1987, 18, 31–43. [Google Scholar] [CrossRef]
- Carlstead, K.; Brown, J.L.; Seidensticker, J. Behavioral and adrenocortical responses to environmental changes in leopard cats (Felis bengalensis). Zoo Biol. 1993, 12, 321–331. [Google Scholar] [CrossRef]
- Sherwin, C.M.; Lewis, P.D.; Perry, G.C. The effects of environmental enrichment and intermittent lighting on the behaviour and welfare of male domestic turkeys. Appl. Anim. Behav. Sci. 1999, 62, 319–333. [Google Scholar] [CrossRef]
- Carlstead, K.; Seidensticker, J. Seasonal variation in stereotypic pacing in an American black bear (Ursus americanus). Behav. Processes 1991, 25, 155–161. [Google Scholar] [CrossRef]
- Fernandez, E.J.; Timberlake, W. Foraging devices as enrichment in captive walruses (Odobenus rosmarus). Behav. Processes 2019, 168, 103943. [Google Scholar] [CrossRef] [PubMed]
- Graham, L.; Wells, D.L.; Hepper, P.G. The influence of olfactory stimulation on the behaviour of dogs housed in a rescue shelter. Appl. Anim. Behav. Sci. 2005, 91, 143–153. [Google Scholar] [CrossRef]
- Platt, D.M.; Novak, M.A. Videostimulation as enrichment for captive rhesus monkeys (Macaca mulatta). Appl. Anim. Behav. Sci. 1997, 52, 139–155. [Google Scholar] [CrossRef]
- Wells, D.L.; Irwin, R.M. Auditory stimulation as enrichment for zoo-housed Asian elephants (Elephas maximus). Anim. Welf. 2008, 17, 335–340. [Google Scholar]
- Fernandez, E.J.; Kinley, R.C.; Timberlake, W. Training penguins to interact with enrichment devices for lasting effects. Zoo Biol. 2019, 38, 481–489. [Google Scholar] [CrossRef] [PubMed]
- Laule, G.; Desmond, T. Positive reinforcement training as an enrichment strategy. In Second Nature: Environmental Enrichment for Captive Animals; Shepherdson, D.J., Mellen, J.D., Hutchins, M., Eds.; Smithsonian Institution Press: Washington, DC, USA, 1998; pp. 302–313. [Google Scholar]
- Altman, J.D. Animal activity and visitor learning at the zoo. Anthrozoos 1998, 11, 12–21. [Google Scholar] [CrossRef]
- Davey, G.; Henzi, P.; Higgins, L. The influence of environmental enrichment on Chinese visitor behavior. J. Appl. Anim. Welf. Sci. 2005, 8, 131–140. [Google Scholar] [CrossRef] [PubMed]
- Godinez, A.M.; Fernandez, E.J.; Morrissey, K. Visitor behaviors and perceptions of jaguar activities. Anthrozoos 2013, 26, 613–619. [Google Scholar] [CrossRef]
- Kutska, D. Variation in visitor perceptions of a polar bear enclosure based on the presence of natural vs. un-natural enrichment items. Zoo Biol. 2009, 28, 292–306. [Google Scholar] [CrossRef] [PubMed]
- Margulis, S.W.; Hoyos, C.; Anderson, M. Effect of felid activity on zoo visitor interest. Zoo Biol. 2003, 22, 587–599. [Google Scholar] [CrossRef]
- Stoinski, T.S.; Daniel, E.; Maple, T.L. A preliminary study of the behavioral effects of feeding enrichment on African elephants. Zoo Biol. 2000, 19, 485–493. [Google Scholar] [CrossRef]
- Law, G.; Macdonald, A.; Reid, A. Dispelling some common misconceptions about the keeping of felids in captivity. Int. Zoo Yearb. 1997, 35, 197–207. [Google Scholar] [CrossRef]
- McPhee, M.E.; Carlstead, K. The importance of maintaining natural behaviors in captive mammals. In Wild Mammals in Captivity: Principles and Techniques for Zoo Management; Kleiman, D.G., Thompson, K.V., Kirk Baer, C., Eds.; The University of Chicago Press: Chicago, IL, USA, 2010; pp. 303–313. [Google Scholar]
- McPhee, M.E. Intact carcasses as enrichment for large felids: Effects on on-and off-Exhibit behaviors. Zoo Biol. 2002, 21, 37–47. [Google Scholar] [CrossRef]
- Stark, B. The use of carcass feeding to enhance animal welfare. In Proceedings of the Seventh International Conference on Environmental Enrichment, New York, NY, USA, 31 July–5 August 2005; pp. 198–204. [Google Scholar]
- Forthman-Quick, D.L. An integrative approach to environmental engineering in zoos. Zoo Biol. 1984, 3, 65–77. [Google Scholar] [CrossRef]
- Markowitz, H.; Stevens, V.J. Behavior of Captive Wild Animals; Nelson-Hall: Chicago, IL, USA, 1978. [Google Scholar]
- Bashaw, M.J.; Bloomsmith, M.A.; Marr, M.J.; Maple, T.L. To hunt or not to hunt? A feeding enrichment experiment with captive large felids. Zoo Biol. 2003, 22, 189–198. [Google Scholar] [CrossRef]
- Foster-Turley, P.; Markowitz, H. A captive behavioral enrichment study with Asian small-clawed river otters Aonyx cinerea. Zoo Biol. 1982, 1, 29–43. [Google Scholar] [CrossRef]
- Shepherdson, D.J.; Carlstead, K.; Mellen, J.D.; Seidensticker, J. The influence of food presentation on the behavior of small cats in confined environments. Zoo Biol. 1993, 12, 203–216. [Google Scholar] [CrossRef]
- Cooper, J.E.; Williams, D.L. The feeding of live food to exotic pets: Issues of welfare and ethics. J. Exot. Pet. Med. 2014, 23, 244–249. [Google Scholar] [CrossRef]
- Keller, M. Feeding live invertebrate prey in zoos and aquaria: Are there welfare concerns? Zoo Biol. 2017, 36, 316–322. [Google Scholar] [CrossRef]
- Wickins-Dražilová, D. Zoo animal welfare. J. Agric. Environ. Ethics 2006, 19, 27–36. [Google Scholar] [CrossRef]
- Hosey, G.; Melfi, V.; Pankhurst, S. Feeding and nutrition. In Zoo Animals: Behaviour, Management, and Welfare; Hosey, G., Melfi, V., Pankhurst, S., Eds.; Oxford University Press: Oxford, UK, 2013; pp. 418–460. [Google Scholar]
- Marshall, L.; McCormick, W.D.; Cooke, G.M. Perception of the ethical acceptability of live prey feeding to aquatic species kept in captivity. PLoS ONE 2019, 14, e0216777. [Google Scholar] [CrossRef]
- Cottle, L.; Tamir, D.; Hyseni, M.; Bühler, D.; Lindemann-Matthies, P. Feeding live prey to zoo animals: Response of zoo visitors in Switzerland. Zoo Biol. 2010, 29, 344–350. [Google Scholar] [CrossRef]
- Ings, R.; Waran, N.K.; Young, R.J. Attitude of zoo visitors to the idea of feeding live prey to zoo animals. Zoo Biol. 1997, 16, 343–347. [Google Scholar] [CrossRef]
- McDole, E. Fish introduction to jaguars (Panthera onca): Response of zoo visitors and jaguars. Ph.D. Thesis, Georgia Institute of Technology, Atlanta, GA, USA, 2007. [Google Scholar]
- Altmann, J. Observational study of behavior: Sampling methods. Behaviour 1974, 49, 227–266. [Google Scholar] [CrossRef] [PubMed]
- Shannon, C.E. A mathematical theory of communication. Bell Syst. Tech. J. 1948, 27, 379–423. [Google Scholar] [CrossRef]
- Dickens, M. A statistical formula to quantify the “spread-of-participation” in group discussion. Speech Monogr. 1955, 22, 28–30. [Google Scholar] [CrossRef]
- Hedeen, S.E. Utilization of space by captive groups of lowland gorillas (Gorilla g. gorilla). Ohio J. Sci. 1982, 82, 27–30. [Google Scholar]
- Plowman, A.B. A note on a modification of the spread of participation index allowing for unequal zones. Appl. Anim. Behav. Sci. 2003, 83, 331–336. [Google Scholar] [CrossRef]
- Fernandez, E.J.; Timberlake, W. Selecting and testing environmental enrichment in lemurs. Front. Psychol. 2019, 10, 2119. [Google Scholar] [CrossRef]
- Chiew, S.J.; Butler, K.L.; Sherwen, S.L.; Coleman, G.J.; Fanson, K.V.; Hemsworth, P.H. Effects of regulating visitor viewing proximity and the intensity of visitor behaviour on little penguin (Eudyptula minor) behaviour and welfare. Animals 2019, 9, 285. [Google Scholar] [CrossRef]
- Chiew, S.J.; Butler, K.L.; Sherwen, S.L.; Coleman, G.J.; Melfi, V.; Burns, A.; Hemsworth, P.H. Effect of Covering a Visitor Viewing Area Window on the Behaviour of Zoo-Housed Little Penguins (Eudyptula minor). Animals 2020, 10, 1224. [Google Scholar] [CrossRef]
- Sherwen, S.L.; Magrath, M.J.; Butler, K.L.; Hemsworth, P.H. Little penguins, Eudyptula minor, show increased avoidance, aggression and vigilance in response to zoo visitors. Appl. Anim. Behav. Sci. 2015, 168, 71–76. [Google Scholar] [CrossRef]
- Davey, G. Visitors’ effects on the welfare of animals in the zoo: A review. J. Appl. Anim. Welf. Sci. 2007, 10, 169–183. [Google Scholar] [CrossRef]
- Fernandez, E.J.; Tamborski, M.A.; Pickens, S.R.; Timberlake, W. Animal–visitor interactions in the modern zoo: Conflicts and interventions. Appl. Anim. Behav. Sci. 2009, 120, 1–8. [Google Scholar] [CrossRef]
- Hosey, G.R. Zoo animals and their human audiences: What is the visitor effect? Anim. Welf. 2000, 9, 343–357. [Google Scholar]
- Sherwen, S.L.; Hemsworth, P.H. The visitor effect on zoo animals: Implications and opportunities for zoo animal welfare. Animals 2019, 9, 366. [Google Scholar] [CrossRef] [PubMed]
- Chiew, S.J.; Hemsworth, P.H.; Melfi, V.; Sherwen, S.L.; Burns, A.; Coleman, G.J. Visitor attitudes towards little penguins (Eudyptula minor) at two Australian zoos. Front. Psychol. 2021, 12, 626185. [Google Scholar] [CrossRef] [PubMed]
- Chiew, S.J.; Hemsworth, P.H.; Sherwen, S.L.; Melfi, V.; Coleman, G.J. The effect of regulating zoo visitor-penguin interactions on zoo visitor attitudes. Front. Psychol. 2019, 10, 2351. [Google Scholar] [CrossRef] [PubMed]
- Godinez, A.M.; Fernandez, E.J. What is the zoo experience? How zoos impact a visitor’s behaviors, perceptions, and conservation efforts. Front. Psychol. 2019, 10, 1746. [Google Scholar] [CrossRef]
- Carneiro, B.T.S.; Araujo, J.F. Food entrainment: Major and recent findings. Front. Behav. Neurosci. 2012, 6, 83. [Google Scholar] [CrossRef] [PubMed]
- Fernandez, E.J.; Timberlake, W. Superstition revisited: Sex, species, and adventitious reinforcement. Behav. Processes 2020, 170, 103979. [Google Scholar] [CrossRef]
- Gillman, A.G.; Rebec, G.V.; Pecoraro, N.C.; Kosobud, A.E. Circadian entrainment by food and drugs of abuse. Behav. Processes 2019, 165, 23–28. [Google Scholar] [CrossRef]
- Yoda, K.; Sato, K.; Niizuma, Y.; Kurita, M.; Bost, C.; Le Maho, Y.; Naito, Y. Precise monitoring of porpoising behaviour of Adélie penguins determined using acceleration data loggers. J. Exp. Biol. 1999, 202, 3121–3126. [Google Scholar]
Publisher’s Note: MDPI stays neutral with regard to jurisdictional claims in published maps and institutional affiliations. |
© 2021 by the authors. Licensee MDPI, Basel, Switzerland. This article is an open access article distributed under the terms and conditions of the Creative Commons Attribution (CC BY) license (http://creativecommons.org/licenses/by/4.0/).