1. Introduction
Air transport plays an important role in the global economy, as it supports international trade, tourism, and cultural exchange. It allows for the swift transportation of goods and individuals over long distances, significantly enhancing economic development and globalization. The International Air Transport Association (IATA) reported that airlines worldwide facilitated 4.5 billion passenger journeys and carried goods valued at over USD 6.7 trillion in 2019 [
1]. The air transport industry directly and indirectly supported approximately 87.7 million jobs. However, the industry faced severe challenges due to the COVID-19 pandemic in 2020 [
1]. The International Civil Aviation Organization (ICAO) indicated that global air passenger traffic dropped by around 60% in 2020 [
2]. The downturn began in China, where the domestic aviation market experienced a significant decline early in 2020 [
3,
4]. As the pandemic spread, its effect on air transport became evident worldwide, reaching a peak in April 2020, when air passenger traffic fell by 94% compared to April 2019 [
1,
4]. The majority of passenger aircraft were grounded, as countries implemented travel restrictions, quarantines, and social distancing measures. This led to the collapse of air passenger connections between cities worldwide. While freight services continued, the disruption was significant, since approximately half of air cargo is transported on passenger flights [
5]. The near halt of passenger operations severely affected global supply chains that modern economies depend on. Additionally, the demand for medically related products caused an increase in air cargo volume, prompting the conversion of some passenger aircraft into cargo carriers. From April 2020 to December 2022, air passenger traffic began to recover along various trajectories in different regions [
4]. The U.S. air transport industry showed a steady recovery, aided by a relatively high tolerance for COVID-19 among the government and the public. By December 2022, U.S. air passenger traffic reached 80.2 million, reflecting only a 10.5% decrease from December 2019, the final month prior to the pandemic [
4]. In Europe, the air transport industry also experienced significant recovery from June 2020 to December 2022, with passenger traffic totaling 57.5 million in December 2022, which was about 24.2% lower than the pre-COVID-19 level [
4]. In China, air passenger traffic stood at 18.7 million in December 2022, representing a decline of over 64.5% from 52.8 million in December 2019. Fortunately, following the end of strict COVID-19 measures in late December 2022, China’s air passenger traffic began to recover rapidly, reaching 50.6 million in December 2023 and 56.98 million in December 2024.
The strategic importance of air transport is particularly evident in regions that serve as major international hubs, with Hong Kong being a prime example. Hong Kong stands out as a prominent center for both international and regional aviation. Its status as an international aviation hub is embedded in its constitutional framework, as the Basic Law requires the preservation of this status [
6]. The city’s sophisticated infrastructure and free-market economic policies have historically supported its position as a crucial hub for passengers and cargo alike [
6,
7]. Furthermore, Hong Kong’s geographical location makes it an ideal gateway to mainland China and the wider Asia–Pacific region, enhancing its connectivity and attractiveness as a stopover destination [
8,
9]. The Guangdong–Hong Kong–Macao Greater Bay Area (GBA) initiative further underscores Hong Kong’s significance in the aviation industry. This initiative aims to integrate the region’s economies and create new opportunities for the city to reinforce its status as a hub for international and regional aviation [
6]. Moreover, the city’s collaboration with nearby airports, such as through the Hong Kong–Zhuhai–Macao Bridge, enhances its connectivity and supports the Belt and Road economic corridor, further solidifying its strategic position in global air transport [
10]. However, the COVID-19 pandemic has had a profound adverse effect on Hong Kong’s air transport. Air passenger traffic plummeted by 86.2% while air cargo was found to drop modestly by 6% in 2020, compared to 2019 levels [
11].
Air transport operations require a huge investment and a considerable amount of energy [
12]. Furthermore, most aircrafts must be refueled before departing from an airport. The use of aviation kerosene is essential for providing the necessary thrust to take off, ensuring a smooth flight, and allowing for a safe landing at the destination. However, the combustion of aviation kerosene results in the emission of various greenhouse gases (GHGs), including carbon dioxide (CO
2) and nitrogen oxides (NO
x), as well as water vapor, sulfur oxides, and particulate matter (PM). This study specifically aims to develop a seasonal autoregressive integrated moving average (ARIMA) model to analyze aviation kerosene consumption in Hong Kong, utilizing data from the first quarter of 2010 to the fourth quarter of 2018, prior to the adverse effects of Hong Kong’s social unrest and the significant impact of the COVID-19 pandemic, and to utilize the then developed model to assess the reduction in GHG emissions due to the pandemic.
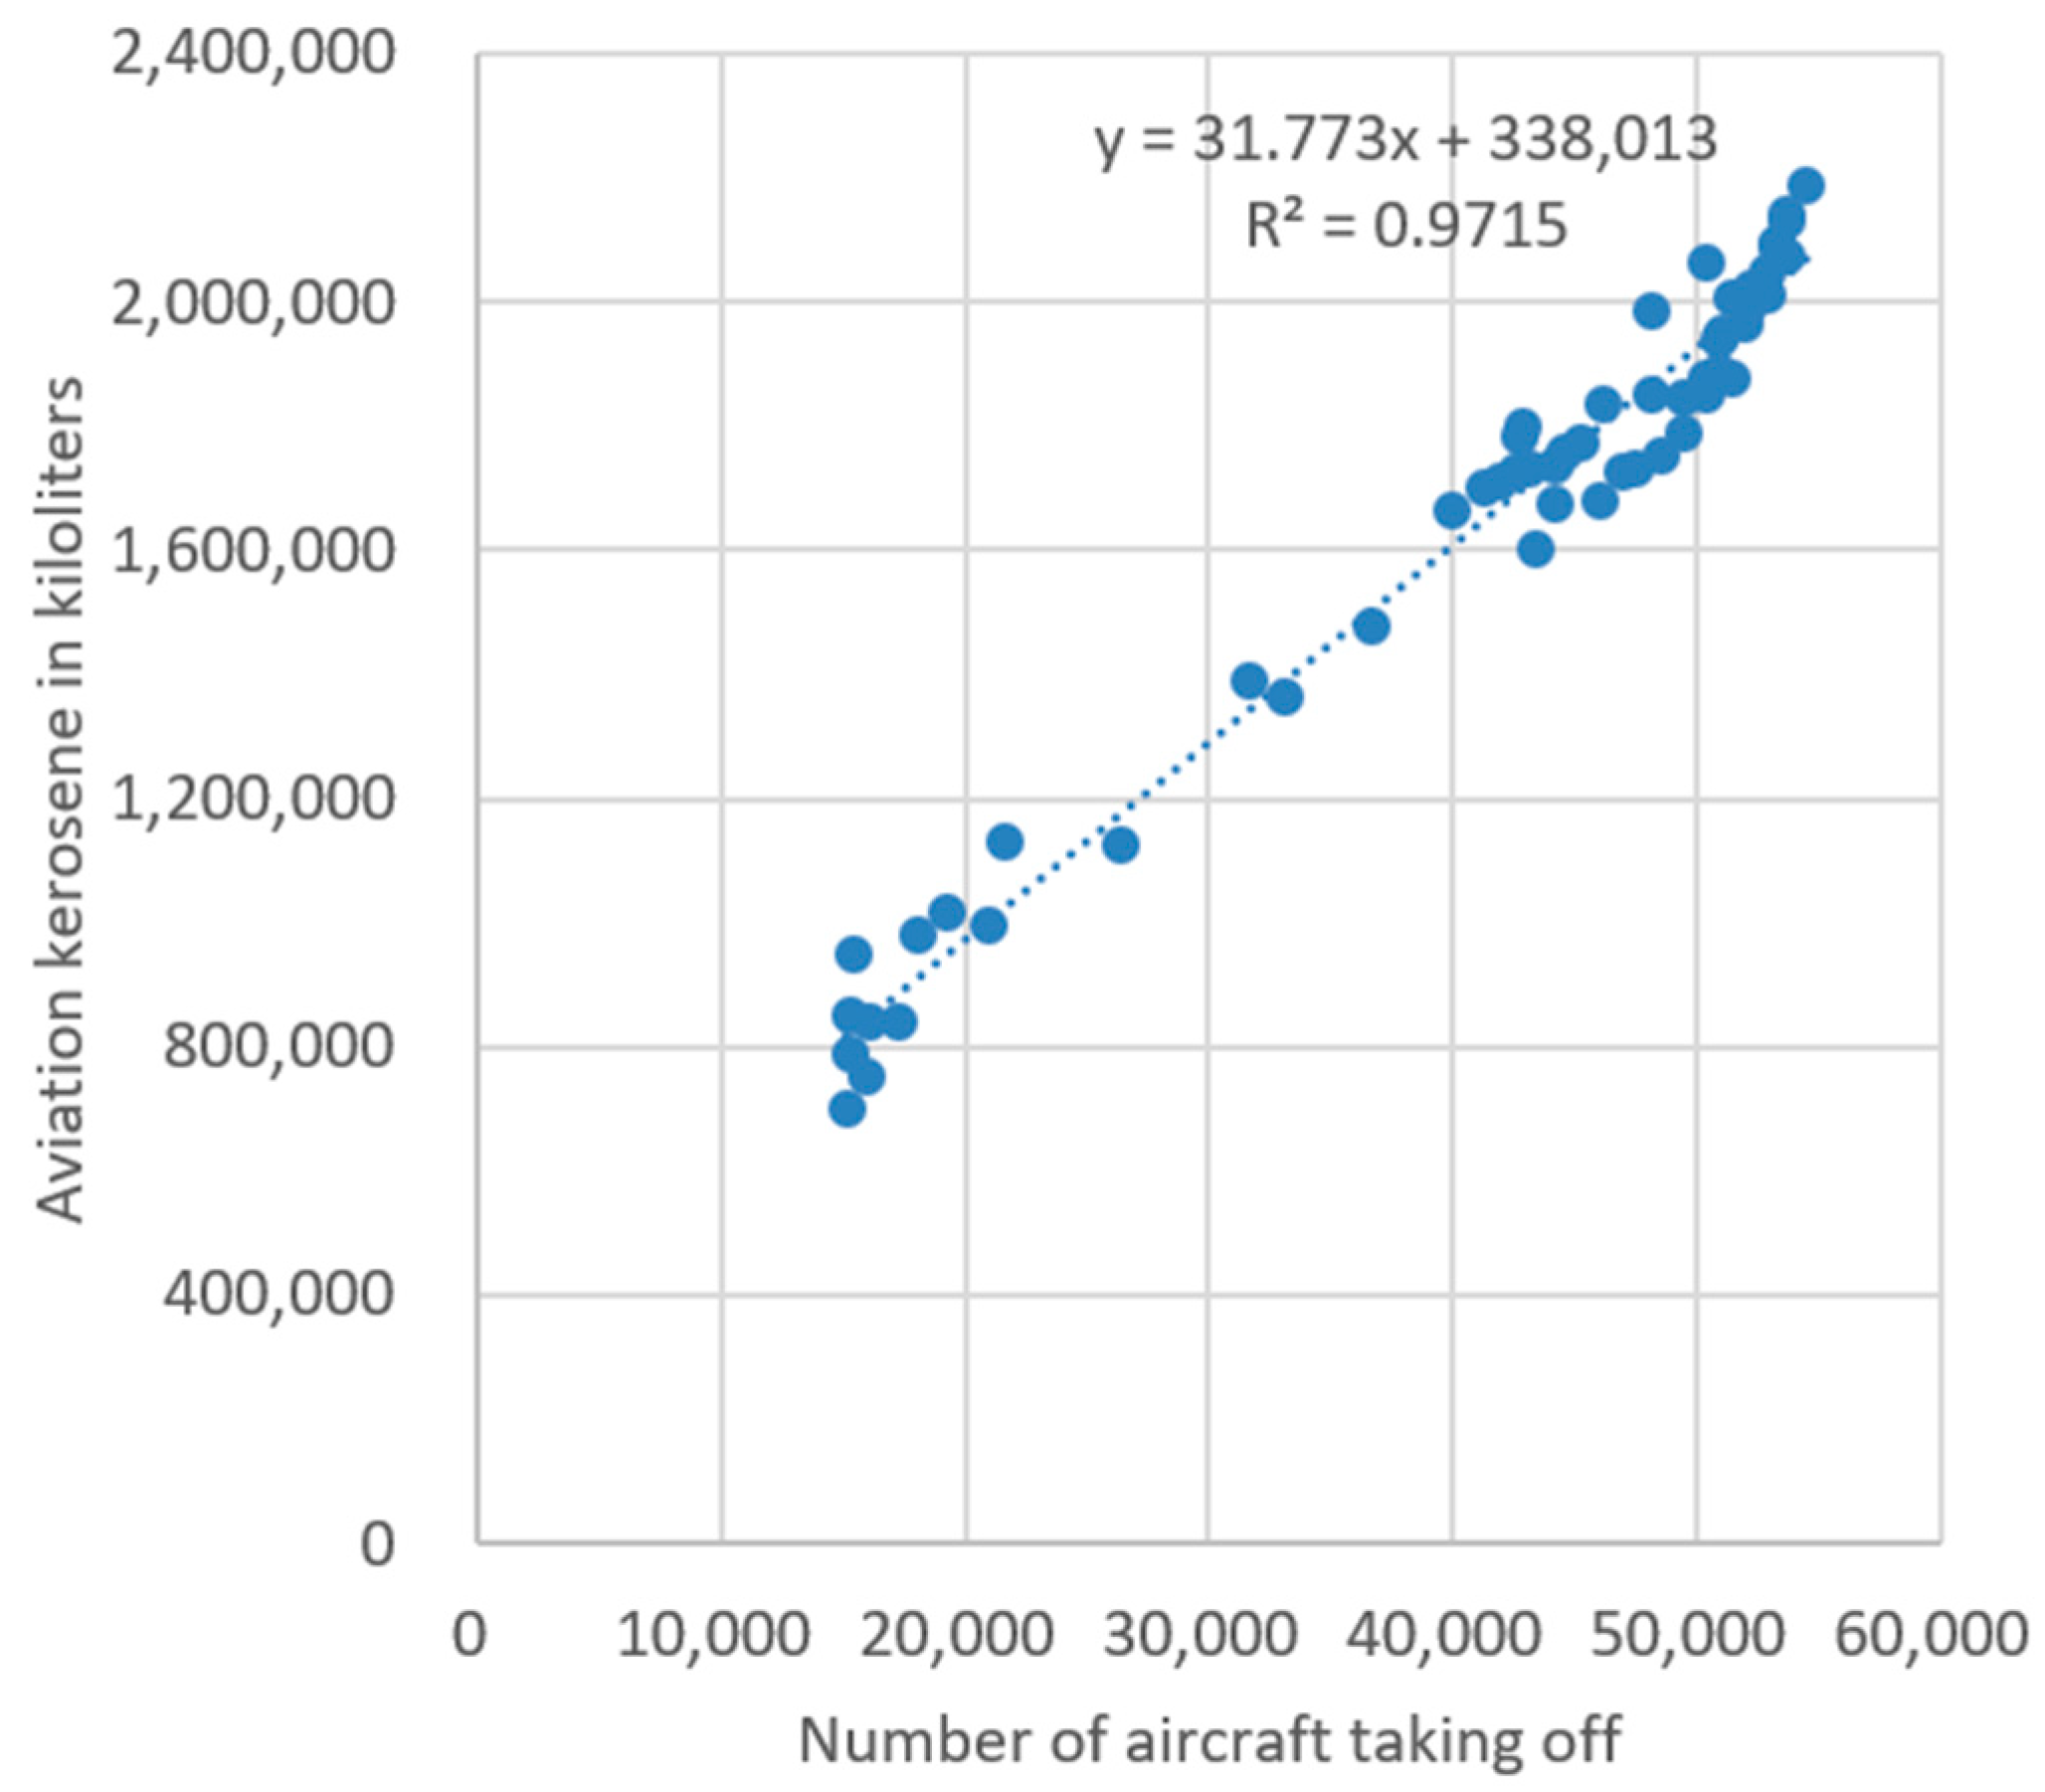
More specifically, this study will commence with determining the relationship between the number of aircraft taking off from Hong Kong and aviation kerosene consumption. Subsequently, it will identify the optimal seasonal ARIMA model to characterize aviation kerosene consumption using quarterly data from 2010 to 2018. The model will be employed to forecast quarterly aviation kerosene consumption from 2019 to 2030. By utilizing emission and conversion factors from the Intergovernmental Panel on Climate Change (IPCC), this study will estimate GHG emissions linked to aviation kerosene consumption in Hong Kong from 2010 to 2030 [
13] and evaluate the reduction in GHG emissions resulting from the COVID-19 pandemic. This study addresses the existing gap regarding the insufficient modeling of air transport following the COVID-19 pandemic [
11], as well as the scarcity of studies dedicated to modeling air transport and its GHG emissions throughout the past, present, and future of air transport operations. Consequently, the findings of this study offer valuable insights into GHG emissions from the Hong Kong air transport industry for the years 2011 to 2030. Furthermore, this study uncovers important connections between aircraft movements, aviation kerosene consumption, and critical incidents, such as the COVID-19 pandemic. This indicates that either aircraft movements or aviation kerosene consumption can serve as an early warning system for potential economic disruptions. With China’s commitment to reaching peak carbon emission by 2030 and achieving carbon neutrality by 2060 [
14], Hong Kong, as a key transport hub within the country, faces a considerable challenge if its air authority, airlines, and aviation fuel suppliers continue with business as usual. This research explores the significant challenge present by the increase in GHG emissions. It assesses the shortcomings of existing mitigation efforts and highlights the pressing need for innovation solutions. Potential strategies for reducing GHG emissions include improving operational efficiency, embracing sustainable aviation fuels, and electrifying specific operations. This encompasses the deployment of electric unmanned aerial vehicles for transporting goods and passengers between Hong Kong and its nearby cities in mainland China.
The rest of this paper is structured as follows:
Section 2 provides a literature review on air transport modeling, focusing on predictive modeling using time series data, followed by Materials and Methods, in
Section 3.
Section 4 presents the Results.
Section 5 covers the discussion and conclusions, including the implications and limitations of this study.
3. Materials and Methods
Hong Kong has long been recognized as a major air transport hub, playing a crucial role in global aviation networks. Its strategic geographic location and advanced infrastructure have enabled it to serve as a key transit point for both travelers and air cargo [
5]. Notably, prior to the relocation of its airport to Chek Lap Kok, the former Kai Tak Airport was already the third-busiest airport globally for international travelers and the largest for freight in the 1990s [
35]. Anticipating the constraints of an airport situated in the city center, the Hong Kong Government embarked on the construction of a new airport on Chek Lap Kok, a man-made island adjacent to Lantau Island, in 1989. The Hong Kong International Airport was inaugurated with a single runway in July 1998, with an estimated construction cost of around USD 60 billion. The project marked a significant achievement in Hong Kong’s infrastructure development, underscoring its commitment to preserving its role as a leading international aviation hub [
36]. Within a year of its opening, the airport opened a second runway in May 1999. The construction of a third runway commenced in 2016. The third runway was officially opened in November 2022 for USD 18 billion. Between 2011 and 2018, Hong Kong International Airport ranked as the third busiest airport for international passenger traffic and held the title of the busiest airport for cargo [
37].
3.1. Data Sources and Data
Aircraft operations and the consumption of aviation kerosene are intricately related. The Hong Kong Civil Aviation Department (HKCAD) oversees air traffic control services for all aircraft within the Hong Kong Flight Information Region and maintains air traffic statistics. Monthly data on aircraft departures from 2011 to 2024 was sourced from the HKCAD website at
https://www.cad.gov.hk/english/statistics.html (accessed on 1 May 2025) [
38]. For information on aviation kerosene consumption, the Hong Kong Census and Statistics Department (HKCSD) publishes annual and quarterly reports titled “Hong Kong Energy Statistics,” which include data on aviation kerosene usage categorized by “sales of oil products by type of users,” accessible at
https://www.censtatd.gov.hk/en/scode90.html (accessed on 1 May 2025) [
39]. This study obtained aviation kerosene consumption data for Hong Kong from the first quarter of 2011 to the fourth quarter of 2024, which was the most recent data available at the time of this writing. Given that the aviation kerosene consumption data is reported quarterly, the monthly aircraft departure figures from Hong Kong for the years 2011 to 2024 were converted to quarterly data.
3.2. Seasonal ARIMA Model
In time series, seasonality refers to a consistent pattern of fluctuations that recurs every
S time intervals, where
S indicates the number of intervals before the pattern reappears. For data collected quarterly,
S is typically set to 4 intervals per year. In a seasonal ARIMA model, the seasonal autoregressive (AR) and moving average (MA) components forecast the value of
xt by utilizing data points and errors from previous periods that are multiples of
S. Indeed, the seasonal ARIMA model effectively integrates both seasonal and non-seasonal elements within a comprehensive framework. The model is denoted as ARIMA(
p,
d,
q)(
P,
D,
Q)
S, where
p represents the order of the non-seasonal AR,
d signifies the degree of non-seasonal differencing,
q indicates the order of the non-seasonal MA,
P denotes the order of the seasonal AR,
D represents the degree of seasonal differencing,
Q indicates the order of the seasonal MA, and
S specifies the duration of the recurring seasonal pattern. The model can be expressed mathematically as
where
xt is the nonstationary time series, and
εt is the Gaussian white noise process. Additionally, the non-seasonal components include the AR and MA parts:
The seasonal components also consist of the AR and MA parts:
The differencing operators are
The backshift operator
B is defined as
In this research, a seasonal ARIMA model was utilized to analyze quarterly aviation kerosene consumption data in Hong Kong, covering the period from the first quarter of 2011 to the fourth quarter of 2018. The data were sourced from the Hong Kong Census and Statistics Department [
39] and imported into IBM SPSS 29.0 for time series modeling using the Forecasting module. Following the methodology proposed by Box and Jenkins [
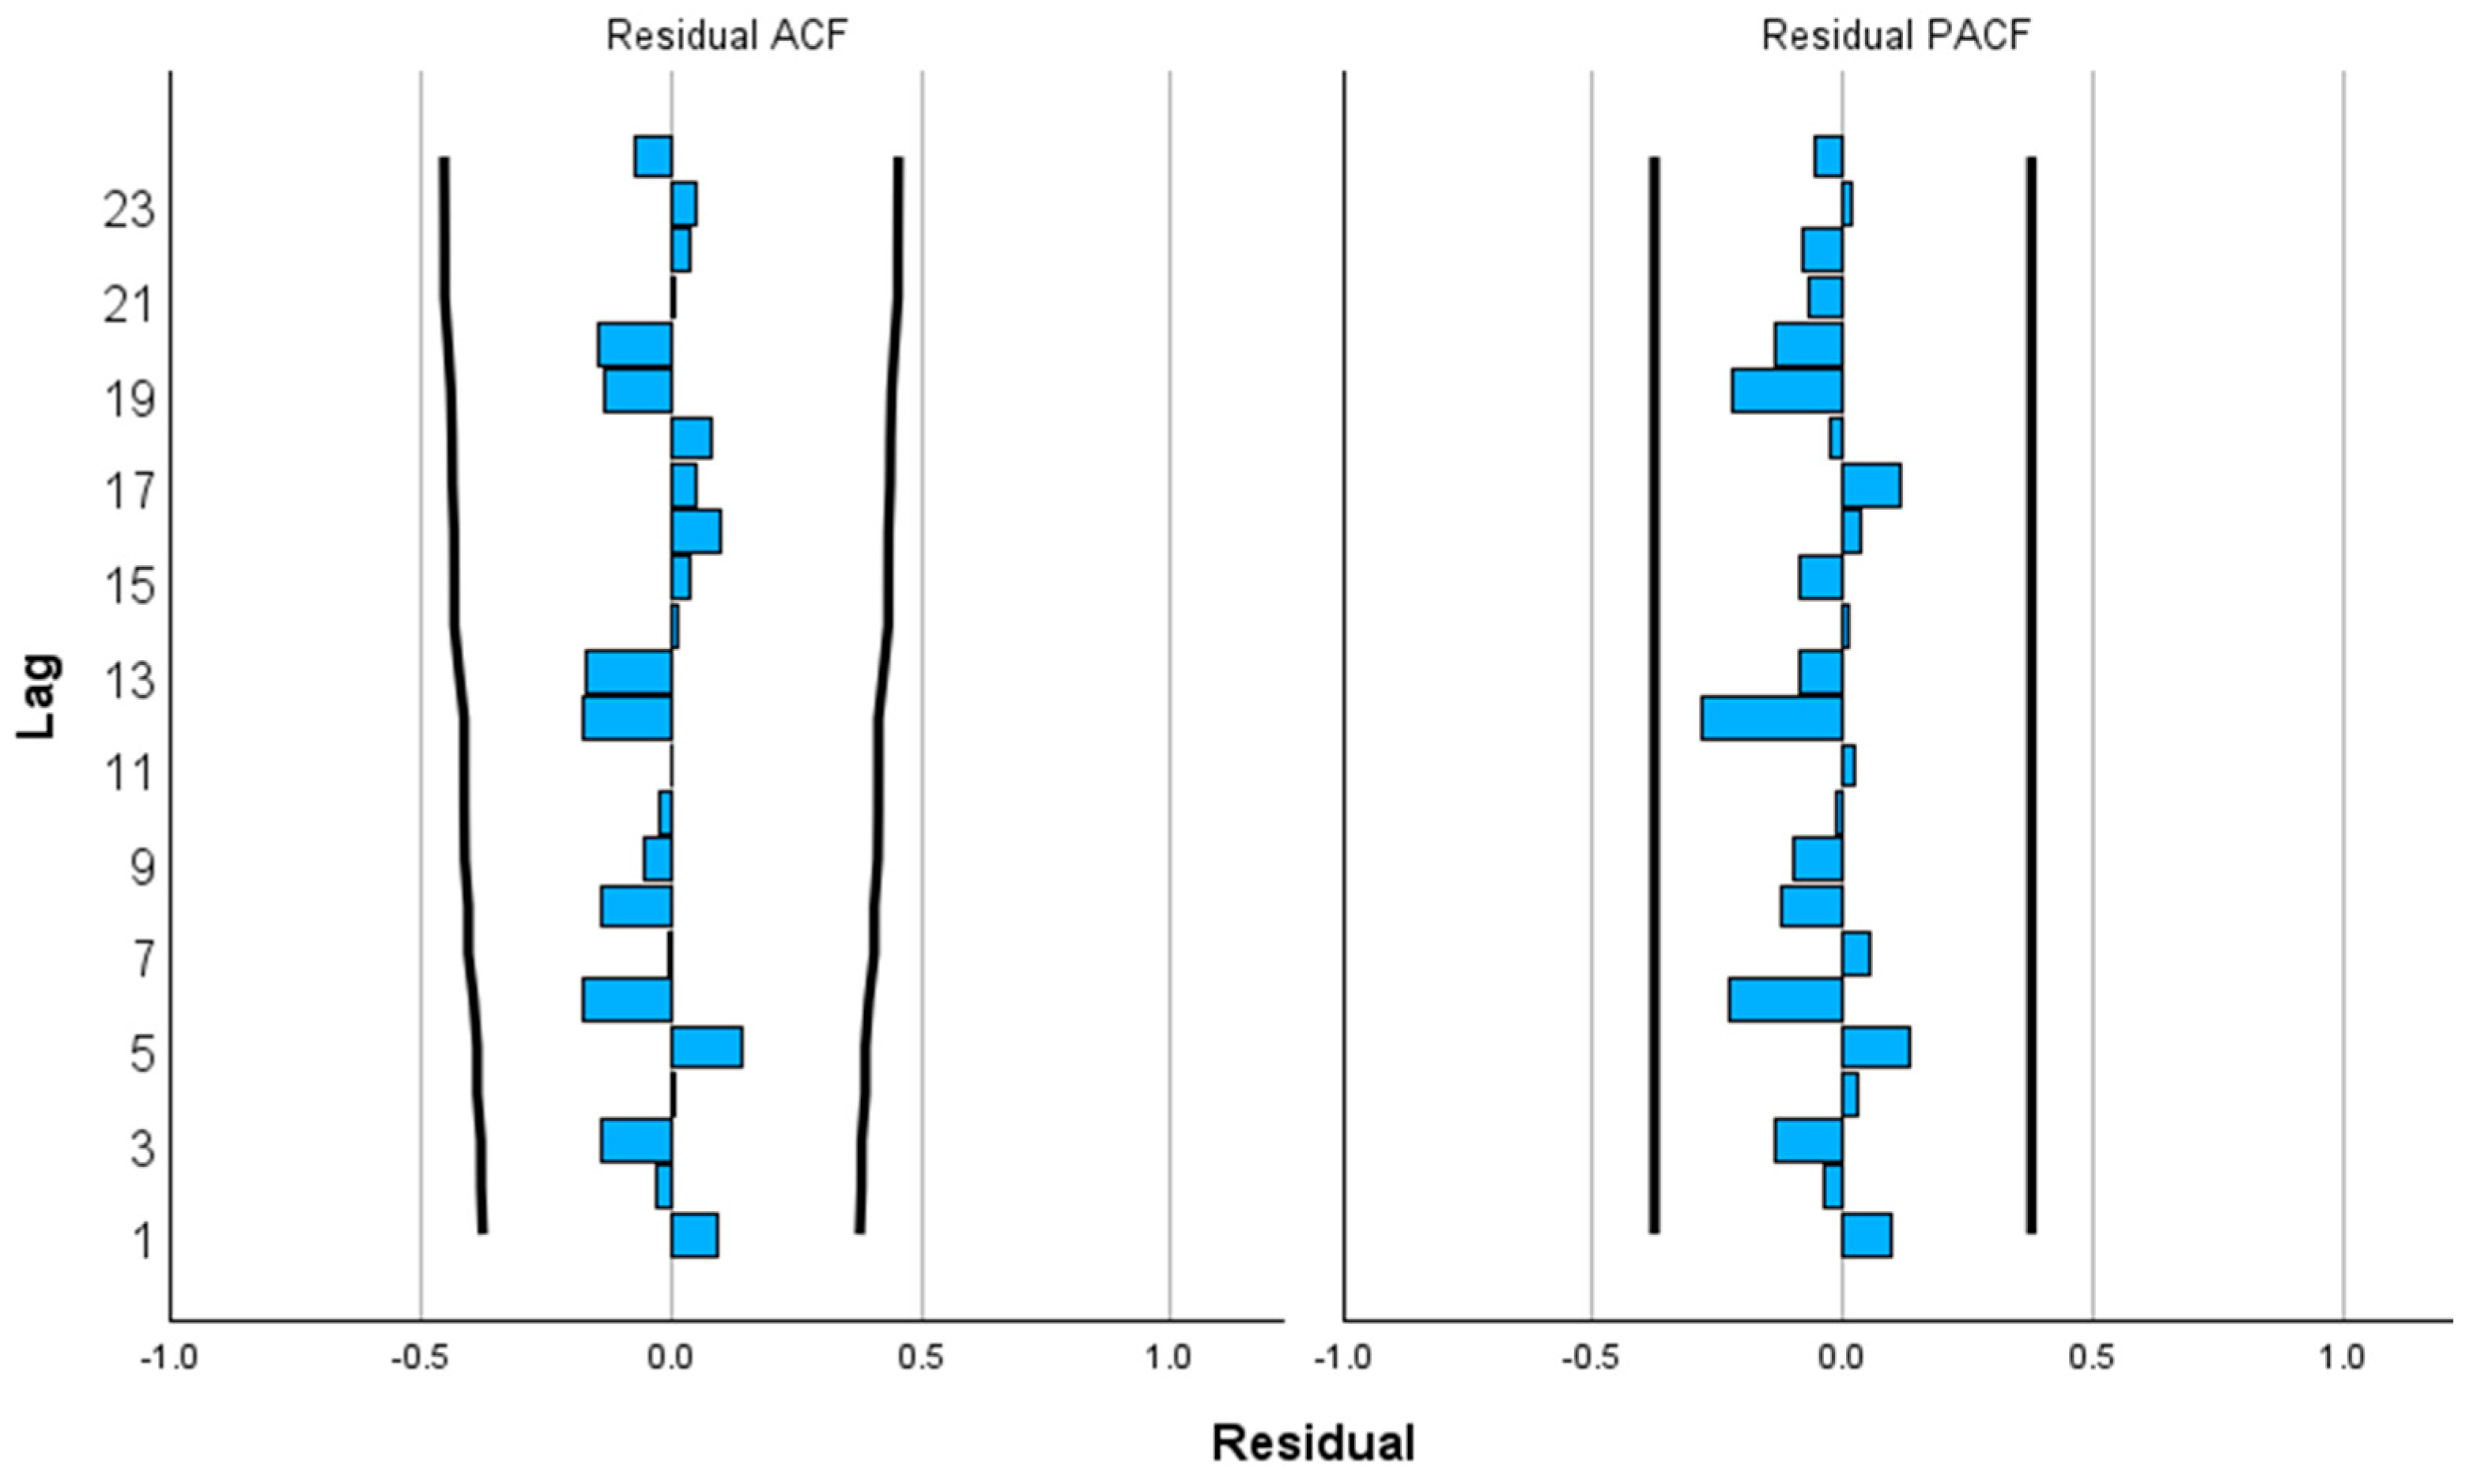
22], the development of a seasonal ARIMA model for a specific time series should involve three key steps: model identification, model fitting, and model verification.
During the initial phase, the numbers of differencing, i.e., d and D, which render the time series stationary, were determined through plots of the differenced time series. The autocorrelation and partial autocorrelation functions were employed to ascertain the degrees of AR and seasonal AR components, represented as p and P, as well as the degrees of MA and seasonal MA components, indicated as q and Q, following the differencing process.
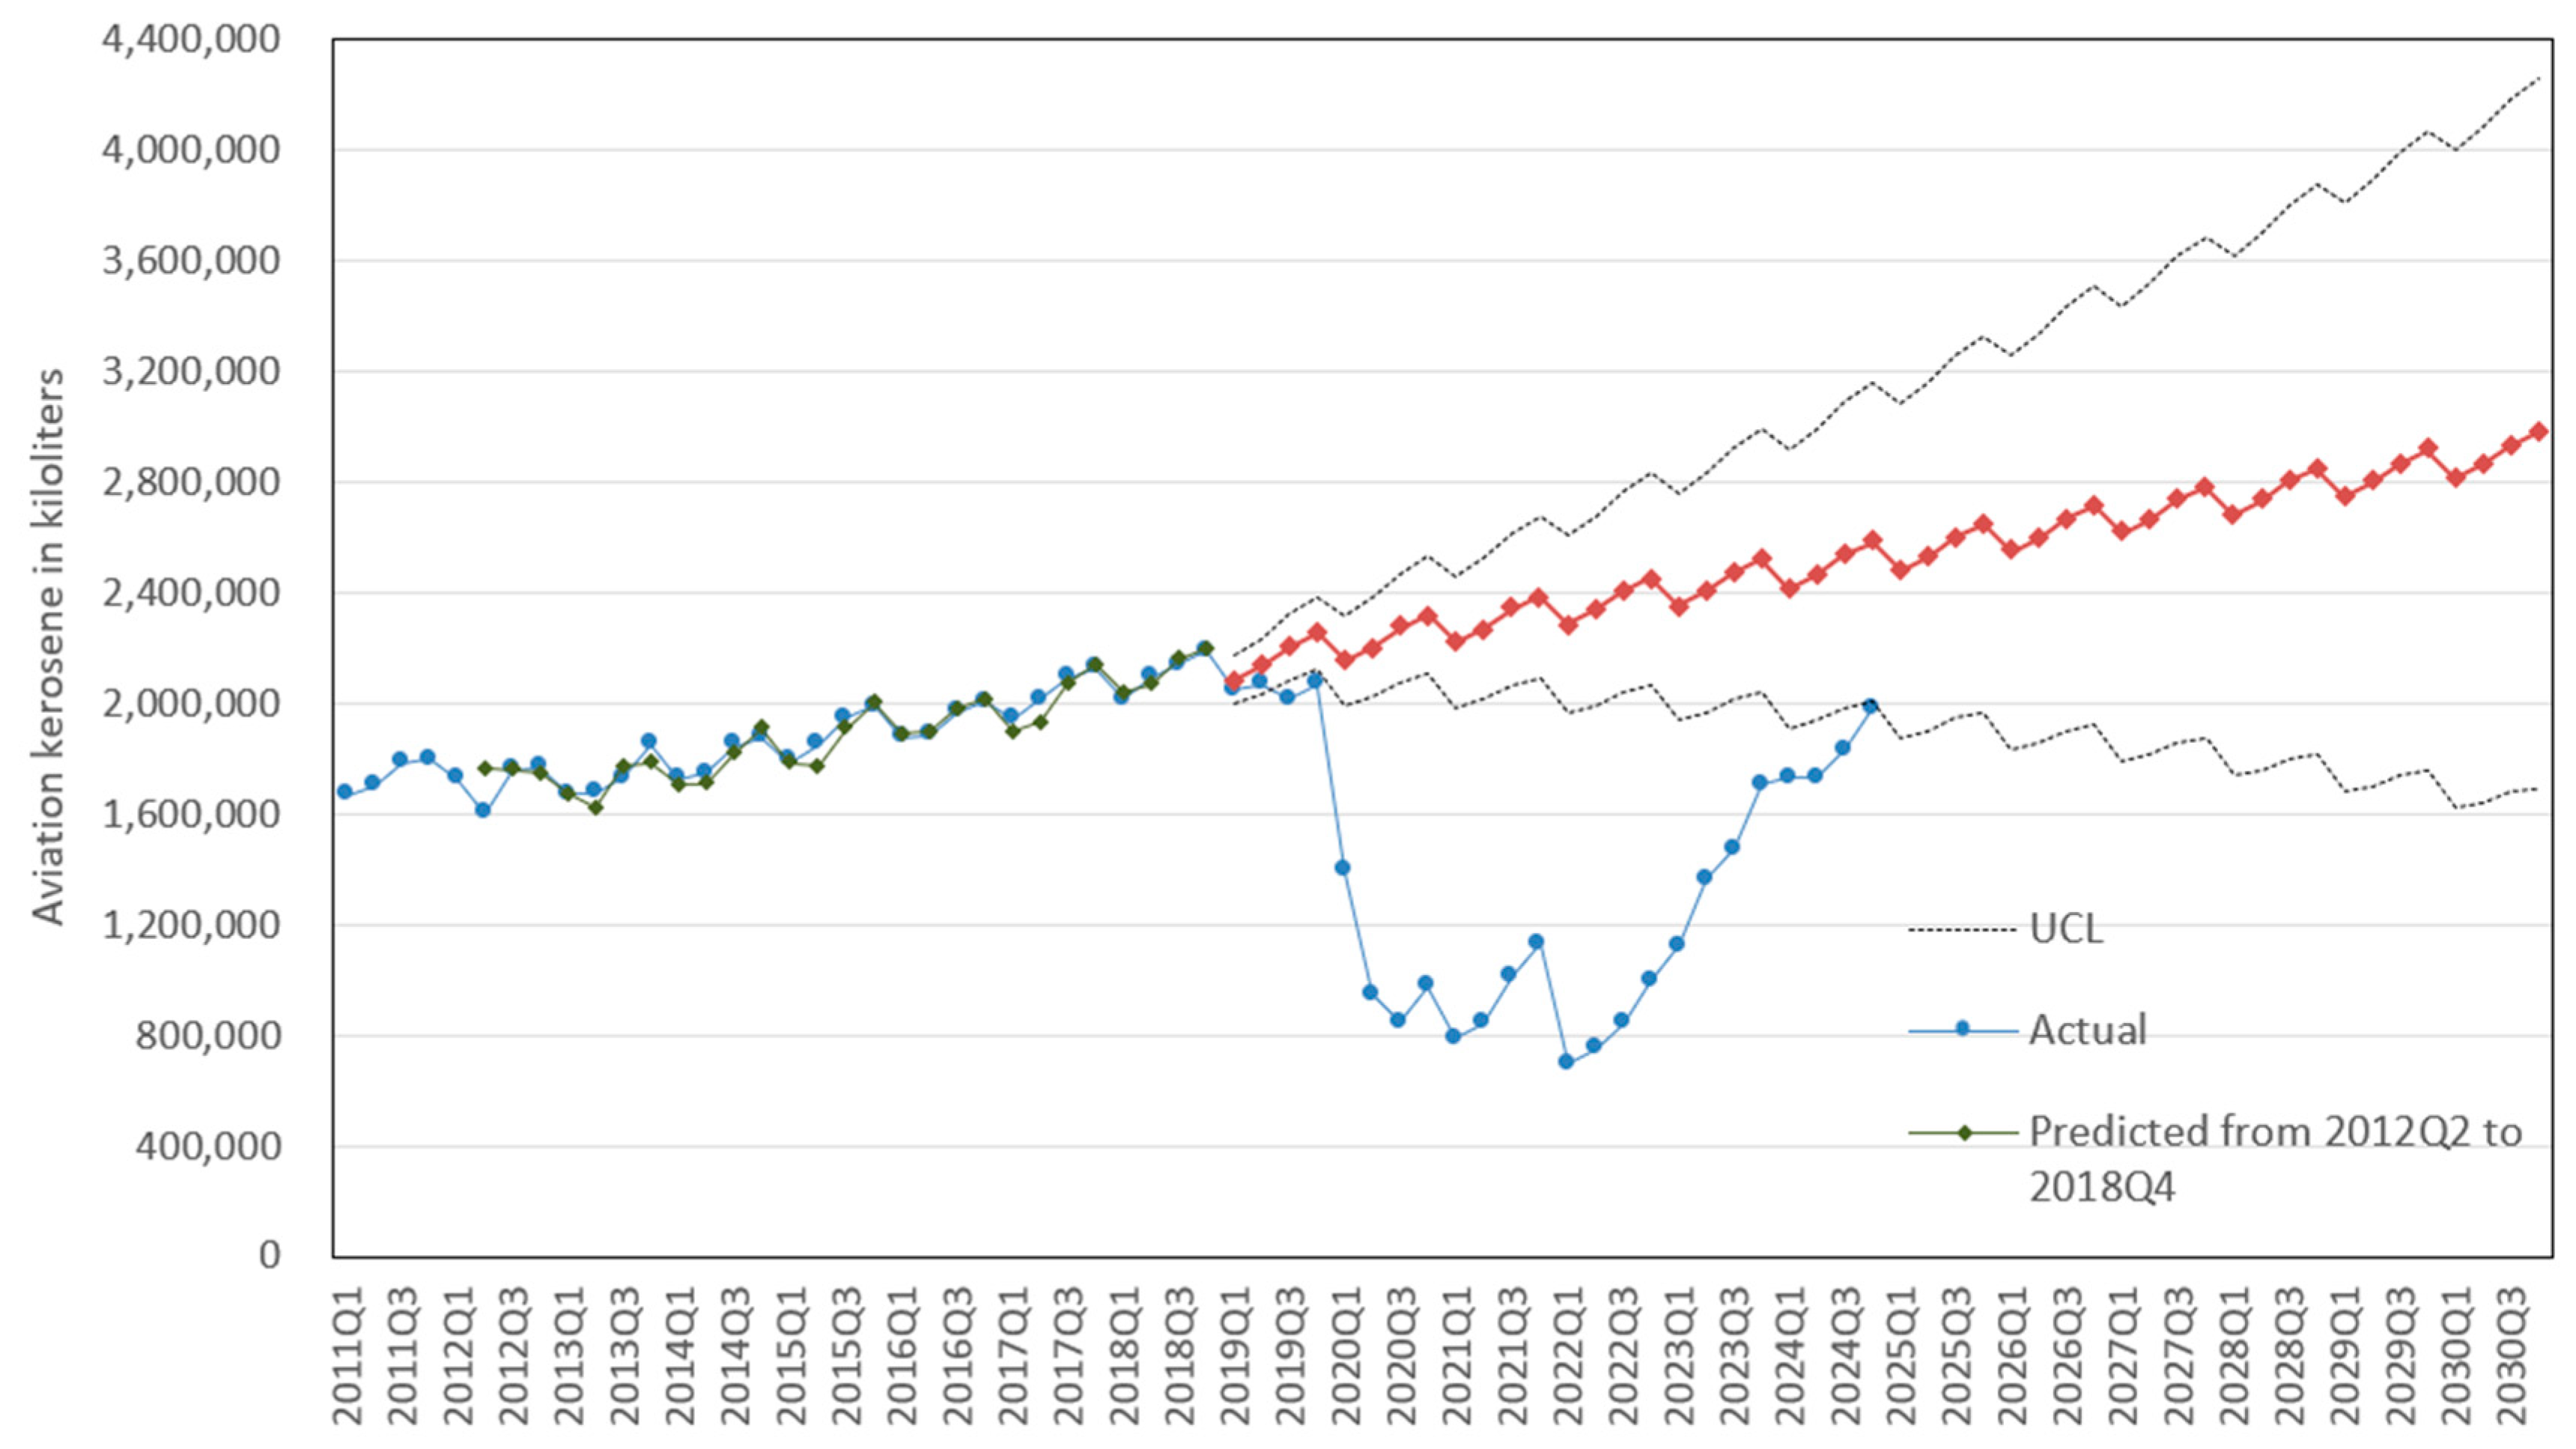
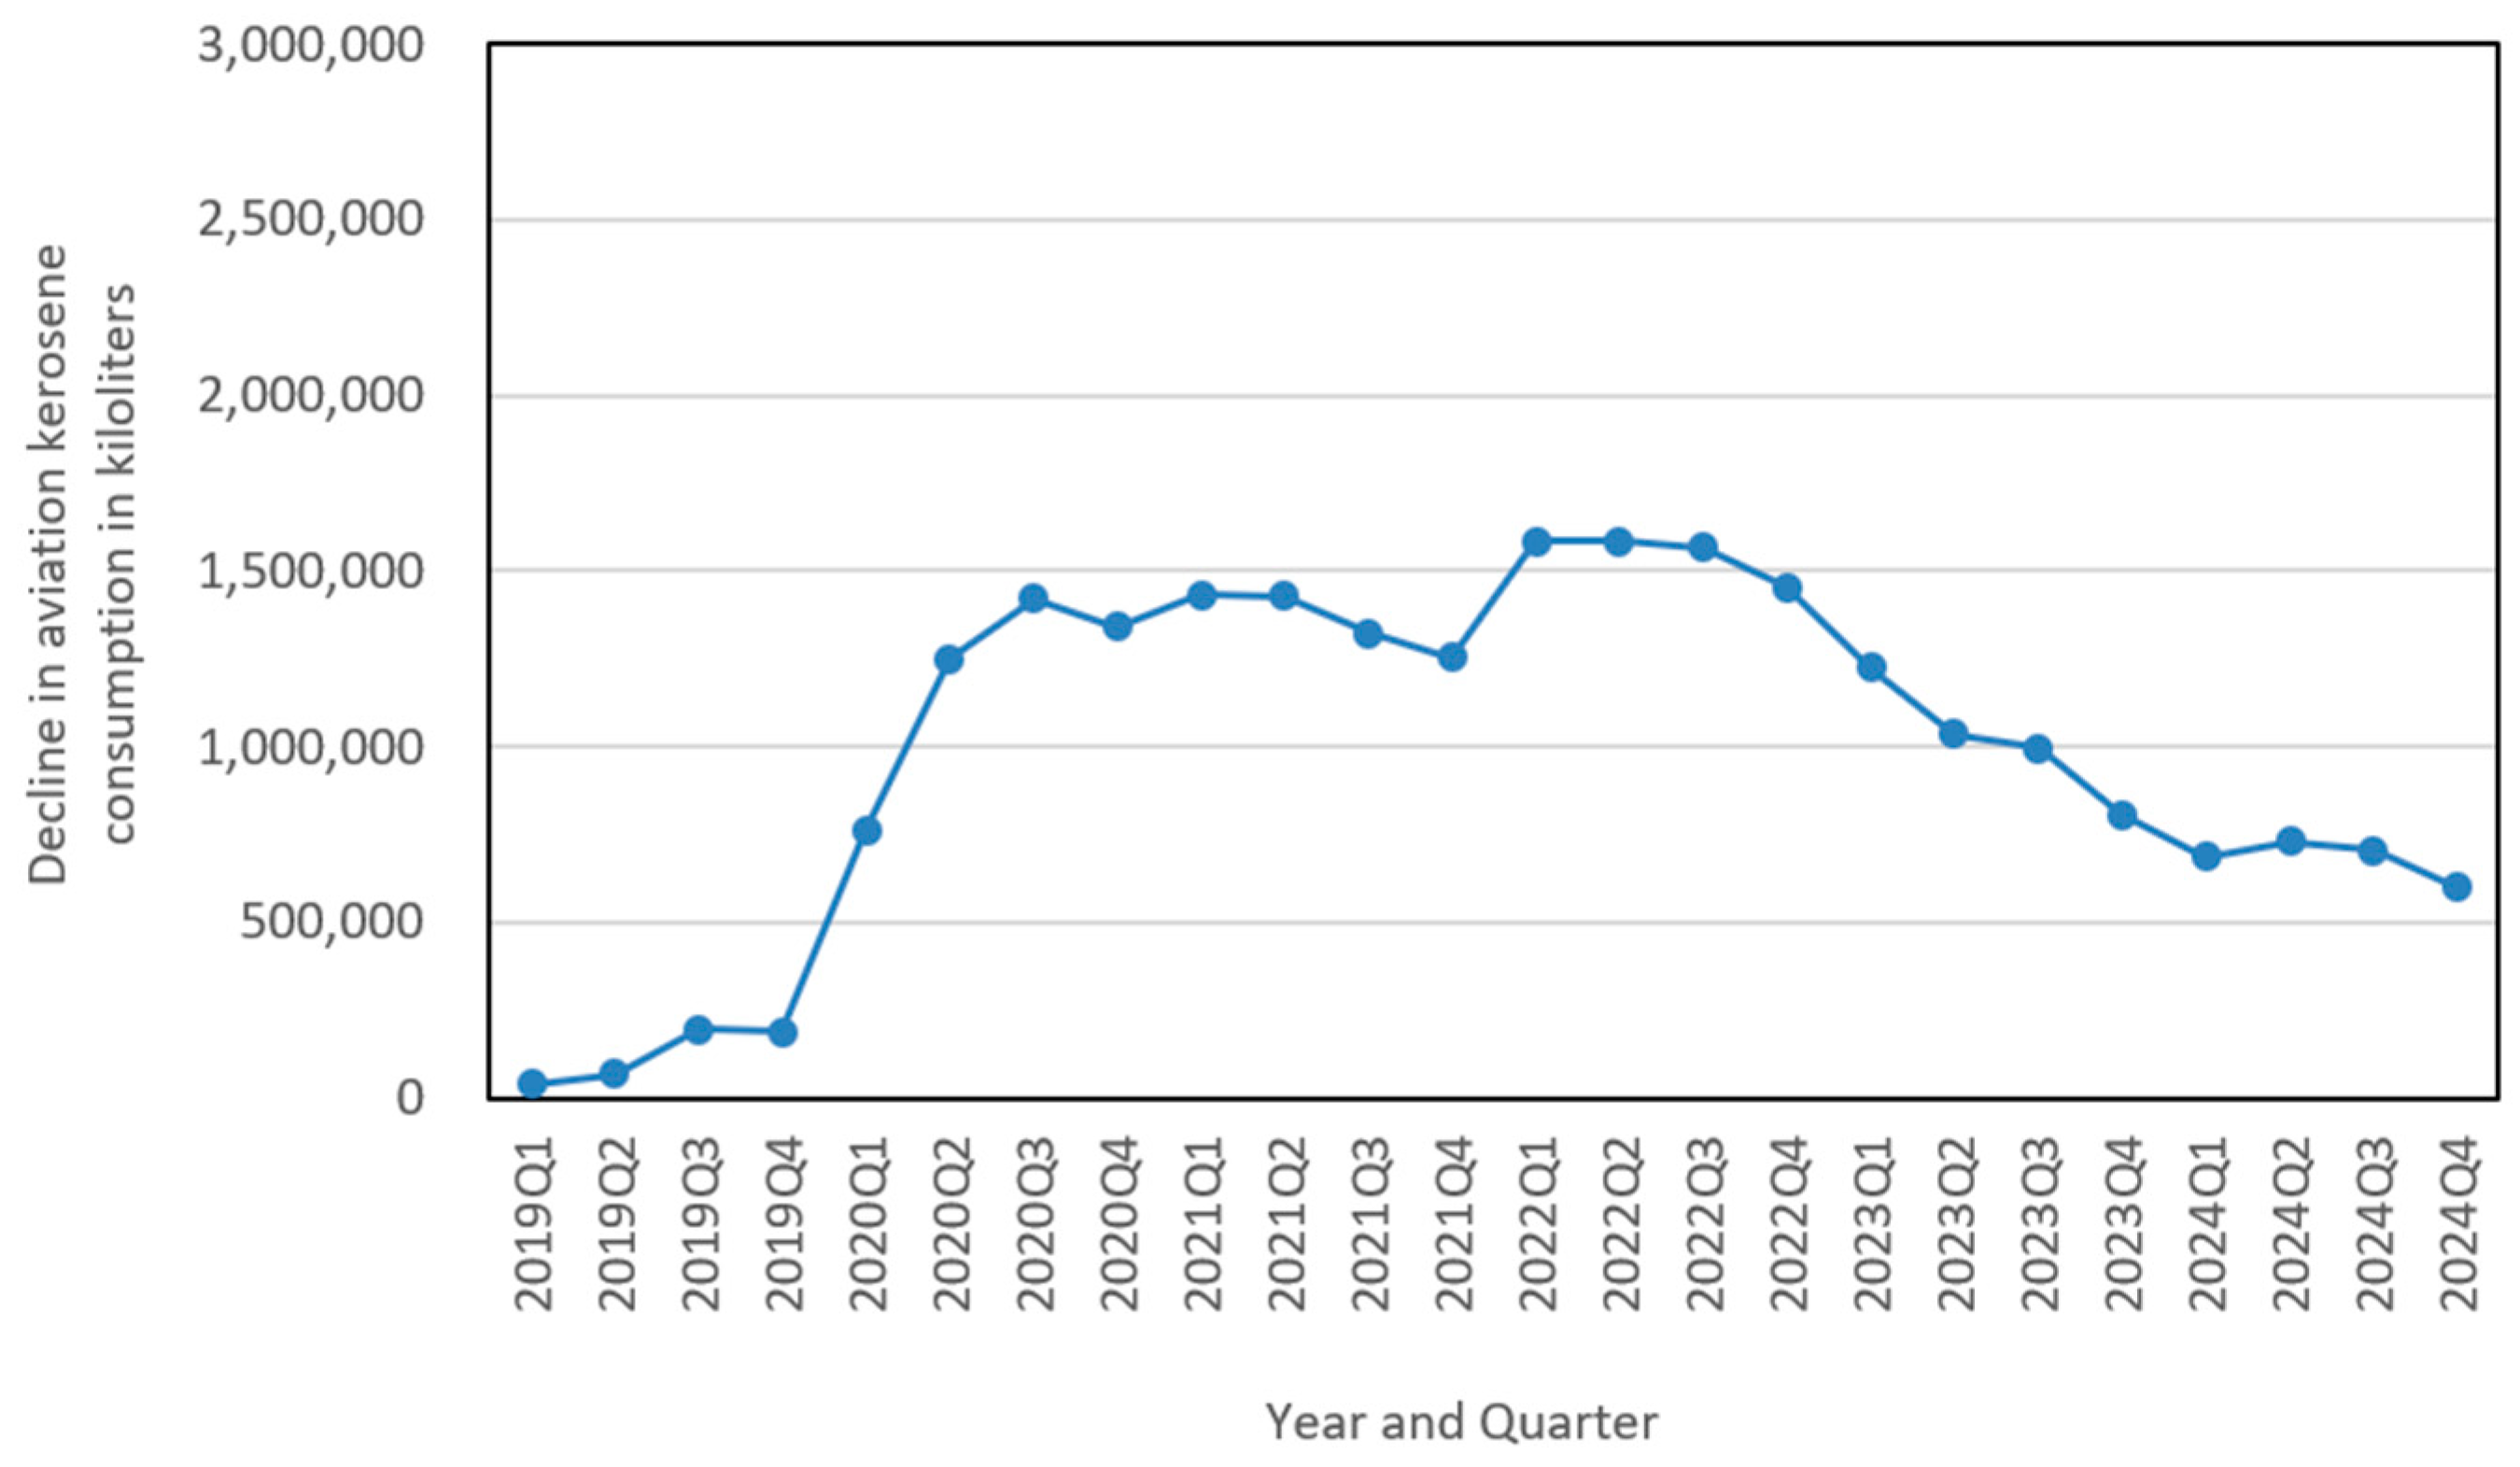
In the second phase, the key parameters ϕi, Φi, θi, and Θi were estimated using maximum likelihood estimation techniques. The final phase involved assessing the model’s accuracy by comparing the predicted aviation kerosene consumption data with the actual figures. Various metrics, including mean absolute error (MAE), mean absolute percentage error (MAPE), root mean square error (RMSE), coefficient of determination (R2), and Bayesian information criterion (BIC), were utilized to evaluate forecasting precision. Subsequently, the model was employed to project quarterly aviation kerosene consumption from the first quarter of 2019 to the fourth quarter of 2030. Additionally, with the availability of quarterly data from the first quarter of 2020 to the fourth quarter of 2024, the effects of COVID-19 on aviation kerosene consumption were analyzed. This study utilized the forecasting module provided by IBM SPSS 29.0 software for model identification, fitting, and verification.
3.3. GHG Emission from Aviation Kerosene
Aviation kerosene is composed of hydrocarbons such as paraffins (alkanes such as n-dodecane), olefins, naphthene, and aromatics, along with antioxidants and metal deactivators. Its major ingredient is often represented by n-dodecane (C
12H
26) or similar long-chain alkanes for combustion studies. The complete combustion of n-dodecane in air can be represented as C
12H
26 + 18.5 O
2 → 12 CO
2 + 13 H
2O. Therefore, the products of this combustion reaction are carbon dioxide and water vapor. According to the IPCC [
13], emissions from aircraft engines are primarily made up of approximately 70 percent CO
2, nearly 30 percent water vapor, and less than 1 percent each of NO
x, carbon monoxide (CO), sulfur oxides (SO
x), non-methane volatile organic compounds (NMVOC), PM, and other trace components. The IPCC [
13] also notes that modern engines emit minimal to no nitrous oxide (N
2O) and methane (CH
4). Furthermore, the IPCC (2006) estimates that around 10 percent of aircraft emissions, excluding CO and hydrocarbons, occur during ground operations at the airport and during the takeoff and landing phases. The majority of emissions, about 90 percent, are released at cruising altitudes. For CO and hydrocarbons, the distribution is approximately 30 percent local emissions and 70 percent at higher altitudes. The IPCC provides a default CO
2 emission factor for aviation kerosene of 71,500 kg/TJ, with a lower and upper limit of 69,800 kg/TJ and 74,400 kg/TJ, respectively. The emission factors for CH
4, N
2O, and NO
x are reported as 0.5 kg/TJ (0.215 to 1 kg/TJ), 2 kg/TJ (0.6 to 5 kg/TJ), and 250 kg/TJ (187.5 to 312.5 kg/TJ), respectively [
13]. According to the IPCC Sixth Assessment Report, the global warming potential (GWP) values for CO
2, CH
4, and N
2O over a 100-year period are 1, 29.8, and 273, respectively [
40]. Given that the calorific value of aviation kerosene is 0.0358 PJ/ML [
41], the quarterly energy consumption from aviation kerosene is calculated for the period spanning the first quarter of 2011 through the fourth quarter of 2024. GHG emissions from aviation kerosene are determined by multiplying the GHG emission factors by the quarterly energy consumption, factoring in the GWP values for the various GHG.
5. Discussion
The results of the ARIMA model presented in
Table 1 indicate a notable improvement through differencing: changing from the first (0,0,0) to (0,1,0) results in a dramatic reduction in all error metrics (
MAE,
MAPE,
RMSE), along with a significant increase in
R-squared. This highlights the non-stationarity of the original time series and the necessity of differencing to make it stationary. Comparable trends are observed in the additional improvements, with more complex models down the list. However, the diminishing improvement in performance suggests that incorporating more AR and MA terms can enhance the model’s ability to capture the underlying patterns; yet, beyond a certain point, specifically up to the seventh model, there is no increase in predictive power, and it actually results in higher
MAE,
RMSE, and
BIC values compared to the sixth model. Notably, Model (0,1,0)(0,1,0)
4, which incorporates a seasonal difference, shows significant improvement when compared to Model (0,1,0)(0,0,0)
4, clearly indicating the presence of a seasonal differencing component. Similarly, the integration of AR, differencing, seasonal differencing, and seasonal MA components seems to capture the data’s dynamics effectively; however, additional complexity provides limited benefits. Considering the
BIC and overall performance, the sixth Model (1,1,0)(0,1,1)
4 appears to be the best choice. It provides a good balance between model fit and complexity.
5.1. Implications
Figure 6 illustrates a responsive relationship between reductions in aviation kerosene consumption and critical incidents, indicating that such consumption may serve as a timely proxy for broader economic activity. Consistent with prior research, which indicates the efficacy of mobility data in anticipating economic disruptions [
42], this study corroborates those findings, utilizing a more economically grounded and reliable indicator: fuel consumption. The observed relationship is particularly salient given the potential for increased prioritization of national security and domestic production in light of the current geopolitical conditions, such as the overarching trend of the Great Decoupling. This shift may contribute to monitoring the fragmentation of the global aviation network. Consequently, aviation kerosene consumption data offers valuable insights for assessing the evolving structure of global trade and connectivity.
Despite the disruptions brought about by the COVID-19 pandemic, this study forecasts that the development of aviation activities and associated GHG emissions will revert to their pre-pandemic trajectories. Based on the forecast, the climate crisis seems to be inevitable; there should be a complex interplay of factors. Considering the demand signals, our current technological advancements in aircraft efficiency and alternative fuels only offer limited mitigation potential. As reported by the World Economic Forum, the production of sustainable aviation fuel is significantly lagging behind expectations [
43]. Even if sustainable aviation fuel refineries manage to secure sufficient investment, they will only be able to produce around 17 million tons annually by 2030, which could satisfy approximately 4 to 5% of total aviation fuel consumption [
43]. Furthermore, the price of sustainable aviation fuel is roughly two and a half times higher than that of conventional jet fuel [
44]. A novel implication of the aforementioned points is the necessity for a shift in policy focus. While traditional carbon pricing mechanisms are crucial, they are inadequate to tackle the systemic challenges confronting the aviation industry. There is an urgent need for new strategies. However, this research can only highlight the issues with current practices; even with drastic measures and seemingly forceful policy measures, the number of flights, aviation fuel consumption, and the associated GHG emissions continue to rebound. A shift towards more efficient and intelligent aviation systems is essential, including the electrification of short-haul operations, such as the adoption of electric unmanned aerial vehicles for transporting goods and passengers between Hong Kong and its nearby cities in mainland China. Moreover, alternative transportation methods and policies that alter travel behaviors and consumption priorities are crucial to reducing the demand for air travel and the associated GHG emissions. Additionally, the central government of China has recognized Hong Kong as a key hub in its recent expansion of the Chinese high-speed rail network, which increases the number of mainland cities with direct rail links to and from Hong Kong, consequently reducing the need for flights from Hong Kong to mainland Chinese cities in the short to near term [
45].
5.2. Limitations of This Study and Future Research
This study acknowledges several limitations. Firstly, although this study utilized quarterly data from official sources, spanning the first quarter of 2019 through the fourth quarter of 2018 for ARIMA modeling, data uncertainties and the limited baseline for ARIMA forecasts may lead to increased errors, especially in long-term predictions and volatile environments, thereby limiting the model’s reliability beyond 2030 and the precision of decision-making. Secondly, ARIMA modeling assumes parameter constancy over the estimation window. However, structural breaks—such as regime shifts caused by changes in fundamentals—can violate this assumption. This can cause parameter instability and diminishing forecast accuracy for the pro-2024 and pro-2030 periods. Other models that are less sensitive to structural changes may perform better, such as long short-term memory (LSTM), Prophet, XGBoost, and ARIMA/machine learning hybrid models [
25,
26,
27,
46,
47]. However, considering pragmatic constraints and explainability, the ARIMA approach offers valid and useful approximations. Given that the business-as-usual approach remains a prominent strategy within the Hong Kong air transport industry, the ARIMA model is still one of the most preferred choices due to its practical value in serving the purpose of this study. Thirdly, the accessibility of data and the scope of this study prevented a thorough analysis of all potentially relevant factors, such as differences in fuel demand between long-haul and short-haul flights, different aircraft types, and load factors. This could lead to an over-homogenization of consumption patterns. Future research could consider estimates such as global fuel consumption averages for different flights and route distributions. Fourthly, the assumption of continuous, globally interconnected travel may not hold true in all scenarios. The discussion considers minimal effects from escalating Sustainable Aviation Fuel costs and the limited scalability of electric or hydrogen propulsion for long-haul flights, as well as other emerging air travel technologies. Furthermore, the impact of current mitigation strategies may materialize with a longer lag than anticipated, extending beyond the scope of our data.
Future research should explore the potential of using aviation kerosene consumption patterns as a leading indicator for assessing economic activity, especially at the local level, due to their greater availability and reliability. Given the limited effectiveness of current mitigation strategies, we recommend prioritizing research into the design of more immediate or short-term economic incentives to encourage broader adoption of sustainable practices and policies. Additionally, future research should investigate the likely trajectory of emissions following the adoption of sustainable aviation fuel and the implementation of regional carbon pricing in Hong Kong.
Finally, it is important to note that this study’s findings should not be limited to the Hong Kong air transport industry. The methodology we have adopted is likely applicable to other hub airports, especially those in similarly dynamic and densely populated areas, such as Tokyo, Singapore, Dubai, London, and Atlanta. Future research could explore the association between aviation kerosene consumption and flight data in these hubs, as well as forecast the trajectories of GHG emissions from major airport hubs.


