Article

Combined Effect of Viscosity Ratio and Interfacial Tension on Residual Saturations: Implications for CO2 Geo-Storage

by
Duraid Al-Bayati
1,2,
Doaa Saleh Mahdi
3,
Emad A. Al-Khdheeawi
2,3,*,
Matthew Myers
4 and
Ali Saeedi
2
1
Petroleum Engineering Department, College of Engineering, University of Kirkuk, Kirkuk 36001, Iraq
2
Western Australian School of Mines: Minerals, Energy and Chemical Engineering, Curtin University, Perth, WA 6151, Australia
3
Oil and Gas Engineering Department, University of Technology-Iraq, Baghdad 10066, Iraq
4
CSIRO Energy, Kensington, WA 6151, Australia
*
Author to whom correspondence should be addressed.
Gases 2025, 5(3), 13; https://doi.org/10.3390/gases5030013
Submission received: 20 March 2025 / Revised: 16 May 2025 / Accepted: 11 June 2025 / Published: 25 June 2025

Abstract

This work examines how multiphase flow behavior during CO2 and N2 displacement in a microfluidic chip under capillary-dominated circumstances is affected by interfacial tension (IFT) and the viscosity ratio. In order to simulate real pore-scale displacement operations, microfluidic tests were performed on a 2D rock chip at flow rates of 1, 10, and 100 μL/min (displacement of water by N2/supercritical CO2). Moreover, core flooding experiments were performed on various sandstone samples collected from three different geological basins in Australia. Although CO2 is notably denser and more viscous than N2, the findings show that its displacement efficiency is more influenced by the IFT values. Low water recovery in CO2 is the result of non-uniform displacement that results from a high mobility ratio and low IFT; this traps remaining water in smaller pores via snap-off mechanisms. However, due to the blebbing effect, N2 injection enhances the dissociation of water clots, resulting in a greater swept area and fewer remaining water clusters. The morphological investigation of the residual water indicates various displacement patterns; CO2 leaves more retained water in irregular shapes, while N2 enables more uniform displacement. These results confirm earlier studies and suggest that IFT has a crucial role in fluid displacement proficiency in capillary-dominated flows, particularly at low flow rates. This study emphasizes the crucial role of IFT in improving water recovery through optimizing the CO2 flooding process.

1. Introduction

The geo-sequestration of carbon dioxide (CO2) has been identified as a potential technology for the mitigation of greenhouse gas emissions [1,2,3]. Deep saline aquifers seem to be the most promising option among the several potential underground storage sites because of their high storage capacity and low resource competition in comparison to other storage scenarios [4,5]. During immiscible displacement processes (i.e., a non-wetting fluid displacing a wetting fluid in a porous medium), because of surface tension, the non-wetting fluid may separate into distinct ganglia (referred to as snap-off) [6]. In a deep sandstone saline aquifer, residually trapped CO2 would exist as ganglia produced via the snap-off of CO2 (i.e., the non-wetting phase) by brine (i.e., the wetting phase) [6]. Many important factors may impact displacement in porous media, including the pressure and temperature, the rock wetting characteristics, various rock physical properties, fluid viscosities and interfacial tension (IFT), the saturation history (i.e., hysteresis effect), the net effective pressure, the displacement flow rate, and the in situ stress field and reservoir rock permeability heterogeneity [7,8,9,10,11,12,13,14]. The importance of these factors is largely attributed to their influences on the effectiveness of potential trapping mechanisms and the injectivity of CO2 into the intended formation. The performance of immiscible displacement is controlled by pore-scale active forces (e.g., capillary and viscous forces) and their interplay [15,16,17]. The immiscible fluid displacement mechanism in porous media has been studied through a number of pore-scale microfluidic chip tests and numerical simulations [18,19,20,21,22,23,24]. The outcomes of these studies suggest that the displacement patterns of immiscible fluids in porous media are impacted by the viscosity ratio ( M = μ d i s p l a c i n g / μ d i s p l a c e d , where μ d i s p l a c i n g and μ d i s p l a c e d are the viscosity values of the invading and defending fluids, respectively). The displacement behavior is also strongly influenced by the capillary number. A dimensionless measure of the relative power of the capillary to viscous forces through immiscible displacement is the capillary number. Over the years, this number has been represented by a series of different forms across the literature, with one of the most common being the formalism proposed by Saffman and Taylor [23]:
C a = μ v σ
where v is the interstitial fluid velocity, μ is the displacing fluid viscosity, and σ is the surface tension (or IFT) between the two immiscible fluids. The displacement pattern is categorized as either stable displacement, capillary fingering, or viscous fingering based on how these capillary and viscous forces combine (see Figure 1 for a rough delineation with a logCa–logM plot based on Zhang et al. [21]). For a capillary number around 10−3, both capillary and viscous forces are similarly acting on fluid displacement. Typically, the capillary number at the reservoir scale is much lower (~10−6), and the flow characteristics are typically capillary-dominated. Data from different experimental [21,24,25] and numerical studies [26,27] are summarized in this plot, including the microfluidic experimental conditions used in this study. For displacements with an extremely low ratio of viscosity (M << 1) (e.g., displacement of water by supercritical CO2), immiscible displacement can exist in two flow regimes (i.e., capillary fingering or viscous fingering) depending on the relative significance of the viscous to capillary forces [15,16]. For example, capillary fingering happens when the injection flow rate is low (i.e., Ca < 10−10), regardless of the viscosity ratio [21]. Usually, when the viscosity of the invading fluid is lower than that of the defending fluid, viscous fingering occurs (i.e., M << 1). The invasive fluid preferentially passes through flow channels that first form when viscous fingering is present, resulting in the defending fluid that is outside the flow channel being avoided and not retrieved. Numerical simulations and experimental findings gathered from the literature demonstrate that the non-wetting phase may displace between 20 and 90% of the wetting phase under immiscible conditions, depending on the viscosity ratio and capillary number [25]. Within the transition zone, there is a crossover between viscosity and capillary fingering or between stable displacement and capillary/viscous fingering; the displacement ratio rises as the logCa values for a specific logM increase [21,28,29].
In this context, various studies have investigated the pore-scale phenomena that occur during an imbibition flood in detail [30,31,32,33,34], but, to the best of our knowledge, no systematic effort has been made to describe and comprehend the pore-scale mechanisms that control a drainage displacement where M << 1. Therefore, in this work, we use conventional core flooding techniques and microfluidic experiments to examine our primary hypothesis that, during a displacement of this nature, the sweep efficiency is dominated by the fluid system’s interfacial tension.
Figure 1. Immiscible fluid invasion conditions and stability diagram on a logCa–logM plot with three stability areas (bounded by blue lines). Data from different experimental [21,24,25,35] and numerical studies [26,27] are summarized on this plot, including the experimental conditions used in this study.
Gases 05 00013 g001

2. Experimental Methodology

2.1. Core Flooding Experiments

2.1.1. Methodology and Equipment

Nine core flooding experiments were performed on various sandstone samples collected from three different geological basins in Australia. The basic petrophysical properties and experimental conditions applied to each sample are presented in Table 1. The core floods were conducted using food-grade N2/CO2 (BOC) and synthetic formation waters. For every experiment, these fluids (i.e., brine and CO2) were pre-equilibrated with each other under reservoir conditions using a stirred reactor. The salinities reported in Table 1 represent the estimated NaCl equivalent concentrations for the corresponding formations that provided the samples. The synthetic formation waters were prepared utilizing Sigma Aldrich’s analytical-grade NaCl and distilled water.
The core plugs were cut, trimmed dry, and then cleaned with a Dean–Stark apparatus using warm methanol and toluene. Subsequently, after drying them in an oven at 65 °C, the measurement of the samples’ porosity and permeability under net effective stress was performed utilizing a helium porosimeter (AP-608 instrument by Coretest Inc., Dover, DE, USA). The measured porosity and gas permeability are given in Table 1 for each of the samples. Upon the completion of the preliminary core analysis, a steady-state core flooding apparatus operating at high pressure and a high temperature was used for the core flooding experiments. A schematic of the apparatus is provided in Figure 2. Detailed information regarding the apparatus’s design, specifications, and different parts can be found elsewhere [10].

2.1.2. Core Flooding Process

The core flooding experiments followed a standard procedure of successive primary drainage and primary imbibition displacements. Each experiment used a dry sample that was wrapped in a composite sleeve comprising three layers (i.e., the innermost layer was aluminum foil, which was covered in FEP heat shrink and then placed in a Viton rubber core sleeve). This approach is particularly effective in resisting CO2 diffusion into the core sleeve, which was the main rationale for its use [36]. The wrapped sample was then loaded into a standard biaxial core holder (Core Laboratories Inc., Houston, TX, USA). During these experiments, every injection fluid was run through a 0.5-micron line filter to prevent any external fines from entering and plugging the pore network of the sample. After applying 5 MPa overburden pressure to the sample, the CO2 at low pressure flowed into the core plug to displace air. Because of its smaller molecules and greater diffusivity than air [6], the CO2 could successfully remove trapped air bubbles from the sample. Subsequently, the oven temperature was raised to the in situ value, with the sample, core holder, and flow lines being subjected to a vacuum for at least 24 h. In the next step, in order to raise the pore pressure and overburden pressure simultaneously, de-aerated formation water was injected into the sample. The sample was left to age in formation water under reservoir conditions for 48 h to create an adsorption equilibrium with the brine and ensure the full saturation of the sample. Full saturation of the brine was verified by operating an injection pump under constant-pressure mode and monitoring its volume (i.e., the volume injected should approach a constant value and zero flow rate).
The main stage of the core flooding experiment started with injecting CO2-saturated water to displace the de-aerated one. After this step was completed, the primary drainage commenced by injecting the CO2 to displace the water until reaching a steady state (i.e., stopping water production and stabilizing the differential pressure). Subsequently, the CO2 was displaced by water during the primary imbibition process. Once again, the injection of water continued until the conditions reached a steady state.
Accordingly, we have analyzed and compared the residual saturation data measured from our studies and other available core-scale displacement experiments for both CO2–water and N2–water systems in water-wet sandstone rocks. Figure 3 was constructed by combining the core flooding data obtained as part of this study with other data gathered from the literature. It is worth noting that only results from immiscible displacements attaining true end-point residual saturation (referred to also as irreducible saturation) are used in this evaluation. Furthermore, the term ‘water’ is often used to refer to freshwater as well as saline water solutions (or brines) in core flood experiments. Meanwhile, the term ‘gas’, in addition to fluids in the gaseous state, may refer to substances such as CO2 and N2 in their supercritical state. Figure 3 indicates that the displacement efficiency of CO2 is approximately 30.0% higher than that of N2 under similar conditions. Therefore, in the context of the above discussion, it is important to elaborate on the effects of pore-scale forces and mechanisms on the displacement performance during a drainage flood characterized by a small ratio of viscosity (i.e., M << 1).
Figure 3. Residual water saturations for the (A) CO2–water fluid system [36,37,38,39,40,41,42,43,44] and (B) N2–water fluid systems versus sample permeabilities [45,46,47].
Gases 05 00013 g03aGases 05 00013 g03b

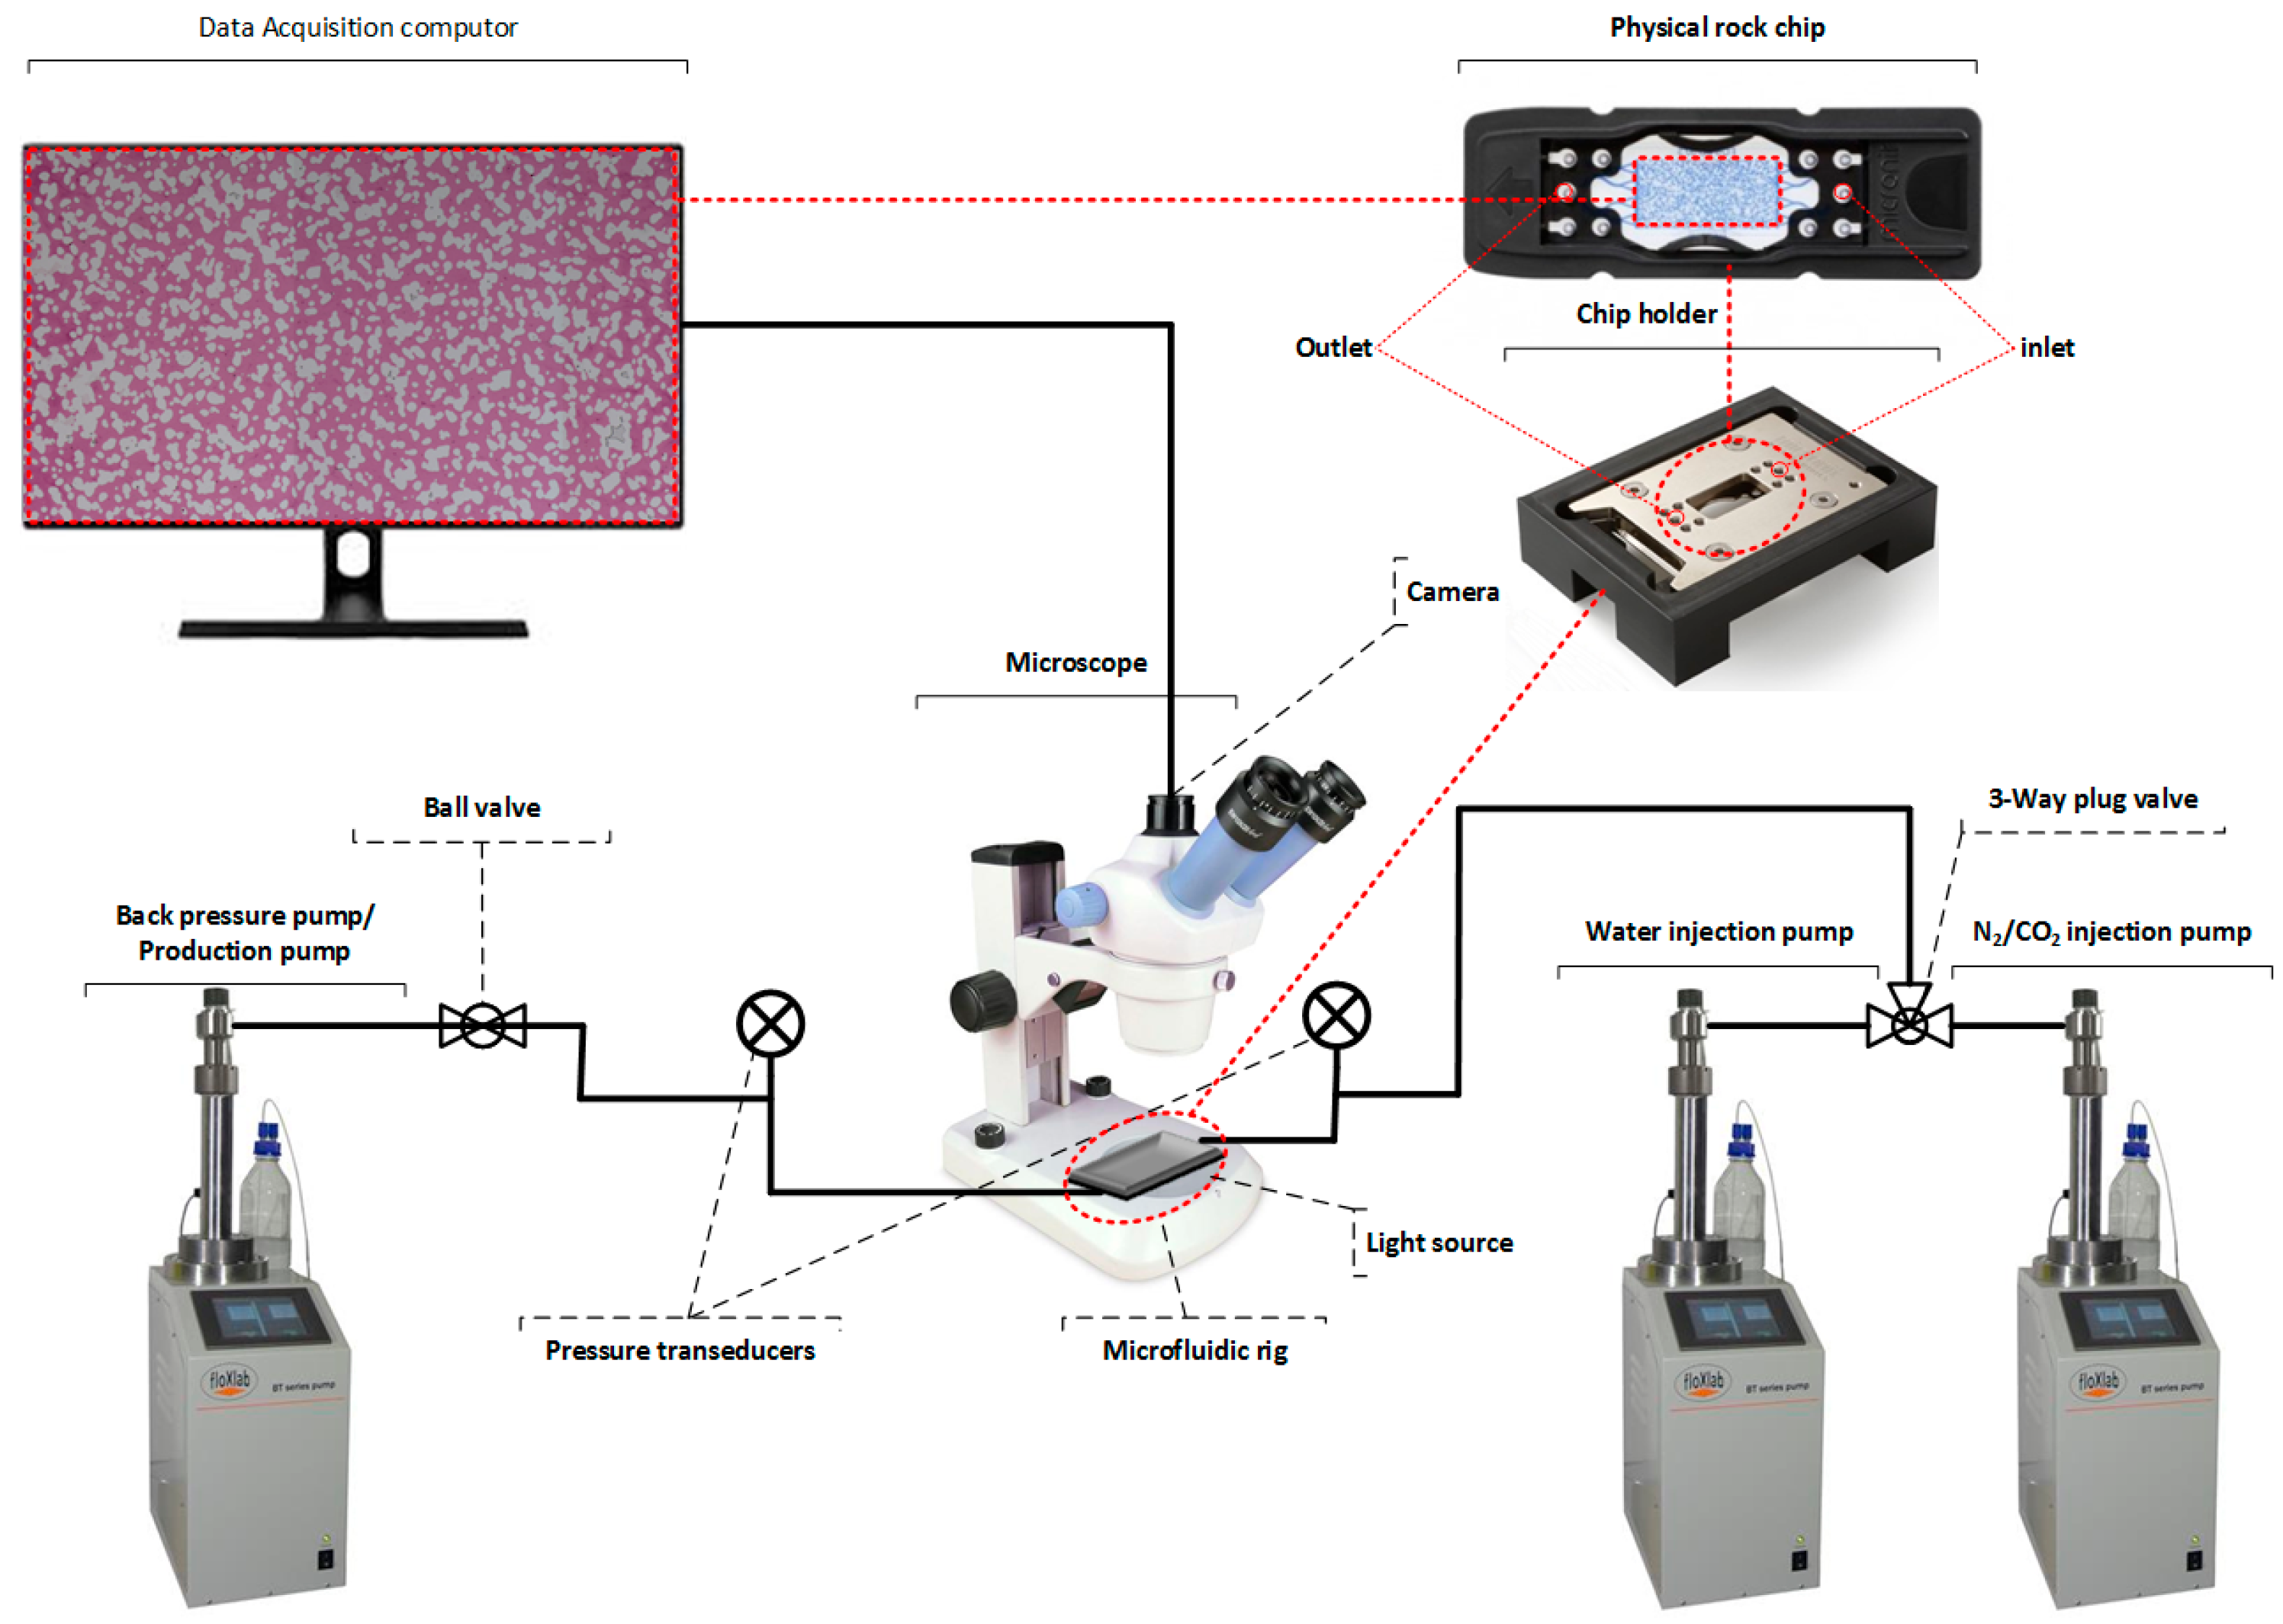
2.2. Microfluidic Experiments

2.2.1. Fluid Composition and Properties

Distilled water with dye added (containing 1.0 weight percent rhodamine) was used, with a 1000.9 kg/m3 density and 0.99 mPa·s viscosity under experimental conditions. High-purity N2 and CO2 (both from BOC gases, with average purity of 99.9 weight percent) were employed in the tests. The fluid characteristics for the conditions under which these pore-scale experiments were carried out are listed in Table 2 below. The dyed water under experimental conditions was tested for both the contact angle and equilibrium IFT between gas and water using the IFT700 equipment (Vinci-Technologies, Nanterre, France). Pore-scale tests were carried out at ambient temperature (20.0 ± 2 °C) and a pore pressure of 6 MPa. The selected test conditions were limited to the microfluidic device manufacturer’s operational recommendations (Micronit Microfluidics BV, Enschede, The Netherlands).

2.2.2. Microfluidic Chip Properties and Experimental Procedure

The study’s experimental microfluidic equipment is depicted in Figure 4. From Micronit Microfluidics BV, The Netherlands, a two-dimensional microfluidic physical rock chip was utilized to carry out the CO2/N2 displacement experiments. This microfluidic chip has dimensions of 20 mm × 10 mm and a pore depth of 20 μm. The chip has a 2.28 µL pore volume, 2.5 D permeability, and 57% porosity. The micromodel can be used under relatively high-pressure–high-temperature conditions (suitable for supercritical CO2 studies) and is fabricated using transparent borosilicate glass, which allows the direct visual observation of pore-scale processes. The experimental setup included the microfluidic chip, two syringe pumps (Vinci, BTSP 500-5—Vinci-Technologies, Nanterre, France) for the injection of gas (either CO2 or N2) and water, and a third syringe pump to control the pore pressure through backpressure. Throughout the experiments, two high-accuracy pressure transmitters were used to measure the pressures at the micromodel’s inlet and outlet ends (Keller, Series 33X, 0–200 bar, accuracy ± 0.05%FS—Winterthur, Switzerland). By recording the volume changes of the pump used to maintain the backpressure, the volumes of the produced fluids could be ascertained. Polyether ether ketone (PEEK) tubing (1/16″ OD) was utilized in every connection needed for the microfluidic system as a mechanically stable, flexible, and simple-to-cut alternative to stainless steel tubing. To keep any suspended particles out of the microfluidic chip, a 0.5 µm line filter was positioned at the inlet. The displacement flooding experiment was conducted with the desired rate set for the injection syringe pumps. The syringe pump used to control the pore pressure through the backpressure was kept at a steady pressure on the production side (i.e., 6 MPa). A Luminoptic ASZ-400T stereo-microscope (Clarkson, Australia) with a 12-megapixel digital microscope camera from the GT series was used to capture images of the flooding process. The microscope featured wide-field 10× eyepieces WF10X/20 with diopter adjustment, giving a 20 mm field of view.
The following procedure was followed to conduct the displacement test: initially, the system was flushed with CO2 to remove any trapped air in the system, followed by injecting dye water at a low injection rate (e.g., 10 μL/min) to saturate the chip and increase the pressure in the system (i.e., to the desired experimental pressure at 6 MPa, where CO2 exists as a liquid). After fully saturating the chip with dyed brine, either CO2 or N2 was injected at selected constant flow rates (i.e., 1, 10, and 100 μL/min). The fluid flow was monitored under a microscope, and images of the displacement process were captured.

3. Results and Discussion

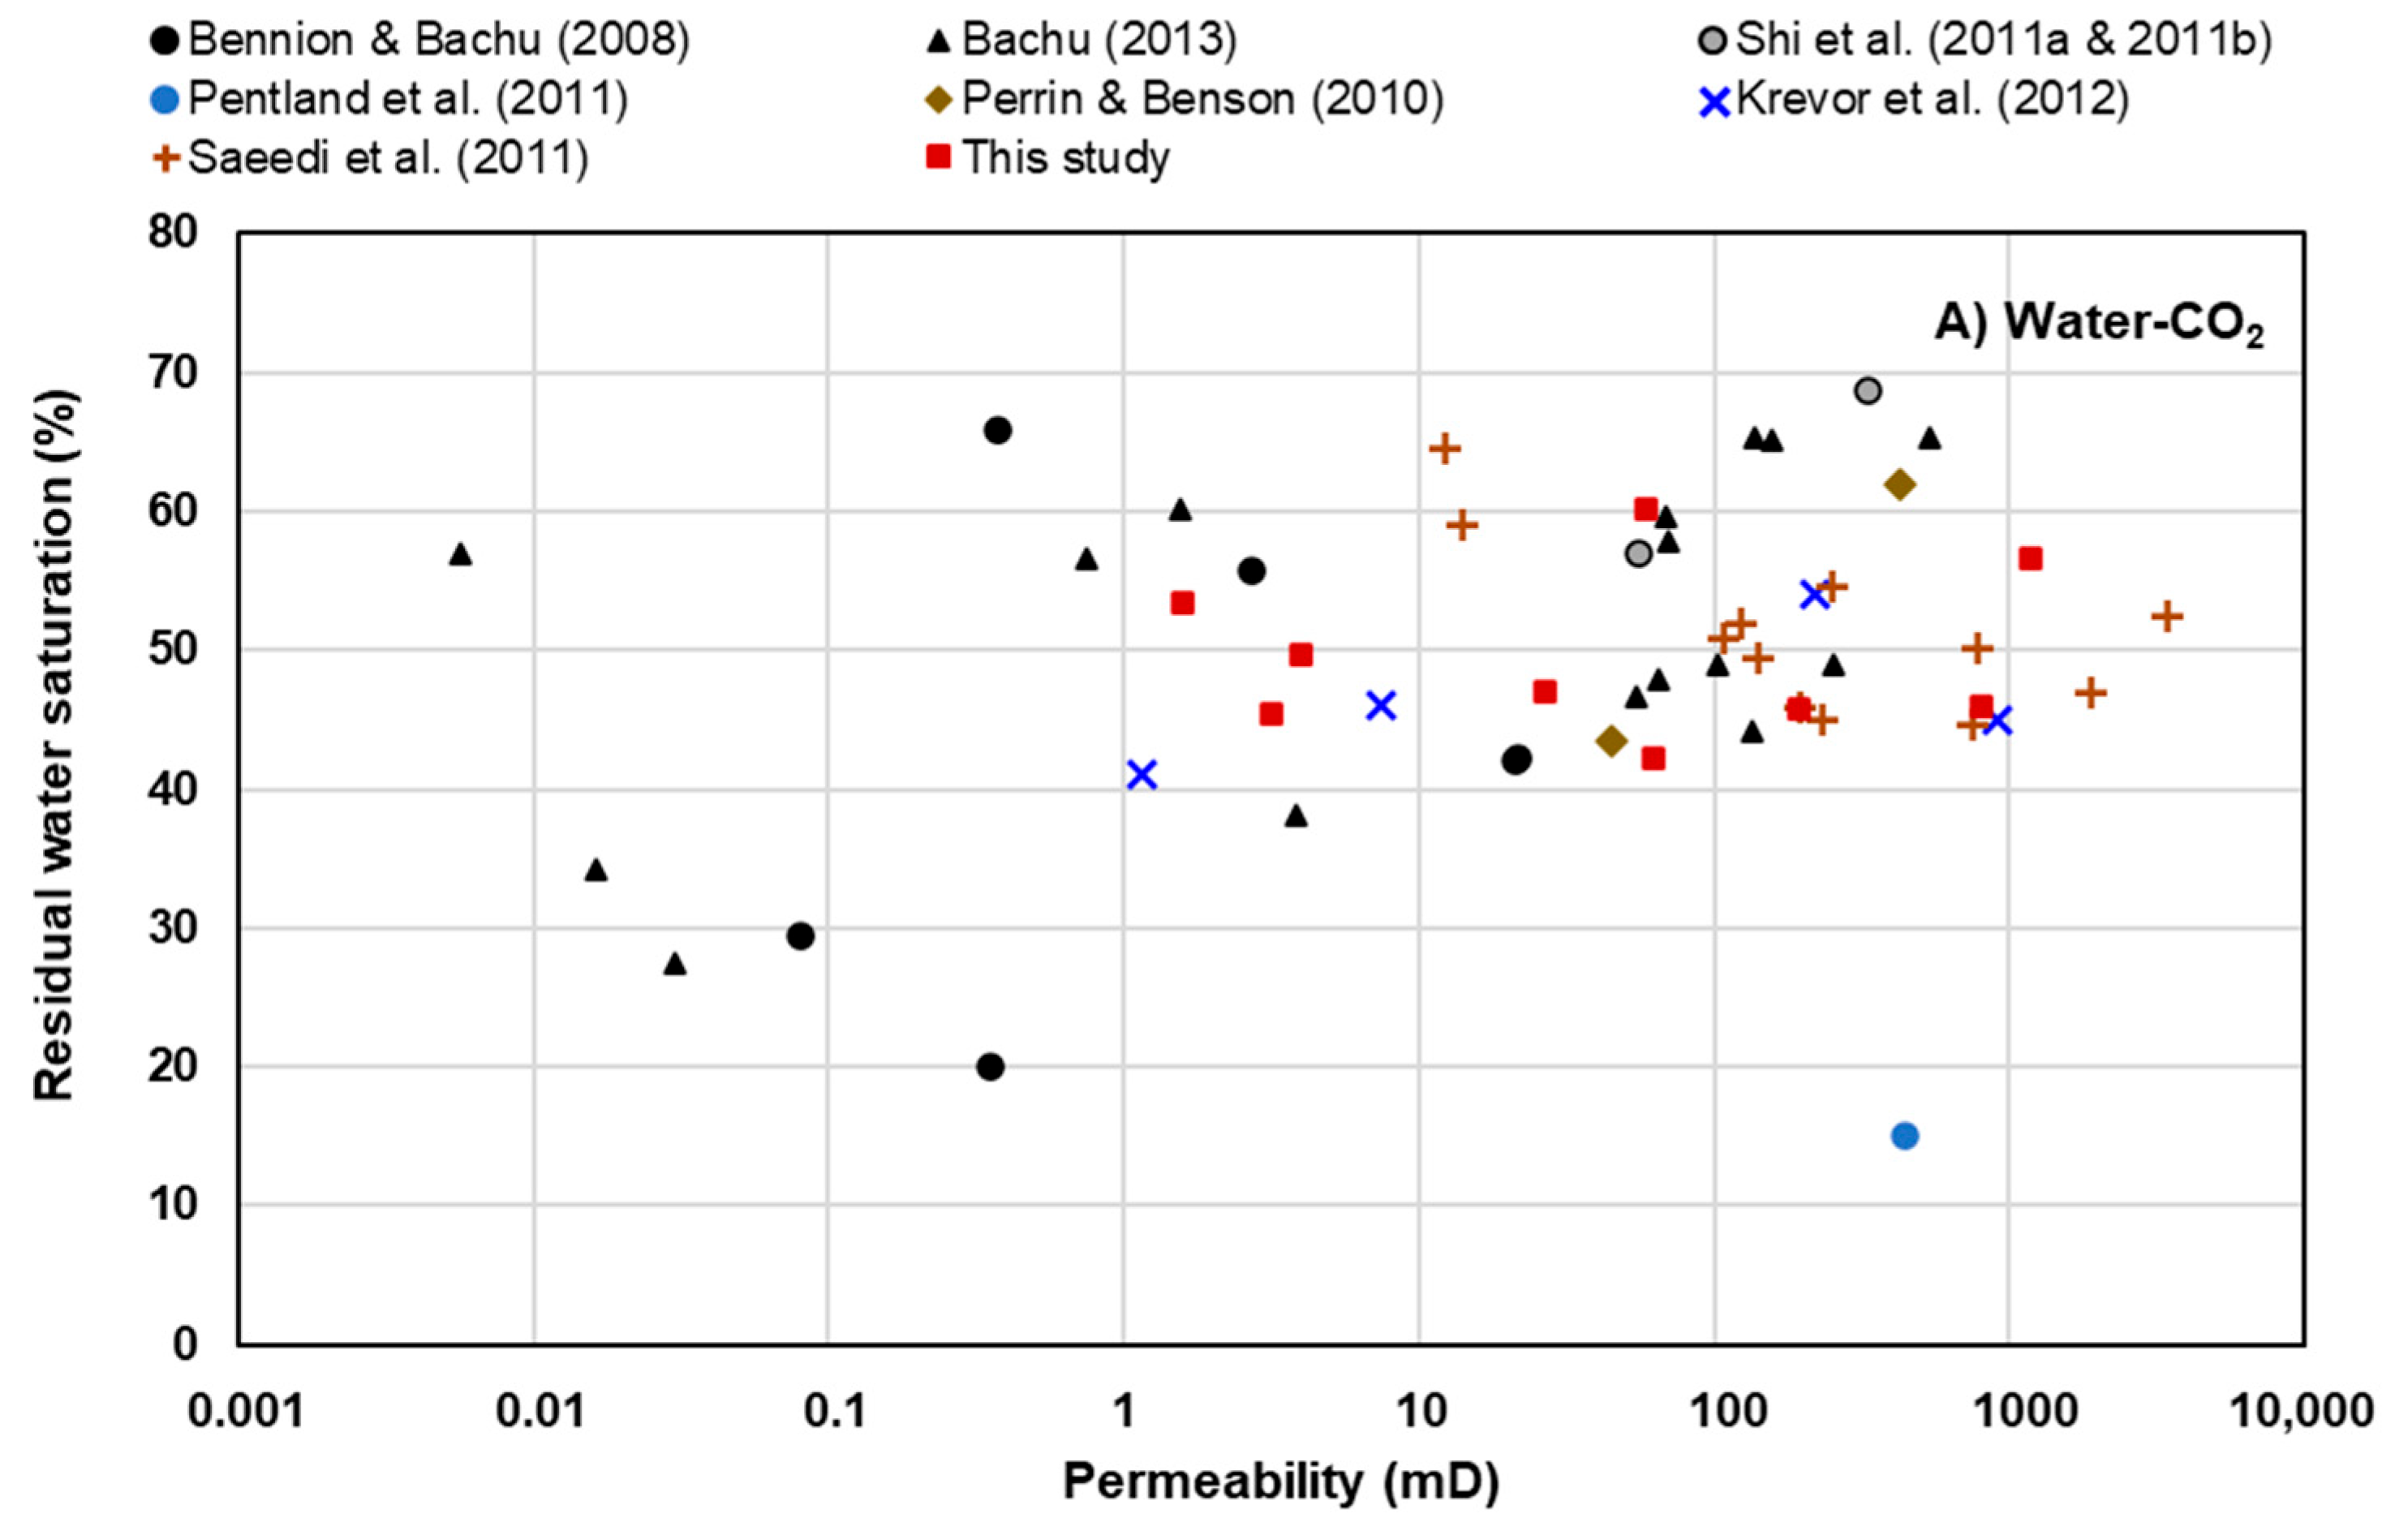
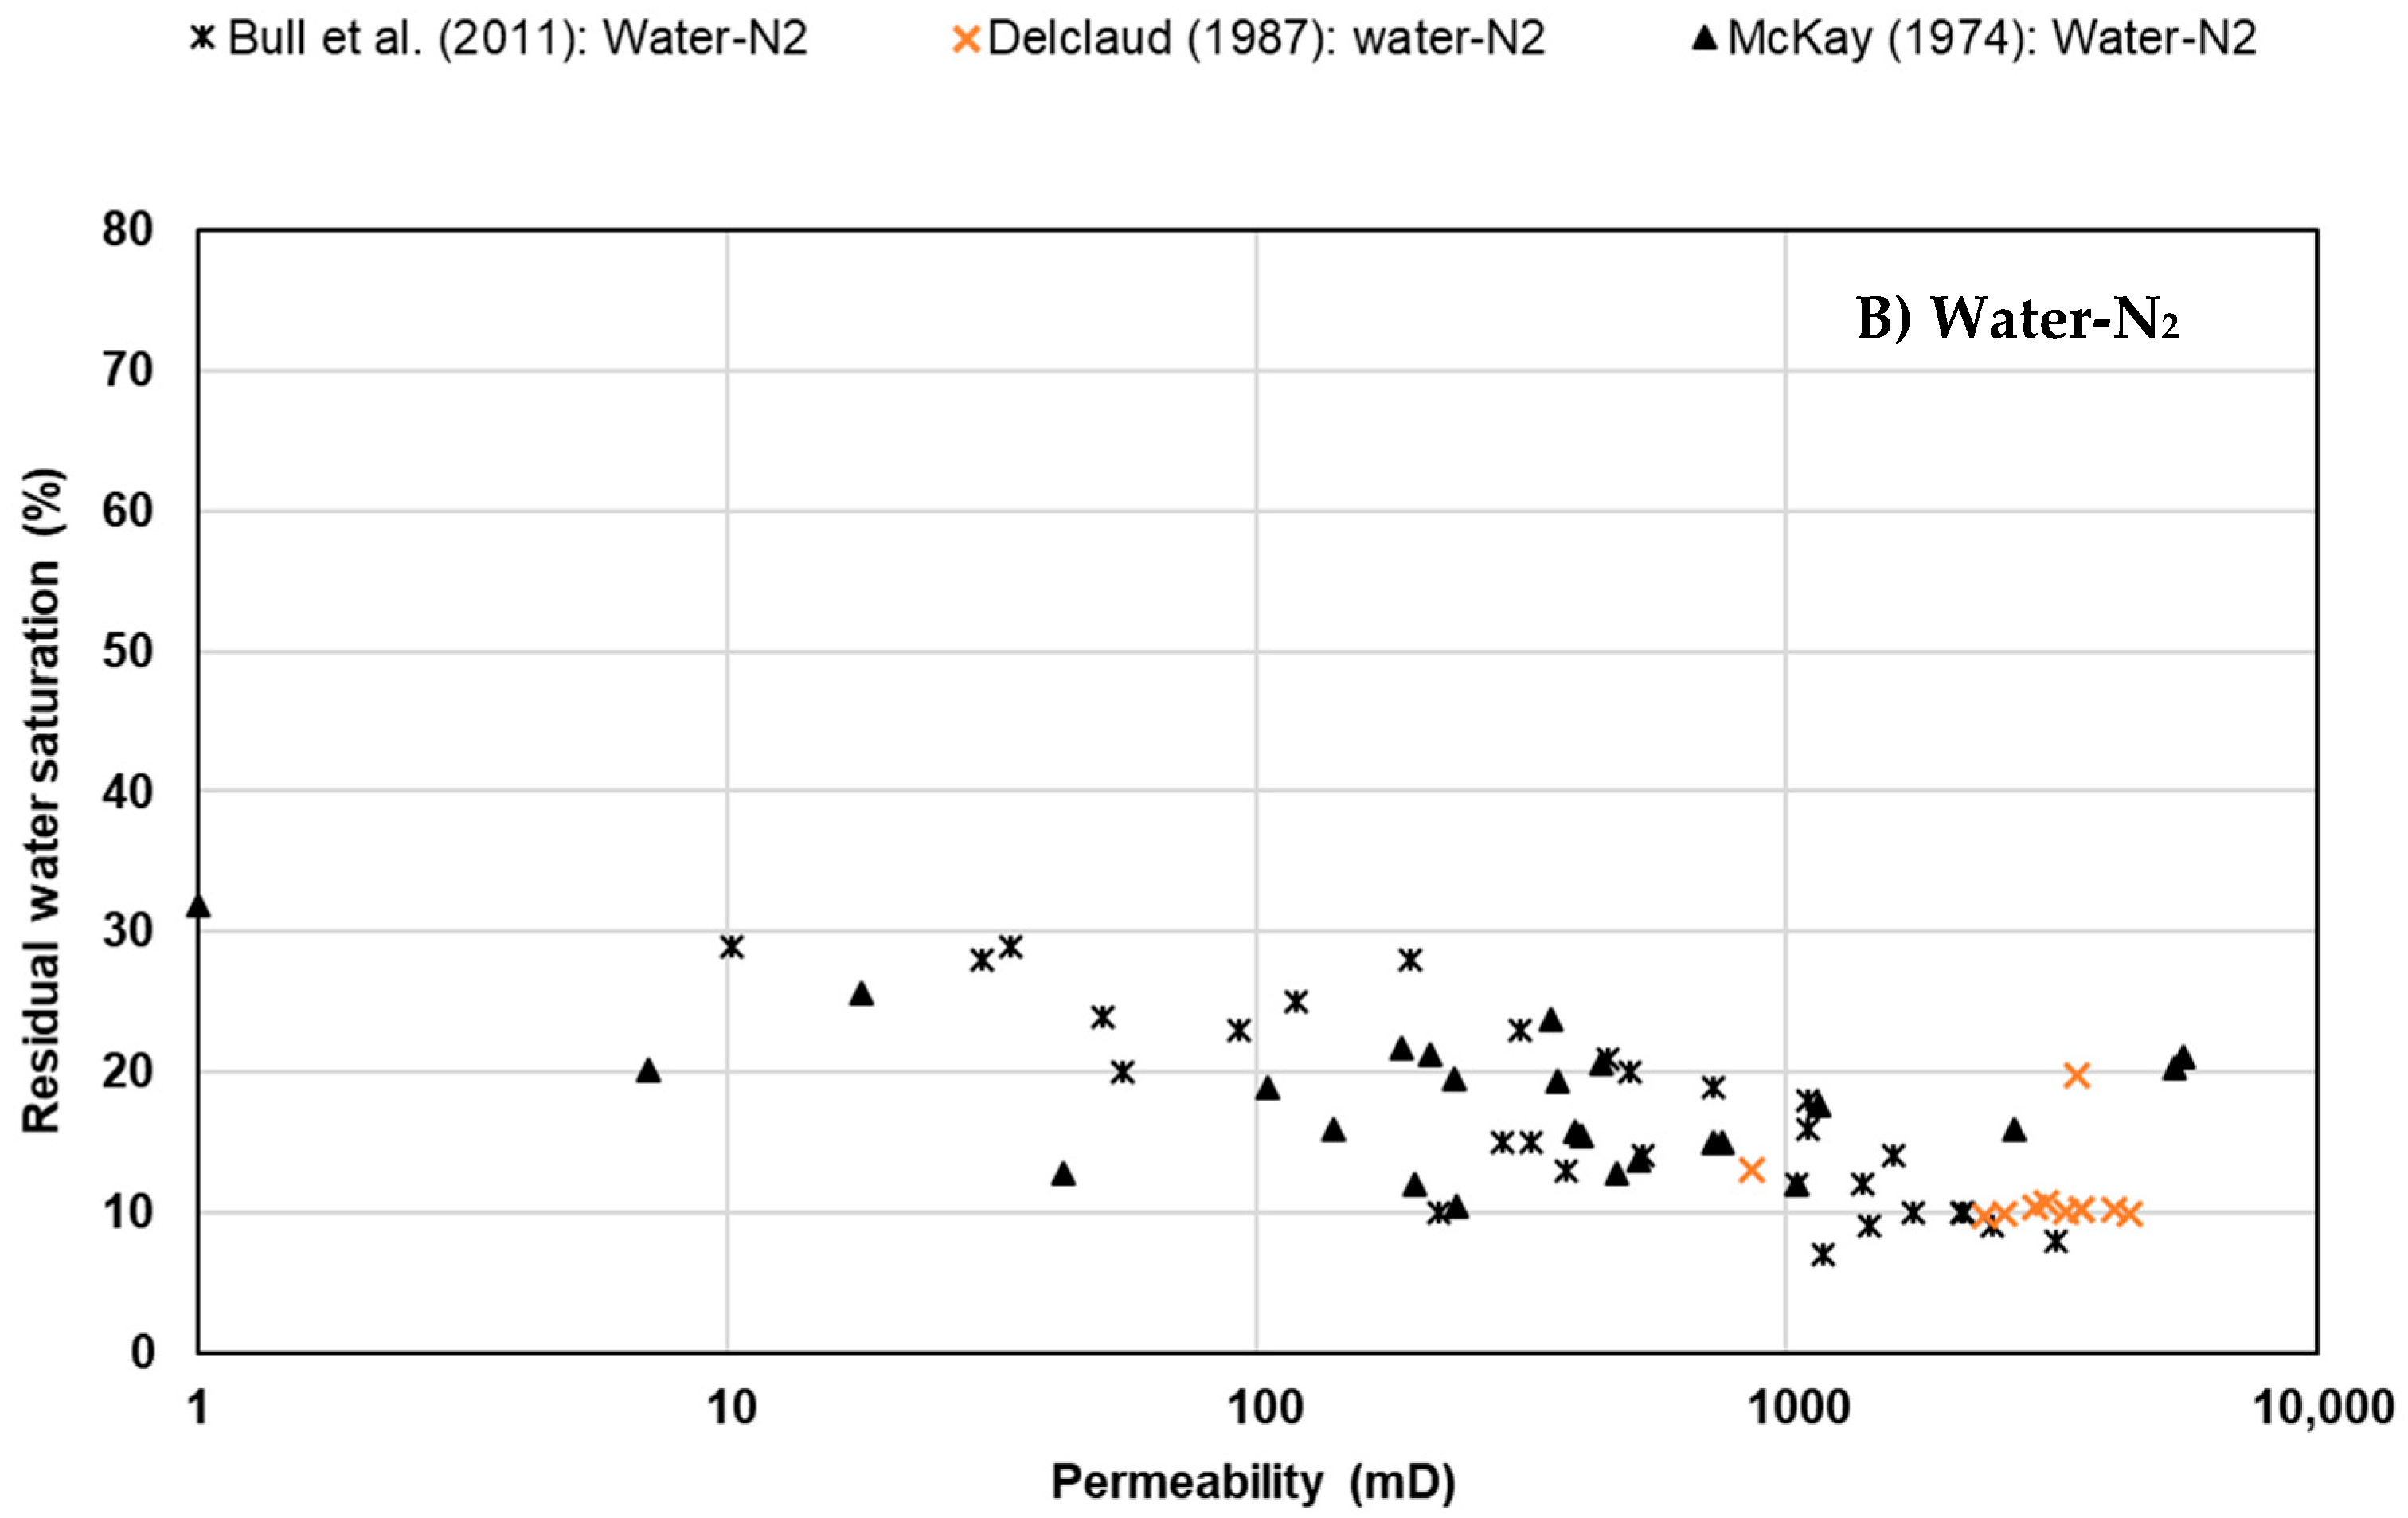
3.1. Core Flooding; Residual Saturation Data

The core flooding experiments were conducted with the main objective of measuring the end-point residual saturations of the wetting phase. The results obtained are reported in semi-log plots (see Figure 5), illustrating the residual saturation data versus sample permeabilities. As is evident, the residual water saturations attained at the end of the drainage floods (i.e., CO2 injection) were relatively high, with an average of almost 50.0%. Another important observation is that, despite our expectations, there does not seem to be a strong dependence of the residual water saturation values on the sample permeabilities.
In contrast, for the N2 displacement, Figure 3 suggests that, across many samples, there seems to be a moderate inverse relationship between the residual water saturation and sample permeability.
Due to the highly pronounced viscosity contrast, the displacement (i.e., drainage) of water (wetting phase) by a gas (non-wetting phase) would suffer from a very low viscosity ratio. As discussed earlier, such a displacement is susceptible to unevenness; the extent of the resulting fingering will determine the degree to which premature gas breakthrough occurs and its impact on the water residual saturation value. At a pore scale, during this process, the invading non-wetting phase tends to flow through the pore center, while the wetting phase continues to cover the pore surface. As the non-wetting phase travels through the pore, the capillary pressure resists the passage of the non-wetting fluid through the downstream pore throats, postponing its breakthrough. Meanwhile, the wetting phase continues to drain from the pore body due to the continuous upstream accumulation of the non-wetting phase. Once the pressure difference between the wetting and non-wetting phases at the displacement front reaches the capillary entry pressure of the pore throat, the non-wetting phase passes through it and enters the next pore body [48]. As a result, smaller IFT would lower the pore throat’s capillary entry pressure, resulting in premature breakthrough and hence the less effective displacement of the wetting fluid.
Viscous fingering leads to the non-uniform sweep of the wetting phase and the low end-point (or maximum) saturation of the non-wetting phase. Subsequently, on the basis of the ‘Land’ trapping model [49], the low end-point saturation of the non-wetting phase reached during the drainage flood would result in a low degree of trapping of the non-wetting phase in a subsequent imbibition displacement. As can be seen from Figure 3 (which incorporates the data from this study), the residual water saturations measured in this work fit well with the data measured by other researchers. Moreover, the lack of an inverse relationship between the residual water saturation and sample permeabilities, which was pointed out earlier in Figure 5, is once again evident.
It is worth noting that the regime boundaries are also affected by the pore structure, domain size, and pore size distribution [15,21,27]. As illustrated in Figure 1, when M << 1, large values of logCa result in viscous fingering, while lower values result in capillary fingering. During an immiscible displacement, both capillary fingering and viscous fingering can result in an uneven displacement front and reduce the efficiency of the flood significantly, leading to an increase in the displaced phase’s residual saturation. McDougall et al. [16] pointed out that, in an immiscible drainage displacement where a very low viscosity ratio (M << 1) predominates, a decrease in the IFT makes the displacement front unstable, which exacerbates the viscous fingering and causes the less viscous non-wetting fluid to break through earlier. To further elaborate on the explanation of the above-observed phenomena, a comparison between the displacement efficiencies of different gas–water systems should be performed. In this context, we have found that the results of [29,48] are more convincing. For instance, Saeedi and Rezaee [48] compared the displacement efficiencies of the CO2–water (IFT = 30 mN/m) and CH4–water (IFT = 45 mN/m) systems by conducting two sets of core flood experiments using these two-fluid systems while keeping the core samples the same from one set of experiments to the other. Their data show that, at a very low viscosity ratio and in capillary-dominated conditions, lowering the IFT has a pronounced adverse effect on the displacement efficiency (i.e., Swr ~0.35 and 0.5 for CH4 and CO2 displacement, respectively). From their outcomes, the impact of IFT is more noticeable in displacing the wetting phase in a capillary-dominated flood, despite the fact that the CO2–water system has a viscosity contrast that is lower, favoring more effective displacement. Saeedi [10] attributed the abnormal patterns in the saturation data derived from the drainage floods to the interaction between the viscous and capillary forces, which might control the displacement. In addition, displacement front instability promoted by a high mobility ratio, along with a lower IFT value for CO2 compared to CH4, worsened the displacement efficiency. Similar results were obtained by Bennion and Bachu [29] when they compared the displacement characteristics of the CO2–water and H2S–water fluid systems (Table 3). Their results show that while, under their experimental conditions, H2S had higher viscosity than CO2, the residual water to H2S was higher than that to CO2 as the IFT of the H2S–water system was lower (Table 3).

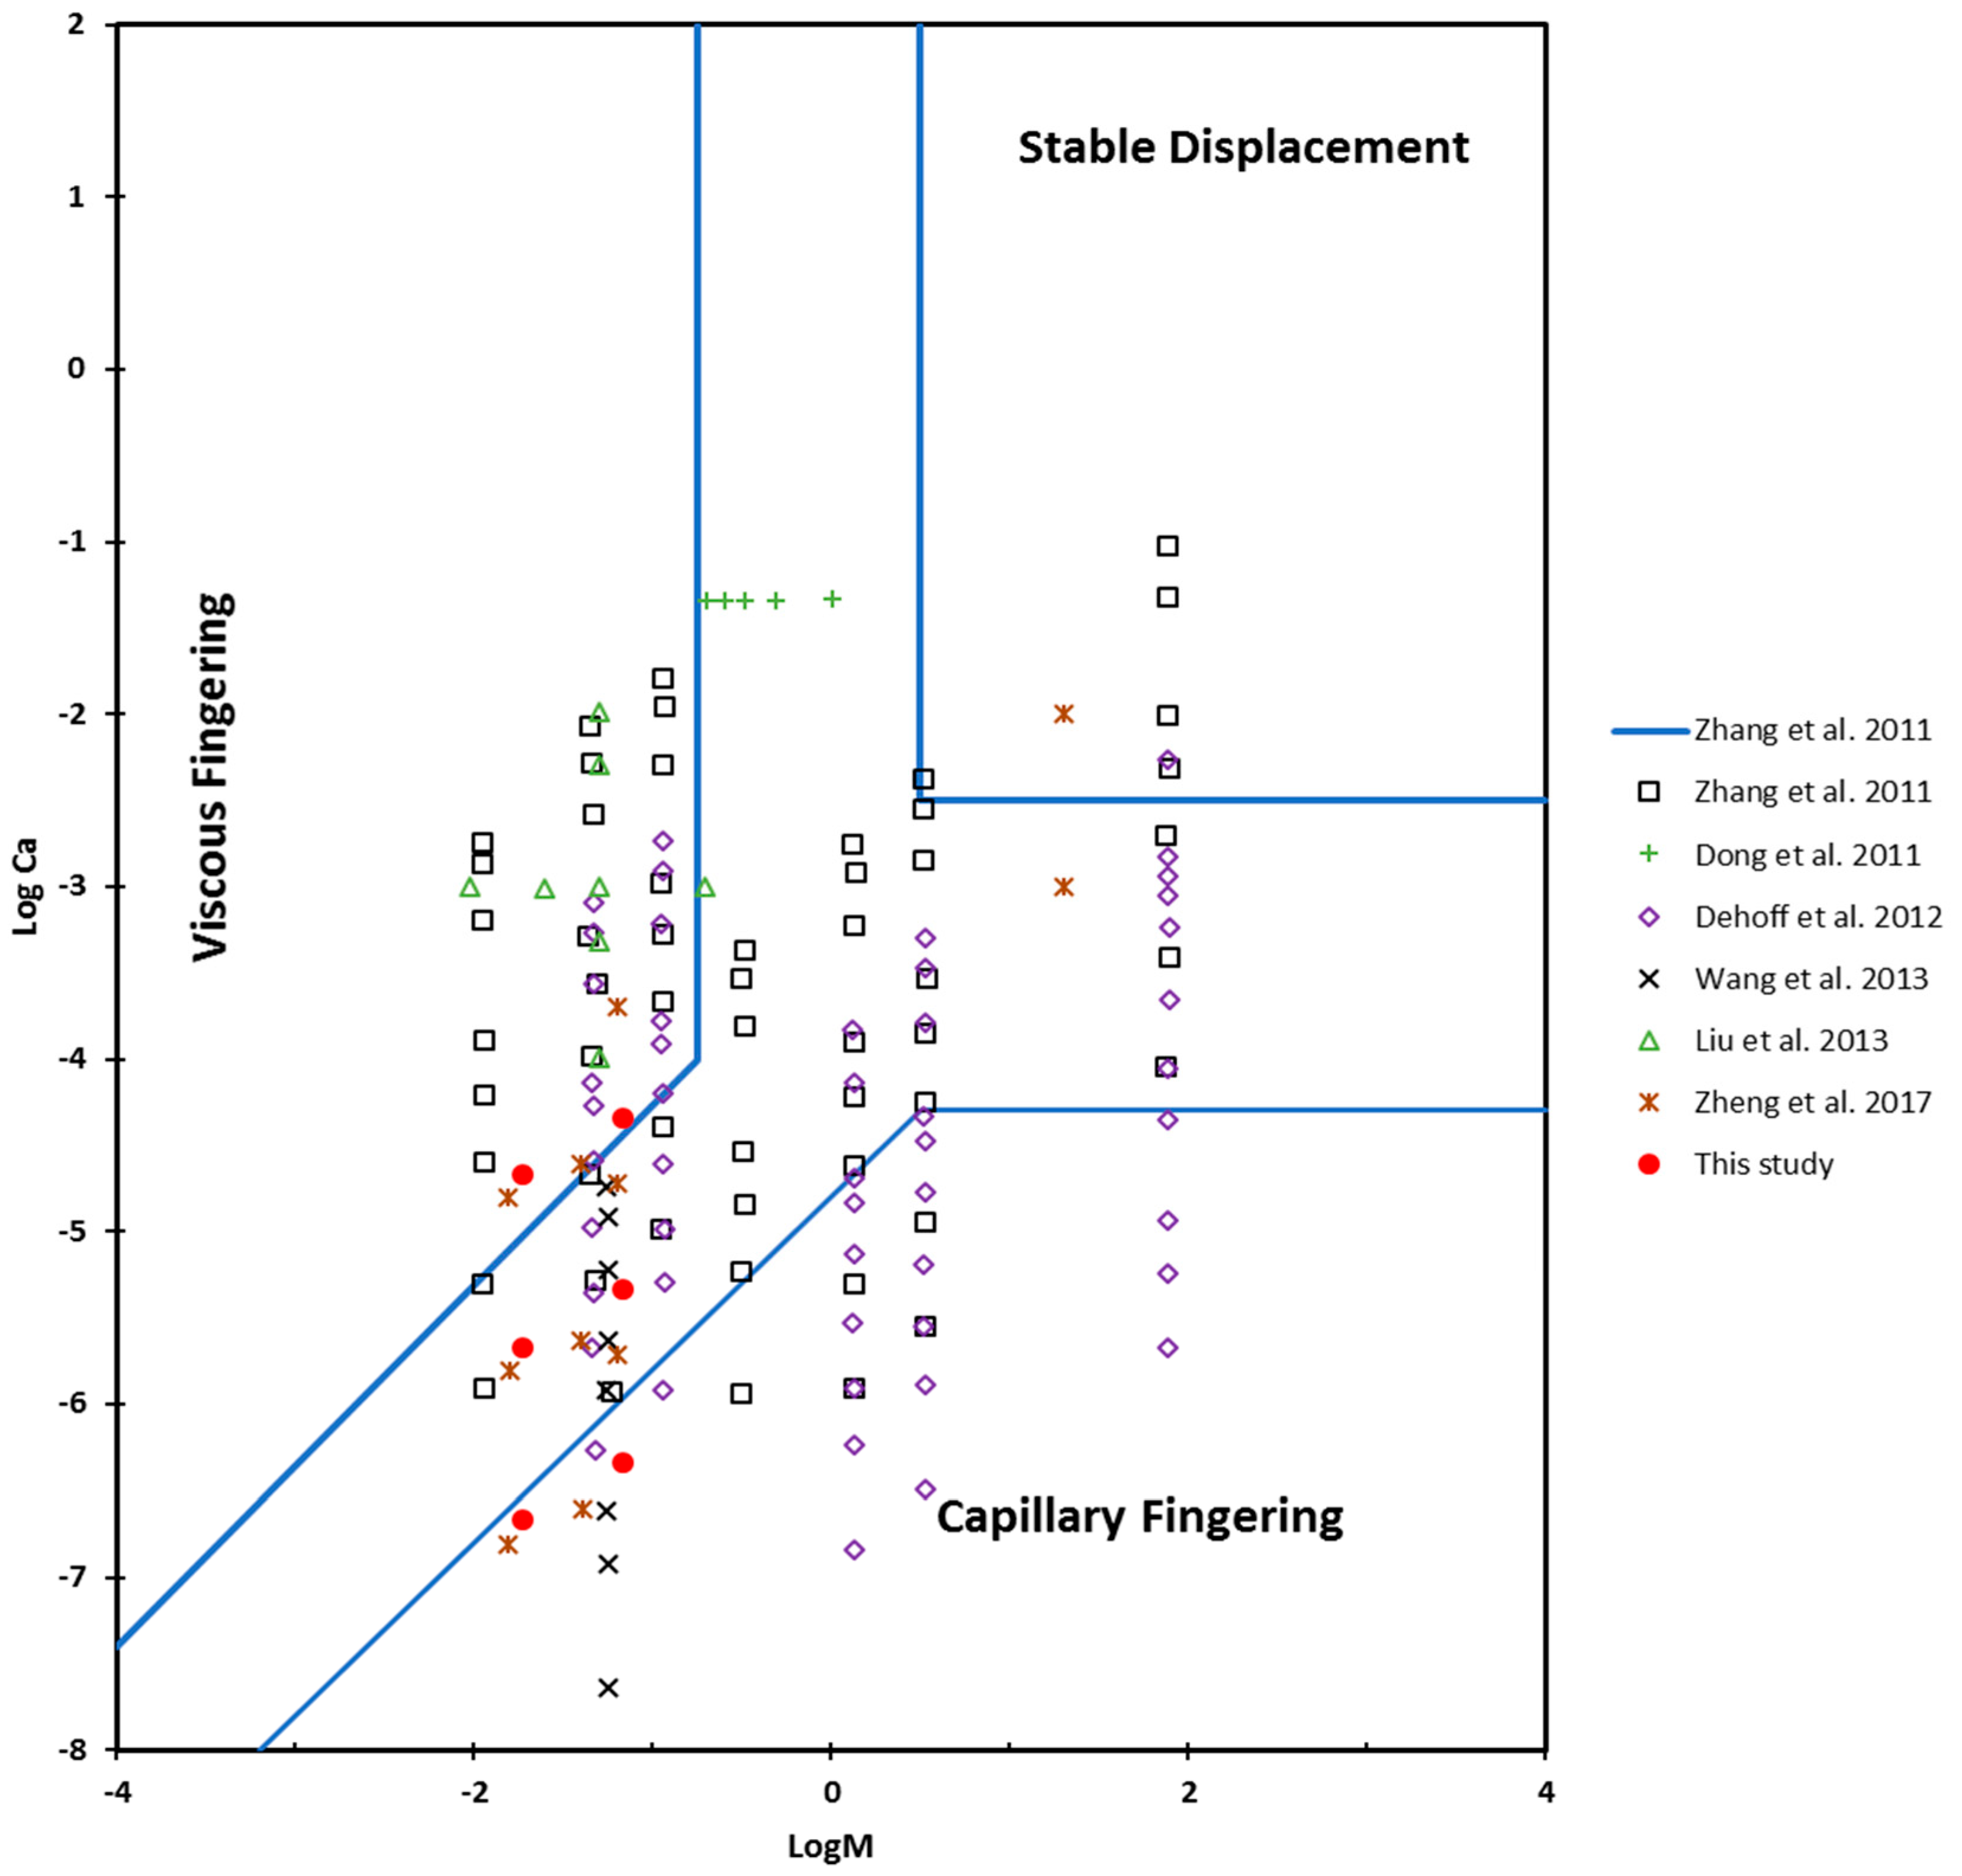
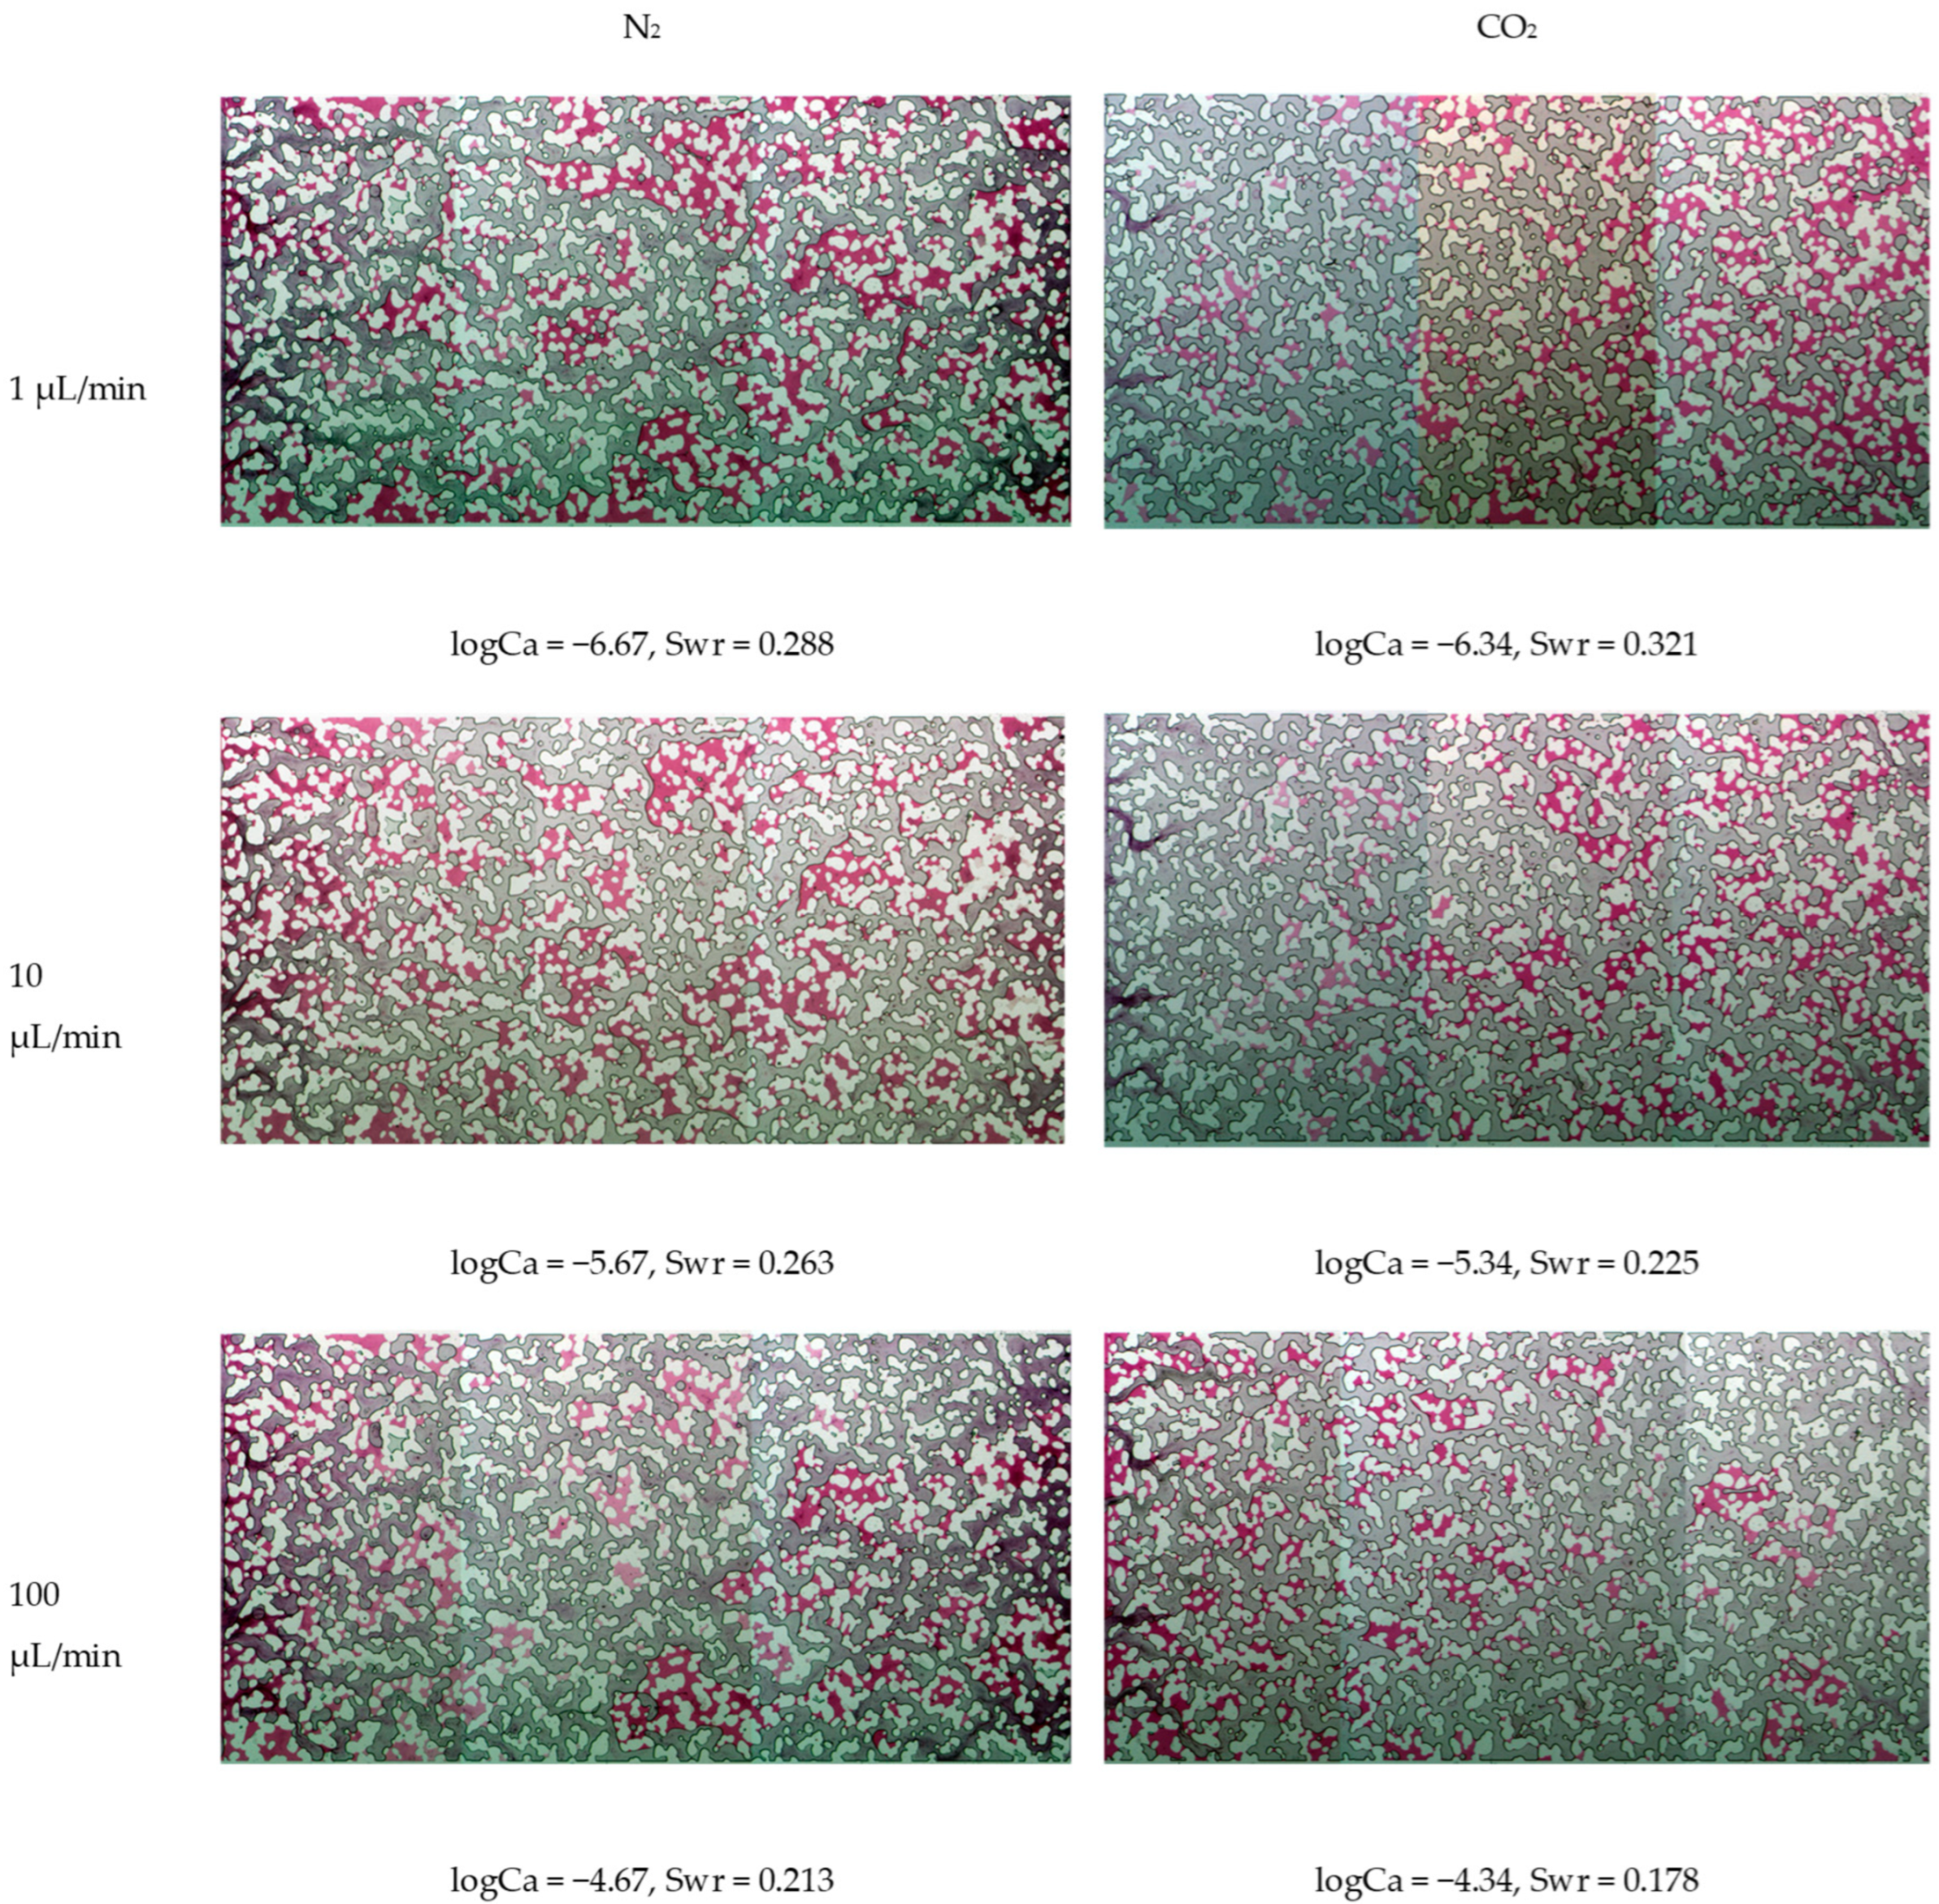
3.2. Microfluidic Device Experiments and Residual Saturation Data

We conducted six experiments by injecting either CO2 or N2 into the microfluidic chip saturated with water at three distinct flow rates. These experiments were repeated twice to confirm the reproducibility of the findings. The N2 and CO2 saturation and displacement patterns were examined as a function of the viscosity ratio, injection flow rate, and IFT. In this study, the measurement conditions were situated in three different zones, including capillary and transition viscous regions, according to Zhang et al.’s [21] suggested boundaries.
Figure 6 displays pictures of the microfluidic chip’s N2–water and CO2–water displacement patterns for each experimental condition. The microfluidic chip’s left side is where the invasion of N2/CO2 (shown by a gray color) begins. The dyed water solution is colored red. As illustrated in Figure 1, the displacement process occurs within the capillary-dominated region at an injection rate of 1 μL/min, and both gases—N2 and CO2—form a preferential flow channel from the input to the output boundary. This leads to a relatively large volume of water being left behind in the microfluidic chip. However, the residual water saturation values show that N2 displaces slightly more water (Swr = 0.288) compared to CO2 (Swr = 0.321). Although the density and viscosity of CO2 are both significantly higher than those of N2 (3.6 and 11.3 times greater, respectively), the IFT values (69.3 mN/m for N2 vs. 34.9 mN/m for CO2) control the displacement in the capillary-dominated region. This implies that water in small pores may not be displaced during CO2 flooding because the high mobility ratio deters CO2 from entering them after it has found a way through the larger pores [50,51]. Furthermore, when the background pressure gradient and the buoyancy of the discontinuous CO2 are insufficient to overcome capillary forces, isolated CO2 bubbles created by snap-off will become trapped as an immobile fluid. According to [52,53], when the capillary pressure in the pore throat exceeds the pore body’s non-wetting phase front capillary pressure, snap-off takes place. Hence, the non-wetting phase is trapped inside the pore body. From these outcomes, the impact of IFT is more noticeable in displacing the wetting phase in a capillary-dominated flood, although there is a smaller viscosity contrast in the CO2–water system, preferring more efficient displacement. When the injection rate is reduced, the combined effect of small IFT with large mobility becomes more noticeable, resulting in reduced water recovery. This increases the displacement inconsistency and leads to a reduction in the recovery of brine. This outcome is consistent with previous studies’ results in which, under a capillary-dominated flood, fluids with higher IFT values have higher displacement efficiency [29,49]. However, when increasing the flow rate to 10 μL/min (where the displacement is in the transition region) and 100 μL/min (where the displacement is in the viscous region), it seems that the viscosity ratio begins to impact the displacement and the resulting residual water saturation (i.e., the residual water saturation after CO2 displacement is lower than that of N2 displacement). For instance, for displacement in the transition region, the calculated residual water saturation values for N2 and CO2 displacement are 0.263 and 0.225, respectively. Meanwhile, for displacement in the viscous-dominated region, the residual saturation values drop further (i.e., 0.213 vs. 0.178, respectively), yet there are comparatively slight, isolated water clusters following both CO2 and N2 invasion. In every test, the water that was initially near the inlet drained more than the water that was near the outlet. In other words, the capillary end impact is the main reason for the change in water saturation from the input boundary [54]. Due to the capillarity discontinuity, near the end of the porous medium, the wetting phase fluid tends to remain in the pores, creating a saturation gradient. However, at a very high flow rate of 100 μL/min, it seems that, as the injection rate for both gases increases, the capillary end effect is alleviated. A similar observation is noted by Zheng et al. [25]. The NMR relaxometry data of Prather et al. [34] suggest that the non-wetting phase (i.e., supercritical CO2, CO2, or air) is trapped more preferentially in larger pores. Since non-wetting fluids prefer larger pores because they reduce their contact area with the solid, snap-off conditions are more favorable in macroscale pores. Thus, based on our experiments’ detailed observations, we can conclude that the snap-off model, which has a close relationship with the IFT value (i.e., image comparison of the displacement of CO2 and N2 at 1 μL/min [logCa = −6.34 and −6.67, correspondingly]), is the reason for the poor displacement in the non-wetting case (i.e., CO2) in the capillary-dominated experiments. This means that more CO2 bubbles are snapped off inside the microfluidic chip. Notably, the residual saturation has been estimated in the absence of subsequent spatial changes in both fluids.

4. Conclusions

Numerous significant variables, such as the temperature, pressure, rock wettability, interfacial tension, fluid viscosity, rock physical properties, flow rate of displacement, hysteresis effects, in situ stress, net effective pressure, and reservoir rock permeability heterogeneity, may impact displacement in porous media. This study emphasizes the crucial role of the interfacial tension (IFT) and viscosity ratio in affecting the behavior of multiphase flows throughout CO2 and N2 displacement in capillary-dominated environments. Despite the fact that CO2 has a higher density and viscosity, the results indicate that IFT has a greater impact on its displacement performance than N2. The results also show that the low IFT of CO2 leads to the insufficient displacement of the wetting phase because of snap-off mechanisms that trap residual water in smaller pores. At low injection flow rates, a less uniform displacement pattern is caused by the large mobility ratio and reduced IFT. However, due to its higher IFT, N2 injection leads to fewer residual water clusters and more detached water clots due to the blebbing phenomenon. The morphological investigation of the residual water presents additional evidence that N2 injection creates a more uniform displacement pattern, whereas CO2 flooding generates a more complicated one, with fragmented ganglia. On the other hand, when increasing the flow rate to 10 μL/min (where the displacement is in the transition region) and 100 μL/min (where the displacement is in the viscous region), it seems that the viscosity ratio begins to impact the displacement and thus the resulting residual water saturation. These results demonstrate that the viscosity ratio and IFT are important in controlling the efficiency of N2/CO2 flooding operations. This work presents novel insights to optimize fluid injection techniques for enhanced oil recovery and CO2 sequestration.

Author Contributions

Conceptualization, D.A.-B. and A.S.; methodology, D.A.-B. and E.A.A.-K.; software, D.S.M.; validation, A.S. and M.M.; formal analysis, D.A.-B. and M.M.; investigation, E.A.A.-K. and D.A.-B.; resources, M.M. and A.S.; data curation, D.A.-B.; writing—original draft preparation, D.S.M. and D.A.-B.; writing—review and editing A.S. and M.M.; visualization, E.A.A.-K. and D.A.-B. All authors have read and agreed to the published version of the manuscript.

Funding

This research received no external funding.

Data Availability Statement

Data will be available upon request.

Conflicts of Interest

The authors declare no conflicts of interest.

References

  1. Lackner, K.S. A Guide to CO2 Sequestration. Science 2003, 300, 1677–1678. [Google Scholar] [CrossRef]
  2. Chalbaud, C.; Robin, M.; Lombard, J.M.; Martin, F.; Egermann, P.; Bertin, H. Interfacial Tension Measurements and Wettability Evaluation for Geological CO2 Storage. Adv. Water Res. 2009, 32, 98–109. [Google Scholar] [CrossRef]
  3. He, Y.; Zhang, L.; Yang, S.; Peterson, M.P.; Yan, H.; Filonchyk, M.; Gusev, A. Greenhouse gas emissions and reduction strategies for the world’s largest greenhouse gas emitters. Sci. Total. Environ. 2024, 944, 173895. [Google Scholar]
  4. Al-Khdheeawi, E.A.; Mahdi, D.S.; Yuan, Y.; Iglauer, S. Influence of Clay Content on CO2-Rock Interaction and Mineral-Trapping Capacity of Sandstone Reservoirs. Energies 2023, 16, 3489. [Google Scholar] [CrossRef]
  5. Tassinari, C.C.G.; Kumar, N.; Ali, M.; Blunt, M.J.; Sampaio, M.A.; Izadpanahi, A. A review of carbon storage in saline aquifers: Mechanisms, prerequisites, and key considerations. Fuel 2024, 369, 131744. [Google Scholar]
  6. Myers, M.; Saeedi, A.; Al-Bayati, D. Pore-Scale Displacement Experiments Using Microfluidic Device to Investigate Fingering Mechanisms Using Both CO2 and N2: Implications for EOR and CO2 Geo-Storage. Pet. Chem. 2024, 64, 756–761. [Google Scholar]
  7. Deng, Z.; Cardenas, M.B.; Bennett, P.C. Extended Roof Snap-Off for a Continuous Non-Wetting Fluid and an Example Case for Supercritical CO2. Adv. Water Res. 2014, 64, 34–46. [Google Scholar] [CrossRef]
  8. Tan, F.; Jiang, R.; Ma, C.; Jing, Y.; Chen, K.; Lu, Y. CO2 Oil Displacement and Geological Storage Status and Prospects. Energy Sci. Eng. 2025, 13, 475–511. [Google Scholar] [CrossRef]
  9. Bennion, D.B.; Thomas, F.B.; Jamaluddin, A.; Ma, T. The Effect of Trapped Critical Fluid Saturations on Reservoir Permeability and Conformance; Hycal Energy Research Laboratories Ltd.: Calgary, AB, Canada, 1996. [Google Scholar]
  10. Saeedi, S. Experimental Study of Multiphase Flow in Porous Media During CO2 Geo-Sequestration Processes; Springer Science & Business Media: Berlin/Heidelberg, Germany, 2012. [Google Scholar]
  11. Iglauer, S. CO2–Water–Rock Wettability: Variability, Influencing Factors, and Implications for CO2 Geostorage. Acc. Chem. Res. 2017, 50, 1134–1142. [Google Scholar] [CrossRef]
  12. Al-bayati, A.; Saeedi, A.; White, C.; Xie, Q.; Myers, M. The Effects of Crossflow and Permeability Variation on Different Miscible CO2 Injection Schemes Performance in Layered Sandstone Porous Media. In Proceedings of the IOR 2019—20th European Symposium on Improved Oil Recovery, Pau, France, 8–11 April 2019; Volume 2019, pp. 1–10. [Google Scholar]
  13. Al-bayati, A.; Saeedi, A.; Myers, M.; White, C.; Xie, Q.; Hossain, M.M. Immiscible Water Alternating CO2 Displacement Efficiency in Layered Water Wet Porous Media. In Proceedings of the 82nd EAGE Annual Conference & Exhibition, Amsterdam, The Netherlands, 18–21 October 2021. [Google Scholar] [CrossRef]
  14. Al-Khdheeawi, E.A. Optimizing CO2-Water Injection Ratio in Heterogeneous Reservoirs: Implications for CO2 Geo-Storage. Energies 2024, 17, 678. [Google Scholar] [CrossRef]
  15. Lenormand, R.; Touboul, E.; Zarcone, C. Numerical Models and Experiments on Immiscible Displacements in Porous Media. J. Fluid Mech. 1988, 189, 165–187. [Google Scholar] [CrossRef]
  16. McDougall, S.R.; Salino, P.A.; Sorbie, K.S. The Effect of Interfacial Tension Upon Gas-Oil Relative Permeability Measurements: Interpretation Using Pore-Scale Models. In Proceedings of the SPE Annual Technical Conference and Exhibition, San Antonio, TX, USA, 5–8 October 1997; Society of Petroleum Engineers: San Antonio, TX, USA, 1997. [Google Scholar]
  17. Dullien, F.A.L. Porous Media: Fluid Transport and Pore Structure; Academic Press: Cambridge, UK, 2012. [Google Scholar]
  18. Ferer, M.; Ji, C.; Bromhal, G.S.; Cook, J.; Ahmadi, G.; Smith, D.H. Crossover from Capillary Fingering to Viscous Fingering for Immiscible Unstable Flow: Experiment and Modeling. Phys. Rev. E 2004, 70, 016303. [Google Scholar] [CrossRef] [PubMed]
  19. Chang, Y.; Tsai, J.P.; Shan, H.Y.; Chen, H.H. Experimental Study on Imbibition Displacement Mechanisms of Two-Phase Fluid Using Micro Model. Environ. Earth Sci. 2009, 59, 901. [Google Scholar] [CrossRef]
  20. Cottin, P.; Bodiguel, H.; Colin, A. Drainage in Two-Dimensional Porous Media: From Capillary Fingering to Viscous Flow. Phys. Rev. E 2010, 82, 046315. [Google Scholar] [CrossRef]
  21. Zhang, J.; Oostrom, M.; Wietsma, T.W.; Grate, J.W.; Warner, M.G. Influence of Viscous and Capillary Forces on Immiscible Fluid Displacement: Pore-Scale Experimental Study in a Water-Wet Micromodel Demonstrating Viscous and Capillary Fingering. Energy Fuels 2011, 25, 3493–3505. [Google Scholar] [CrossRef]
  22. Guo, F.; Aryana, M. An Experimental Investigation of Flow Regimes in Imbibition and Drainage Using a Microfluidic Platform. Energies 2019, 12, 1390. [Google Scholar] [CrossRef]
  23. Saffman, P.G.; Taylor, G.I. The Penetration of a Fluid into a Porous Medium or Hele-Shaw Cell Containing a More Viscous Liquid. Proc. R. Soc. Lond. Ser. A Math. Phys. Sci. 1958, 245, 312–329. [Google Scholar]
  24. DeHoff, R.T.; Oostrom, M.; Zhang, C.; Grate, J.W. Evaluation of Two-Phase Relative Permeability and Capillary Pressure Relations for Unstable Displacements in a Pore Network. Vadose Zone J. 2012, 11, vzj2012-0024. [Google Scholar] [CrossRef]
  25. Zheng, Y.; Mahabadi, N.; Yun, T.S.; Jang, J. Effect of Capillary and Viscous Force on CO2 Saturation and Invasion Pattern in the Microfluidic Chip. J. Geophys. Res. Solid Earth 2017, 122, 1634–1647. [Google Scholar] [CrossRef]
  26. Dong, B.; Yan, Y.Y.; Li, W.Z. LBM Simulation of Viscous Fingering Phenomenon in Immiscible Displacement of Two Fluids in Porous Media. Transp. Porous Media 2011, 88, 293–314. [Google Scholar] [CrossRef]
  27. Liu, Y.; Valocchi, A.J.; Kang, Q.; Werth, C. Pore-Scale Simulations of Gas Displacing Liquid in a Homogeneous Pore Network Using the Lattice Boltzmann Method. Transp. Porous Media 2013, 99, 555–580. [Google Scholar] [CrossRef]
  28. Mahabadi, N. Multiphase Fluid Flow Through Porous Media: Conductivity and Geomechanics. Ph.D. Thesis, Arizona State University, Tucson, AZ, USA, 2016. [Google Scholar]
  29. Bennion, D.B.; Bachu, S. Supercritical CO2 and H2S-Brine Drainage and Imbibition Relative Permeability Relationships for Intercrystalline Sandstone and Carbonate Formations. In Proceedings of the SPE Europec/EAGE Annual Conference and Exhibition, Vienna, Austria, 12–15 June 2006; Society of Petroleum Engineers: Vienna, Austria, 2006. [Google Scholar]
  30. Blunt, M.J.; King, M.J.; Scher, H. Simulation and Theory of Two-Phase Flow in Porous Media. Phys. Rev. A 1992, 46, 7680. [Google Scholar] [CrossRef]
  31. Blunt, M.J. Pore Level Modeling of the Effects of Wettability. SPE J. 1997, 2, 494–510. [Google Scholar] [CrossRef]
  32. Valvatne, P.H.; Blunt, M.J. Predictive Pore-Scale Modeling of Two-Phase Flow in Mixed Wet Media. Water Resour. Res. 2004, 40, 7. [Google Scholar] [CrossRef]
  33. Krevor, S.; Blunt, M.J.; Benson, S.M.; Pentland, C.H.; Reynolds, C.; Al-Menhali, A.; Niu, B. Capillary Trapping for Geologic Carbon Dioxide Storage—From Pore Scale Physics to Field Scale Implications. Int. J. Greenh. Gas Control. 2015, 40, 221–237. [Google Scholar] [CrossRef]
  34. Prather, C.A.; Bray, J.M.; Seymour, J.D.; Codd, S.L. NMR Study Comparing Capillary Trapping in Berea Sandstone of Air, Carbon Dioxide, and Supercritical Carbon Dioxide After Imbibition of Water. Water Resour. Res. 2016, 52, 713–724. [Google Scholar] [CrossRef]
  35. Wang, Y.; Zhang, C.; Wei, N.; Oostrom, M.; Wietsma, T.W.; Li, X.; Bonneville, A. Experimental Study of Crossover from Capillary to Viscous Fingering for Supercritical CO2–Water Displacement in a Homogeneous Pore Network. Environ. Sci. Technol. 2012, 47, 212–218. [Google Scholar] [CrossRef]
  36. Saeedi, A.; Rezaee, R.; Evans, B.; Clennell, B. Multiphase Flow Behaviour During CO2 Geo-Sequestration: Emphasis on the Effect of Cyclic CO2–Brine Flooding. J. Pet. Sci. Eng. 2011, 79, 65–85. [Google Scholar] [CrossRef]
  37. Bennion, D.B.; Bachu, S. Drainage and Imbibition Relative Permeability Relationships for Supercritical CO2/Brine and H2S/Brine Systems in Intergranular Sandstone, Carbonate, Shale, and Anhydrite Rocks. SPE Reserv. Evaluation Eng. 2008, 11, 487–496. [Google Scholar] [CrossRef]
  38. Bachu, S. Drainage and Imbibition CO2/Brine Relative Permeability Curves at in Situ Conditions for Sandstone Formations in Western Canada. Energy Procedia 2013, 37, 4428–4436. [Google Scholar] [CrossRef]
  39. Shi, J.-Q.; Xue, Z.; Durucan, S. Supercritical CO2 core flooding and imbibition in Tako sandstone—Influence of sub-core scale heterogeneity. Int. J. Greenh. Gas Control. 2011, 5, 75–87. [Google Scholar] [CrossRef]
  40. Shi, J.-Q.; Xue, Z.; Durucan, S. Supercritical CO2 core flooding and imbibition in Berea sandstone—CT imaging and numerical simulation. Energy Procedia 2011, 4, 5001–5008. [Google Scholar] [CrossRef]
  41. Pentland, C.H.; El-Maghraby, R.; Iglauer, S.; Blunt, M.J. Measurements of the capillary trapping of super-critical carbon dioxide in Berea sandstone. Geophys. Res. Lett. 2011, 38, L06401. [Google Scholar] [CrossRef]
  42. Pentland, C.; El-Maghraby, R.; Georgiadis, A.; Iglauer, S.; Blunt, M. Immiscible Displacements and Capillary Trapping in CO2 Storage. Energy Procedia 2011, 4, 4969–4976. [Google Scholar] [CrossRef]
  43. Kuo, C.-W.; Perrin, J.-C.; Benson, S.M. Effect of gravity, flow rate, and small scale heterogeneity on multiphase flow of CO2 and brine. In Proceedings of the SPE Western Regional Meeting, Anaheim, CA, USA, 27–29 May 2010. SPE-132607. [Google Scholar]
  44. Krevor, S.C.M.; Pini, R.; Zuo, L.; Benson, S.M. Relative permeability and trapping of CO2 and water in sandstone rocks at reservoir conditions. Water Resour. Res. 2012, 48, W02532. [Google Scholar] [CrossRef]
  45. Bull, Ø.; Bratteli, F.; Ringen, J.K.; Melhuus, K.; Bye, A.L.; Iversen, J.E. The quest for the true residual gas saturation–an experimental approach. In Proceedings of the International Symposium of the Society of Core Analysts, Austin, TX, USA, 18–21 September 2011; pp. 1–12. [Google Scholar]
  46. Delclaud, J.; Rochon, J.; Nectoux, A. Investigation of gas/oil relative permeabilities: High-permeability oil reservoir application. In Proceedings of the SPE Annual Technical Conference and Exhibition, Dallas, TX, USA, 27–30 September 1987. SPE-16966. [Google Scholar]
  47. McKay, B.A. Laboratory Studies of Sandstone Reservoirs Gas Displacement from Having Strong Water Drive. APPEA J. 1974, 14, 189–194. [Google Scholar] [CrossRef]
  48. Saeedi, A.; Rezaee, R. Effect of Residual Natural Gas Saturation on Multiphase Flow Behaviour During CO2 Geo-Sequestration in Depleted Natural Gas Reservoirs. J. Pet. Sci. Eng. 2012, 82, 17–26. [Google Scholar] [CrossRef]
  49. Land, C.S. Calculation of Imbibition Relative Permeability for Two- and Three-Phase Flow from Rock Properties. Soc. Pet. Eng. J. 1968, 8, 149–156. [Google Scholar] [CrossRef]
  50. Espinoza, D.N.; Santamarina, J.C. Water-CO2-Mineral Systems: Interfacial Tension, Contact Angle, and Diffusion—Implications to CO2 Geological Storage. Water Resour. Res. 2010, 46, 7. [Google Scholar] [CrossRef]
  51. Wei, B.; Zhang, X.; Wu, R.; Zou, P.; Gao, K.; Xu, X.; Pu, W.; Wood, C. Pore-Scale Monitoring of CO2 and N2 Flooding Processes in a Tight Formation Under Reservoir Conditions Using Nuclear Magnetic Resonance (NMR): A Case Study. Fuel 2019, 246, 34–41. [Google Scholar] [CrossRef]
  52. Rossen, W.R. Snap-Off in Constricted Tubes and Porous Media. Colloids Surf. A Physicochem. Eng. Asp. 2000, 166, 101–107. [Google Scholar] [CrossRef]
  53. Al-Bayati, D.; Saeedi, A.; Ktao, I.; Myers, M.; White, C.; Mousavi, A.; Xie, Q.; Lagat, C. X-Ray Computed Tomography Assisted Investigation of Flow Behaviour of Miscible CO2 to Enhance Oil Recovery in Layered Sandstone Porous Media. In Proceedings of the SPE EOR Conference at Oil and Gas West Asia, Muscat, Oman, 21–23 March 2022; p. D011S004R004. [Google Scholar]
  54. Huang, D.D.; Honarpour, M.M. Capillary End Effects in Coreflood Calculations. J. Pet. Sci. Eng. 1998, 19, 103–117. [Google Scholar] [CrossRef]
Figure 2. Schematic diagram of the laboratory core flooding setup.
Gases 05 00013 g002
Figure 4. Microfluidic rig experimental setup.
Gases 05 00013 g004
Figure 5. Residual water saturations versus sample permeabilities for CO2–water system.
Gases 05 00013 g005
Figure 6. Residual distribution of N2 and CO2 (grey) and dyed water (red) in the microfluidic chip under pressure of 6 MPa and different flow rates (capillary number), with saturation values calculated using ImageJ, Version 1.54g.
Gases 05 00013 g006
Table 1. Basic petrophysical properties of the rock samples tested and the experimental conditions applied.
Sample IDGeological LocationWater Salinity (ppm NaCl)Porosity (%)Gas Permeability (mD)
SPB1Southern Perth Basin30,00016.53.15
SPB2Southern Perth Basin30,00020.127
SB1Surat Basin100020.462
SB2Surat Basin100022.9800
GB1Gippsland Basin200018.294
GB2Gippsland Basin200025.41180
GB3Gippsland Basin30,00018.4193
GB4Gippsland Basin10,00010.21.6
GB4Gippsland Basin20001859
Table 2. Interfacial and physical properties of both CO2 and N2 under experimental conditions.
PhaseN2CO2
Contact angle [deg]30 ± 1045 ± 10
Interfacial tension at CO2-H2O [mN/m] 69.334.9
Capillary number [logCa]
1 μL/min−6.67−6.34
10 μL/min−5.67−5.34
100 μL/min−4.67−4.34
Density [kg/m3]69.4782.7
Viscosity [mPa·s]1.9 × 10−26.8 × 10−2
Viscosity ratio [log( μ c o 2 / μ H 2 O )]−1.73−1.17
Table 3. Characteristics of the fluid systems used by Bennion and Bachu [29], evaluated under their experimental conditions.
Injection FluidPressure
(MPa)
Temperature
(°C)
IFT when in Contact
with Water (mN·m)
Viscosity
(mPa·s)
Residual Water Saturation—End
of Drainage Flood (%)
H2S8.63512.20.13448.1
CO232.120.04742.3
H2S17.45612.30.12154.5
CO234.560.05849.2
Disclaimer/Publisher’s Note: The statements, opinions and data contained in all publications are solely those of the individual author(s) and contributor(s) and not of MDPI and/or the editor(s). MDPI and/or the editor(s) disclaim responsibility for any injury to people or property resulting from any ideas, methods, instructions or products referred to in the content.

