Abstract
The gasification of residues into syngas offers a versatile gaseous fuel that can be used to produce heat and power in various applications. However, the application of syngas in engines presents several challenges due to the changes in its composition. Such variations can significantly alter the optimal operational conditions of the engines that are fueled with syngas, resulting in combustion instability, high engine variability, and misfires. In this context, this work presents an experimental investigation conducted on a port-fuel injection spark-ignition optical research engine using three different syngas mixtures, with a particular focus on the effects of CO/H2 and diluent ratios. A comparative analysis is made against methane, considered as the baseline fuel. The in-cylinder pressure and related parameters are examined as indicators of combustion behavior. Additionally, 2D cycle-resolved digital visualization is employed to trace flame front propagation. Custom image processing techniques are applied to estimate flame speed, displacement, and morphological parameters. The engine runs at a constant speed (900 rpm) and with full throttle like stationary engine applications. The excess air–fuel ratios vary from 1.0 to 1.4 by adjusting the injection time and the spark timing according to the maximum brake torque of the baseline fuel. A thermodynamic analysis revealed notable trends in in-cylinder pressure traces, indicative of differences in combustion evolution and peak pressures among the syngas mixtures and methane. Moreover, the study quantified parameters such as the mass fraction burned, combustion stability (COVIMEP), and fuel conversion efficiency. The analysis provided insights into flame morphology, propagation speed, and distortion under varying conditions, shedding light on the influence of fuel composition and air dilution. Overall, the results contribute to advancing the understanding of syngas combustion behavior in SI engines and hold implications for optimizing engine performance and developing numerical models.
1. Introduction
Depleting fossil fuel reserves and the increase in climate change are the main reasons to seek alternative methods for the more efficient use of energy and the wider application of renewable resources. New policies are addressed to reduce greenhouse gas emissions and increase the use of sustainable fuels from renewable sources, in both transportation and power generation [1]. The concept of sustainability lies in the ability to satisfy the necessities of the present without compromising the resources of the future. In this way, biomass is the fourth most abundant energy source after coal, oil, and natural gas throughout the world, satisfying almost 14% of the total energy demand globally [2]. The present challenge is to produce good quality fuels for engine applications from non-edible biomass resources like agricultural wastes and municipal solid wastes, among others [3].
The use of biomass in engines requires its conversion to liquid or gaseous forms to generate power. This conversion can be achieved via thermochemical [4] or biological processes [5]. In recent years, gasification reached a considerable level of technical development and emerged as a great alternative due to its high conversion efficiency and versatility. Many studies have proved the superiority of gasification over other biomass conversion processes [4,6,7], and its main product is called producer gas or synthesis gas (syngas). The name producer gas is normally given when the gasification agent is air and has a low heating value, while the name syngas is normally given after purifying the fuel fraction of the producer gas or when the gasification produces a gas with a high calorific value [8]. The major components of dry syngas are nitrogen (N2), carbon dioxide (CO2), hydrogen (H2), carbon monoxide (CO), and methane (CH4). Mole fractions of combustible components in dry syngas vary and depend on the feedstock composition, oxidizing agent, and the gasification process: 15 to 40% for CO, 10 to 35% for H2, and 2 to 5% for CH4 [9].
Most gasification plants are relatively small (<5 MW) [10]; at this range, after proper cleaning [11], the use of syngas in internal combustion engines is more economically favorable than gas or steam turbines [12]. Since the specific energy of syngas is lower than conventional fossil fuels, consequently, the engine’s output will be relatively low when syngas is used to feed it [9,13]. To overcome this issue, some methodologies can be applied, such as using superchargers, increasing the compression ratio [9,14], or blending the syngas with other higher-ranked fuels, such as methane [15], hydrogen [16,17], or others [18]. Currently, the primary focus of research on syngas-powered engines is centered around optimizing the engines to the fullest potential and enhancing numerical models [14]. Optically accessible engines provide results that can be used to benefit both endeavors, thereby enabling the development of advanced solutions for the optimization of engines, such as the ones developed by Irimesco [19] or Merola et al. [20], which can be applied in the development of more efficient commercial engines. The authors of this work have shown in recent studies that the addition of methane to syngas will favor the stability of the flame and the conversion efficiency [15], while the addition of hydrogen will improve not only the flame stability but also its emissions [16,21,22]. The addition of hydrogen to syngas also improves the propagation stability of lean operation [21]. However, given the intrinsic variability of syngas composition, understanding its combustion behavior in engines remains essential for developing broader and more advanced solutions.
Starting from these considerations, this study provides results of the behavior of flame propagation using equivalent syngas mixtures under engine-relevant conditions with compositions that were never executed before. Compositions of interest are synthesized and analyzed on a chromatograph to analyze the effect on the combustion process under different CO/H2 ratios and degree of dilution (DOD, defined as the inert components divided by the total sum of the components) proportions; the CH4/H2 ratio was fixed for all cases. The experiments were performed in a port-fuel injection (PFI) spark-ignition (SI) engine equipped with a wide optical access, at fixed crankshaft speed and maximum load, to represent stationary applications. The air–fuel ratio (λ) was changed from stoichiometric to values close to the lean flammability limit of methane (used as baseline fuel). The analysis of the combustion process was conducted through combined thermodynamic and optical investigations. High spatial resolution cycle-resolved digital imaging was used to characterize the flame front propagation using macroscopic and microscopic flame parameters. This work contributes to the further development of numerical models and the calibration of simulation codes. The text is divided explaining the methodology used to obtain the thermodynamic main parameters of the engine as well as the detailed combustion diagnosis with the optical setup. The result in a similar way is divided into thermodynamic and optical results with a final section of the main conclusions.
2. Materials and Methods
2.1. Engine Setup
All tests were performed on an optically accessible single-cylinder PFI-SI engine AVL 5406 (Figure 1a). The cylinder head featured four valves and a spark plug located 7.54 mm from the center of the combustion chamber (Figure 1b). Optical accessibility was provided via an elongated piston with a wide flat quartz window in its crown and a quartz ring replacing the upper part of the cylinder liner. To reduce window contamination with lubricating oil, self-lubricating Teflon-bronze piston rings were used in the optical section. During combustion, the light emitted from the combustion chamber passed through the quartz window and was reflected towards the optical detection assembly via a 45° inclined UV–visible mirror located in the elongated piston, and then recorded with the acquisition system aimed at studying flame front propagation. The optical setup allowed a bottom field of view that corresponded to 78% of the piston diameter and 61% of the piston area (Figure 1b). The crankshaft was equipped with a shaft encoder resolving 3600 increments per revolution. An ETU 427 engine-timing unit was employed for ignition and injection control, as well as for the provision of synchronized triggering for image acquisition and recording in-cylinder pressure data. Further details of the engine specifications are shown in Table 1.
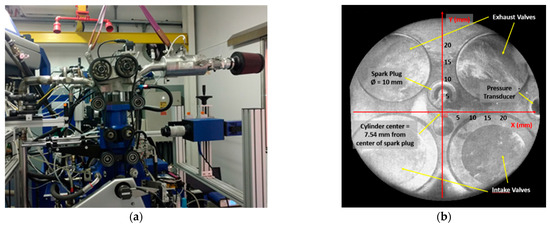
Figure 1.
Experimental setup. (a) Single-cylinder research engine and the optical experimental arrangement; (b) cylinder head bottom view from inclined mirror located below the piston.

Table 1.
Specifications of the PFI SI single-cylinder research engine.
The experiments were performed at a fixed 900 rpm crankshaft rotational speed and wide-open throttle, as a representative point of electric power generation applications, with the engine operated at full load for extensive periods. All timings given in CAD refer to ‘Crank Angle Degree’, with 1 CAD corresponding to 0.185 ms at a speed of 900 rpm used throughout this study. In this work, the PFI setup was used, being the most representative choice for SI engines with gaseous fueling. Three equivalent syngas mixtures were tested, using methane as the baseline fuel. Fuel composition (Table 2) was changed to analyze the effect on the combustion process under different CO/H2 ratios (0.5 and 2.0) and dilution proportions (0.4 and 0.6); the CH4/H2 ratio was fixed (0.5) for all cases. Table 3 shows the main properties of the blends used in this study. The gas filling system consists of individual cylinders of pure gases, i.e., CH4 (99.5%), H2 (99.9%), CO (99.9%), CO2 (99.9%), and N2 (99.9%). The mixture, stored in the 20-liter-volume auxiliary cylinder, is obtained with the partial pressure method of the pure gases and then fed to the PFI injector at 6 bar gauge pressure. A Perkin Elmer Clarus 580 gas chromatograph was used for verifying mixture compositions after preparation.

Table 2.
Fuel composition in percentage of total volume and ratio between components.

Table 3.
Main parameters of the engine test.
The air–fuel ratio was initially set at a stoichiometric value and then increased until reaching the flammability limit of methane (λ = 1.4). The air dilution was measured using a wide-band exhaust gas oxygen sensor, with an accuracy of ±1%. The injection pressure was maintained at 7 bar for all conditions, as the rated pressure for the Bosch ML082G injector was designed to operate with gaseous fuels in a port-fuel configuration. Coolant and lubricant temperatures were maintained at 330 K using a thermal conditioning unit; the intake air temperature was in the range of 300 K and the ambient pressure was around 1 atm.
The spark advance (SA) was fixed at 7 CAD BTDC, which corresponded to the maximum brake torque (MBT) of methane in stoichiometric conditions. The same SA allowed for the analysis of flame propagation and combustion behavior at roughly the same fluid dynamics conditions [20]. For each engine operational condition, tests were performed according to a procedure of 1 min of warm-up in motored mode, followed by firing until a stable lambda (λ), around 15 s; after this, 200 consecutive cycles were recorded. In-cylinder pressure was measured with an accuracy of ±1% using a quartz pressure transducer flush-installed in the region between the intake and exhaust valves and a crank angle resolution was 0.1 CAD. Based on these data, the rate of heat release and related parameters were evaluated. Optical data were detected in the last 25 cycles of the sets of 200 to retrieve information from more stable combustion conditions. Pressure values, as well as the image sequences, were related to piston movement by triggering the data acquisition system in gated mode. A summary of the main parameters can be found in Table 3.
2.2. Thermodynamic Analysis
A heat release analysis was performed with the first law of thermodynamics using Equation (1),
where Q is the net heat released measured in (J), p is the pressure in (Pa), V is the cylinder volume in (m3), m is the gas mass contained within the combustion chamber in (kg), M is the molar mass in (kg/kmol), and the ratio of specific heats γ was calculated for each crank angle step. More details on how this procedure was applied can be found in [23]. Mass fraction burned (MFB) was calculated based on the integral heat release via Equation (2),
where the subscript ‘k’ means the position (CAD) during the combustion process, ‘ign’ denotes the initiation of combustion (ignition), and ‘EOC’ is the end of combustion that was considered equal to exhaust valve opening (EVO). The combustion process in SI engines can be divided into four main stages: spark and flame initiation, initial flame kernel development, turbulent flame propagation, and flame termination. This process can be quantified with the MFB curve, in which the CA corresponds to 0–10%, MFB is the flame development angle, 10–90% MFB corresponds to the rapid burning angle, and 0–90% MFB is the overall duration of the process. Combustion stability is represented by the cyclic variability derived from pressure data (COVIMEP).
Lastly, the fuel conversion efficiency was calculated using Equation (3),
where is the fuel conversion efficiency, the indicated mean effective pressure (IMEP) was calculated based on recorded in-cylinder pressure curves (in Pa), (in m3) corresponds to the displacement volume, and LHV is the lower heating value (in J/kg); the mass of fuel injected per cycle is (measured in kg, with an accuracy of ±1%).
2.3. Optical Setup
Flame front propagation was investigated using cycle-resolved digital imaging. A high-speed 12-bit CMOS (PCO Dimax S1) camera was coupled with a double intensifier (Video Scope VS4-1845HS), (Excelitas Technologies Corp., Waltham, MA, USA). The assembly allowed a high sensitivity in the spectral range from 290 nm to 700 nm, with 50% quantum efficiency at 450 nm. The camera could work in a full-chip configuration (1008 × 1008 pixels) with a maximum frame rate of 4467 fps. To improve the acquisition speed, a region of interest of 864 × 896 pixels was selected; this permitted it to reach a frame rate of 5400 fps, corresponding to 1 image/CAD at 900 rpm (1 CAD = 185 µs). The detection system was equipped with a UV-Nikkon 105 mm f/4.5 lens. To improve the signal-to-noise ratio, the level of intensification was increased by 30% at an increasing λ value. Moreover, the f/stop of the objective was maintained at f/11 for methane and f/4.5 for all the tests on syngas fuels. The optical setup allowed for the detection of image sequences with a spatial resolution of 91 µm/pixel. For all the optical measurements, the synchronization between the cameras and the engine was achieved through the crank angle encoder signal and the delay unit. The detection of the spark arc denotes the start of combustion. This moment will be named the start of spark. The camera images are referenced to this moment through the angle after the start of spark (ASOS). This instant is after the spark advance angle and the differences are due to the signal delay.
The application of a custom procedure of image processing allowed for a detailed analysis of flame morphology [24,25]. Specifically, using a routine developed in Vision of National Instruments (Vision Assistant 2016, NI ACADEMIC SITE LICENSE, Austin, TX, USA), CMOS 8-bit images were treated to retrieve the geometrical parameters of the flame front. Following the procedure sketched in Figure 2, after the extraction of the intensity level, a circular mask was fixed to cut light from reflections at the boundaries of the optical access (Figure 2a). Successively, the image processing procedure adjusted the contrast and brightness of the images with respect to the maximum intensity value in order to optimize the signal-to-noise ratio (Figure 2b). Then, a threshold was applied to obtain binary images, with 1 (white) associated with a pixel belonging to the object (foreground) and 0 (black) referring to the background (Figure 2c). In this work, an automatic threshold operation (the metric method) based on a locally adaptive algorithm was used [26]. After this step, morphological transformations were applied to fill holes and remove small objects that were not part of the flame and could bias the evaluation of morphological parameters (Figure 2d). Finally, the outline border of the flame was extracted (Figure 2e). More details on the procedure are given in [24].
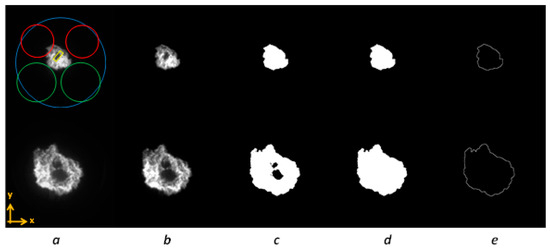
Figure 2.
Image processing stages: intensity extraction (a), contrast adjustment (b), binary image generation via thresholding (c), morphological transformations (d), and flame outline extraction (e); for reference intake and exhaust valves are depicted schematically by red and green lines respectively, while the cylinder bore is illustrated in blue.
The image processing sequence also estimated the clamp distances (Dx and Dy) and the flame centroid coordinates, both in the x and y directions. The maximum clamp of the flame front represented the distance between the furthest opposed points on the edge found in the image along the horizontal (x) and vertical (y) directions. For a circle, these two parameters would be equal; therefore, their ratio intrinsically allowed for the retrieval of information on the flame front distortion. Moreover, the average value between Dx and Dy was considered representative of the mean flame diameter (Dm). The flame speed was calculated as the incremental ratio between two frames of Dm with respect to the dwell time. The flame centroid was the arithmetical center of luminosity evaluated for a binary image. It was identified using the x and y coordinates with respect to the Cartesian system fixed in the center of the combustion chamber.
2.4. Data Acquisition and Experimental Errors
All instruments used in this analysis were calibrated according to the manufacturer’s recommendations to ensure their nominal accuracy. AVL Indiset/indicom was used for the data acquisition. The data were processed using the MATLAB v2024b. Table 4 summarizes the most important measured parameters and their uncertainty.

Table 4.
Experimental errors and uncertainty.
3. Results
3.1. Combustion Diagnosis
Thermodynamic Results
This preliminary analysis of the combustion process was performed through the thermodynamic approach. The in-cylinder pressure was analyzed as average traces of 200 consecutive cycles for each case; the results are reported in Figure 3. The motored pressure signal (dashed line) is also shown as the reference; the pressure levels are slightly higher during compression with respect to the fired operation, given that the working fluid contained only air.
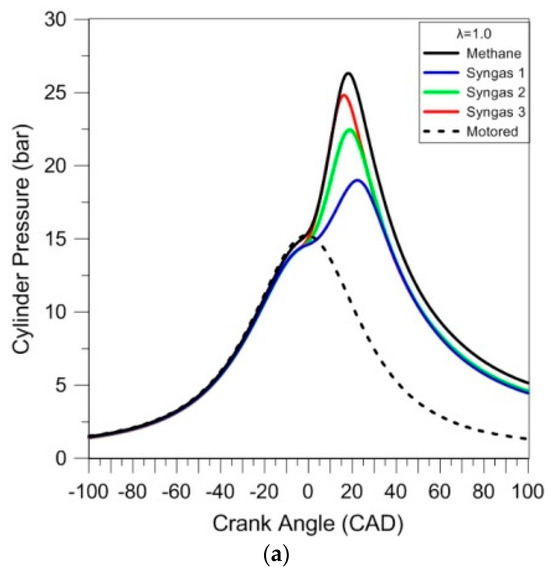
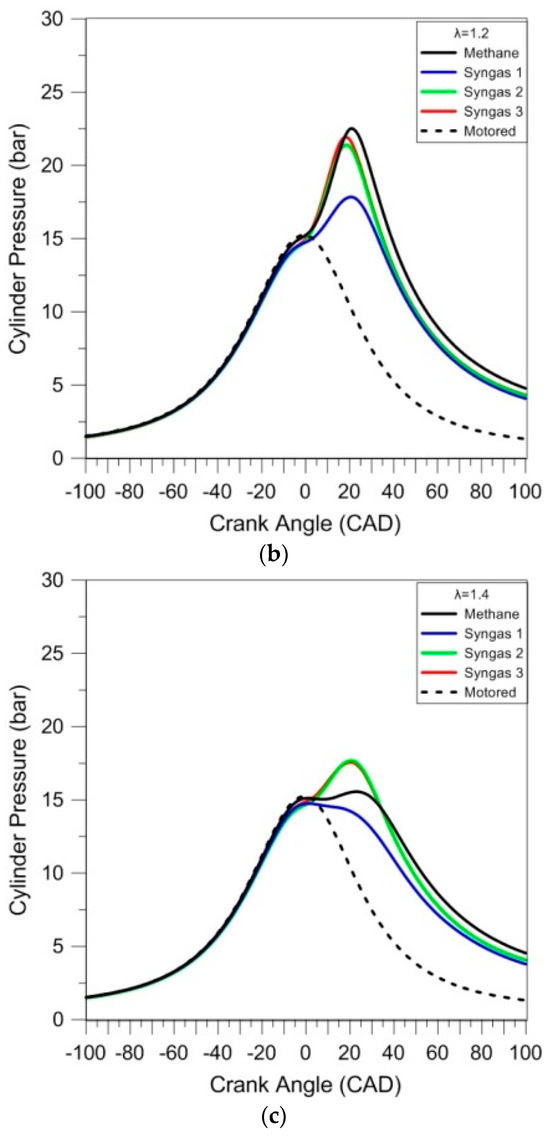
Figure 3.
In-cylinder pressure traces averaged over 200 consecutive cycles for different air–fuel ratios (λ = 1.0 (a), λ = 1.2 (b), and λ = 1.4 (c)).
Due to its large content of inert species, syngas 1 resulted in the ‘slowest’ combustion evolution, and related lowest peak pressure, for the stoichiometric cases. Syngases 2 and 3 featured intermediate pressure evolutions, with methane having the highest peak pressure.
Given the catalytic effect of hydrogen on CO combustion, even in small concentrations [27], it is expected that syngas 2 would feature a high laminar flame speed; on the other hand, the complex effect of diluents on chemical reaction rates [28] resulted in ‘slower’ oxidation compared to syngas 3 and even more so for syngas 1. An interesting observation is that syngas 3’s stoichiometric combustion speed was very close to that of methane, judging from the similar pressure rise rate. Its lower peak pressure is directly related to lower volumetric efficiency (i.e., below 60%, compared to around 78% for methane), mainly due to the presence of CO2 and N2 in its composition. This effect can also be observed in the maximum pressure at the top dead center, given that the pressure of the mixture with methane is closer to the motored cycle, while the others are lower. When looking at the lean cases, differences between methane, syngas 2, and 3 were less evident with λ = 1.2; for λ = 1.4, the ‘classical’ fuel resulted even slower than the other two. Syngas 1 featured the lowest pressure peak for all cases, most likely due to its high content of inert gases.
The overall engine output was reduced when switching from methane to syngas (Figure 4); all fuel types featured an increasing trend of cycle-to-cycle variations (Figure 5) when lean fueling was employed; this was to be expected, given that high dilution rates are characterized by increased combustion instability [29].
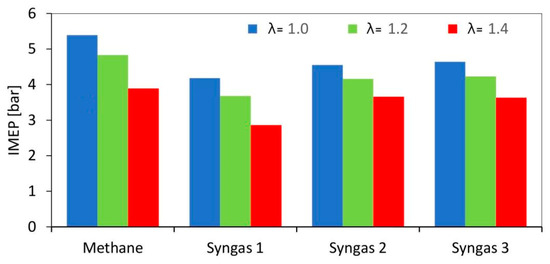
Figure 4.
IMEP evaluated as average on 200 consecutive engine cycles for different air–fuel ratios.
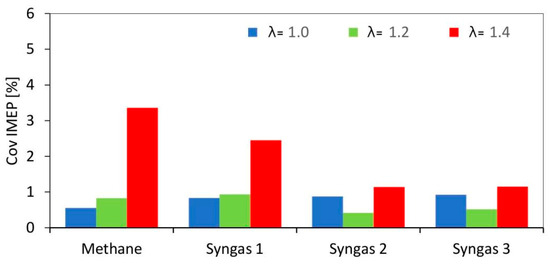
Figure 5.
CovIMEP evaluated on 200 consecutive engine cycles for different air–fuel ratios.
An interesting observation is that for the ‘leanest’ cases, syngas generally resulted in lower CovIMEP. This is most likely related to the presence of hydrogen in its composition, a component that is known to ensure better combustion stability when approaching the flammability limit [30].
The observed trends are also reflected in the crank angle durations calculated (Table 5) at given mass fraction burned levels (i.e., 5%, 10%, and 50%, as representative of the kernel stage and flame propagation phase). On average, for the three lambdas tested, syngas 3 showed a faster combustion process with 12.0, 14.6, and 29.6 (CAD) for MFB 5%, MFB 10%, and MFB 50%, respectively. After syngas 3, syngas 2 had an average of 0.8 CAD later than the MFB mentioned, and methane with 2.4 CAD later. The lowest burn rate was for syngas 1 with 4.6 CAD later on average. Despite syngas 3 having the lowest hydrogen concentration of the syngas mixtures, have the highest CO/H2 ratio (2.0 against 0.5), and together with syngas 1 the lowest DOD in the fuel mixture.

Table 5.
CAD displacement from spark to fixed mass fraction burned (MFB) thresholds.
Another interesting result from Table 5 is that methane suffers the highest difference in MFB when the lambda (λ) increases. On average for methane, the MFB between λ = 1.0 and λ = 1.2 increases by 15%, and the MFB between λ = 1.0 and λ = 1.4 increases by 55%. For the syngas, this increase is lower than for methane due to the presence of hydrogen. This can be seen in the increase in MFB between the different syngas mixtures. The increases for syngas 1 and syngas 2 are almost negligible between λ = 1.0 and λ = 1.2, and 20% between λ = 1.0 and λ = 1.4. In the case of syngas 3, the effect is larger than the other two syngases, with 12% from λ = 1.0 to λ = 1.2 and 36% from λ = 1.0 to λ = 1.4. Despite syngas 3 having the fastest combustion, this mixture has the lowest hydrogen content of the three syngases. This allows for the highlighting of the fact that the CO/H2 content is important for the combustion speed, but the total hydrogen content helps to prevent variation when the mixture is diluted with air.
These results emphasize the much stronger effect of the air–fuel ratio on methane combustion compared to syngas, especially in the kernel development phase. They also give an insight into re-calibration procedures that can be considered for adapting ignition settings for alternative fuels [31] and feedback strategies for real-time engine control. Nonetheless, as an initial evaluation, even the ‘feed-in and start’ scenario ensures acceptable engine operations in a relatively wide range of air–fuel ratios.
The fact that power de-rating is due to reduced volumetric efficiency when using syngas is more evident when looking at the fuel conversion efficiency data (Figure 6). Overall, efficiency levels were found to be around 20%; even though not directly comparable to figures usually found in the literature (given that optical engines feature increased blow-by losses and are generally employed at part load to reduce mechanical stress on their components [32]), the relative trend provides a useful insight into combustion behavior, with the investigated fuel compositions. One significant factor contributing to the observed lower efficiency is the presence of heat losses through the transparent windows required for optical access. These losses, stemming from the transmission of radiant heat through the windows, represent a considerable portion of the total energy input. As a result, the effective energy available for combustion and subsequent work output is diminished, leading to a reduction in fuel conversion efficiency. Furthermore, the presence of crevices within the engine geometry poses a significant challenge to achieving complete combustion. Crevices create regions where air–fuel mixture combustion is inhibited, resulting in unburned hydrocarbons and reduced mass fraction burned. In an optical engine setup, where combustion processes are scrutinized at a detailed level, the impact of crevices on combustion efficiency becomes more pronounced. Moreover, the constraints imposed by optical access often necessitate compromises in engine design, particularly regarding compression ratio optimization. The need to accommodate optical windows and maintain adequate clearance for visualization can limit the achievable compression ratio, thereby affecting overall engine efficiency. It is crucial to underscore that while the observed fuel conversion efficiency in Figure 6 may appear low compared to conventional engine setups, it reflects the intricacies and challenges specific to optical engine studies.
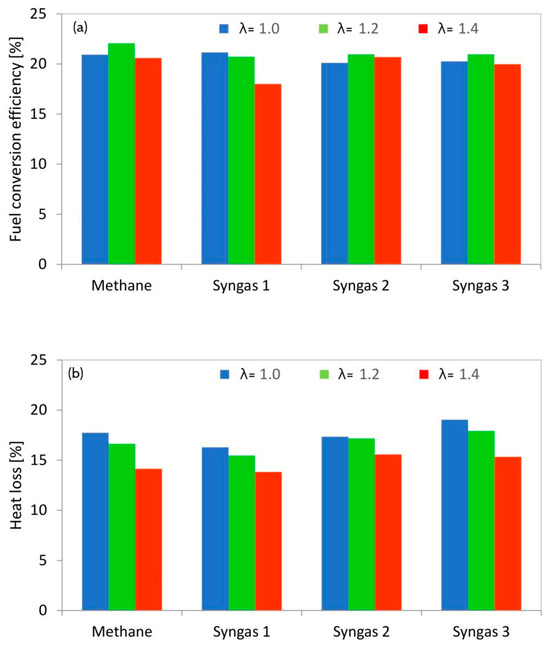
Figure 6.
Fuel conversion efficiency (a) and heat loss (b) for all the selected conditions and fuels.
The only significant drop in efficiency was recorded for the λ = 1.4 case with syngas 1; this condition was found to have a relatively high CovIMEP as well, thus confirming that the increased levels of inert gases resulted in poor combustion development. No evaluation of combustion efficiency could be performed, but based on the readings of the λ sensor, oxygen utilization was close to maximum levels for all cases. Therefore, the most likely explanation is that CH4 and intermediate CO oxidation could not be completed during the power stroke, due to low temperatures reached within the reaction zone; again, this was due to the relatively high concentrations of CO2 and N2 in the fuel mix. Another important observation is that the actual power de-rating originated from decreasing volumetric efficiency and is less related to poor combustion performance. This suggests that turbo-charged applications (which are the majority of cases in stationary applications over a certain level [33]) would be more suited for syngas fueling, given that the drop in volumetric efficiency can be compensated for with increased boosting pressure; on the other hand, higher overall in-cylinder pressure negatively impacts laminar flame speed, thus reducing combustion speed [34]. Another option is to increase the compression ratio. Due to the presence of diluents and high-octane fuels like methane and hydrogen, it would be possible to increase the CR without knocking. This will directly increase the brake thermal efficiency and power output of the engine.
With the more detailed approach that entails modeling blow-by and heat transfer losses [35], it was possible to identify the contribution of convective heat transfer to overall engine performance. As expected, the highest heat loss ratio (calculated as the integral heat loss divided by the fuel’s energy content) was recorded for stoichiometric operation, mainly due to high burned gas temperature. Syngas 3 featured the peak heat loss value overall; this was due to its ‘fast’ combustion, included in the model as the effect of flame expansion. As expected, the lowest ratios were recorded for syngas 1 for all air–fuel settings. Blow-by losses were found to be similar for all conditions at around 10%, evidently higher for the cases with increased peak pressure. This analysis gives an idea into the effects of each fuel type (e.g., for syngas 1, the main reason for reduced engine output was combustion phasing rather than heat losses) and also provides a basis for a comparison with real-world applications, for which blow-by losses are relatively insignificant [36].
3.2. Optical Results
Even if the in-cylinder pressure measurements allow a comprehensive analysis of combustion characteristics, they do not furnish detailed results of the local distribution of the burned mass, flame behavior inside the combustion chamber, and the speed of flame propagation. In this sense, cycle-resolved visualization represents a powerful tool for the quantitative analysis of flame front propagation.
Figure 7 and Figure 8 show selections of images detected during an engine cycle in stoichiometric (λ = 1.0) and lean-burn conditions (λ = 1.4) for all fuels. In all investigated cases, the flame kernel was well developed only around 5–7 CAD after ignition, due to the very high luminosity of spark-induced plasma [37,38], as can be noted in the first frame of each sequence. Upon closer examination, a discernible decrease in luminosity is observed when transitioning from λ = 1.0 to λ = 1.4, indicative of the leaner combustion environment. This reduction in luminosity suggests a corresponding decrease in fuel-rich regions, corroborating the shift towards leaner combustion conditions. Furthermore, the propagation speed of the flame front exhibits a notable delay in reaching the optical limit at λ = 1.4 compared to λ = 1.0, manifesting as a slower advancement in the leaner mixture. Specifically, the optical limit is achieved at approximately 22 CAD after ignition for λ = 1.4, in contrast to the shorter duration of approximately 17 CAD for λ = 1.0.
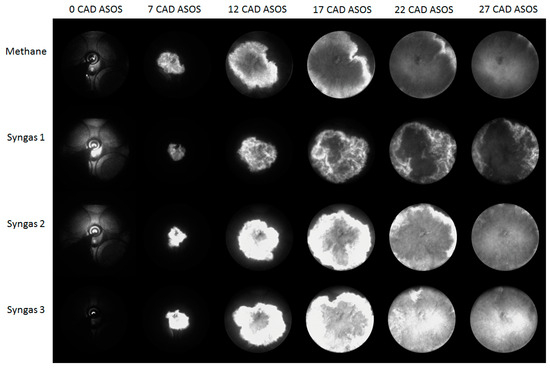
Figure 7.
Images of flame evolution for the stoichiometric air–fuel ratio (λ = 1.0).
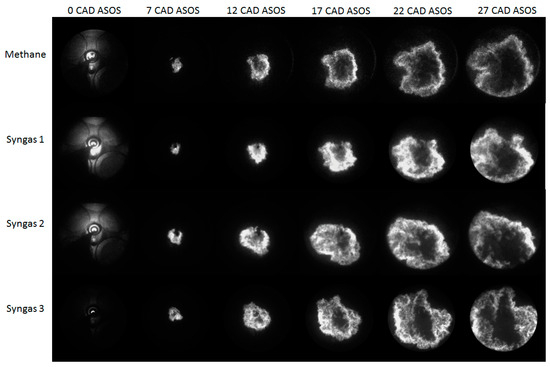
Figure 8.
Images of flame evolution for the leanest air–fuel ratio (λ = 1.4).
An intriguing observation is the variation in luminosity among different fuel compositions, particularly evident in syngas 2 and syngas 3. The heightened luminosity observed in these cases may be attributed to factors such as lower degrees of dilution (DODs) or differing combustion kinetics. Notably, syngas 3 exhibits a pronounced luminosity, possibly attributed to its elevated CO/H2 ratio, which promotes faster combustion kinetics despite the leaner conditions. This accelerated combustion process in syngas 3 underscores the influence of fuel composition on flame characteristics and highlights the interplay between chemical kinetics and combustion dynamics. In summary, the presented figures encapsulate the dynamic evolution of flame propagation under varying combustion conditions and fuel compositions. The observed trends underscore the intricate interplay between combustion parameters and fuel characteristics, elucidating valuable insights into the combustion dynamics within internal combustion engines.
By applying the image processing previously described, the trends of mean diameter and propagation speed of the flame were obtained. The results reported in Figure 9 are related to the averaged values over 25 consecutive engine cycles. It is quite evident that methane flames were always slower than syngas 3, starting with the initial combustion phase; these findings are in line with the thermodynamic analysis based on in-cylinder pressure evaluation. The effect was due to the lowest concentration of methane with a 0.5 CH4/H2 ratio and medium dilution proportion with respect to the other syngas mixtures. The specific composition determined an improvement in burning speed even without adjusting the spark advance. In this sense, the effects of other syngas compositions (1 and 2) were appreciated only in lean-burn cases. In particular, the flame evolution of syngas 2 resulted quite like methane in stoichiometric conditions and was practically identical to that of syngas 3 for higher air–fuel ratios. The result can be justified via the high hydrogen content in the syngas 2 mixture that induced an active improvement in fuel burning only in higher-dilution conditions, because of the concomitant high methane content. Syngas 1 combustion resulted in the slowest results, except for λ = 1.4 when the hydrogen content balanced the high dilution and burn flammability limit of methane. As a general consideration on the use of syngas mixtures, it is possible to observe that the presence of hydrogen improved the flame propagation, compensating the slowdown effect of dilution through inert gases. These findings are also in line with those of the thermodynamic analysis.
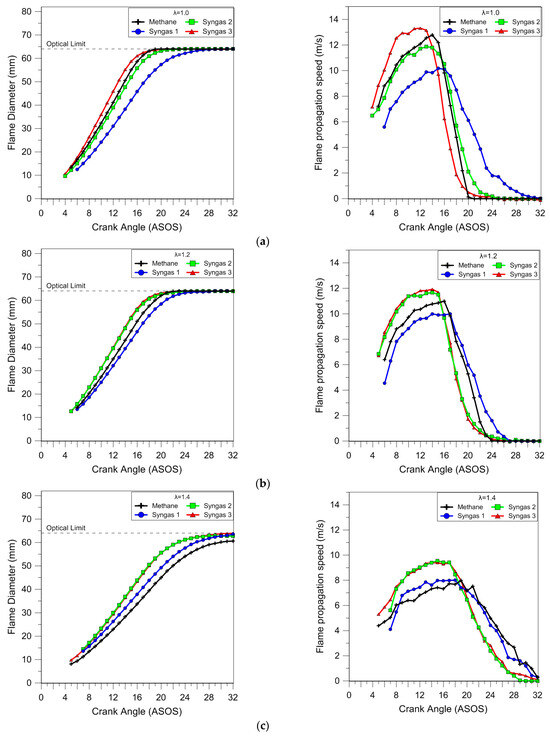
Figure 9.
Evolution of the flame front mean diameter and propagation speed for selected λ values (λ = 1.0 (a), λ = 1.2 (b), and λ = 1.4 (c)) obtained using averaged data over 25 consecutive engine cycles.
To better investigate the effect of fuels on the initial flame propagation, the flame diameter in correspondence with TDC (7 CAD ASOS) and the related coefficient of variation were calculated over 25 consecutive optical acquisitions, as shown in Figure 10. This analysis allowed for an intrinsic evaluation of the cycle-by-cycle variability induced on the flame kernel development via the air–fuel ratio and fuel composition. The largest flame kernel diameter was measured for syngas 3 in each condition, while for the other syngas mixtures, an increase in the flame speed during the initial phase of the combustion process was observed only at high dilution rates. It should be noted that, except for syngases 1 and 2, the kernel size (at a fixed delay) from the spark timing decreased at increasing air–fuel ratios. This was due to the high concentration of diluents and CH4/H2 ratio in the syngas mixtures that inhibited the improvement in the fuel burning speed.
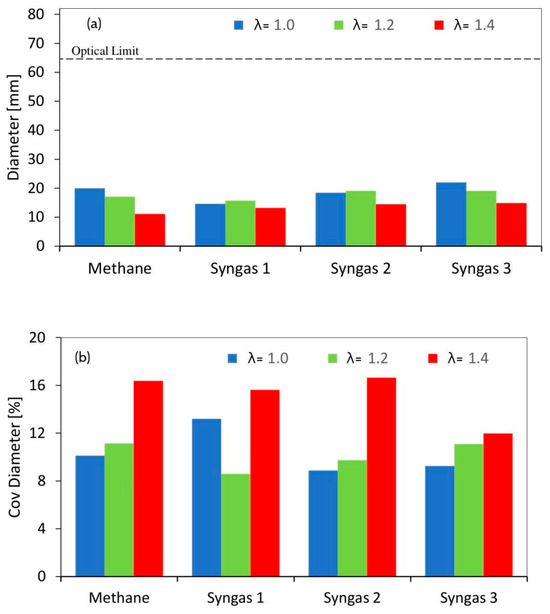
Figure 10.
Flame diameter measured at 5 CAD ATDC (12 CAD ASOS) (a) and the coefficient of variation of the flame diameter (b) obtained using averaged data over 25 consecutive engine cycles.
Regarding the spread of the data, as expected, an increase in the variability of the flame diameter was observed at increasing λ values. The gap of methane with syngas was minimal and the results were significant only for syngas 3, in the leanest burn conditions. This demonstrated better stability for the latter, regarding flame propagation during the early stage of combustion, even without an optimal spark-advance setting. The coefficient of variation related to the flame diameter results was linkable to the COV of in-cylinder peak pressure (CovPmax), as reported in Figure 11, confirming the importance of controlling the stability of combustion, especially during the flame kernel development stage.
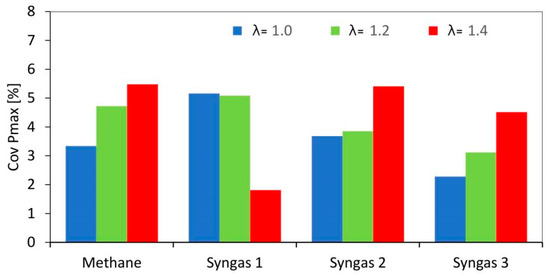
Figure 11.
Coefficient of variation of pressure peak obtained using averaged data over 200 consecutive engine cycles.
The effect of the fuels and air dilution on the flame front shape was evaluated in terms of distortion using the ratio between the maximum clamp distance along the y and x axes. The results reported in Figure 12 clearly demonstrated that during stoichiometric combustion, the flame propagated quite uniformly in all directions, even if the flame front of syngas 1 was less ‘circular’. In lean-burn conditions, the simultaneous action of the flow field and fuel charge distribution determined a strong increase in the flame distortion in the early combustion stages, even if the effect was feeble for syngas 3.
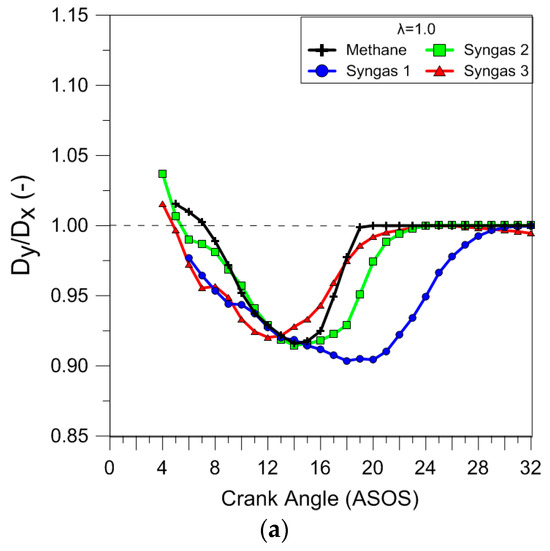
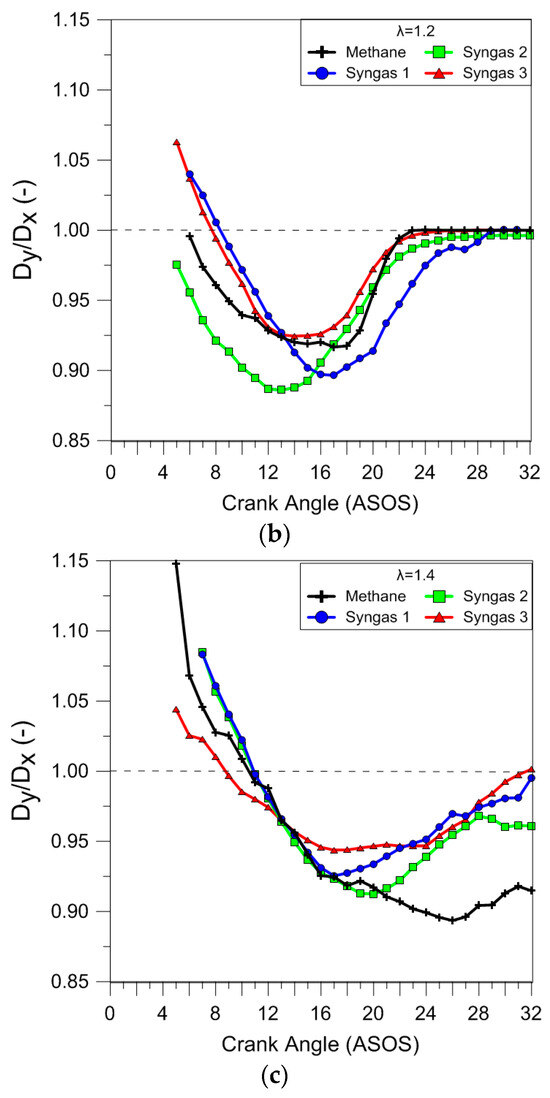
Figure 12.
Ratio between the maximum clamp distance along the y and x axes (λ = 1.0 (a), λ = 1.2 (b), and λ = 1.4 (c)) obtained using average data over 25 consecutive engine cycles.
It is interesting to observe that the air dilution influenced the cyclic variability of the flame front shape in more ways than just the size. In the case of methane, the low burning speed at λ = 1.4 determined a distortion that persisted well into the expansion stroke. These results agree with those obtained using the analysis of the luminous centroid position. Figure 13 shows luminous centroid values measured for 25 engine cycles in correspondence with 5% MFB for all fuels in stoichiometric and lean-burn (λ = 1.4) conditions; the spark plug position is also sketched. It can be noted that for stoichiometric air–fuel ratios, syngas mixtures (syngas 1 could be considered a bit farther) presented a position closer to the combustion center and spark plug, compared to that for methane; moreover, an increase in flame displacement at increasing λ values was observed. Finally, a preferential propagation towards the intake valves was noted in all the cases, because of the flow field (tumble motion) on the flame propagation.
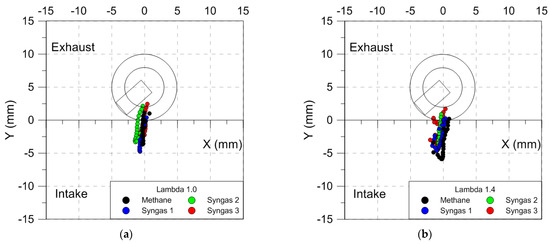
Figure 13.
Evolution of the luminous centroid with respect to the geometrical center of the combustion chamber (λ = 1.0 (a) and λ = 1.4 (b)); each step of the path is obtained using averaged data over 25 consecutive engine cycles.
4. Conclusions
This study provides comprehensive insights into the combustion characteristics of syngas in spark-ignition engines, elucidating the effects of varying CO/H2 ratios and diluent proportions on combustion behavior. An experimental study was undertaken to evaluate the effects of syngas composition on combustion in spark-ignition power units. To this end, an optically accessible engine was run at 900 rpm and wide-open throttle, specific for power generation applications. The experimental findings reveal distinct trends across multiple parameters, shedding light on the intricate interplay between combustion dynamics and fuel composition.
- The analysis of flame propagation dynamics under varying combustion conditions highlights the influence of fuel composition on luminosity and flame advancement. Syngas 3 (highest CO and partially diluted) exhibits accelerated combustion kinetics attributed to its elevated CO/H2 ratio, underscoring the importance of chemical kinetics in determining flame characteristics.
- The examination of the mean diameter and propagation speed of the flame reinforces the influence of fuel composition on combustion dynamics. Syngas 3 consistently demonstrates faster flame propagation compared to methane, indicating the pivotal role of the hydrogen content in enhancing burning speed, particularly under lean conditions.
- Propagation was found to be quite symmetric in all directions, and similar for all fuels, suggesting that fluid motion had the most important effect in this sense. These results were also confirmed through the evolution of flame centroid displacement.
- The investigation into the effect of fuels on initial flame propagation reveals intriguing insights into cycle-by-cycle variability induced via the air–fuel ratio and fuel composition. Syngas 3 consistently exhibits the largest flame kernel diameter across all conditions, emphasizing the impact of fuel composition on flame development.
- The assessment of cyclic variability of the flame front shape underscores the influence of air dilution on flame morphology. Syngas mixtures exhibit a preferential propagation towards intake valves, attributed to flow field dynamics, highlighting the importance of understanding fluid motion in shaping flame behavior.
Overall, these findings underscore the complex interactions between combustion parameters and fuel characteristics, providing valuable insights into optimizing engine performance and efficiency. One major conclusion of the analysis was that spark timing re-calibration is required to fully take advantage of fuel properties such as higher laminar flame speed and increased stability, especially during lean operation. Moving forward, further research efforts should focus on refining combustion strategies and leveraging advanced numerical simulations to enhance engine design and operation in alignment with sustainability goals.
Author Contributions
Conceptualization, S.M.-B.; methodology, S.M.-B., P.T.L. and P.C.-R.; validation, S.M.-B., P.T.L., P.C.-R. and P.T.L.; investigation, S.M.-B., P.T.L. and P.C.-R.; writing—original draft preparation, S.M.-B. and F.S.d.C.; writing—review and editing, S.M.-B., P.C.-R., F.S.d.C. and P.T.L.; supervision, P.T.L. and P.C.-R. All authors have read and agreed to the published version of the manuscript.
Funding
This work was partially funded by the São Paulo State Research Foundation (FAPESP—Brazil) through the projects 2010-51315-3 and 2018/08419-4. The authors offer thanks for the scholarship number 88887.467148/2019.00 provided by CAPES-Brazil to the author F.S.C and the research grant 310917/2021-2 provided by CNPq—Brazilian National Council for Scientific and Technological Development to the author P.T.L.
Data Availability Statement
The data can be shared upon request.
Conflicts of Interest
The authors declare no conflicts of interest.
References
- Agarwal, A.; Pandey, A.; Singh, A. Combustion for Power Generation and Transportation: Technology, Challenges and Prospects; Springer: Singapore, 2017. [Google Scholar]
- Pudasainee, D.; Paur, H.R.; Fleck, S.; Seifert, H. Trace Metals Emission in Syngas from Biomass Gasification. Fuel Process. Technol. 2014, 120, 54–60. [Google Scholar] [CrossRef]
- Plath, M.; Moser, C.; Bailis, R.; Brandt, P.; Hirsch, H.; Klein, A.M.; Walmsley, D.; von Wehrden, H. A Novel Bioenergy Feedstock in Latin America? Cultivation Potential of Acrocomia Aculeata under Current and Future Climate Conditions. Biomass Bioenergy 2016, 91, 186–195. [Google Scholar] [CrossRef]
- Jha, S.; Nanda, S.; Acharya, B.; Dalai, A.K. A Review of Thermochemical Conversion of Waste Biomass to Biofuels. Energies 2022, 15, 6352. [Google Scholar] [CrossRef]
- Kumar, G.; Dharmaraja, J.; Arvindnarayan, S.; Shoban, S.; Bakonyi, P.; Saratale, G.D.; Nemestóthy, N.; Bélafi-Bakó, K.; Yoon, J.J.; Kim, S.H. A Comprehensive Review on Thermochemical, Biological, Biochemical and Hybrid Conversion Methods of Bio-Derived Lignocellulosic Molecules into Renewable Fuels. Fuel 2019, 251, 352–367. [Google Scholar] [CrossRef]
- El-Emam, R.S.; Özcan, H. Comprehensive Review on the Techno-Economics of Sustainable Large-Scale Clean Hydrogen Production. J. Clean. Prod. 2019, 220, 593–609. [Google Scholar] [CrossRef]
- Susastriawan, A.A.P.; Purwanto, Y. Purnomo Biomass Gasifier–Internal Combustion Engine System: Review of Literature. Int. J. Sustain. Eng. 2021, 14, 1090–1100. [Google Scholar] [CrossRef]
- Hagos, F.Y.; Aziz, A.R.A.; Sulaiman, S.A. Trends of Syngas as a Fuel in Internal Combustion Engines. Adv. Mech. Eng. 2014, 6. [Google Scholar] [CrossRef]
- Paykani, A.; Chehrmonavari, H.; Tsolakis, A.; Alger, T.; Northrop, W.F.; Reitz, R.D. Synthesis Gas as a Fuel for Internal Combustion Engines in Transportation. Prog. Energy Combust. Sci. 2022, 90, 100995. [Google Scholar] [CrossRef]
- Sansaniwal, S.K.; Pal, K.; Rosen, M.A.; Tyagi, S.K. Recent Advances in the Development of Biomass Gasification Technology: A Comprehensive Review. Renew. Sustain. Energy Rev. 2017, 72, 363–384. [Google Scholar] [CrossRef]
- Hai, I.U.; Sher, F.; Zarren, G.; Liu, H. Experimental Investigation of Tar Arresting Techniques and Their Evaluation for Product Syngas Cleaning from Bubbling Fluidized Bed Gasifier. J. Clean. Prod. 2019, 240, 118239. [Google Scholar] [CrossRef]
- Basu, P. Biomass Gasification, Pyrolysis and Torrefaction: Practical Design and Theory, 2nd ed.; Elsevier: New York, NY, USA, 2013; ISBN 9780123964885. [Google Scholar]
- Martínez, J.D.; Mahkamov, K.; Andrade, R.V.; Silva Lora, E.E. Syngas Production in Downdraft Biomass Gasifiers and Its Application Using Internal Combustion Engines. Renew. Energy 2012, 38, 1–9. [Google Scholar] [CrossRef]
- Fiore, M.; Magi, V.; Viggiano, A. Internal Combustion Engines Powered by Syngas: A Review. Appl. Energy 2020, 276, 115415. [Google Scholar] [CrossRef]
- Solferini de Carvalho, F.; Peñaranda Mendoza, A.; Ribeiro dos Santos, L.; Henrique Rufino, C.; Malheiro de Oliveira, E.; Ferreira Silva, M.; Blanco Machin, E.; Travieso Pedroso, D.; Teixeira Lacava, P. Experimental Study of the Methane and Producer Gas Blends in an Optical Spark Ignition Engine: Combustion Characteristics, Thermodynamics and Emissions. Int. J. Engine Res. 2022, 24, 2708–2726. [Google Scholar] [CrossRef]
- Solferini, F.; Carvalho, D.; Henrique, C.; Malheiro, E.; Oliveira, D.; Ribeiro, L.; Blanco, E.; Pen, A.; Travieso, D.; Teixeira, P. Experimental Investigation of Hydrogen-Producer Gas Mixtures in an Optically Accessible SI Engine. Int. J. Hydrog. Energy 2024, 58, 500–513. [Google Scholar] [CrossRef]
- Dhole, A.E.; Yarasu, R.B.; Lata, D.B.; Priyam, A. Effect on Performance and Emissions of a Dual Fuel Diesel Engine Using Hydrogen and Producer Gas as Secondary Fuels. Int. J. Hydrogen Energy 2014, 39, 8087–8097. [Google Scholar] [CrossRef]
- Rabello de Castro, R.; Brequigny, P.; Mounaïm-Rousselle, C. A Multiparameter Investigation of Syngas/Diesel Dual-Fuel Engine Performance and Emissions with Various Syngas Compositions. Fuel 2022, 318, 123736. [Google Scholar] [CrossRef]
- Irimescu, A.; Merola, S.; Vaglieco, B. Towards Better Correlation between Optical and Commercial Spark Ignition Engines through Quasi-Dimensional Modeling of Cycle-to-Cycle Variability. Therm. Sci. 2022, 26, 1685–1694. [Google Scholar] [CrossRef]
- Merola, S.S.; Marchitto, L.; Tornatore, C.; Valentino, G.; Irimescu, A. Optical Characterization of Combustion Processes in a DISI Engine Equipped with Plasma-Assisted Ignition System. Appl. Therm. Eng. 2014, 69, 177–187. [Google Scholar] [CrossRef]
- Martinez-Boggio, S.D.; Merola, S.S.; Teixeira Lacava, P.; Irimescu, A.; Curto-Risso, P.L. Effect of Fuel and Air Dilution on Syngas Combustion in an Optical SI Engine. Energies 2019, 12, 1566. [Google Scholar] [CrossRef]
- Martínez-Boggio, S.D.; Curto-Risso, P.L.; Medina, A.; Hernández, A.C. Simulation of Cycle-to-Cycle Variations on Spark Ignition Engines Fueled with Gasoline-Hydrogen Blends. Int. J. Hydrogen Energy 2016, 41, 9087–9099. [Google Scholar] [CrossRef]
- Irimescu, A. Comparison of Combustion Characteristics and Heat Loss for Gasoline and Methane Fueling of a Spark Ignition Engine. Proc. Rom. Acad. Ser. A-Math. Phys. Tech. Sci. Inf. Sci. 2013, 14, 161–168. [Google Scholar]
- Martinez, S.; Irimescu, A.; Merola, S.S.; Lacava, P.; Curto-Riso, P. Flame Front Propagation in an Optical GDI Engine under Stoichiometric and Lean Burn Conditions. Energies 2017, 10, 1337. [Google Scholar] [CrossRef]
- Merola, S.S.; Tornatore, C.; Irimescu, A. Cycle-Resolved Visualization of Pre-Ignition and Abnormal Combustion Phenomena in a GDI Engine. Energy Convers. Manag. 2016, 127, 380–391. [Google Scholar] [CrossRef]
- Parker, J. Algorithms for Image Processing and Computer Vision; John Wiley & Sons: Hoboken, NJ, USA, 2010. [Google Scholar]
- Wu, F.; Kelley, A.P.; Tang, C.; Zhu, D.; Law, C.K. Measurement and Correlation of Laminar Flame Speeds of CO and C2 Hydrocarbons with Hydrogen Addition at Atmospheric and Elevated Pressures. Int. J. Hydrogen Energy 2011, 36, 13171–13180. [Google Scholar] [CrossRef]
- Fu, J.; Deng, B.; Wang, Y.; Yang, J.; Zhang, D.; Xu, Z.; Liu, J. Numerical Study and Correlation Development on Laminar Burning Velocities of N-Butanol, Iso-Octane and Their Blends: Focusing on Diluent and Blend Ratio Effects. Fuel 2014, 124, 102–112. [Google Scholar] [CrossRef]
- Heywood, J.B. Internal Combustion Engine Fundamentals; McGraw-Hill Education: New York, NY, USA, 1988; 930p. [Google Scholar]
- Park, C.; Lee, S.; Kim, C.; Choi, Y. A Comparative Study of Lean Burn and Exhaust Gas Recirculation in an HCNG-Fueled Heavy-Duty Engine. Int. J. Hydrogen Energy 2017, 42, 26094–26101. [Google Scholar] [CrossRef]
- Shivapuji, A.M.; Dasappa, S. Quasi Dimensional Numerical Investigation of Syngas Fuelled Engine Operation: MBT Operation and Parametric Sensitivity Analysis. Appl. Therm. Eng. 2017, 124, 911–928. [Google Scholar] [CrossRef]
- Aleiferis, P.G.; Behringer, M.K. Modulation of Integral Length Scales of Turbulence in an Optical SI Engine by Direct Injection of Gasoline, Iso-Octane, Ethanol and Butanol Fuels. Fuel 2017, 189, 238–259. [Google Scholar] [CrossRef]
- Papagiannakis, R.G.; Zannis, T.C. Thermodynamic Analysis of Combustion and Pollutants Formation in a Wood-Gas Spark-Ignited Heavy-Duty Engine. Int. J. Hydrogen Energy 2013, 38, 12446–12464. [Google Scholar] [CrossRef]
- Zhang, W.; Gou, X.; Kong, W.; Chen, Z. Laminar Flame Speeds of Lean High-Hydrogen Syngas at Normal and Elevated Pressures. Fuel 2016, 181, 958–963. [Google Scholar] [CrossRef]
- Irimescu, A.; Merola, S.S.; Tornatore, C.; Valentino, G. Development of a Semi-Empirical Convective Heat Transfer Correlation Based on Thermodynamic and Optical Measurements in a Spark Ignition Engine. Appl. Energy 2015, 157, 777–788. [Google Scholar] [CrossRef]
- Irimescu, A.; Di Iorio, S.; Merola, S.S.; Sementa, P.; Vaglieco, B.M. Evaluation of Compression Ratio and Blow-by Rates for Spark Ignition Engines Based on in-Cylinder Pressure Trace Analysis. Energy Convers. Manag. 2018, 162, 98–108. [Google Scholar] [CrossRef]
- Irimescu, A.; Merola, S.S.; Tornatore, C.; Valentino, G. Effect of Coolant Temperature on Air–Fuel Mixture Formation and Combustion in an Optical Direct Injection Spark Ignition Engine Fueled with Gasoline and Butanol. J. Energy Inst. 2017, 90, 452–465. [Google Scholar] [CrossRef]
- Merola, S.S.; Tornatore, C.; Irimescu, A.; Marchitto, L.; Valentino, G. Optical Diagnostics of Early Flame Development in a DISI (Direct Injection Spark Ignition) Engine Fueled with n-Butanol and Gasoline. Energy 2016, 108, 50–62. [Google Scholar] [CrossRef]
Disclaimer/Publisher’s Note: The statements, opinions and data contained in all publications are solely those of the individual author(s) and contributor(s) and not of MDPI and/or the editor(s). MDPI and/or the editor(s) disclaim responsibility for any injury to people or property resulting from any ideas, methods, instructions or products referred to in the content. |
© 2024 by the authors. Licensee MDPI, Basel, Switzerland. This article is an open access article distributed under the terms and conditions of the Creative Commons Attribution (CC BY) license (https://creativecommons.org/licenses/by/4.0/).