Effects of Pressurizing Cryogenic Treatments on Physical and Mechanical Properties of Shale Core Samples—An Experimental Study


Abstract
:
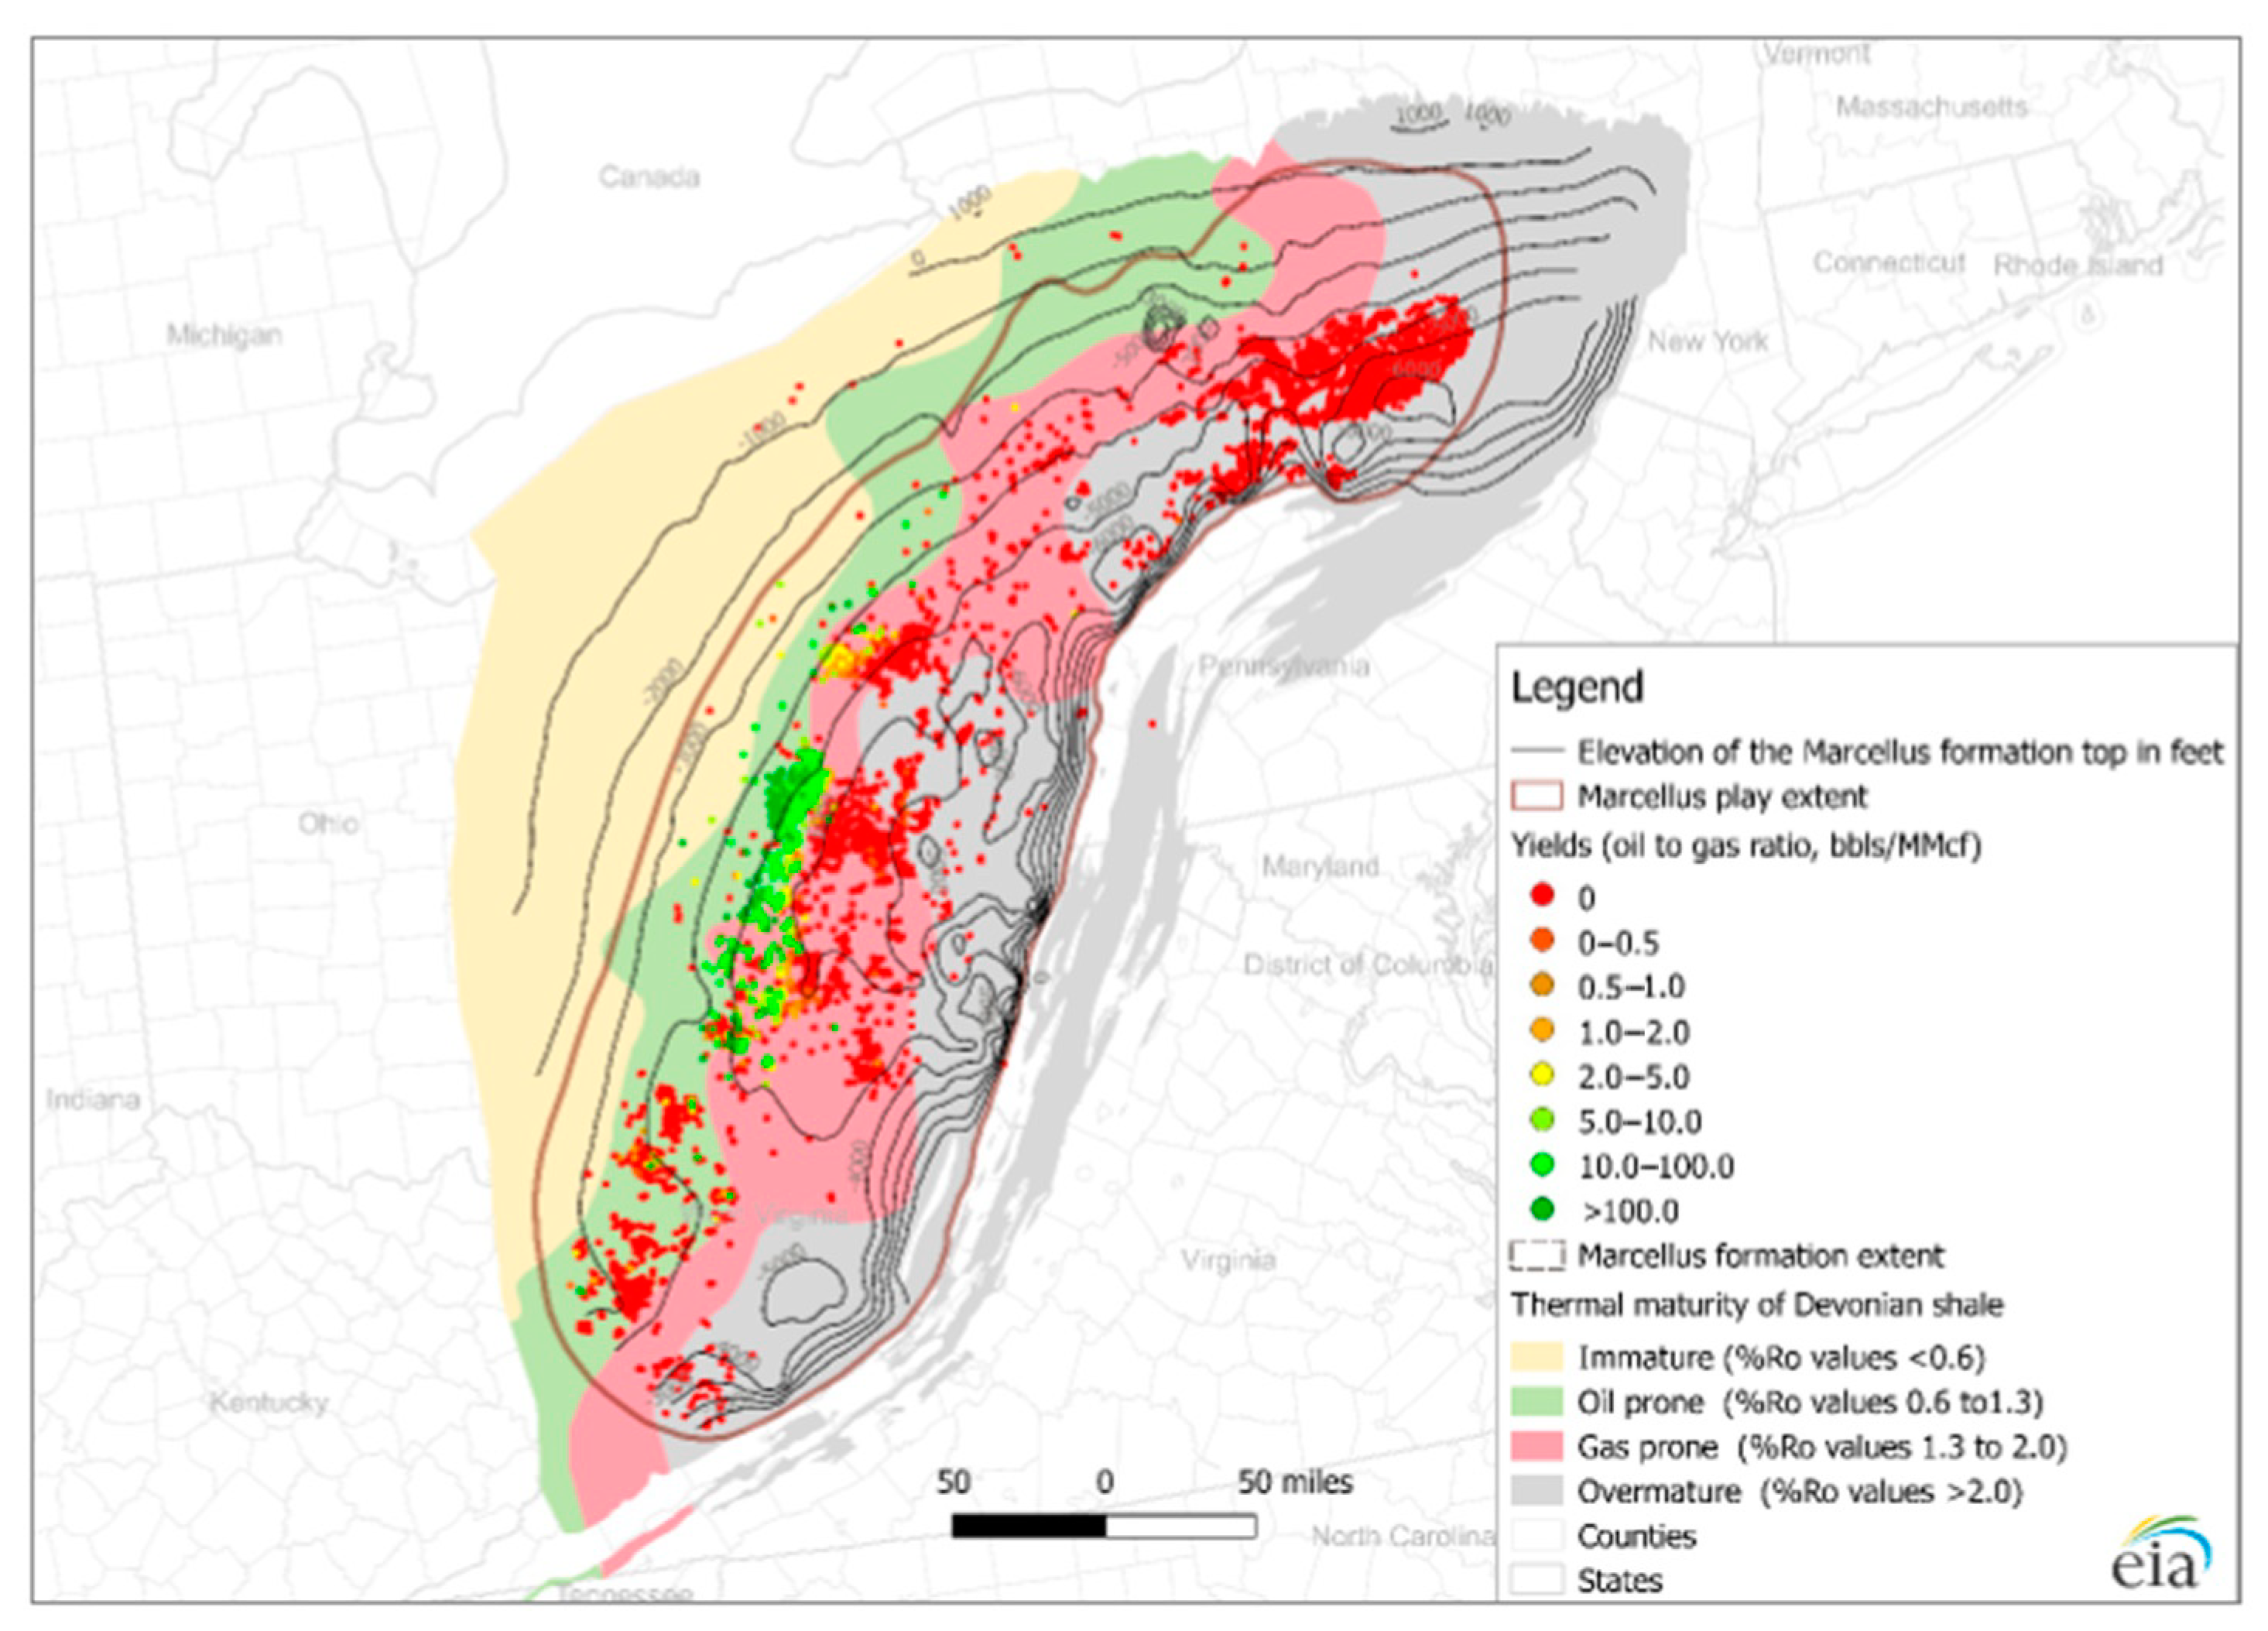
1. Introduction
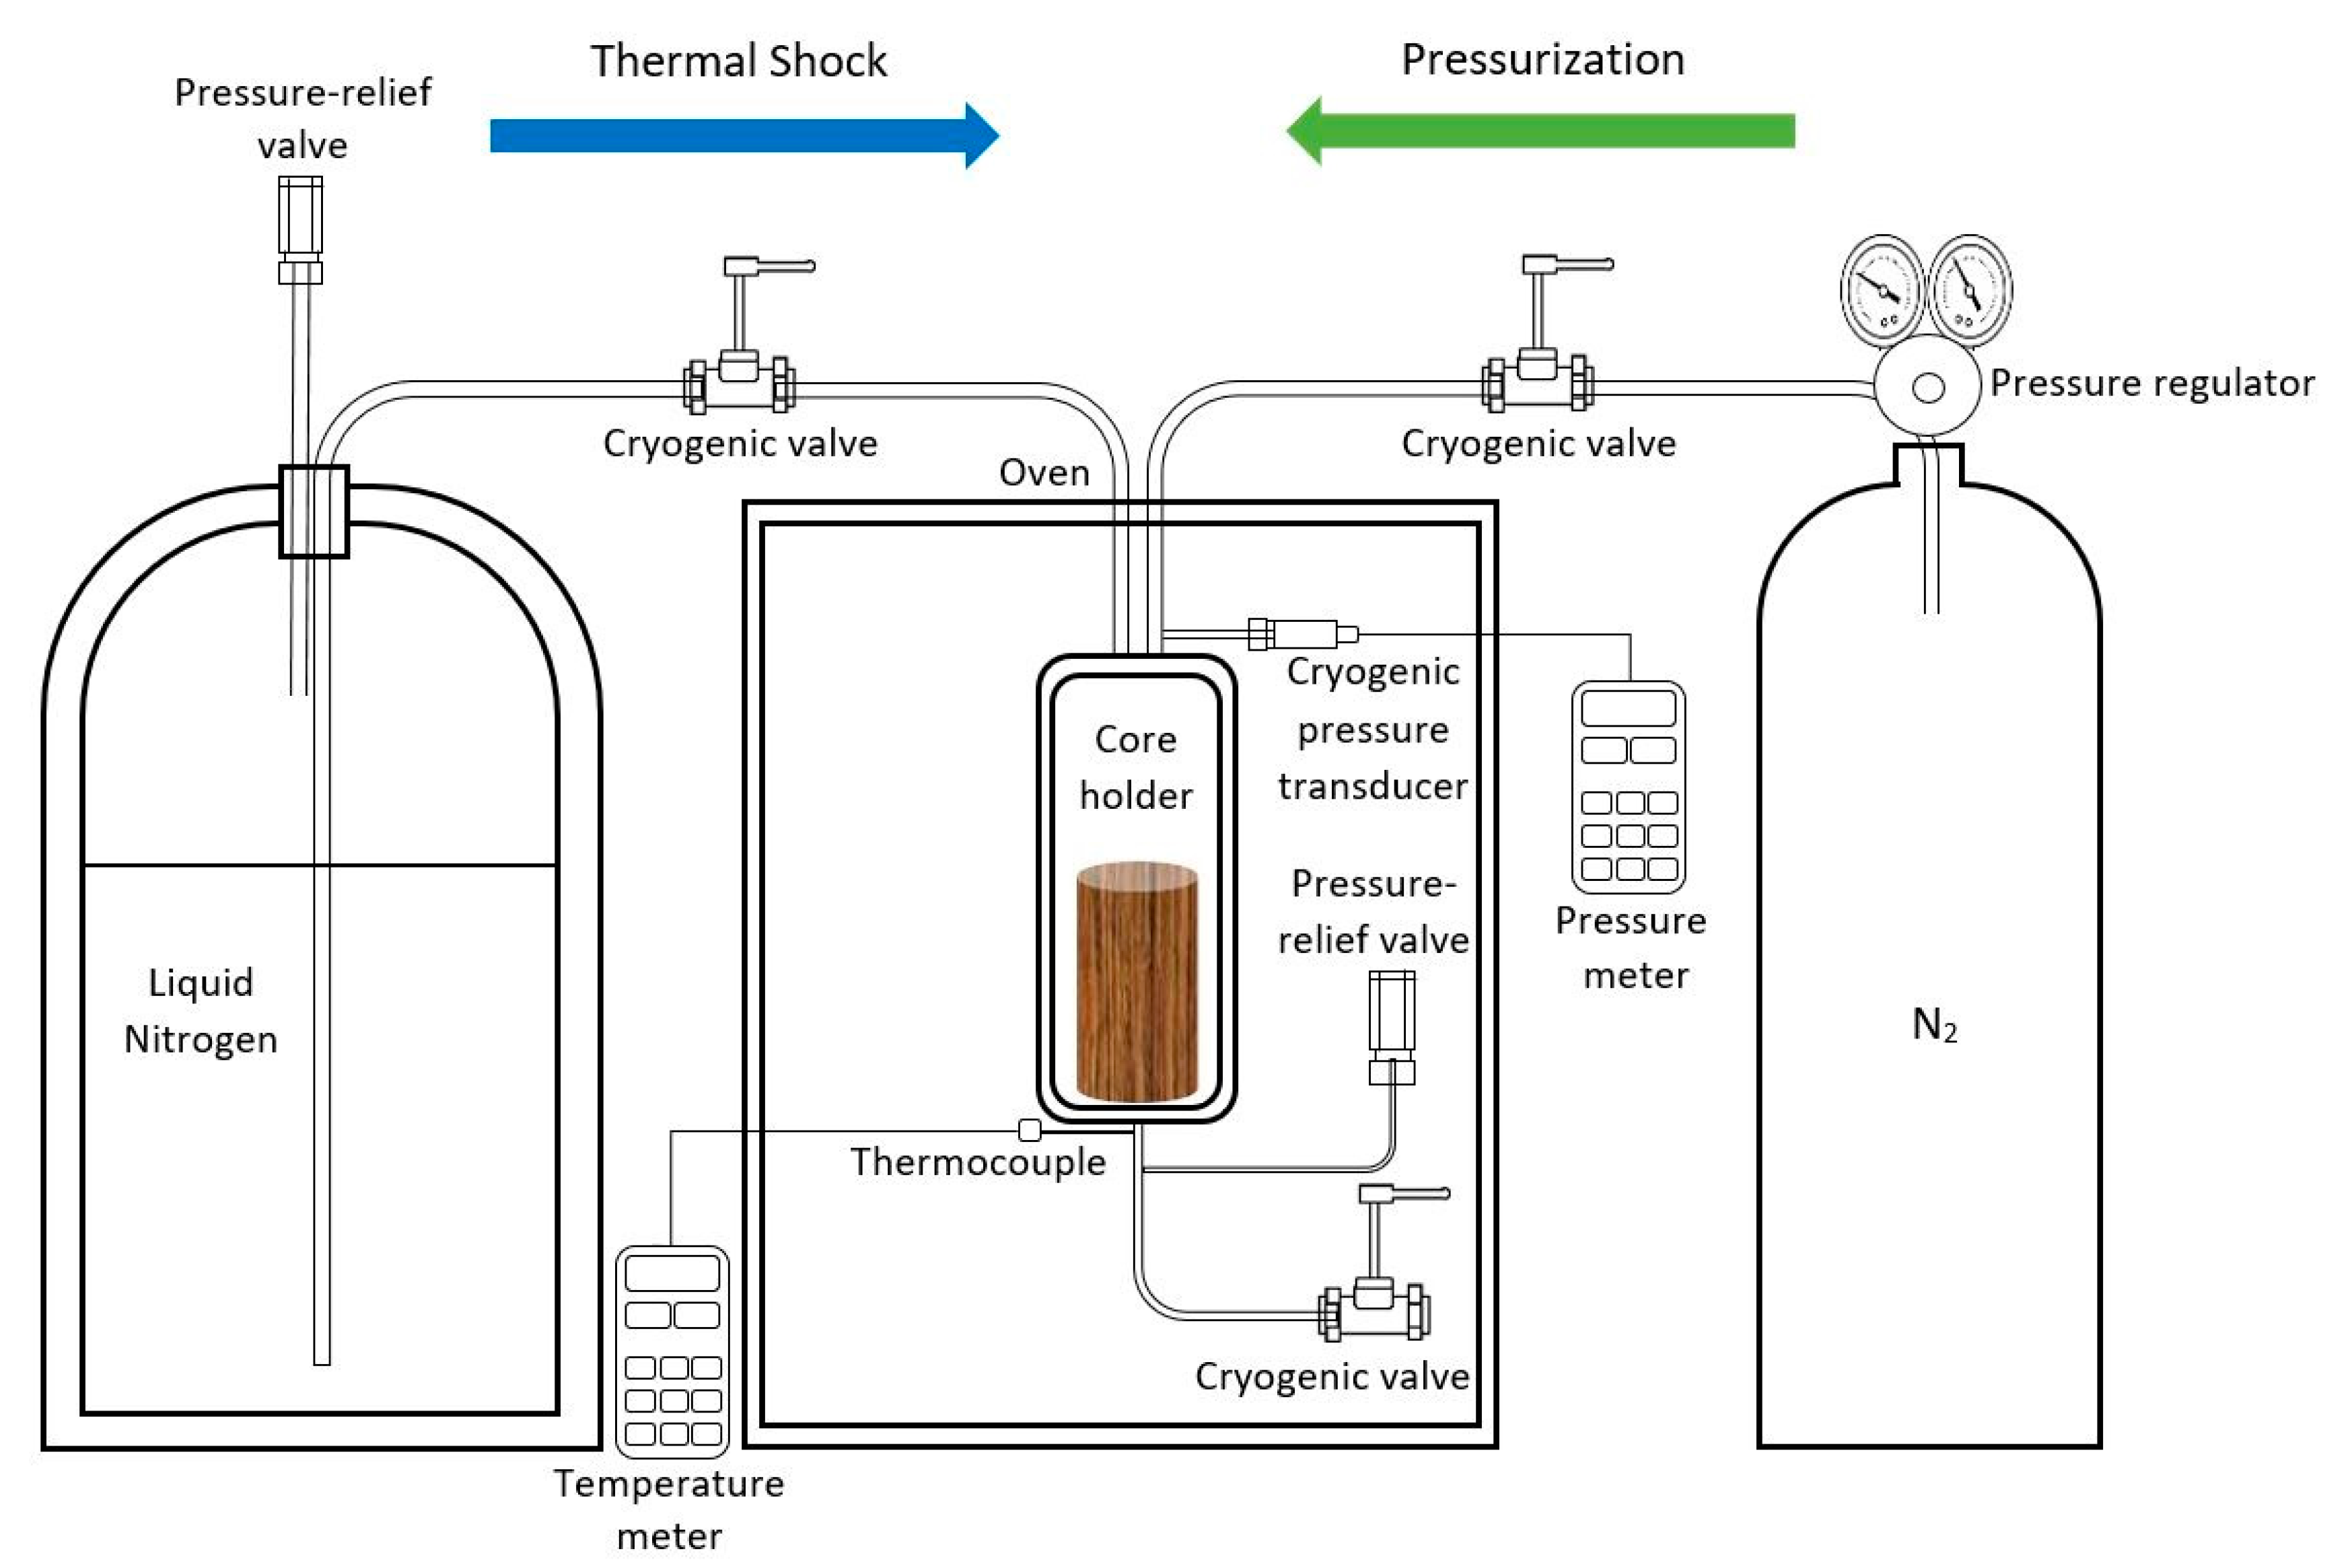
2. Materials and Methods
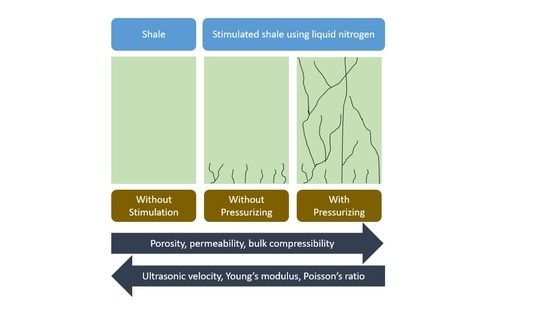
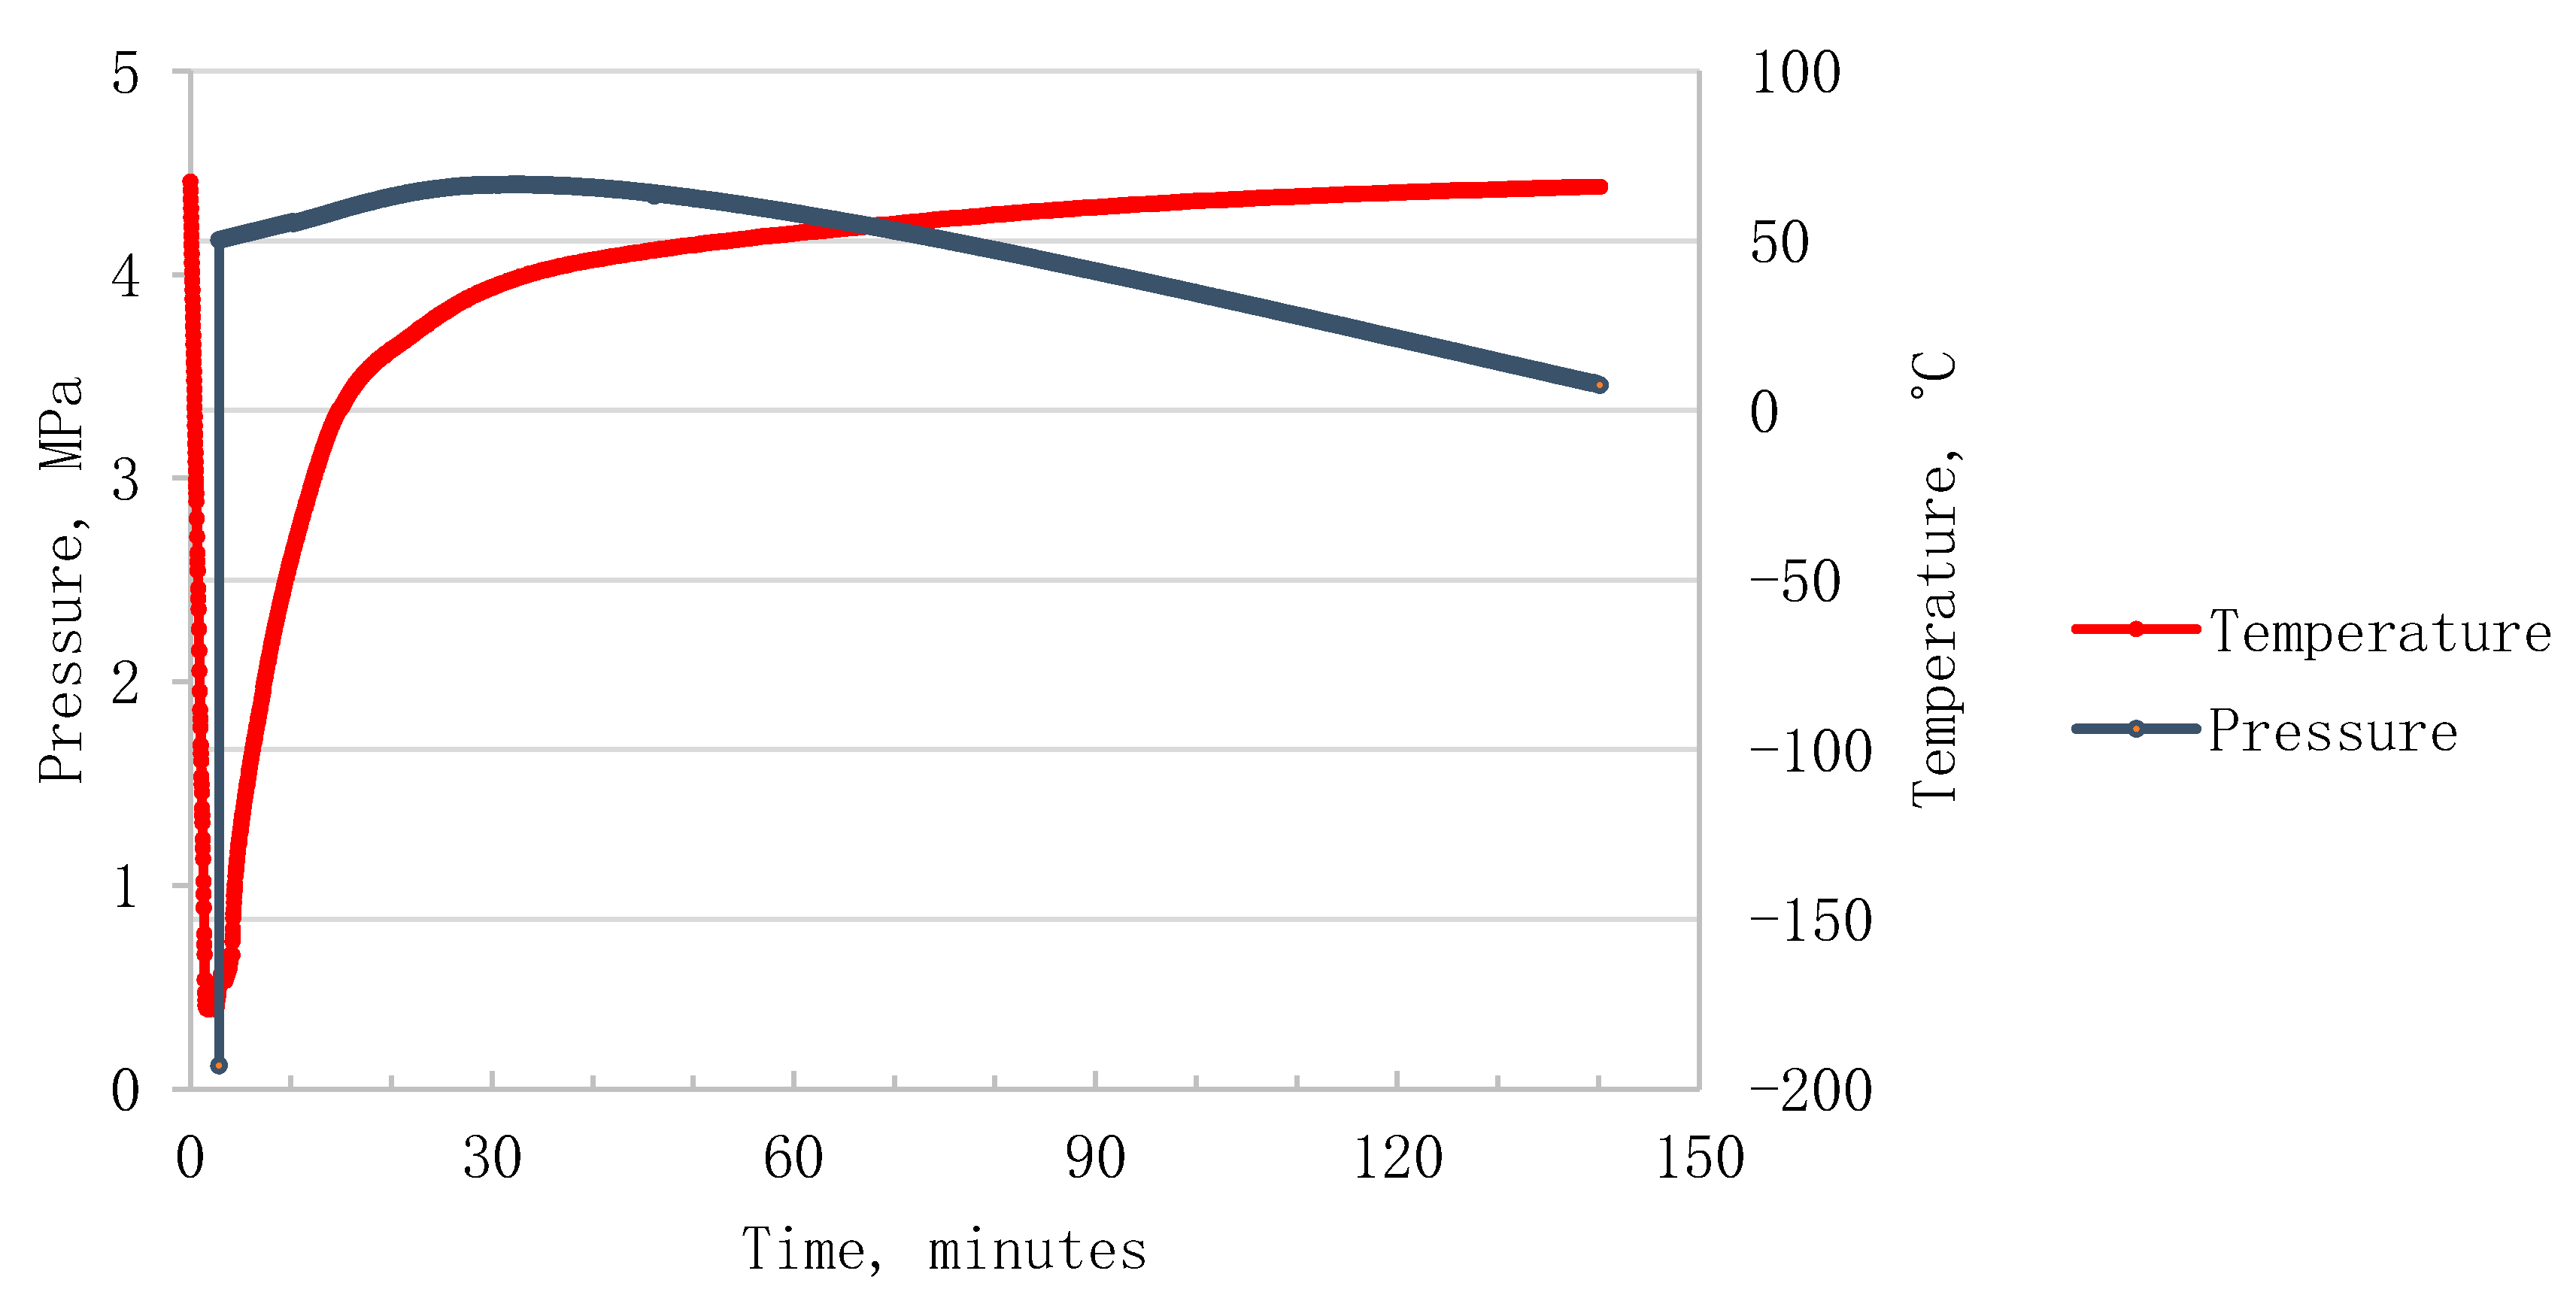
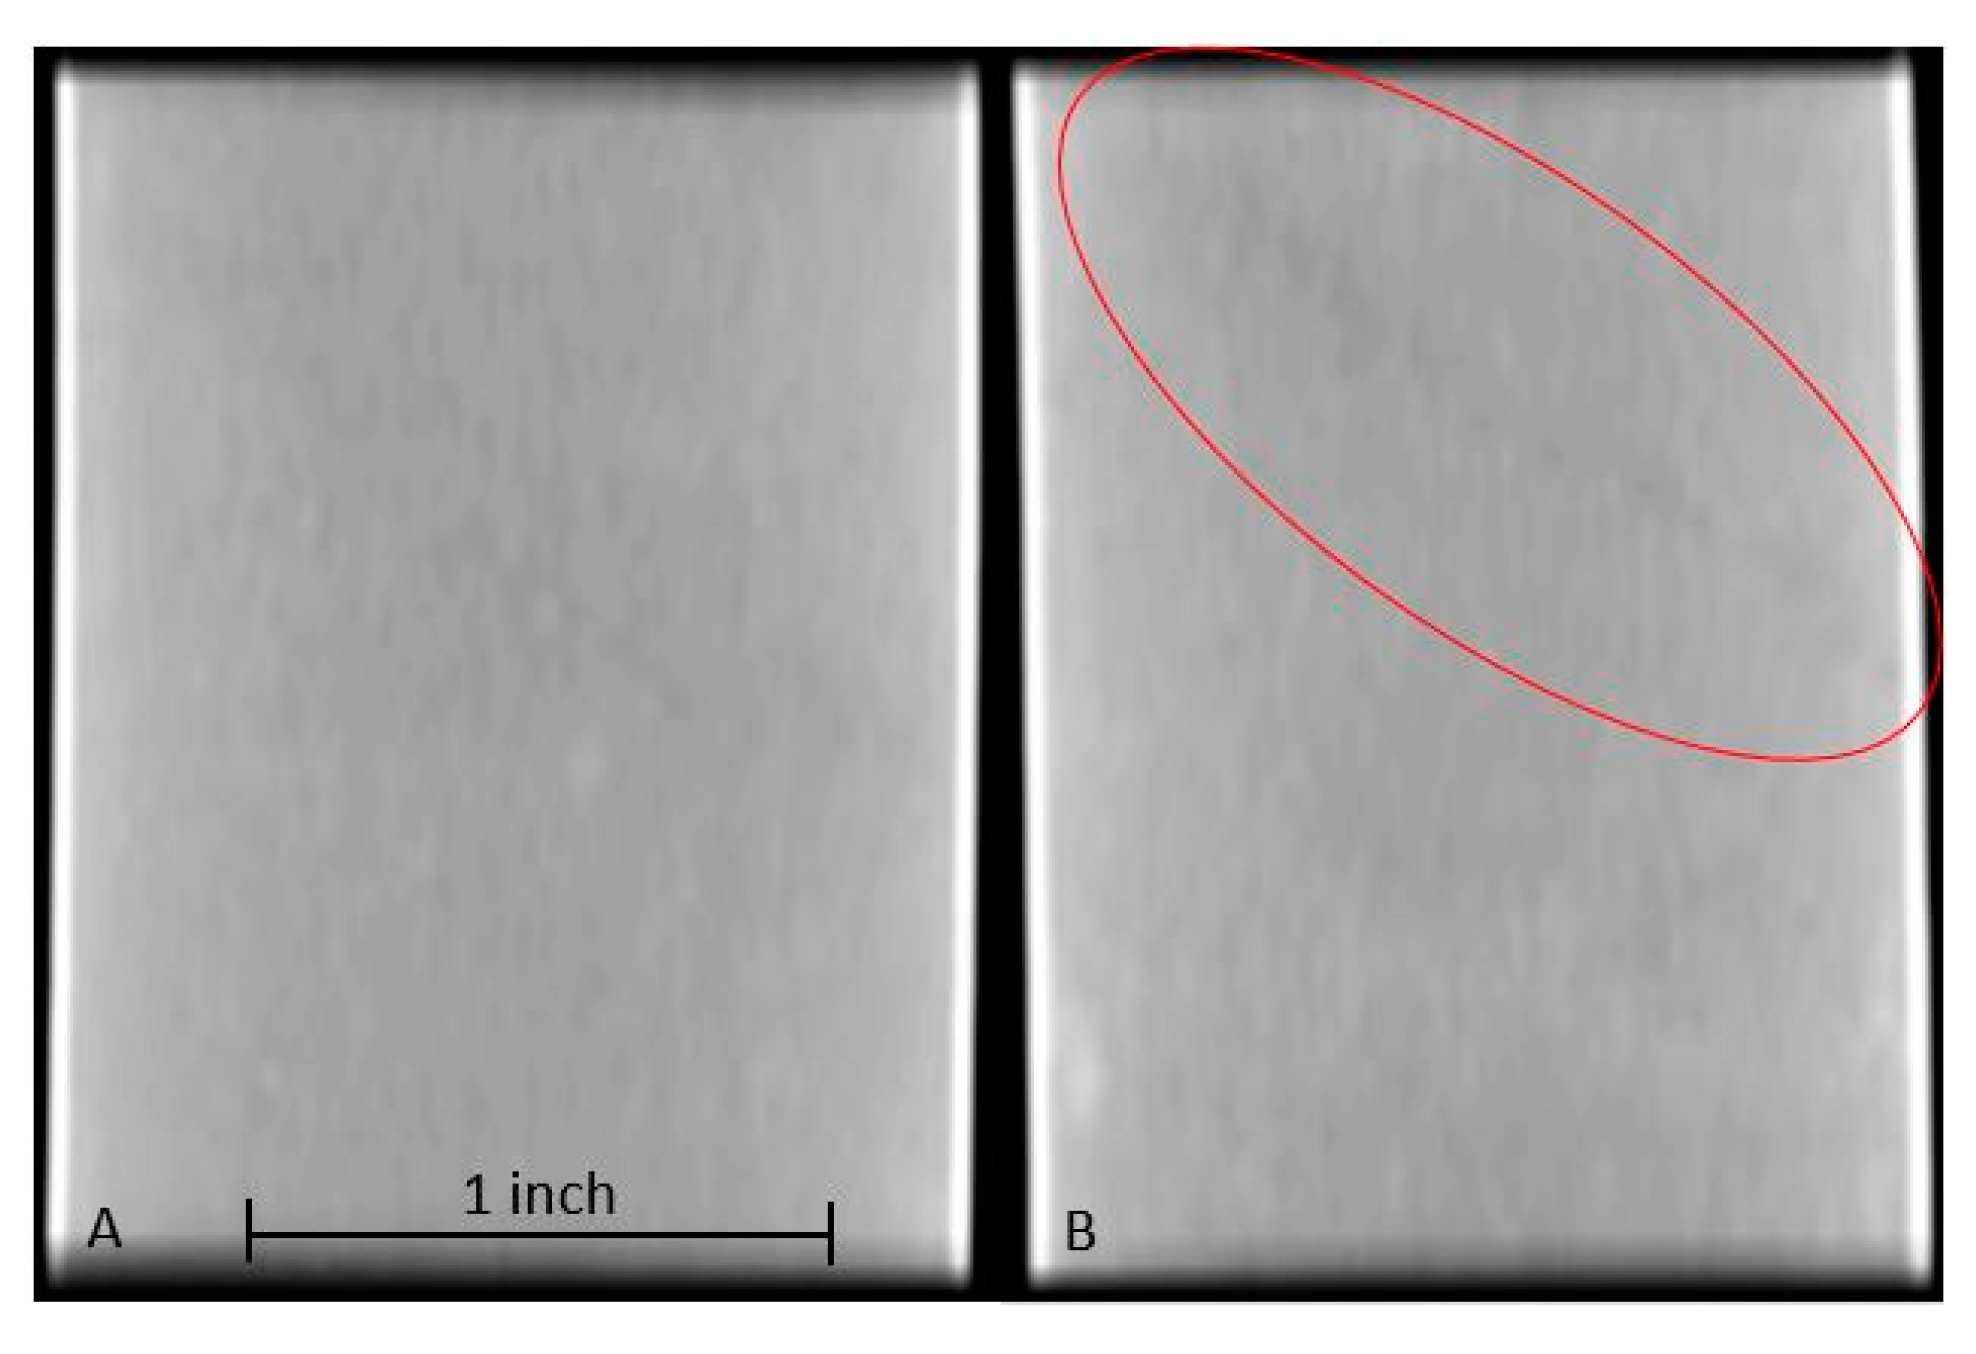
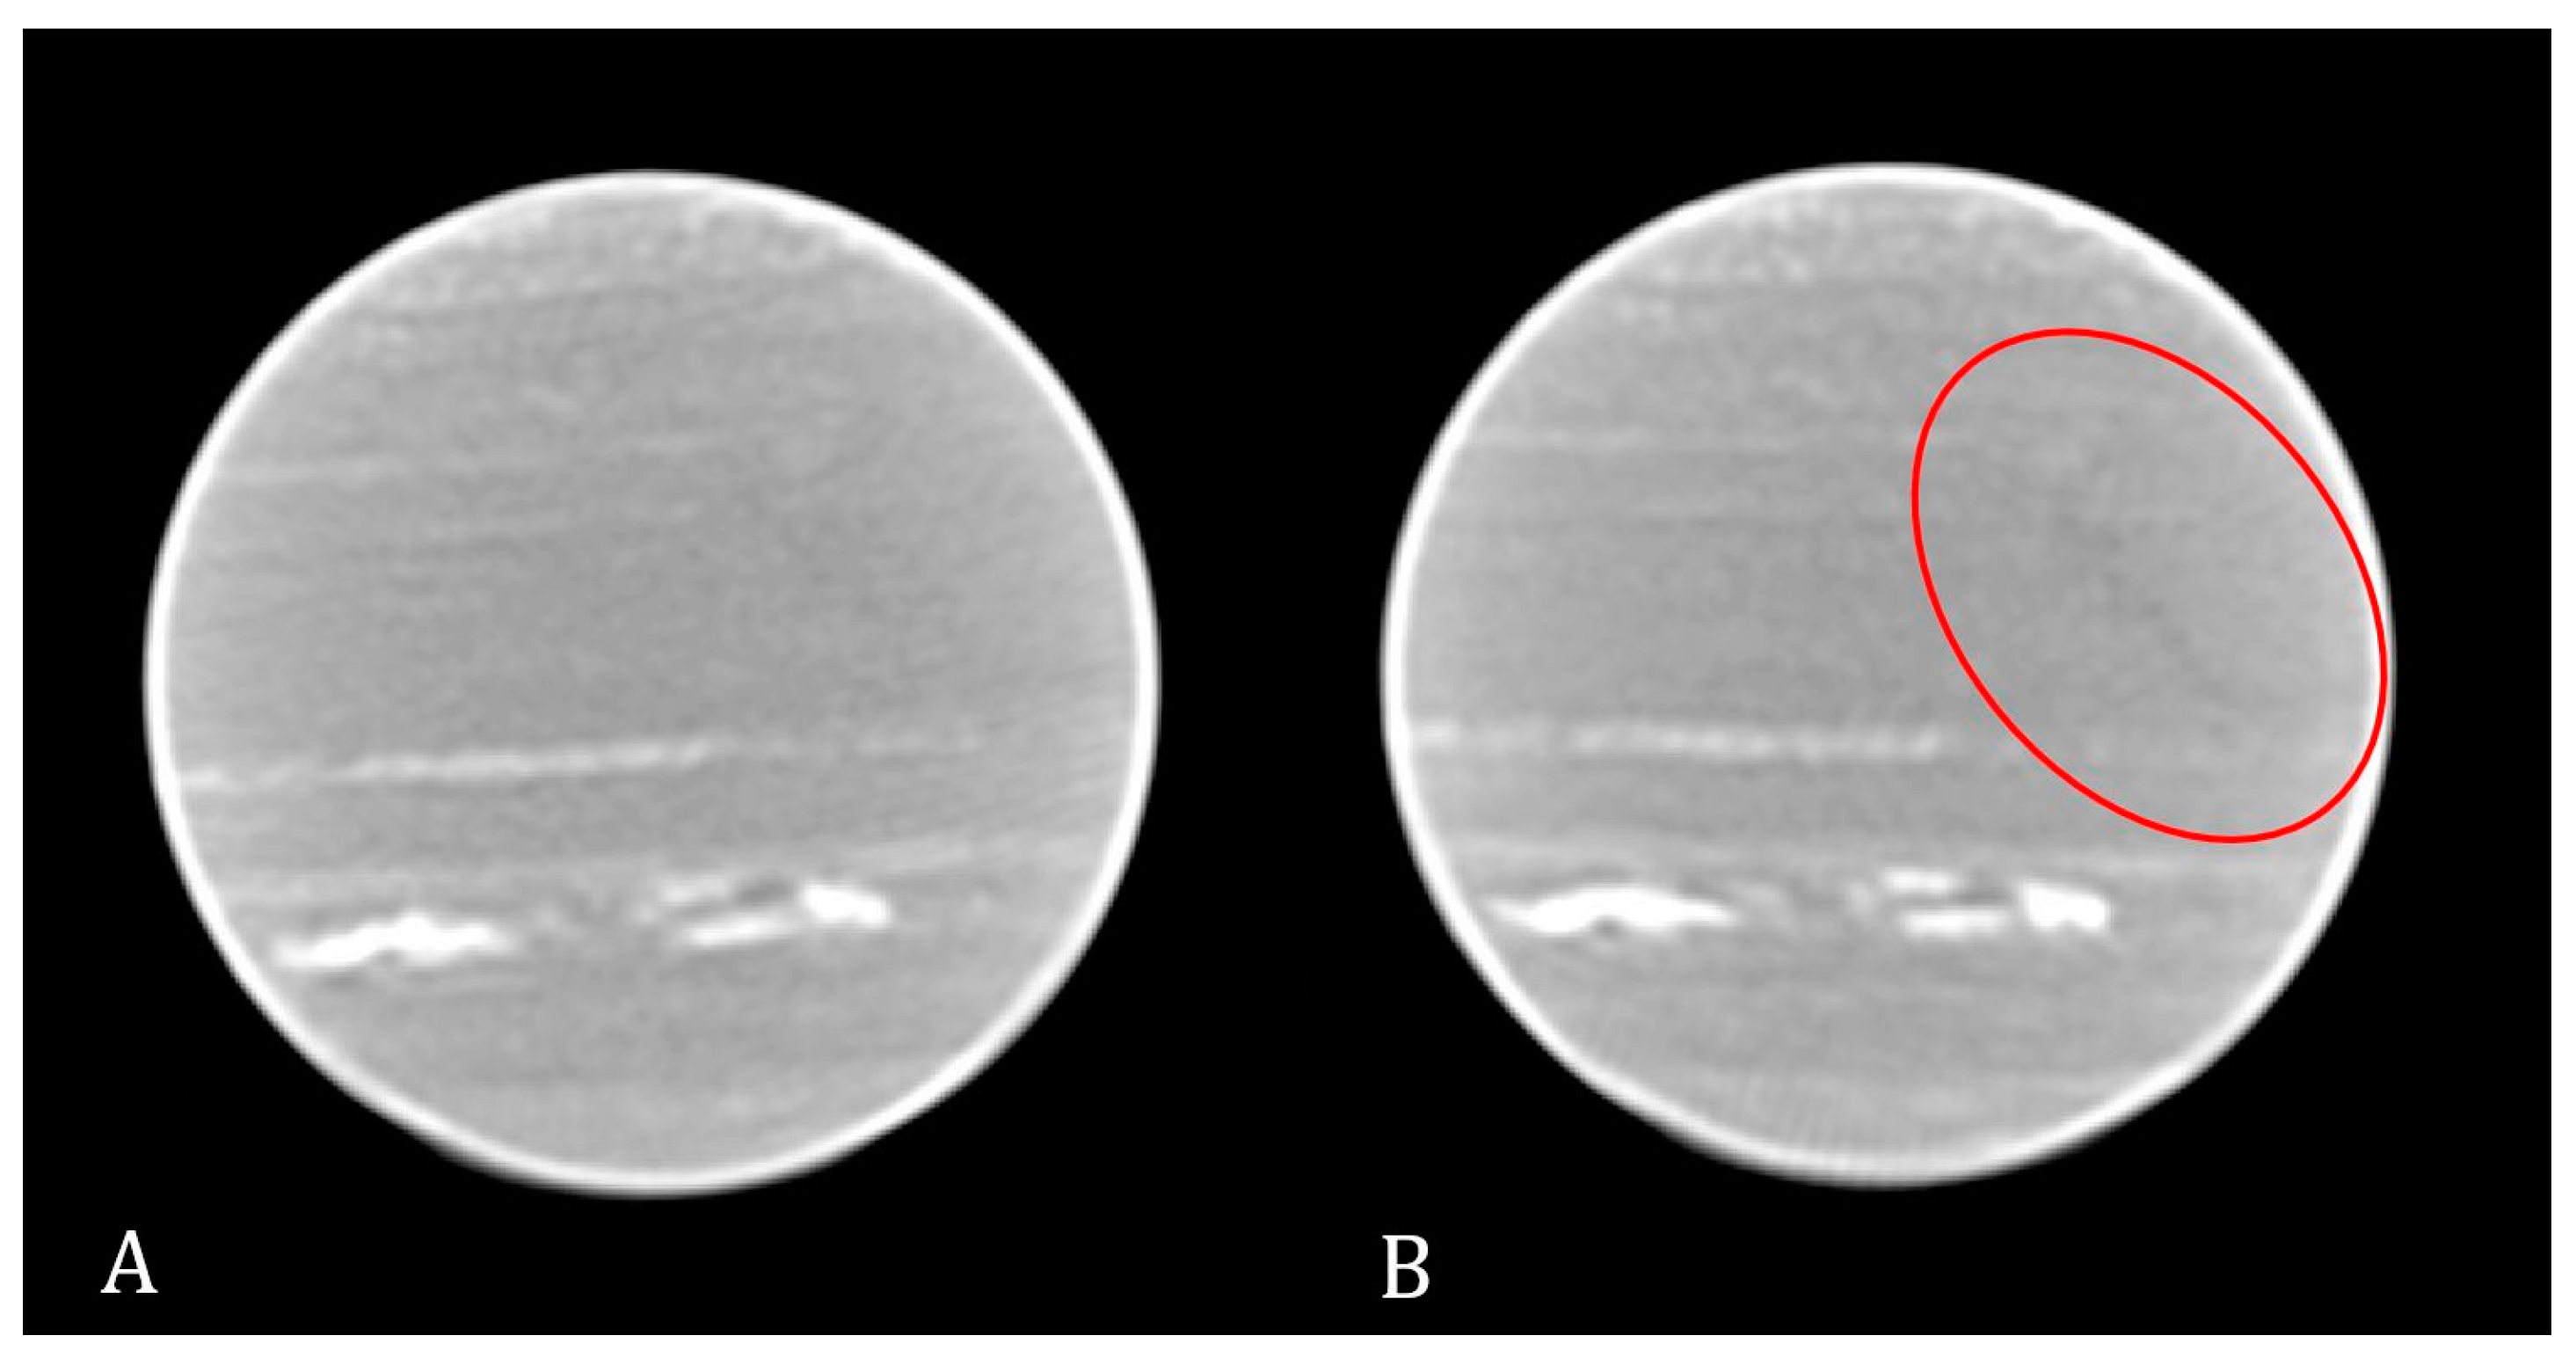
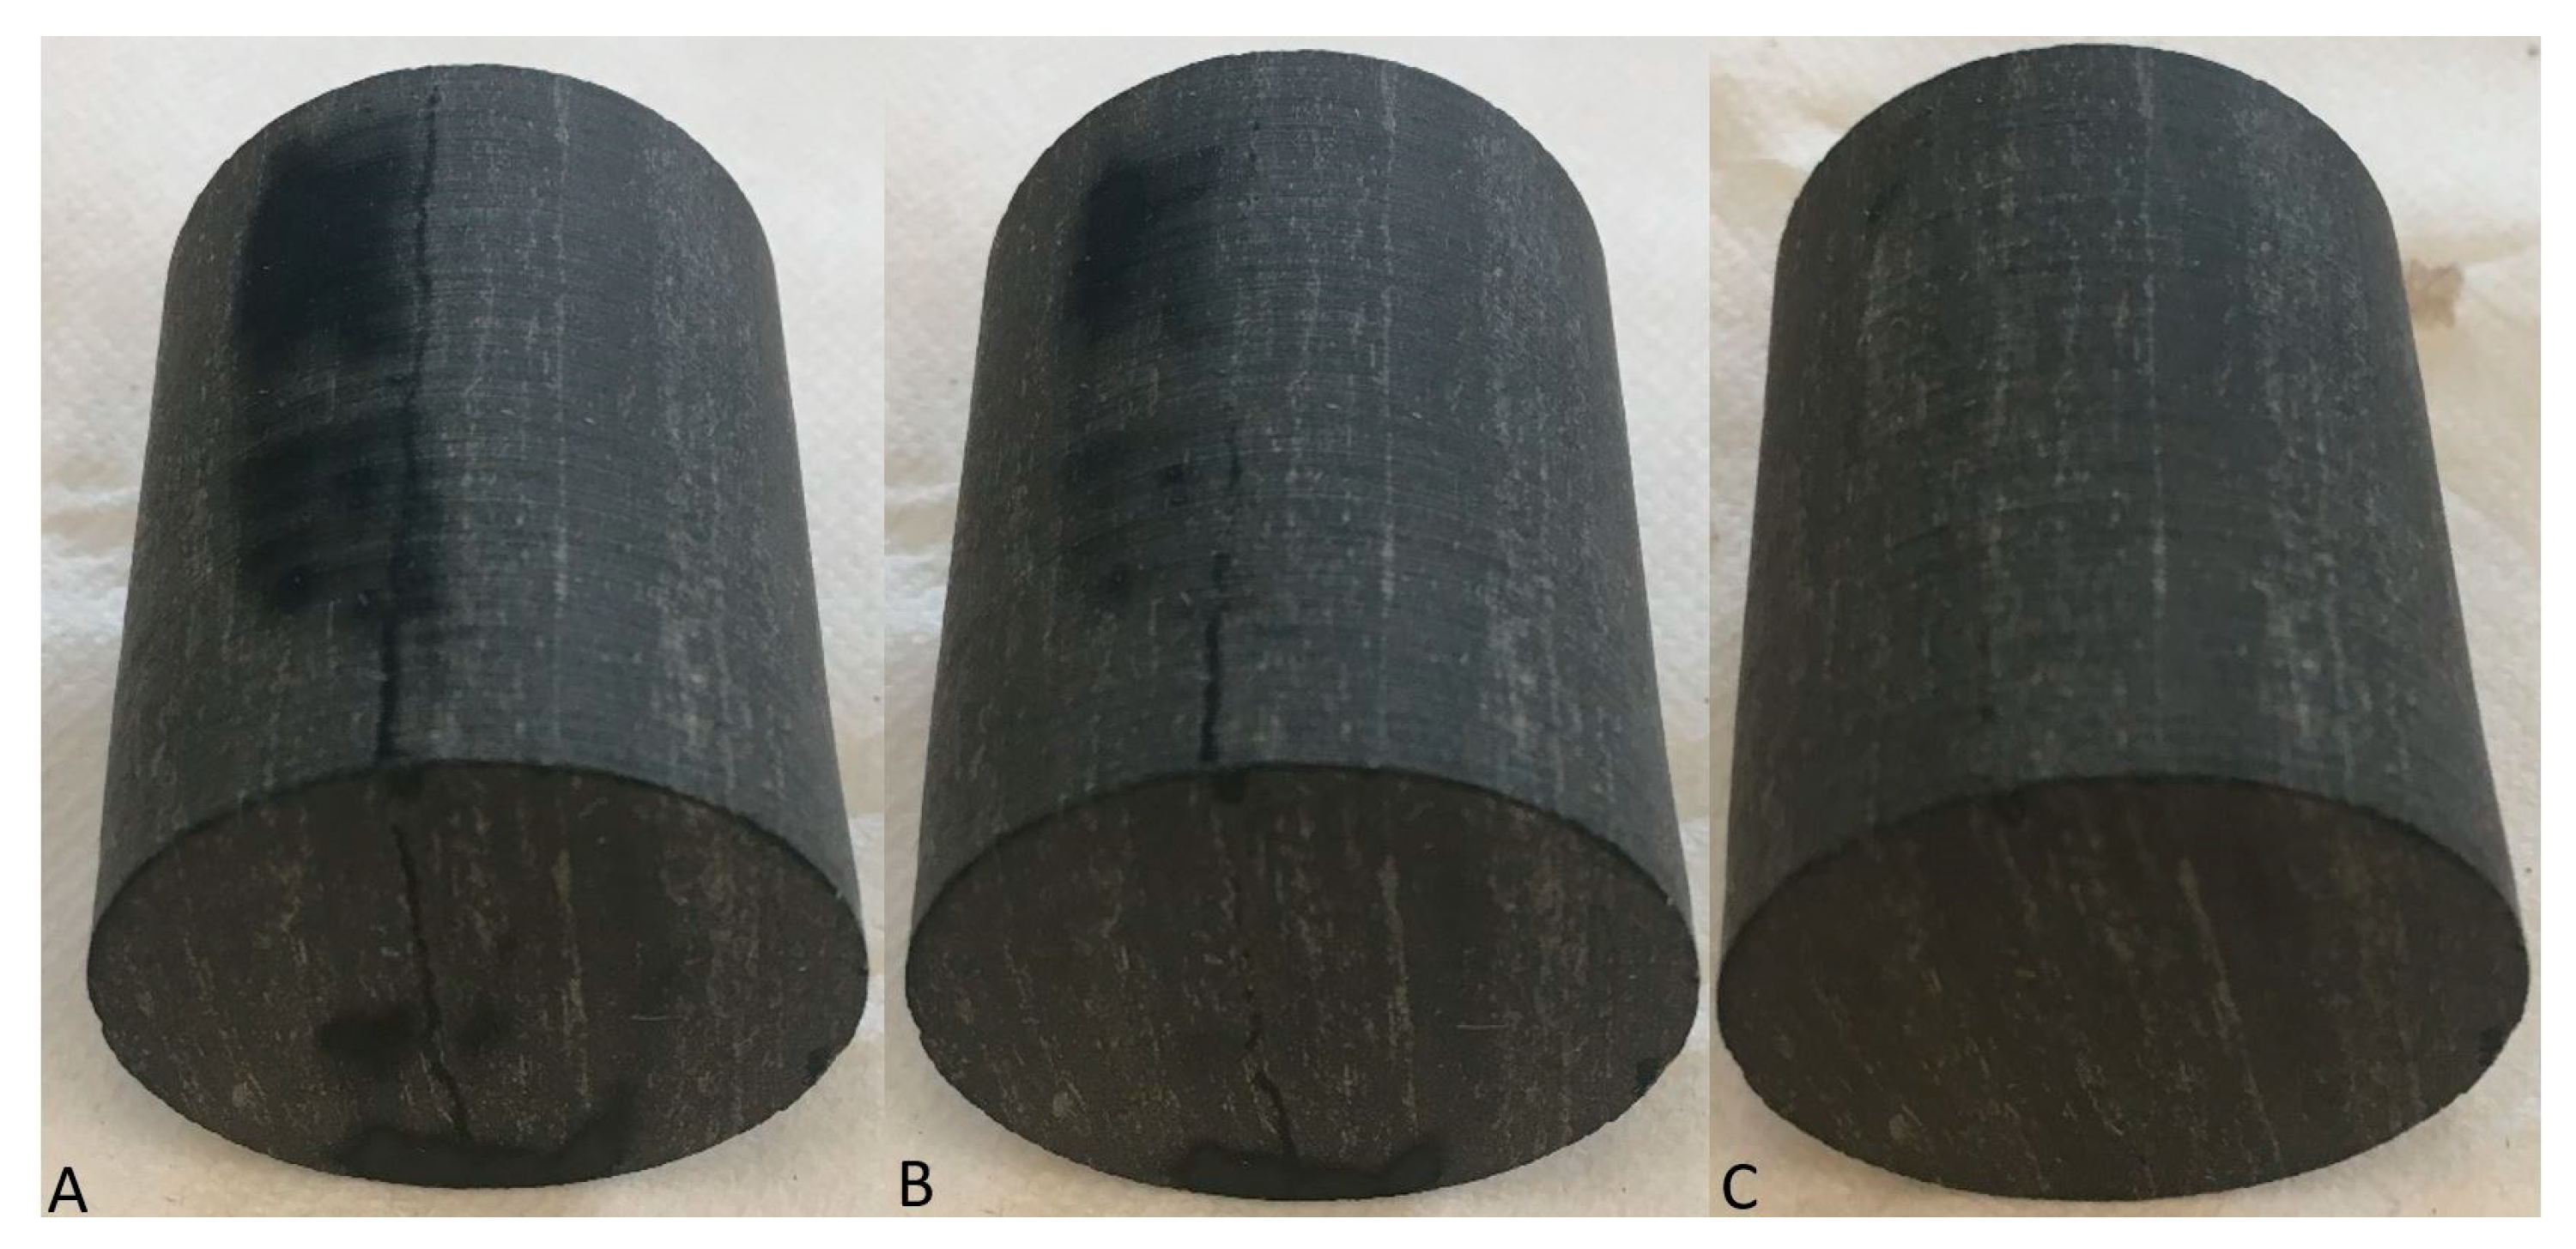
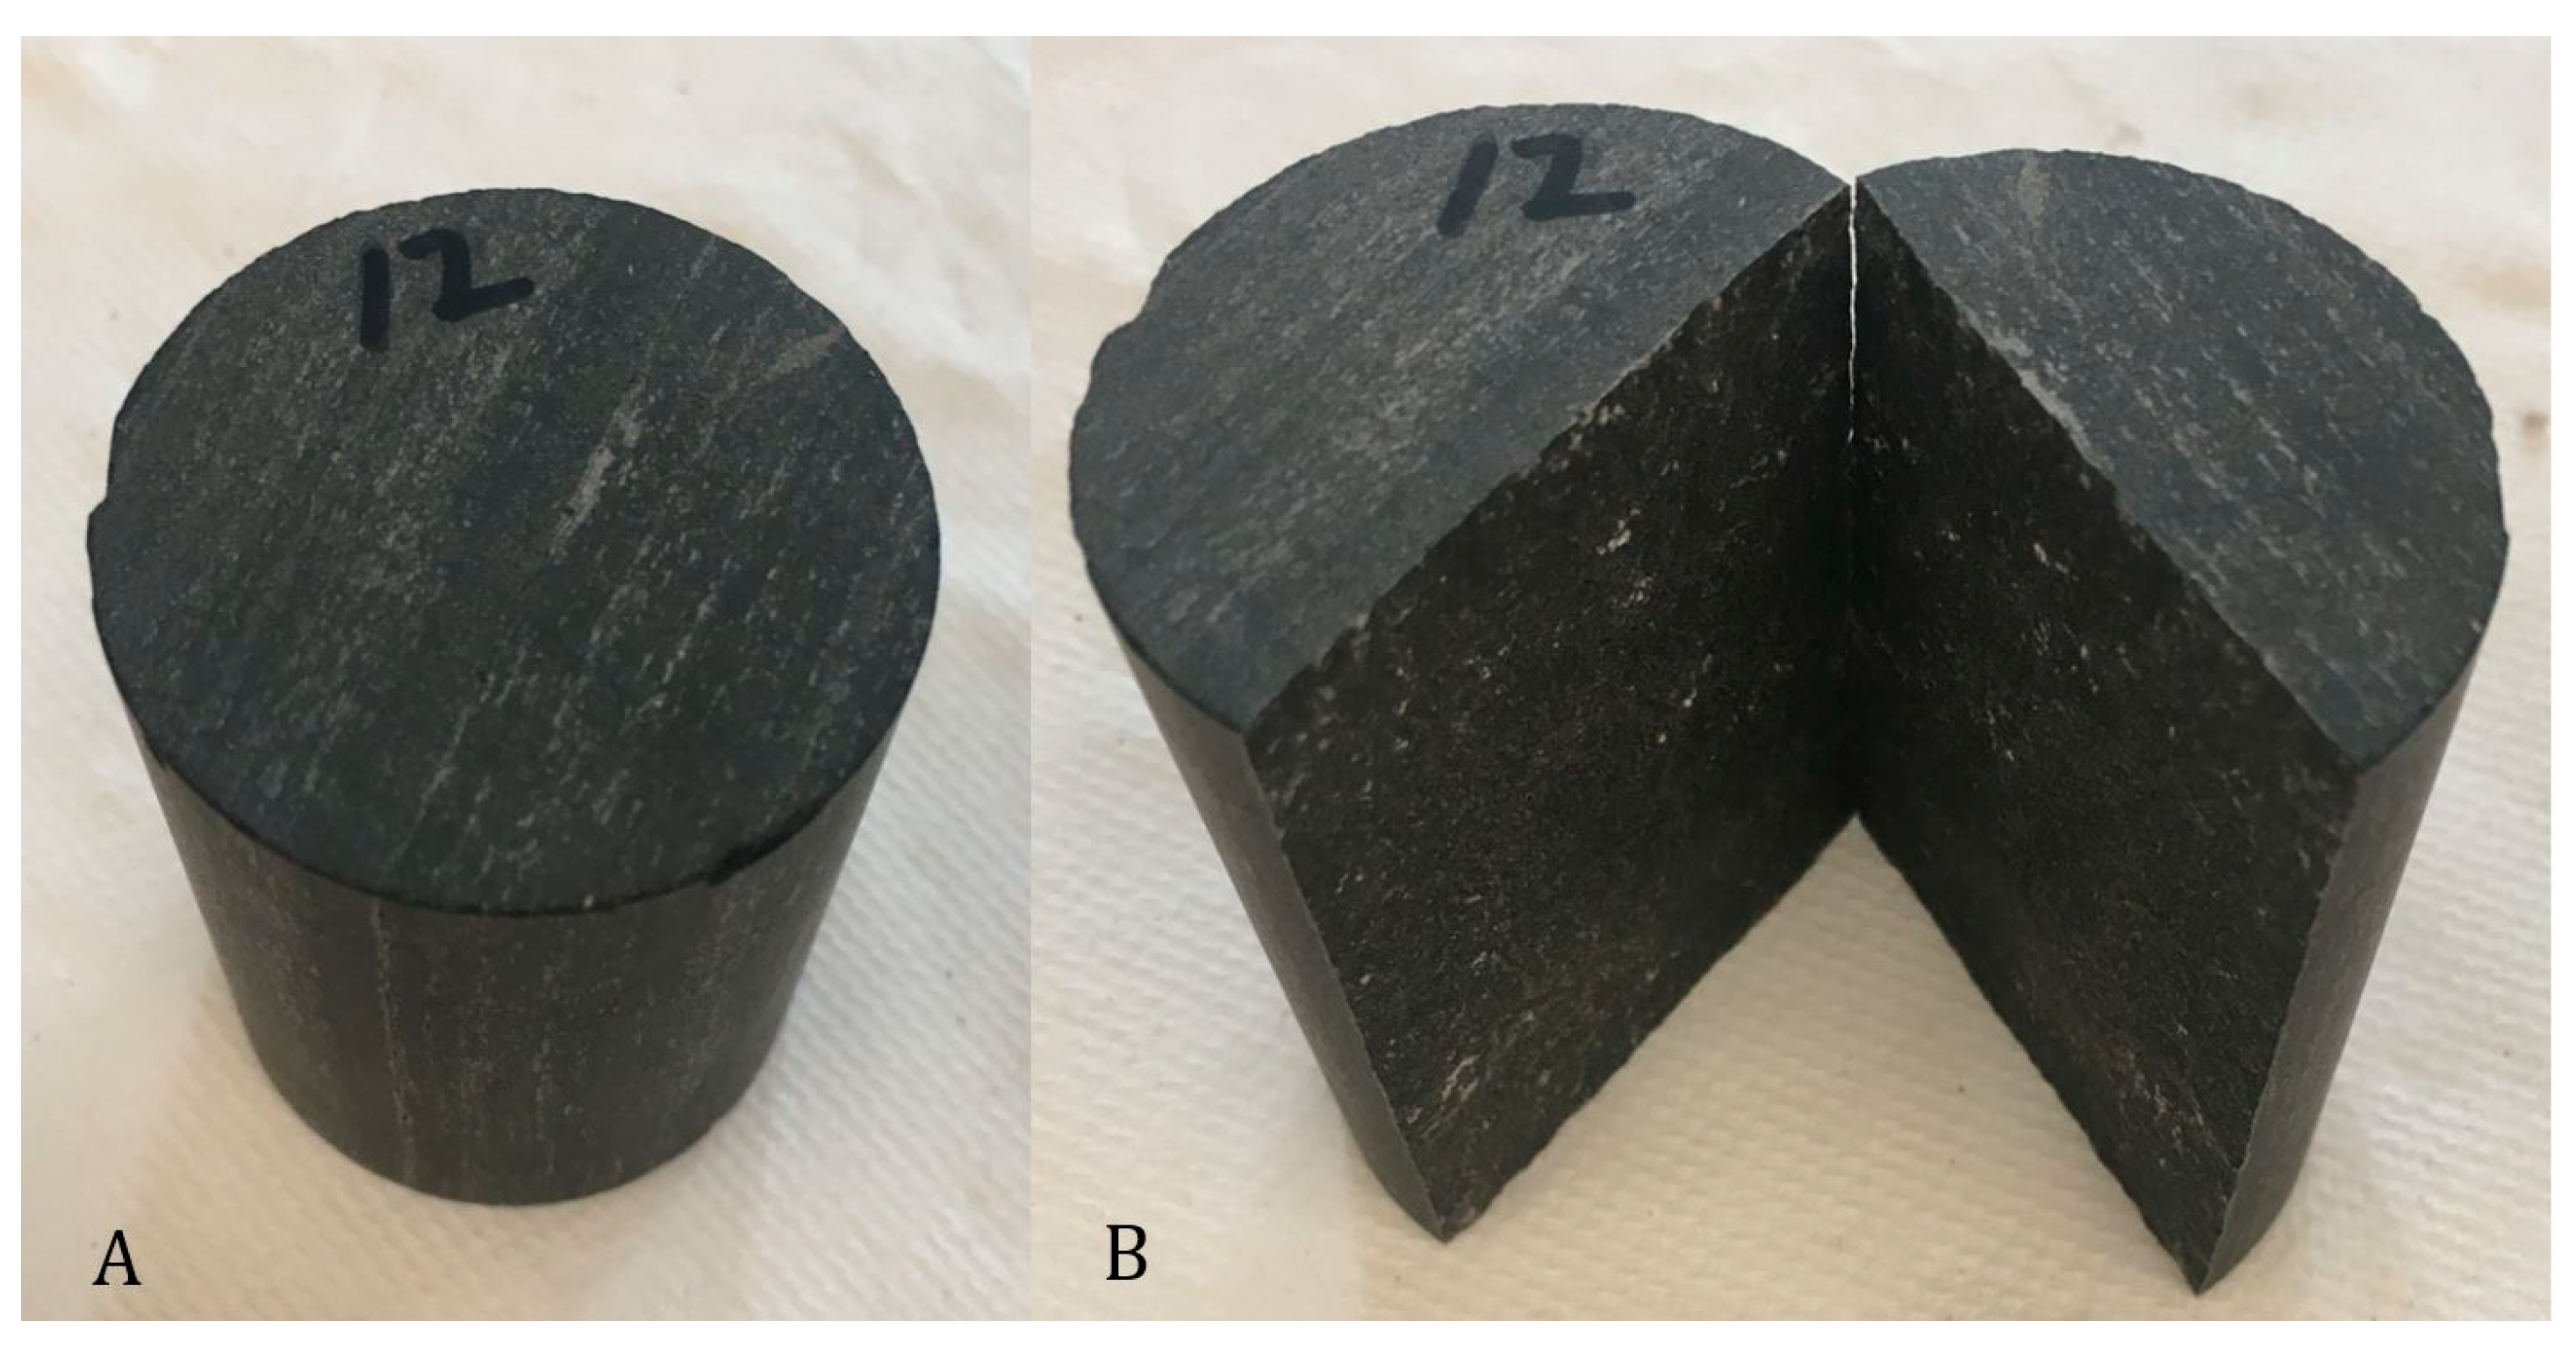
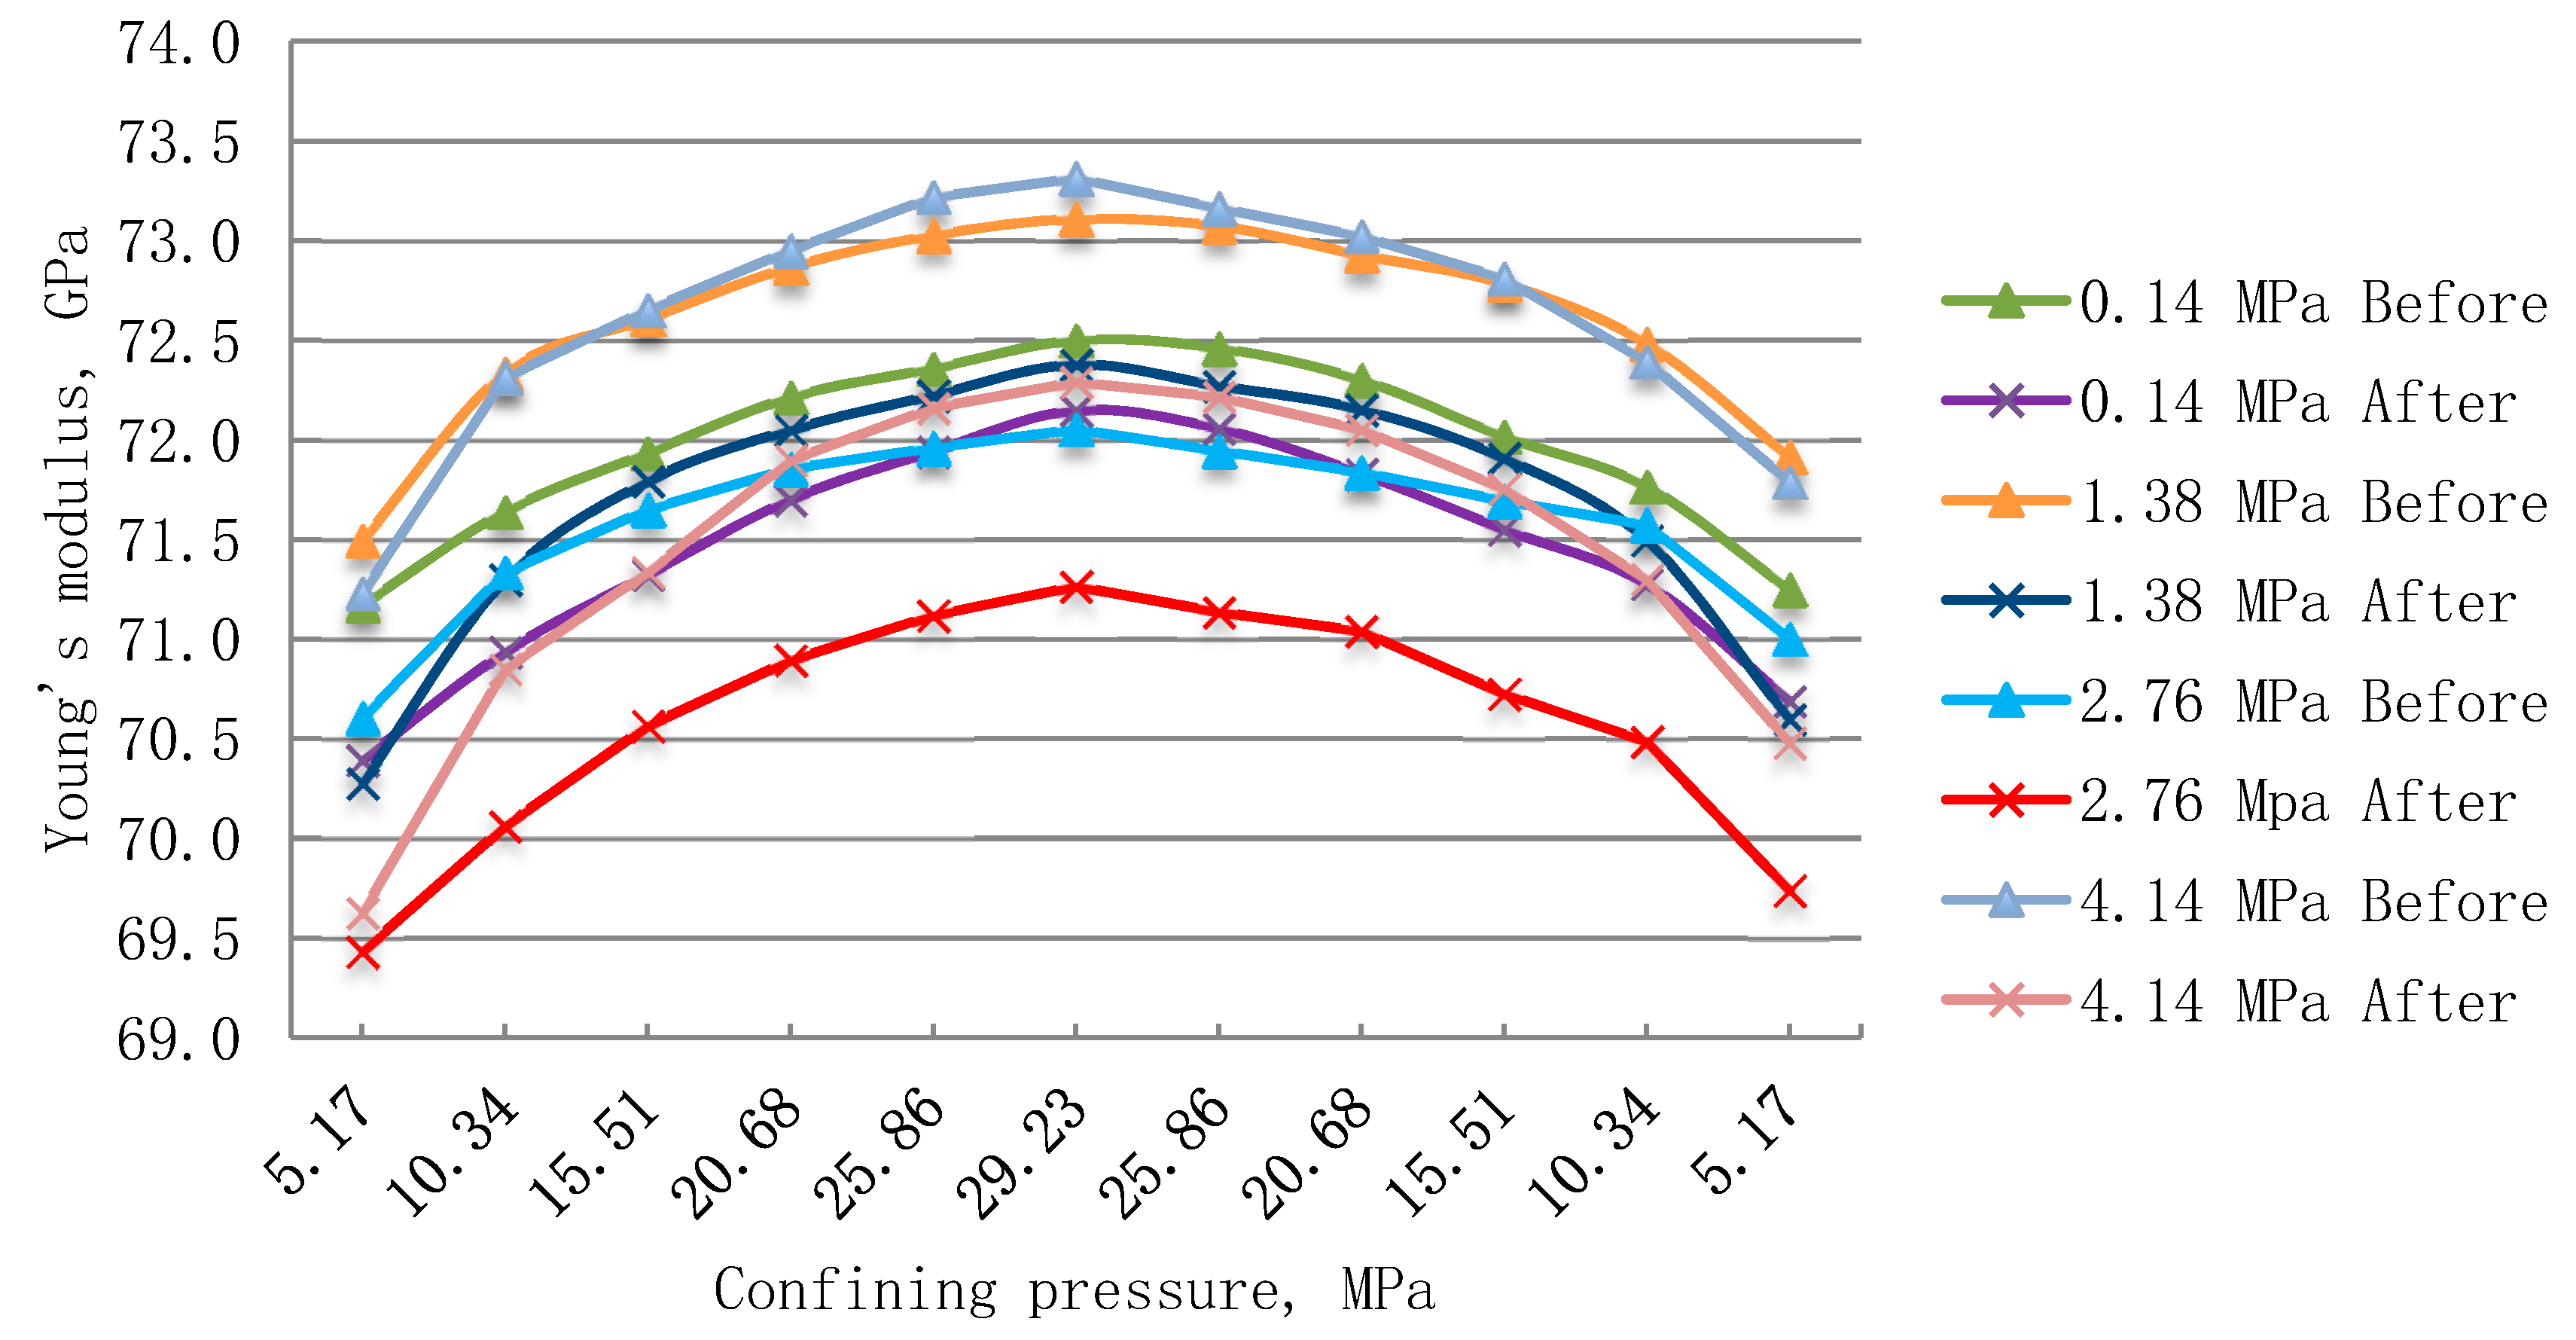
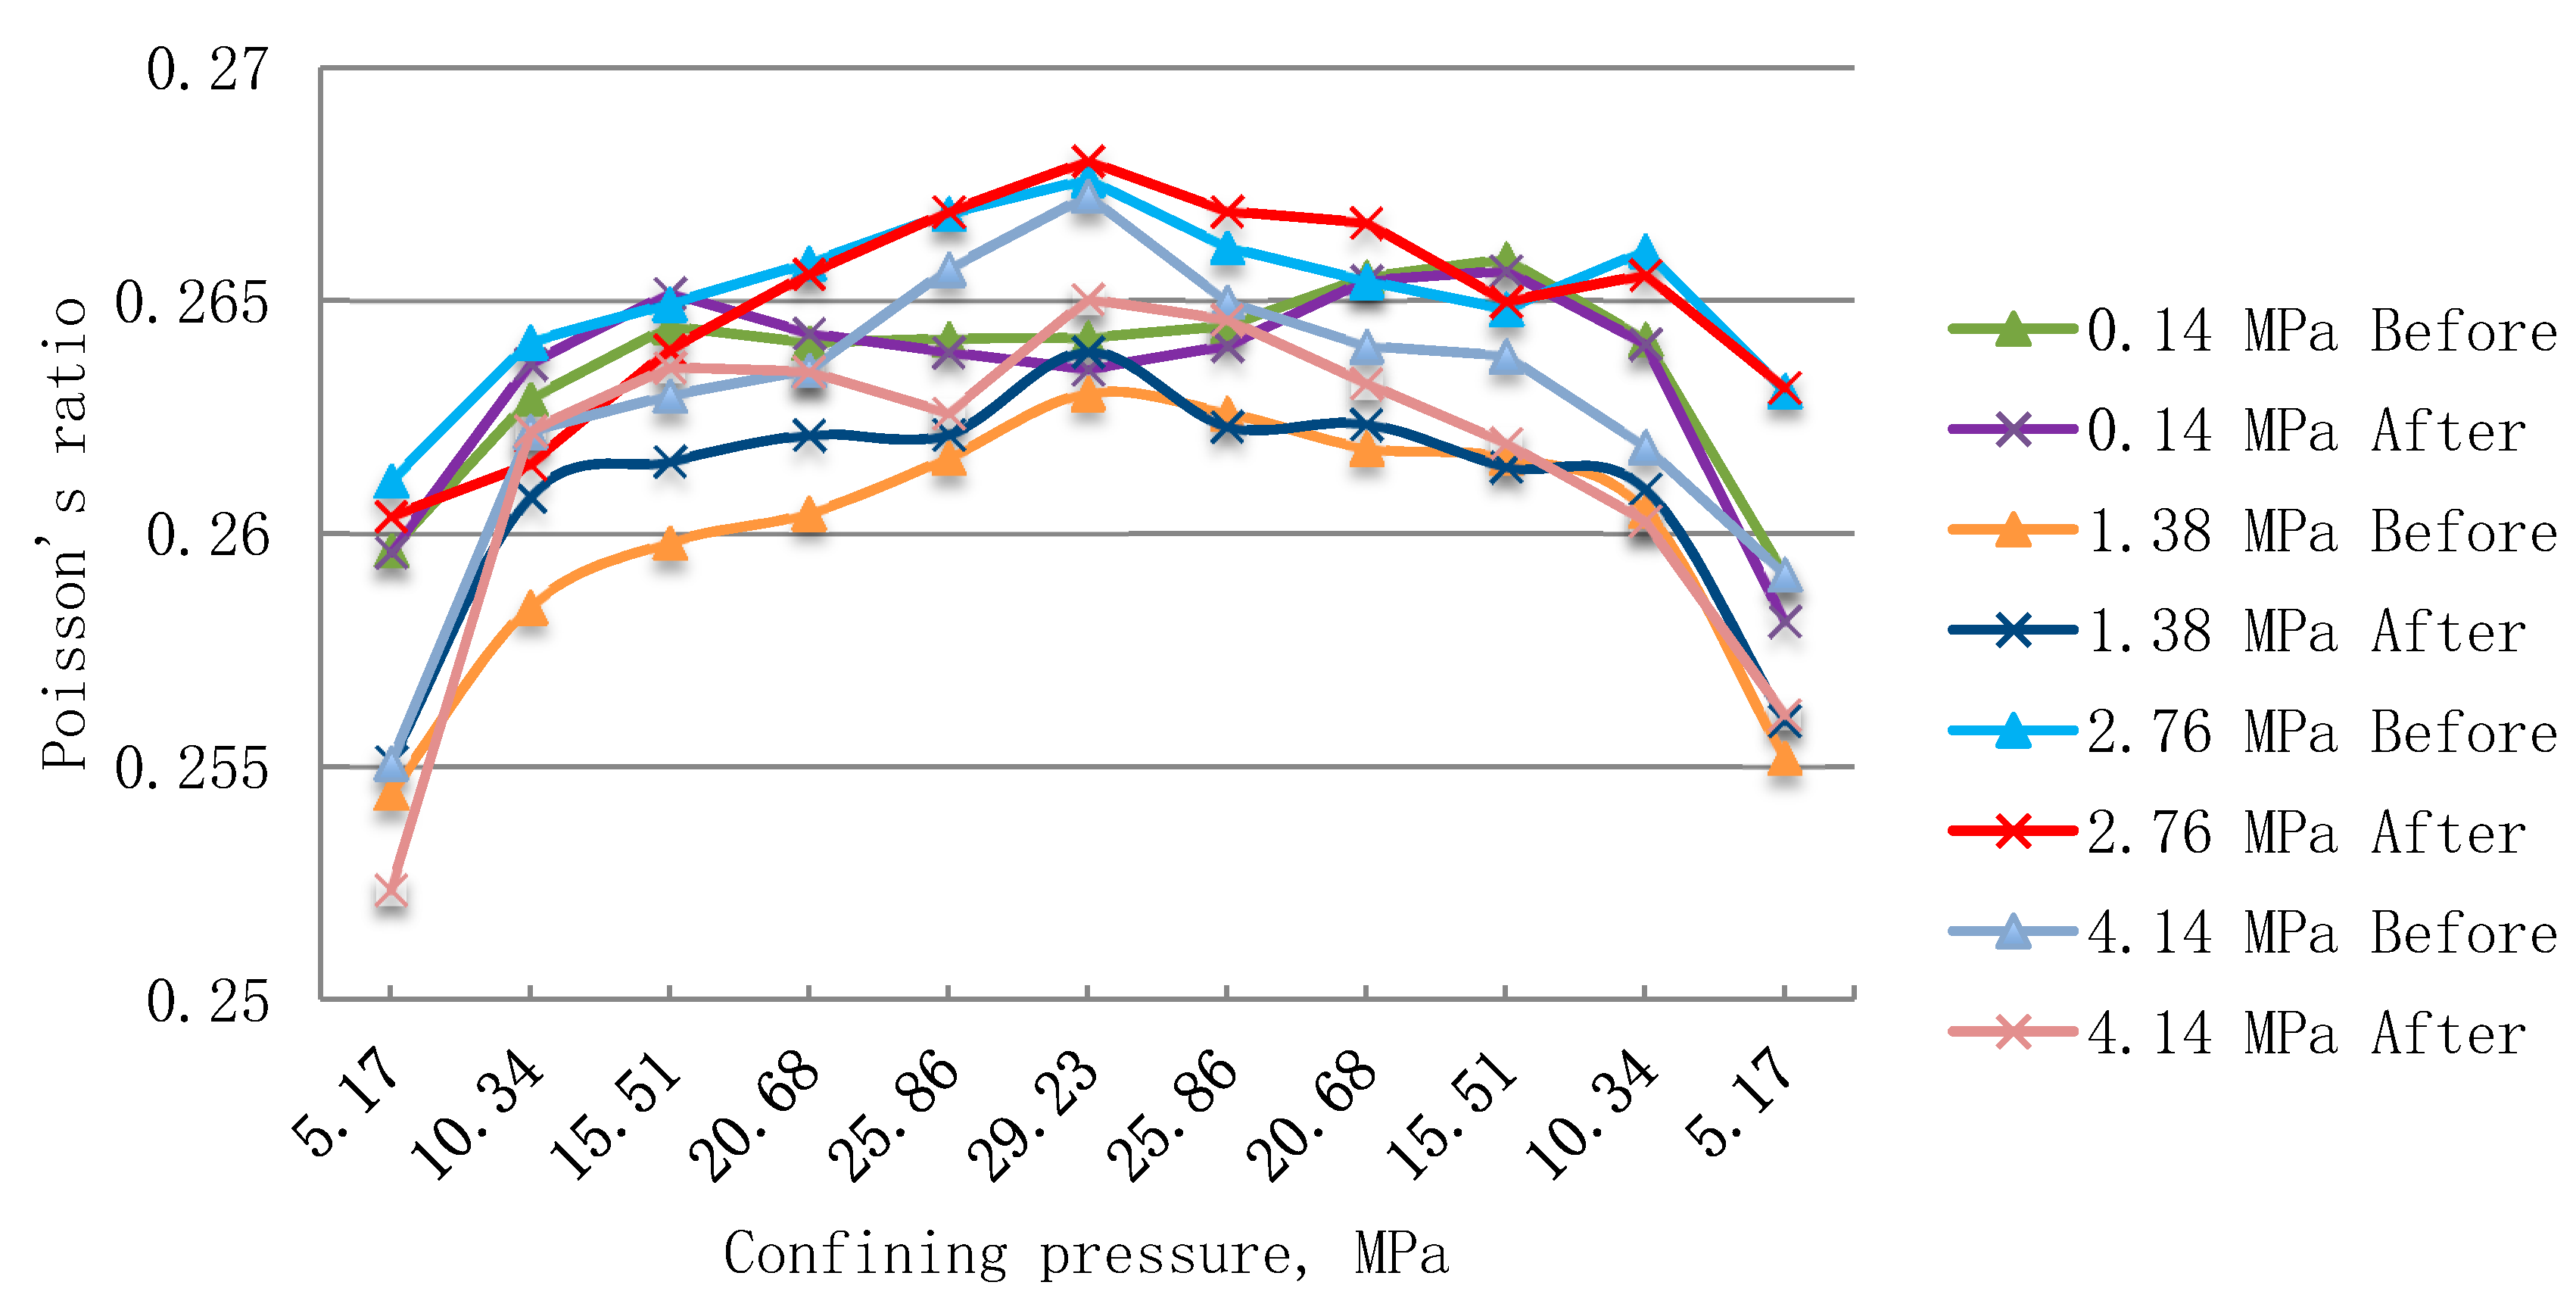
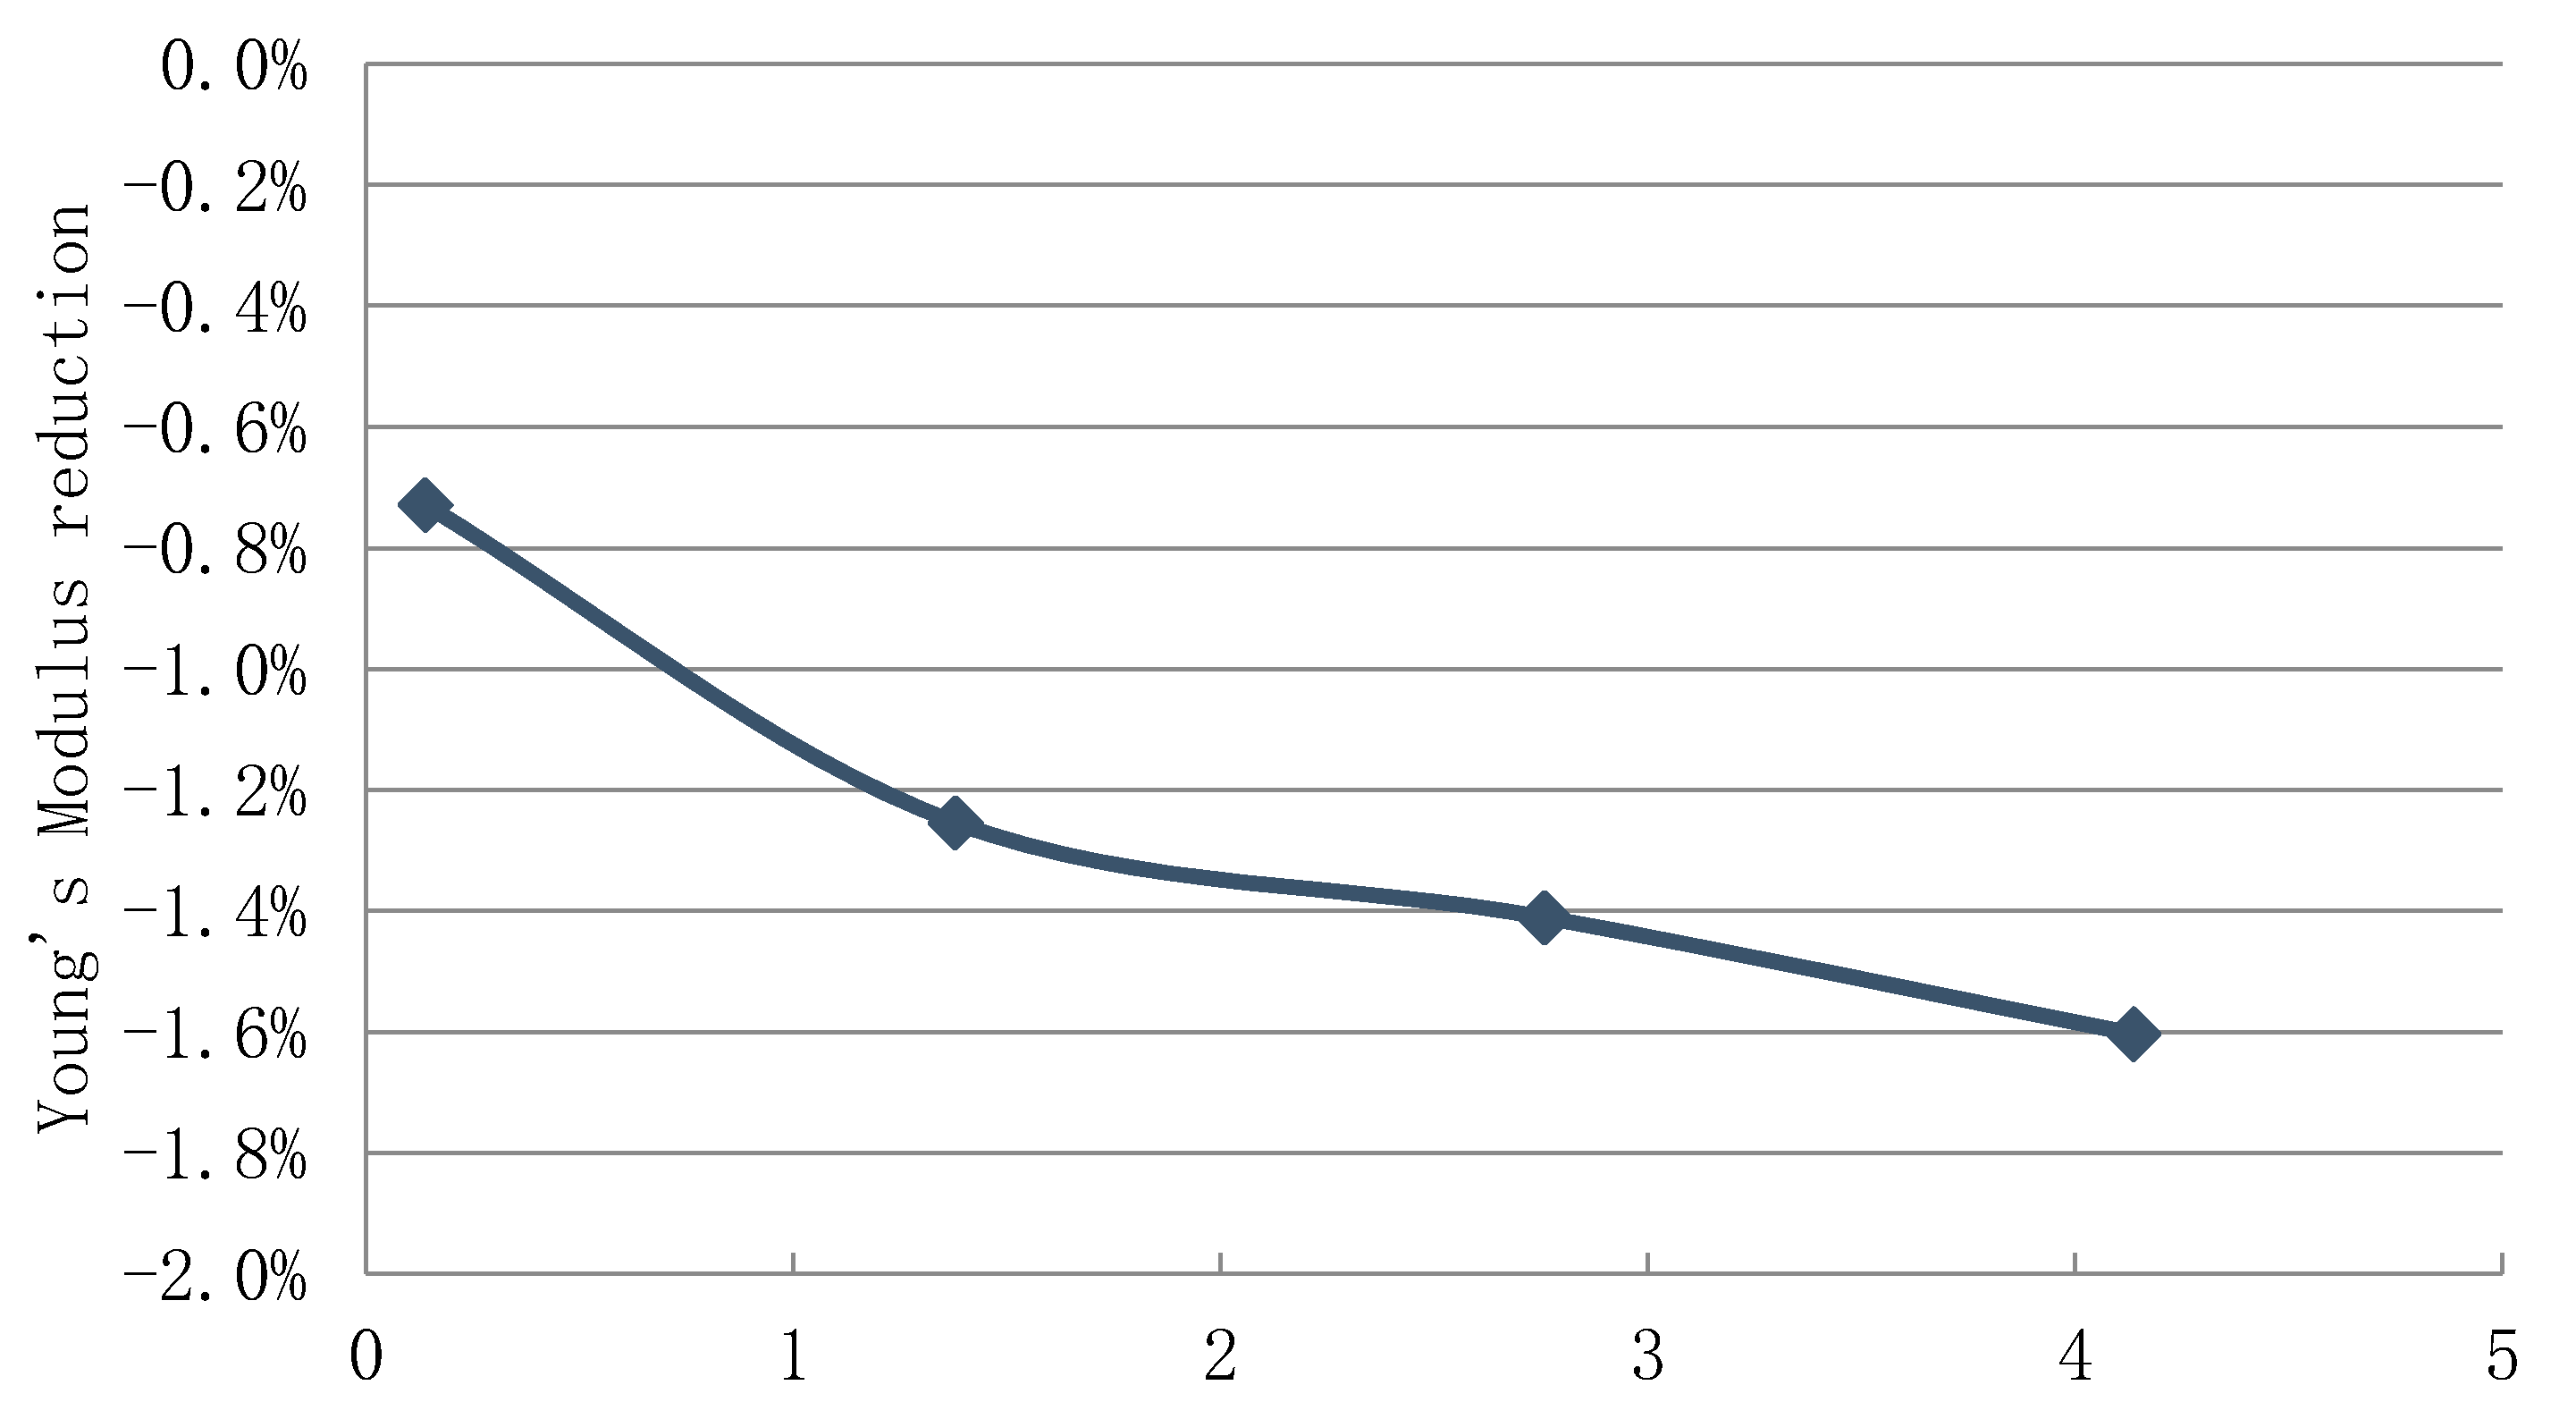
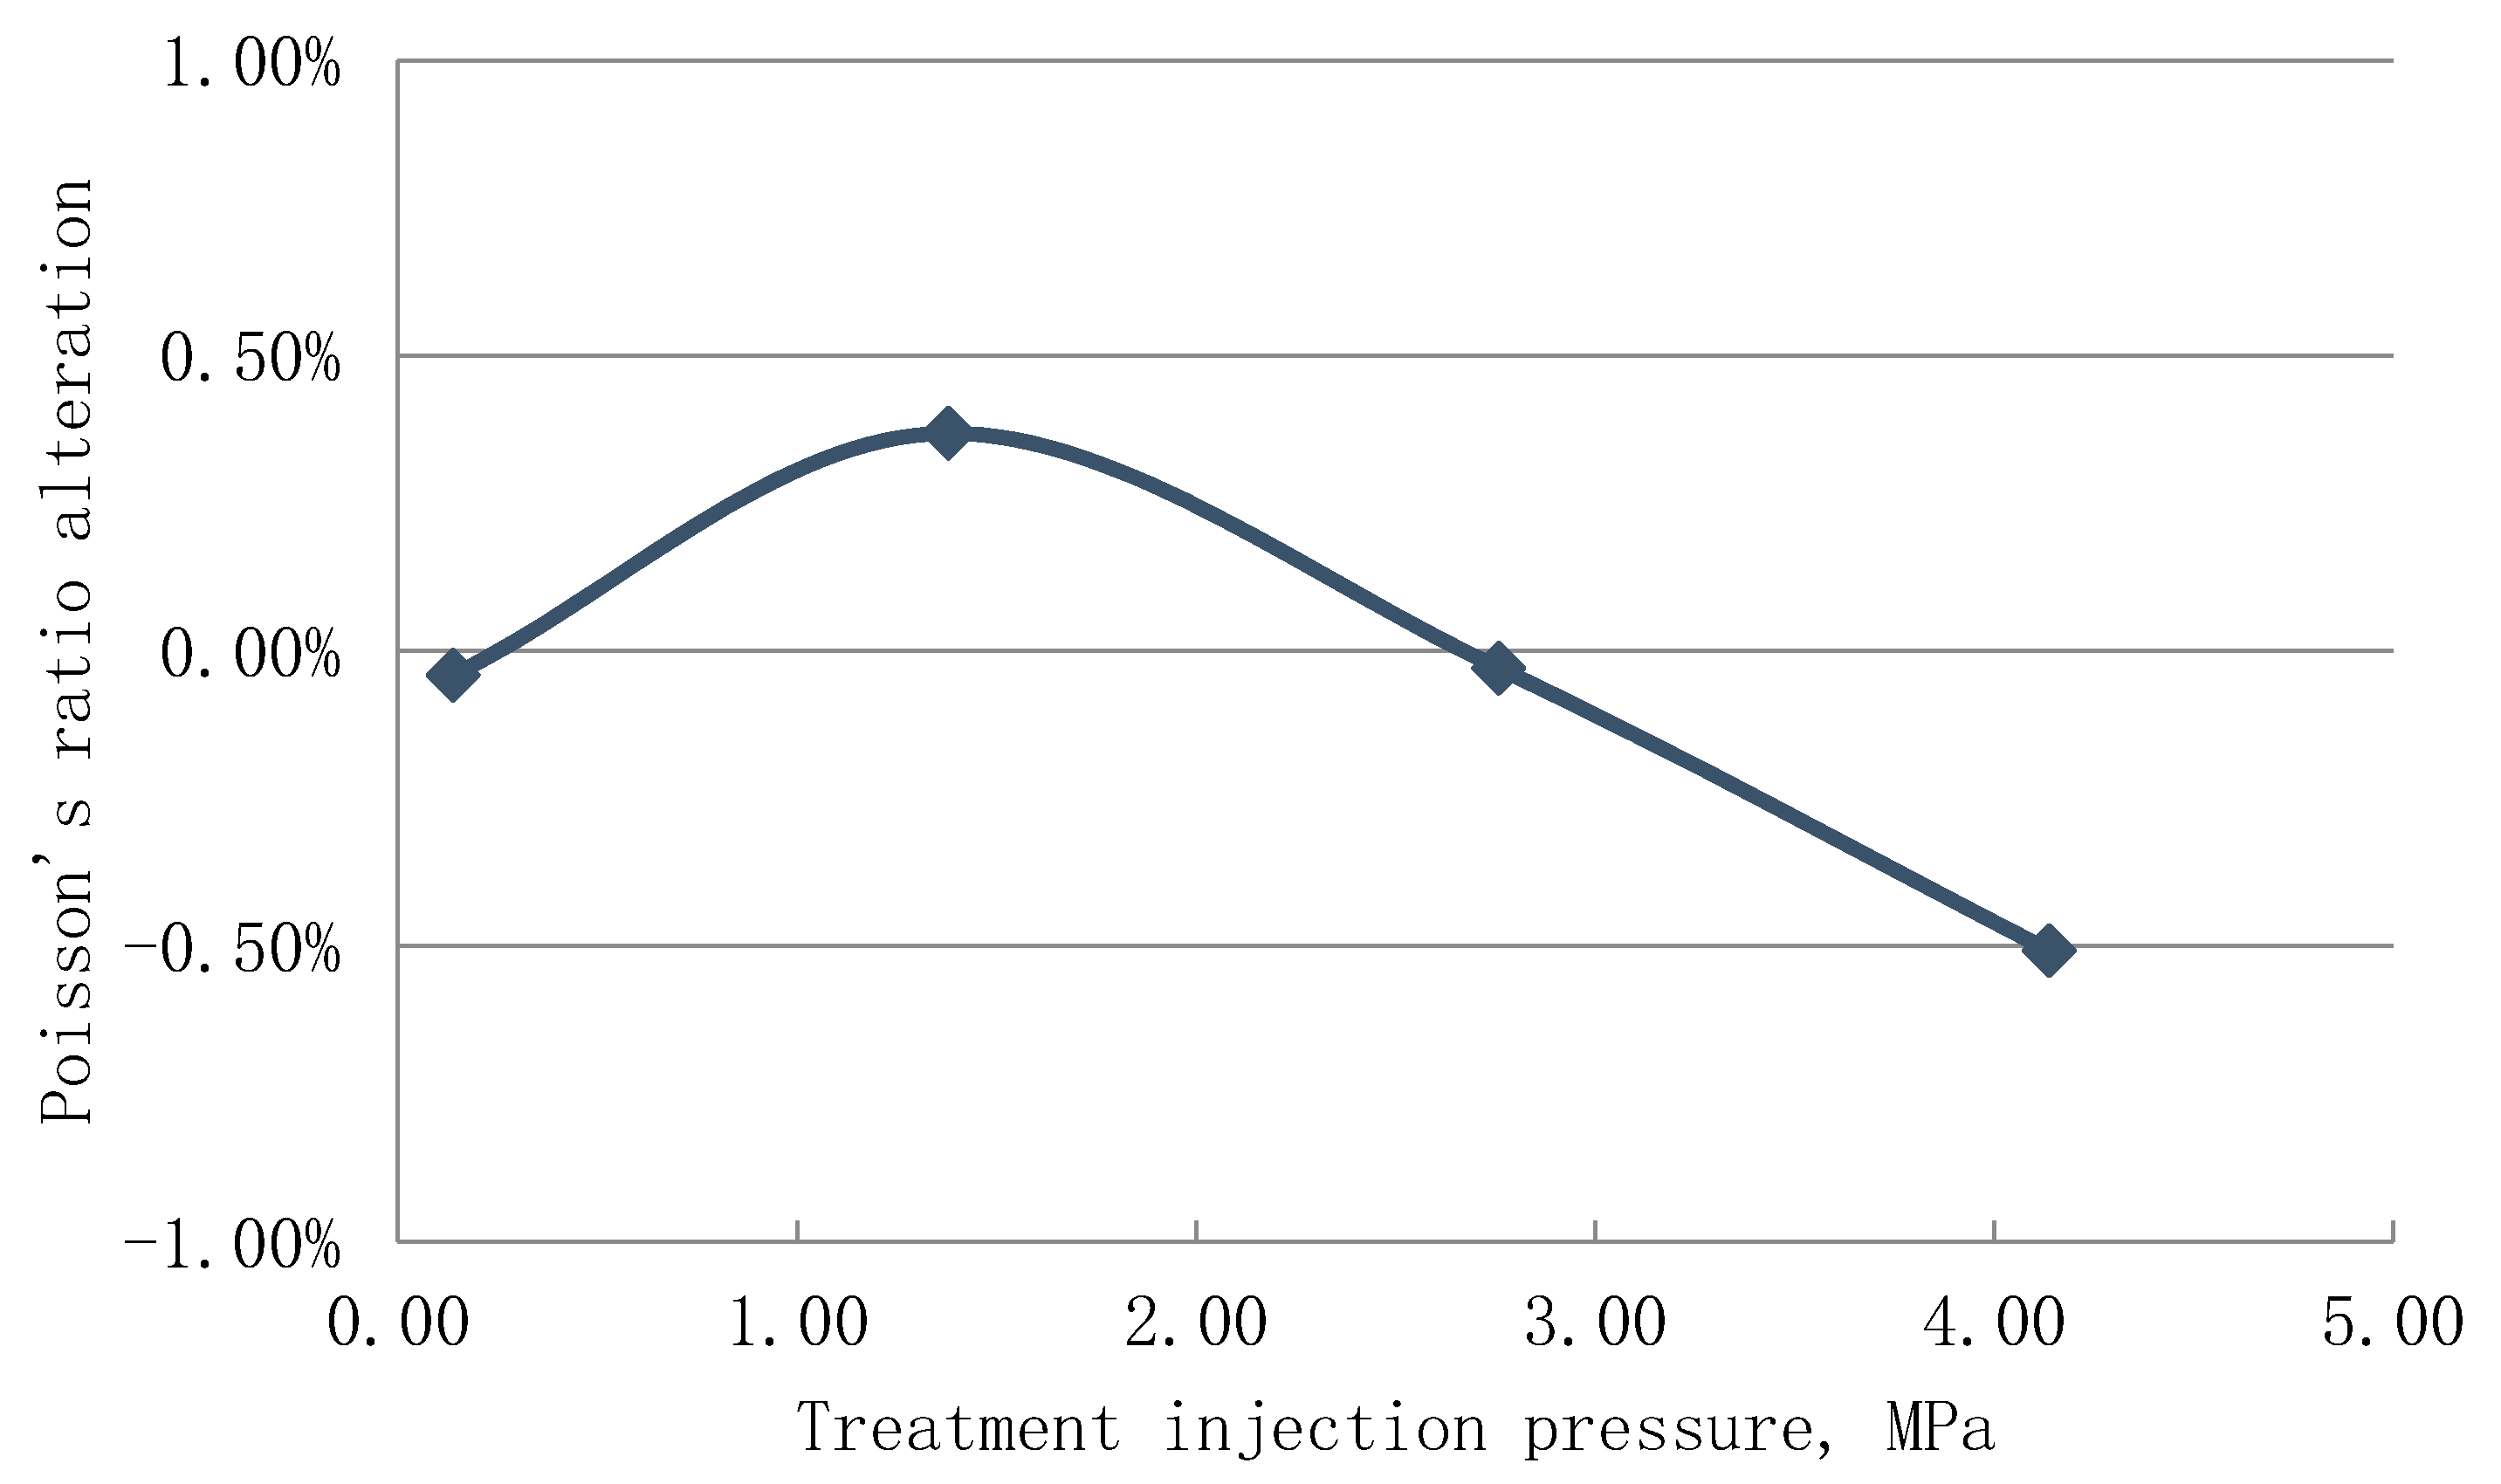
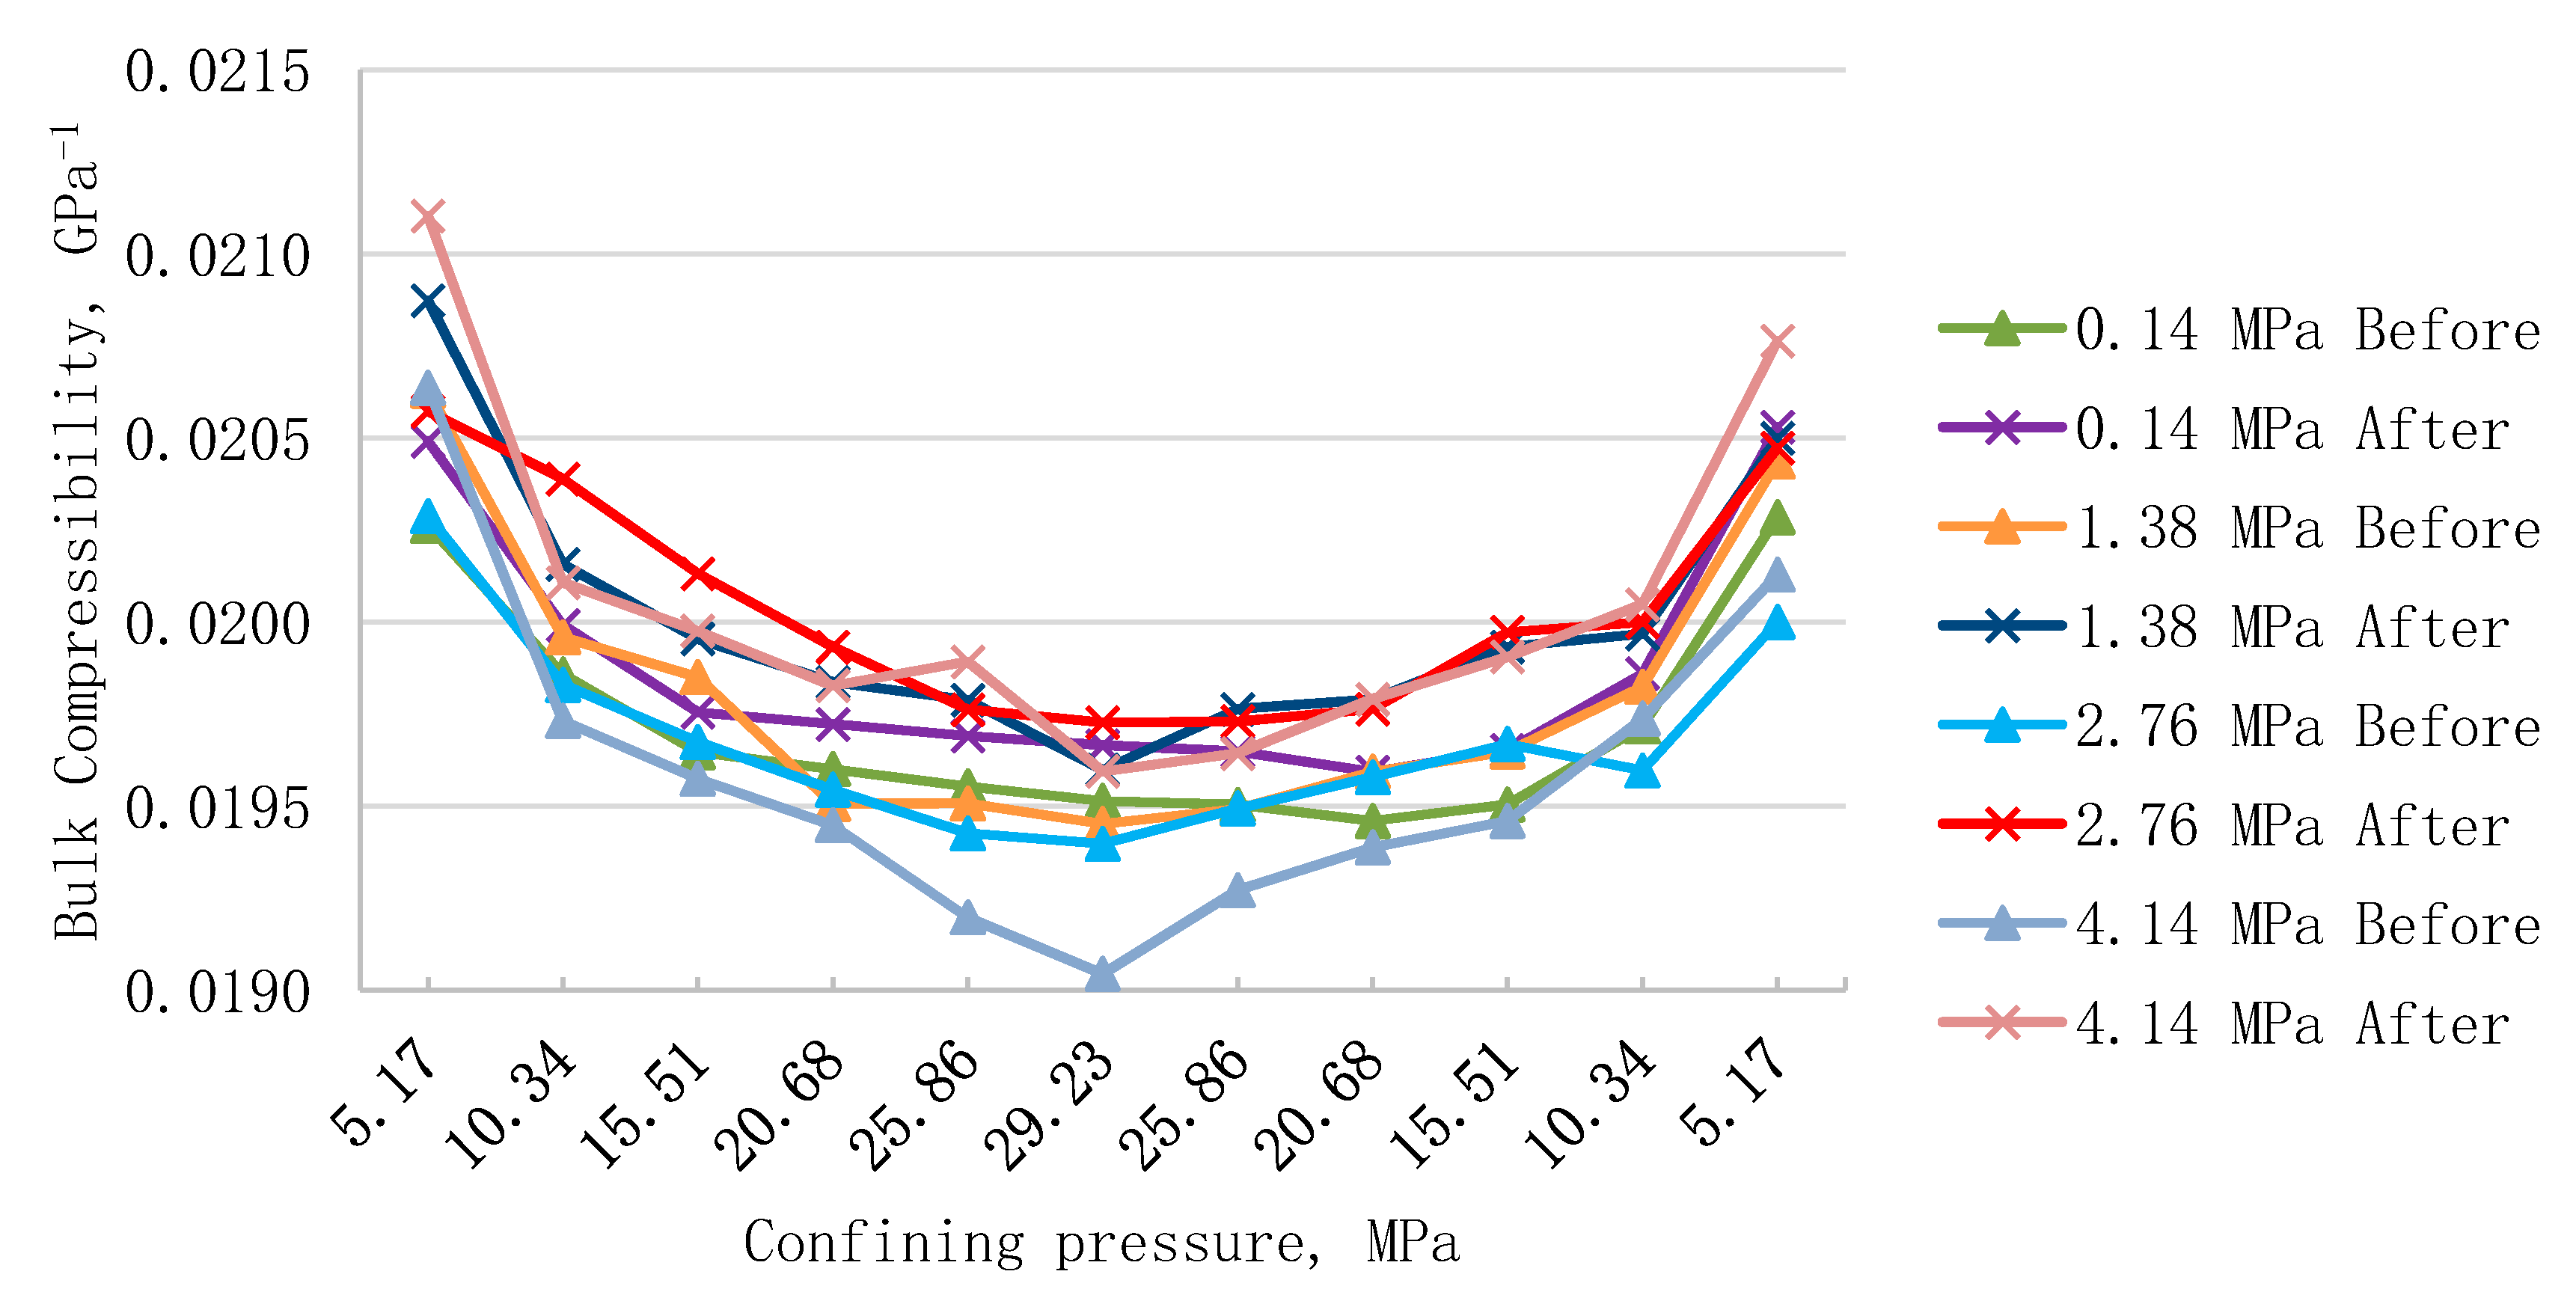
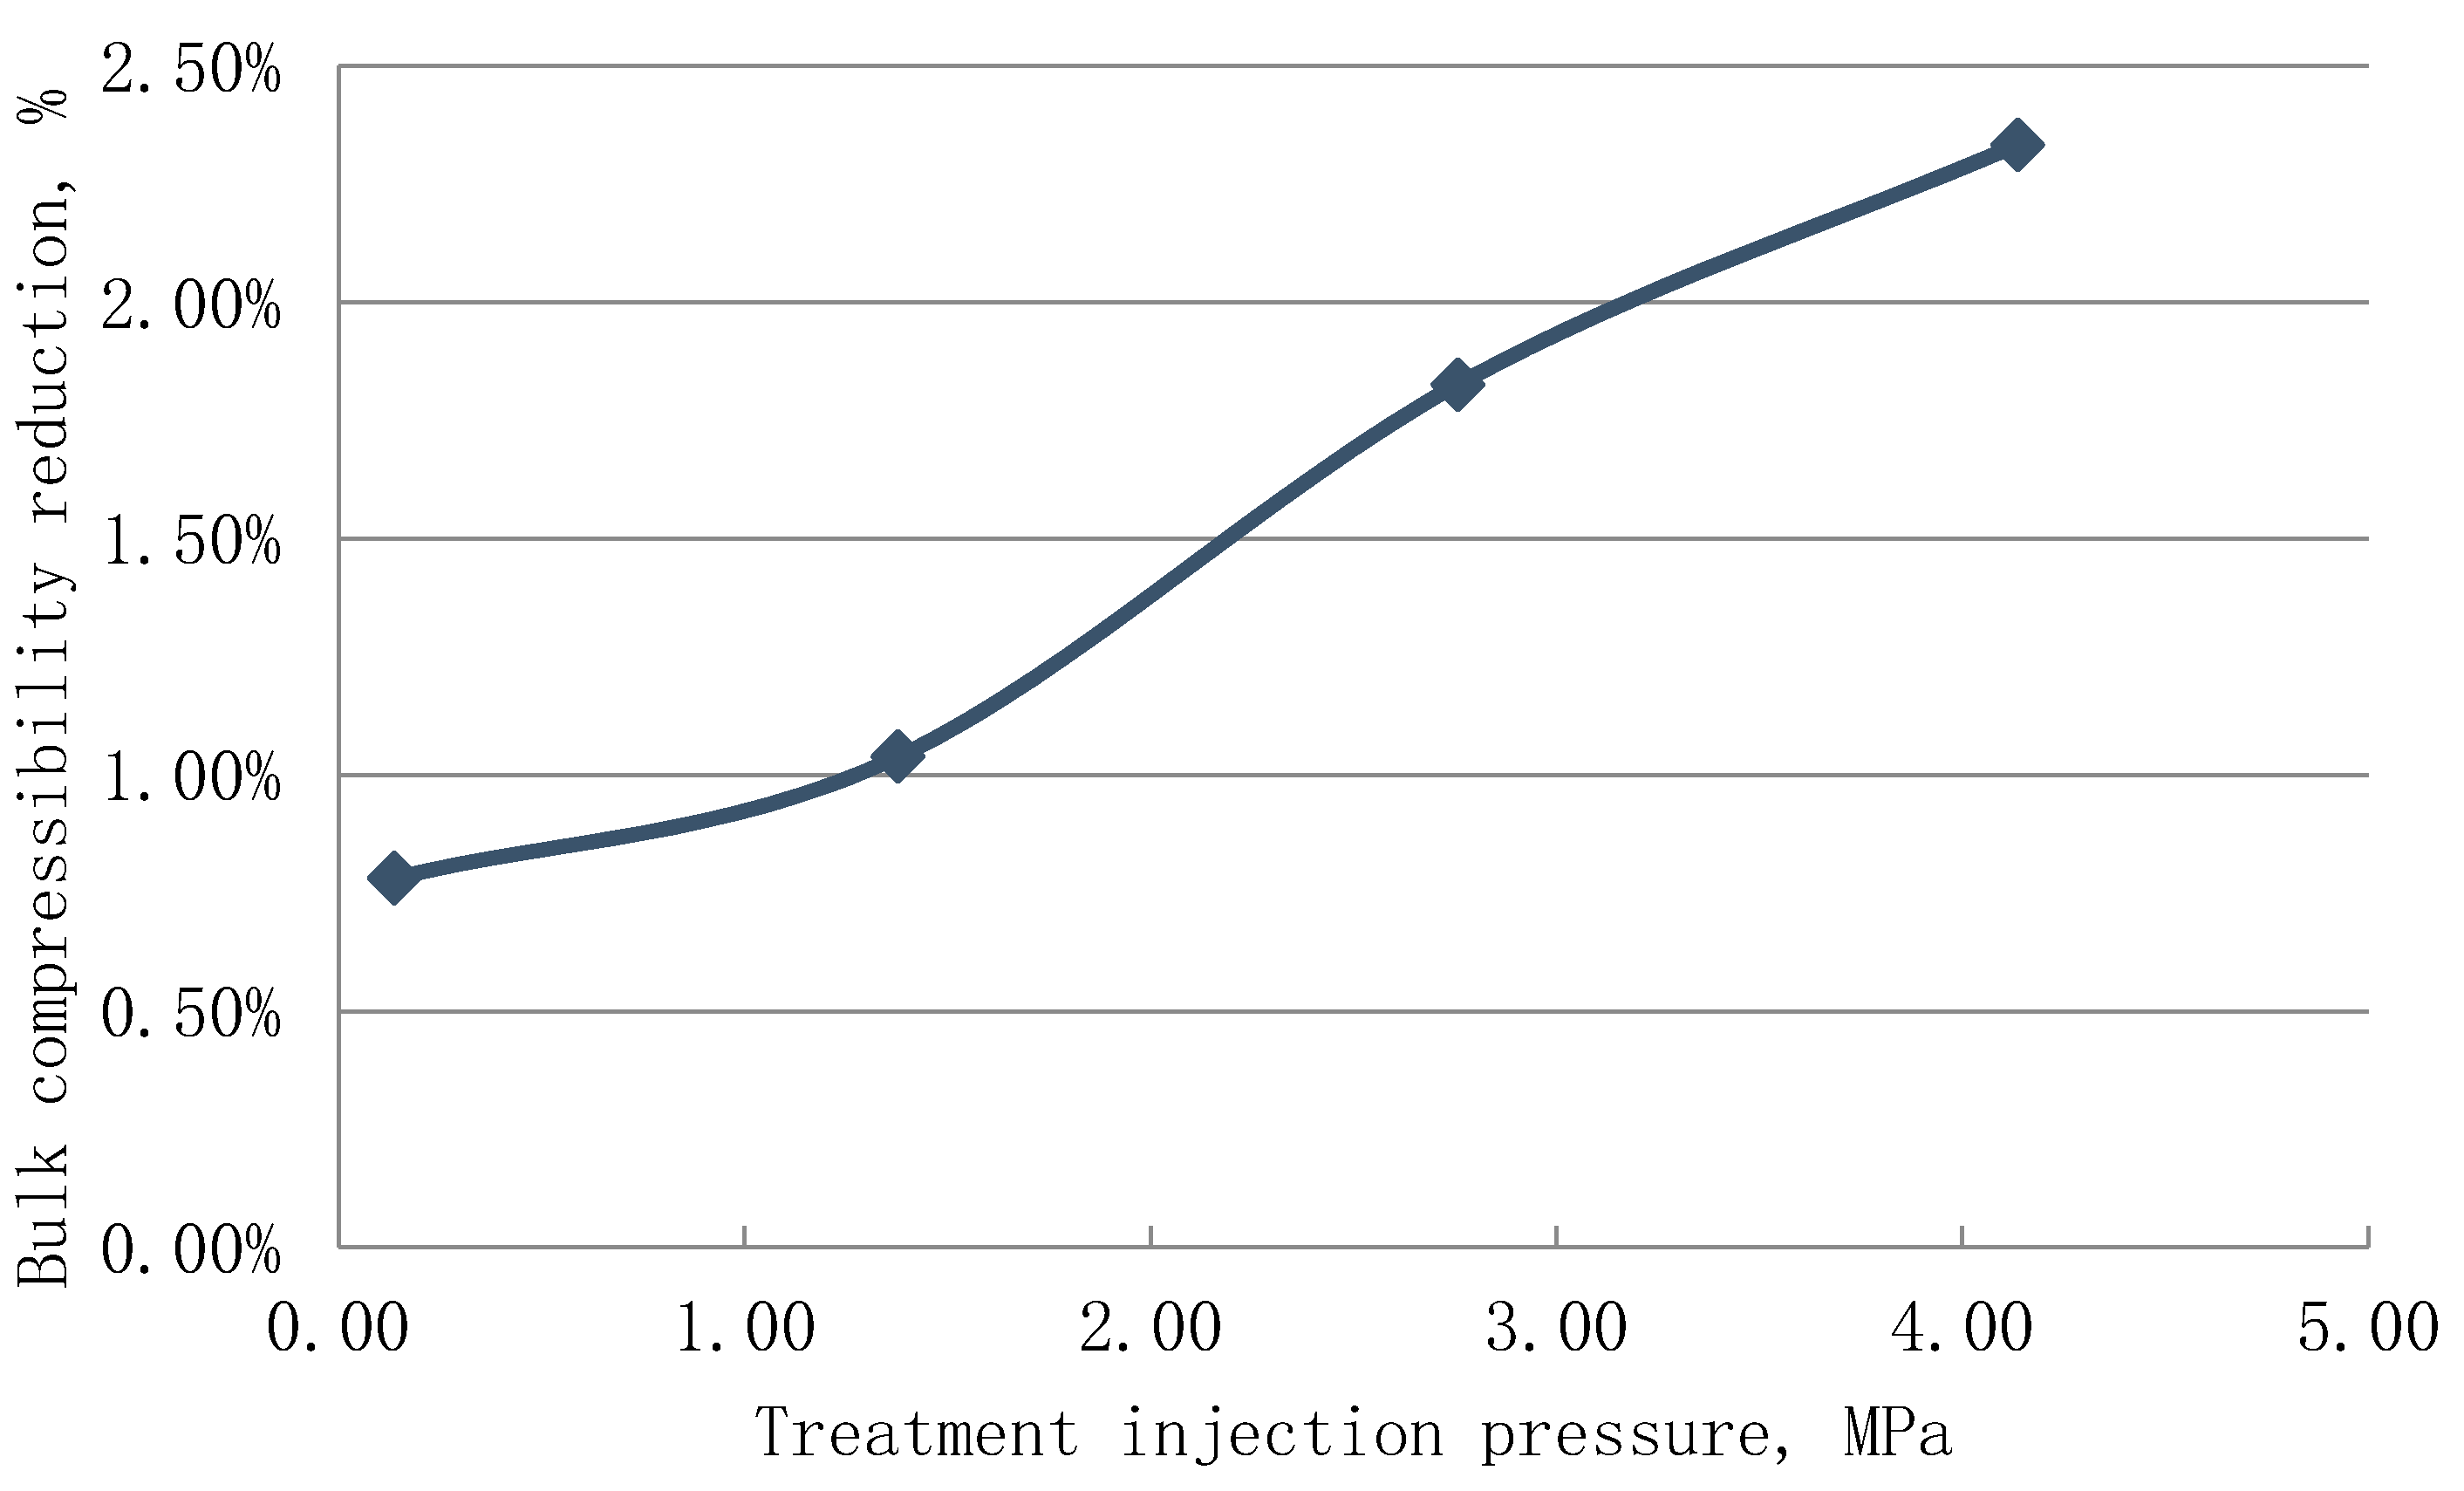
3. Results and Discussion
4. Conclusions
Author Contributions
Funding
Conflicts of Interest
References
- U.S. EIA. Drilling Productivity Report, for Key Tight Oil and Shale Gas Regions; U.S. Energy Information Administration: Washington, DC, USA, 2015.
- King, H. Hydraulic Fracturing of Oil & Gas Wells Drilled in Shale. 2011. Available online: https://geology.com/articles/hydraulic-fracturing/ (accessed on 14 November 2020).
- Mohanty, K.K.; Tong, S.; Miller, C.; Zeng, T.; Honarpour, M.M.; Turek, E.; Peck, D.D. Improved hydrocarbon recovery using mixtures of energizing chemicals in unconventional reservoirs. SPE Reserv. Eval. Eng. 2019, 22, 1436–1448. [Google Scholar] [CrossRef]
- Warpinski, N.R.; Mayerhofer, M.J.; Vincent, M.C.; Cipolla, C.L.; Lolon, E. Stimulating unconventional reservoirs: Maximizing network growth while optimizing fracture conductivity. J. Can. Pet. Technol. 2009, 48, 39–51. [Google Scholar] [CrossRef]
- Zoback, M.D.; Kohli, A.H. Unconventional Reservoir Geomechanics; Cambridge University Press: Cambridge, UK, 2019. [Google Scholar]
- Teklu, T.W.; Park, D.; Jung, H.; Amini, K.; Abass, H. Effect of Dilute Acid on Hydraulic Fracturing of Carbonate-Rich Shales: Experimental Study. SPE Prod. Oper. 2019, 34, 170–184. [Google Scholar] [CrossRef]
- EIA. Review of Emerging Resources: U.S. Shale Gas and Shale Oil Plays; U.S. Energy Information Administration: Washington, DC, USA, 2011.
- Zammerilli, A. Projecting the Economic Impact of Marcellus Shale Gas Development in West Virginia: A Preliminary Analysis Using Publicly Available Data; DOE/NETL Final Report; Department of Energy National Energy technology Laboratory: Morgantown, WV, USA, 2010; 37p.
- Higley, D.K.; Enomoto, C.E.; Leathers-Miller, H.M.; Ellis, G.S.; Mercier, T.J.; Schenk, C.J.; Trippi, M.H.; Le, P.A.; Brownfield, M.E.; Woodall, C.A. Assessment of Undiscovered Gas Resources in the Middle Devonian Marcellus Shale of the Appalachian Basin Province, 2019; Fact Sheet 2327-6932; US Geological Survey: Reston, VA, USA, 2019.
- Zhou, Q.; Dilmore, R.; Kleit, A.; Wang, J.Y. Evaluating fracture-fluid flowback in Marcellus using data-mining technologies. SPE Prod. Oper. 2016, 31, 133–146. [Google Scholar] [CrossRef]
- Avary, K.; Lewis, J. New Interest in Cores Taken Thirty Years Ago: The Devonian Marcellus Shale in Northern West Virginia. In Proceedings of the AAPG Eastern Section Meeting, Pittsburgh, PA, USA, 11–15 October 2008. [Google Scholar]
- Boyce, M.L.; Carr, T.R. Lithostratigraphy and petrophysics of the Devonian Marcellus interval in West Virginia and southwestern Pennsylvania. GCSSEPM Proc. 2009, 10, 254–281. [Google Scholar]
- Roen, J.B. Geology of the Devonian black shales of the Appalachian Basin. Org. Geochem. 1984, 5, 241–254. [Google Scholar] [CrossRef]
- Wrightstone, G.; Shale, M. Regional overview from an industry perspective (abs.). In Proceedings of the AAPG Eastern Section Meeting, Pittsburgh, PA, USA, 11–15 October 2008. [Google Scholar]
- Zielinski, R.E.; McIver, R.D. Resource and Exploration Assessment of the Oil and Gas Potential in the Devonian Gas Shales of the Appalachian Basin; Monsanto Research Corp.: Miamisburg, OH, USA, 1981. [Google Scholar]
- Peucker-Ehrenbrink, B. Dating Weathering of Organic-rich Shales with U-Series Disequilibrium. In Proceedings of the Eleventh Annual VM Goldschmidt Conference, Hot Springs, VA, USA, 20–24 May 2001. [Google Scholar]
- Gupta, N.; Mishra, B. Creep Characterization of Marcellus Shale. In Proceedings of the 51st US Rock Mechanics/Geomechanics Symposium, San Francisco, CA, USA, 25–28 June 2017. [Google Scholar]
- Piane, C.D.; Josh, M.; Dautriat, J.; Sarout, J.; Giwelli, A.; Luzin, V.; Clennell, B.; Dewhurst, D. Contrasting anisotropy of velocity and electric/dielectric response in the Marcellus and Utica Shales. In SEG Technical Program Expanded Abstracts 2018; Society of Exploration Geophysicists: Houston, TX, USA, 2018; pp. 3608–3612. [Google Scholar]
- Crandall, D.; Paronish, T.; Brown, S.; Martin, K.; Moore, J.; Carr, T.R.; Panetta, B. CT Scanning and Geophysical Measurements of the Marcellus Formation from the Tippens 6HS Well; National Energy Technology Lab. (NETL): Morgantown, WV, USA, 2018.
- Morsy, S.; Gomaa, A.; Sheng, J. Imbibition characteristics of Marcellus shale formation. In Proceedings of the SPE Improved Oil Recovery Symposium, Tulsa, OK, USA, 12–16 April 2014. [Google Scholar]
- Janszen, M.; Bakker, T.; Zitha, P. Hydraulic Fracturing in the Dutch Posedonia Shale. In Proceedings of the SPE European Formation Damage Conference and Exhibition, Budapest, Hungary, 3–5 June 2015. [Google Scholar]
- Kolawole, O.; Ispas, I. Interaction between hydraulic fractures and natural fractures: Current status and prospective directions. J. Pet. Explor. Prod. Technol. 2020, 10, 1613–1634. [Google Scholar] [CrossRef] [Green Version]
- Wang, L.; Yao, B.; Cha, M.; Alqahtani, N.B.; Patterson, T.W.; Kneafsey, T.J.; Miskimins, J.L.; Yin, X.; Wu, Y.-S. Waterless fracturing technologies for unconventional reservoirs-opportunities for liquid nitrogen. J. Nat. Gas Sci. Eng. 2016, 35, 160–174. [Google Scholar] [CrossRef] [Green Version]
- Vardar, Ö.; Finnie, I. The prediction of fracture in brittle solids subjected to very short duration tensile stresses. Int. J. Fract. 1977, 13, 115–131. [Google Scholar] [CrossRef]
- Cha, M.; Alqahtani, N.B.; Yao, B.; Yin, X.; Kneafsey, T.J.; Wang, L.; Wu, Y.-S.; Miskimins, J.L. Cryogenic fracturing of wellbores under true triaxial-confining stresses: Experimental investigation. SPE J. 2018, 23, 1271–1289. [Google Scholar] [CrossRef] [Green Version]
- McDaniel, B.; Grundmann, S.R.; Kendrick, W.D.; Wilson, D.R.; Jordan, S.W. Field applications of cryogenic nitrogen as a hydraulic fracturing fluid. In Proceedings of the SPE Annual Technical Conference and Exhibition, San Antonio, TX, USA, 5–8 October 1997. [Google Scholar]
- Grundmann, S.; Rodvelt, G.; Dials, G.; Allen, R. Cryogenic Nitrogen As a Hydraulic Fracturing Fluid in the Devonian Shale, SPE Eastern Regional Meeting; Society of Petroleum Engineers: Pittsburgh, PA, USA, 1998. [Google Scholar]
- Rassenfoss, S. In search of the waterless fracture. J. Pet. Technol. 2013, 65, 46–54. [Google Scholar] [CrossRef]
- Kim, K.; Kemeny, J. Effect of thermal shock and rapid unloading on mechanical rock properties. In Proceedings of the 43rd US Rock Mechanics Symposium & 4th US-Canada Rock Mechanics Symposium, Asheville, NC, USA, 28 June–1 July 2009. [Google Scholar]
- Cha, M.; Yin, X.; Kneafsey, T.; Johanson, B.; Alqahtani, N.; Miskimins, J.; Patterson, T.; Wu, Y.-S. Cryogenic fracturing for reservoir stimulation–Laboratory studies. J. Pet. Sci. Eng. 2014, 124, 436–450. [Google Scholar] [CrossRef] [Green Version]
- Alqatahni, N.B.; Cha, M.; Yao, B.; Yin, X.; Kneafsey, T.J.; Wang, L.; Wu, Y.-S.; Miskimins, J.L. Experimental investigation of cryogenic fracturing of rock specimens under true triaxial confining stresses. In Proceedings of the SPE Europec featured at 78th EAGE conference and exhibition, Vienna, Austria, 30 May–2 June 2016. [Google Scholar]
- Jiang, L.; Cheng, Y.; Han, Z.; Gao, Q.; Yan, C.; Wang, G.; Wang, H.; Fu, L. Experimental Investigation on Pore Characteristics and Carrying Capacity of Longmaxi Shale Under Liquid Nitrogen Freezing and Thawing. In Proceedings of the IADC/SPE Asia Pacific Drilling Technology Conference and Exhibition, Bangkok, Thailand, 27–29 August 2018. [Google Scholar]
- Elwegaa, K.; Emadi, H.; Ramezanian, M. Investigating Effects of Thermal Shock Technique on Unconventional Reservoir Rock Mechanical Properties. In Proceedings of the 53rd US Rock Mechanics/Geomechanics Symposium, New York, NY, USA, 23–26 June 2019. [Google Scholar]
- Khalil, R.; Emadi, H. An experimental investigation of cryogenic treatments effects on porosity, permeability, and mechanical properties of Marcellus downhole core samples. J. Nat. Gas Sci. Eng. 2020, 81, 103422. [Google Scholar] [CrossRef]
- Yang, B.; Wang, H.; Wang, B.; Shen, Z.; Zheng, Y.; Jia, Z.; Yan, W. Digital quantification of fracture in full-scale rock using micro-CT images: A fracturing experiment with N2 and CO2. J. Pet. Sci. Eng. 2021, 196, 107682. [Google Scholar] [CrossRef]
- Siddiqui, S.; Khamees, A.A. Dual-energy CT-scanning applications in rock characterization. In Proceedings of the SPE annual technical conference and exhibition, Houston, TX, USA, 26–29 September 2004. [Google Scholar]
- Al Shafloot, T.; Kim, T.W.; Kovscek, A. Investigating Fracture Propagation Characteristics in Shale Using sc-CO2 and Water with the Aid of X-ray Computed Tomography. J. Nat. Gas Sci. Eng. 2020, 103736. [Google Scholar] [CrossRef]
- Khalil, R.; Emadi, H.; Elwegaa, K. Investigation of rock properties of the Marcellus formation—An experimental study. In Proceedings of the SPE Eastern Regional Meeting, Charleston, WV, USA, 15–17 October 2019. [Google Scholar]
- Eloranta, P. Drill Hole KFM01A: Indirect Tensile Strength Test (HUT); SKB P04171; Svensk Kärnbränslehantering AB: Stockholm, Sweden, 2004. [Google Scholar]
- Guo, Y.; Wang, L.; Chang, X. Study on the damage characteristics of gas-bearing shale under different unloading stress paths. PLoS ONE 2019, 14, e0224654. [Google Scholar] [CrossRef] [PubMed]
- He, J.; Lin, C.; Li, X.; Wan, X. Experimental investigation of crack extension patterns in hydraulic fracturing with shale, sandstone and granite cores. Energies 2016, 9, 1018. [Google Scholar] [CrossRef] [Green Version]
- Ko, T.; Kemeny, J. Effect of confining stress and loading rate on fracture toughness of rocks. In Proceedings of the 1st Canada-US Rock Mechanics Symposium, Vancouver, BC, Canada, 27–31 May 2007. [Google Scholar]
- Lin, C.; He, J.; Li, X.; Wan, X.; Zheng, B. An experimental investigation into the effects of the anisotropy of shale on hydraulic fracture propagation. Rock Mech. Rock Eng. 2017, 50, 543–554. [Google Scholar] [CrossRef]
- Zhang, Y.; He, J.; Li, X.; Lin, C. Experimental study on the supercritical CO2 fracturing of shale considering anisotropic effects. J. Pet. Sci. Eng. 2019, 173, 932–940. [Google Scholar] [CrossRef]
- Kate, J. Influence of saturation on dynamic elastic constants of sandstones. In Proceedings of the ISRM International Symposium-EUROCK 2012, Stockholm, Sweden, 28–30 May 2012. [Google Scholar]
- Lai, B.; Li, H.; Zhang, J.; Jacobi, D.; Georgi, D. Water-content effects on dynamic elastic properties of organic-rich shale. SPE J. 2016, 21, 635–647. [Google Scholar] [CrossRef]
- Olsen, C.; Fabricius, I.L. Static and dynamic Young’s modulus of North Sea chalk. In SEG Technical Program Expanded Abstracts 2006; Society of Exploration Geophysicists: Houston, TX, USA, 2006; pp. 1918–1922. [Google Scholar]
- Saxena, V.; Krief, M.; Adam, L. Handbook of Borehole Acoustics and Rock Physics for Reservoir Characterization; Elsevier: Amsterdam, The Netherlands, 2018. [Google Scholar]
- Zoback, M.D. Reservoir Geomechanics; Cambridge University Press: Cambridge, UK, 2010. [Google Scholar]
- Freund, D. Ultrasonic compressional and shear velocities in dry clastic rocks as a function of porosity, clay content, and confining pressure. Geophys. J. Int. 1992, 108, 125–135. [Google Scholar] [CrossRef] [Green Version]
- Yu, H.; Zhang, Y.; Lebedev, M.; Wang, Z.; Li, X.; Squelch, A.; Verrall, M.; Iglauer, S. X-ray micro-computed tomography and ultrasonic velocity analysis of fractured shale as a function of effective stress. Mar. Pet. Geol. 2019, 110, 472–482. [Google Scholar] [CrossRef]


| Group A | Group B | Group C | Group D | |||||||
|---|---|---|---|---|---|---|---|---|---|---|
| Sample # | M4 | M8 | M11 | M16 | M15 | M19 | M20 | M6 | M9 | M12 |
| Density, kg/m3 | 2615 | 2622 | 2615 | 2627 | 2620 | 2622 | 2623 | 2618 | 2618 | 2625 |
| Average, kg/m3 | 2615 | 2621 | 2622 | 2620 | ||||||
| Treatment pressure | 0.14 MPa | 1.38 MPa | 2.76 MPa | 4.14 MPa | ||||||
| Porosity Before LN2 | 13.71% | 10.99% | 7.14% | 8.51% | 8.74% | 10.66% | 9.51% | 6.43% | 9.03% | 8.66% |
| Average | 13.71% | 8.88% | 9.64% | 8.04% | ||||||
| Porosity after LN2 | 14.13% | 12.29% | 9.58% | 11.44% | 12.47% | 13.55% | 11.97% | 10.89% | 11.90% | 13.33% |
| Average | 14.13% | 11.10% | 12.66% | 12.04% | ||||||
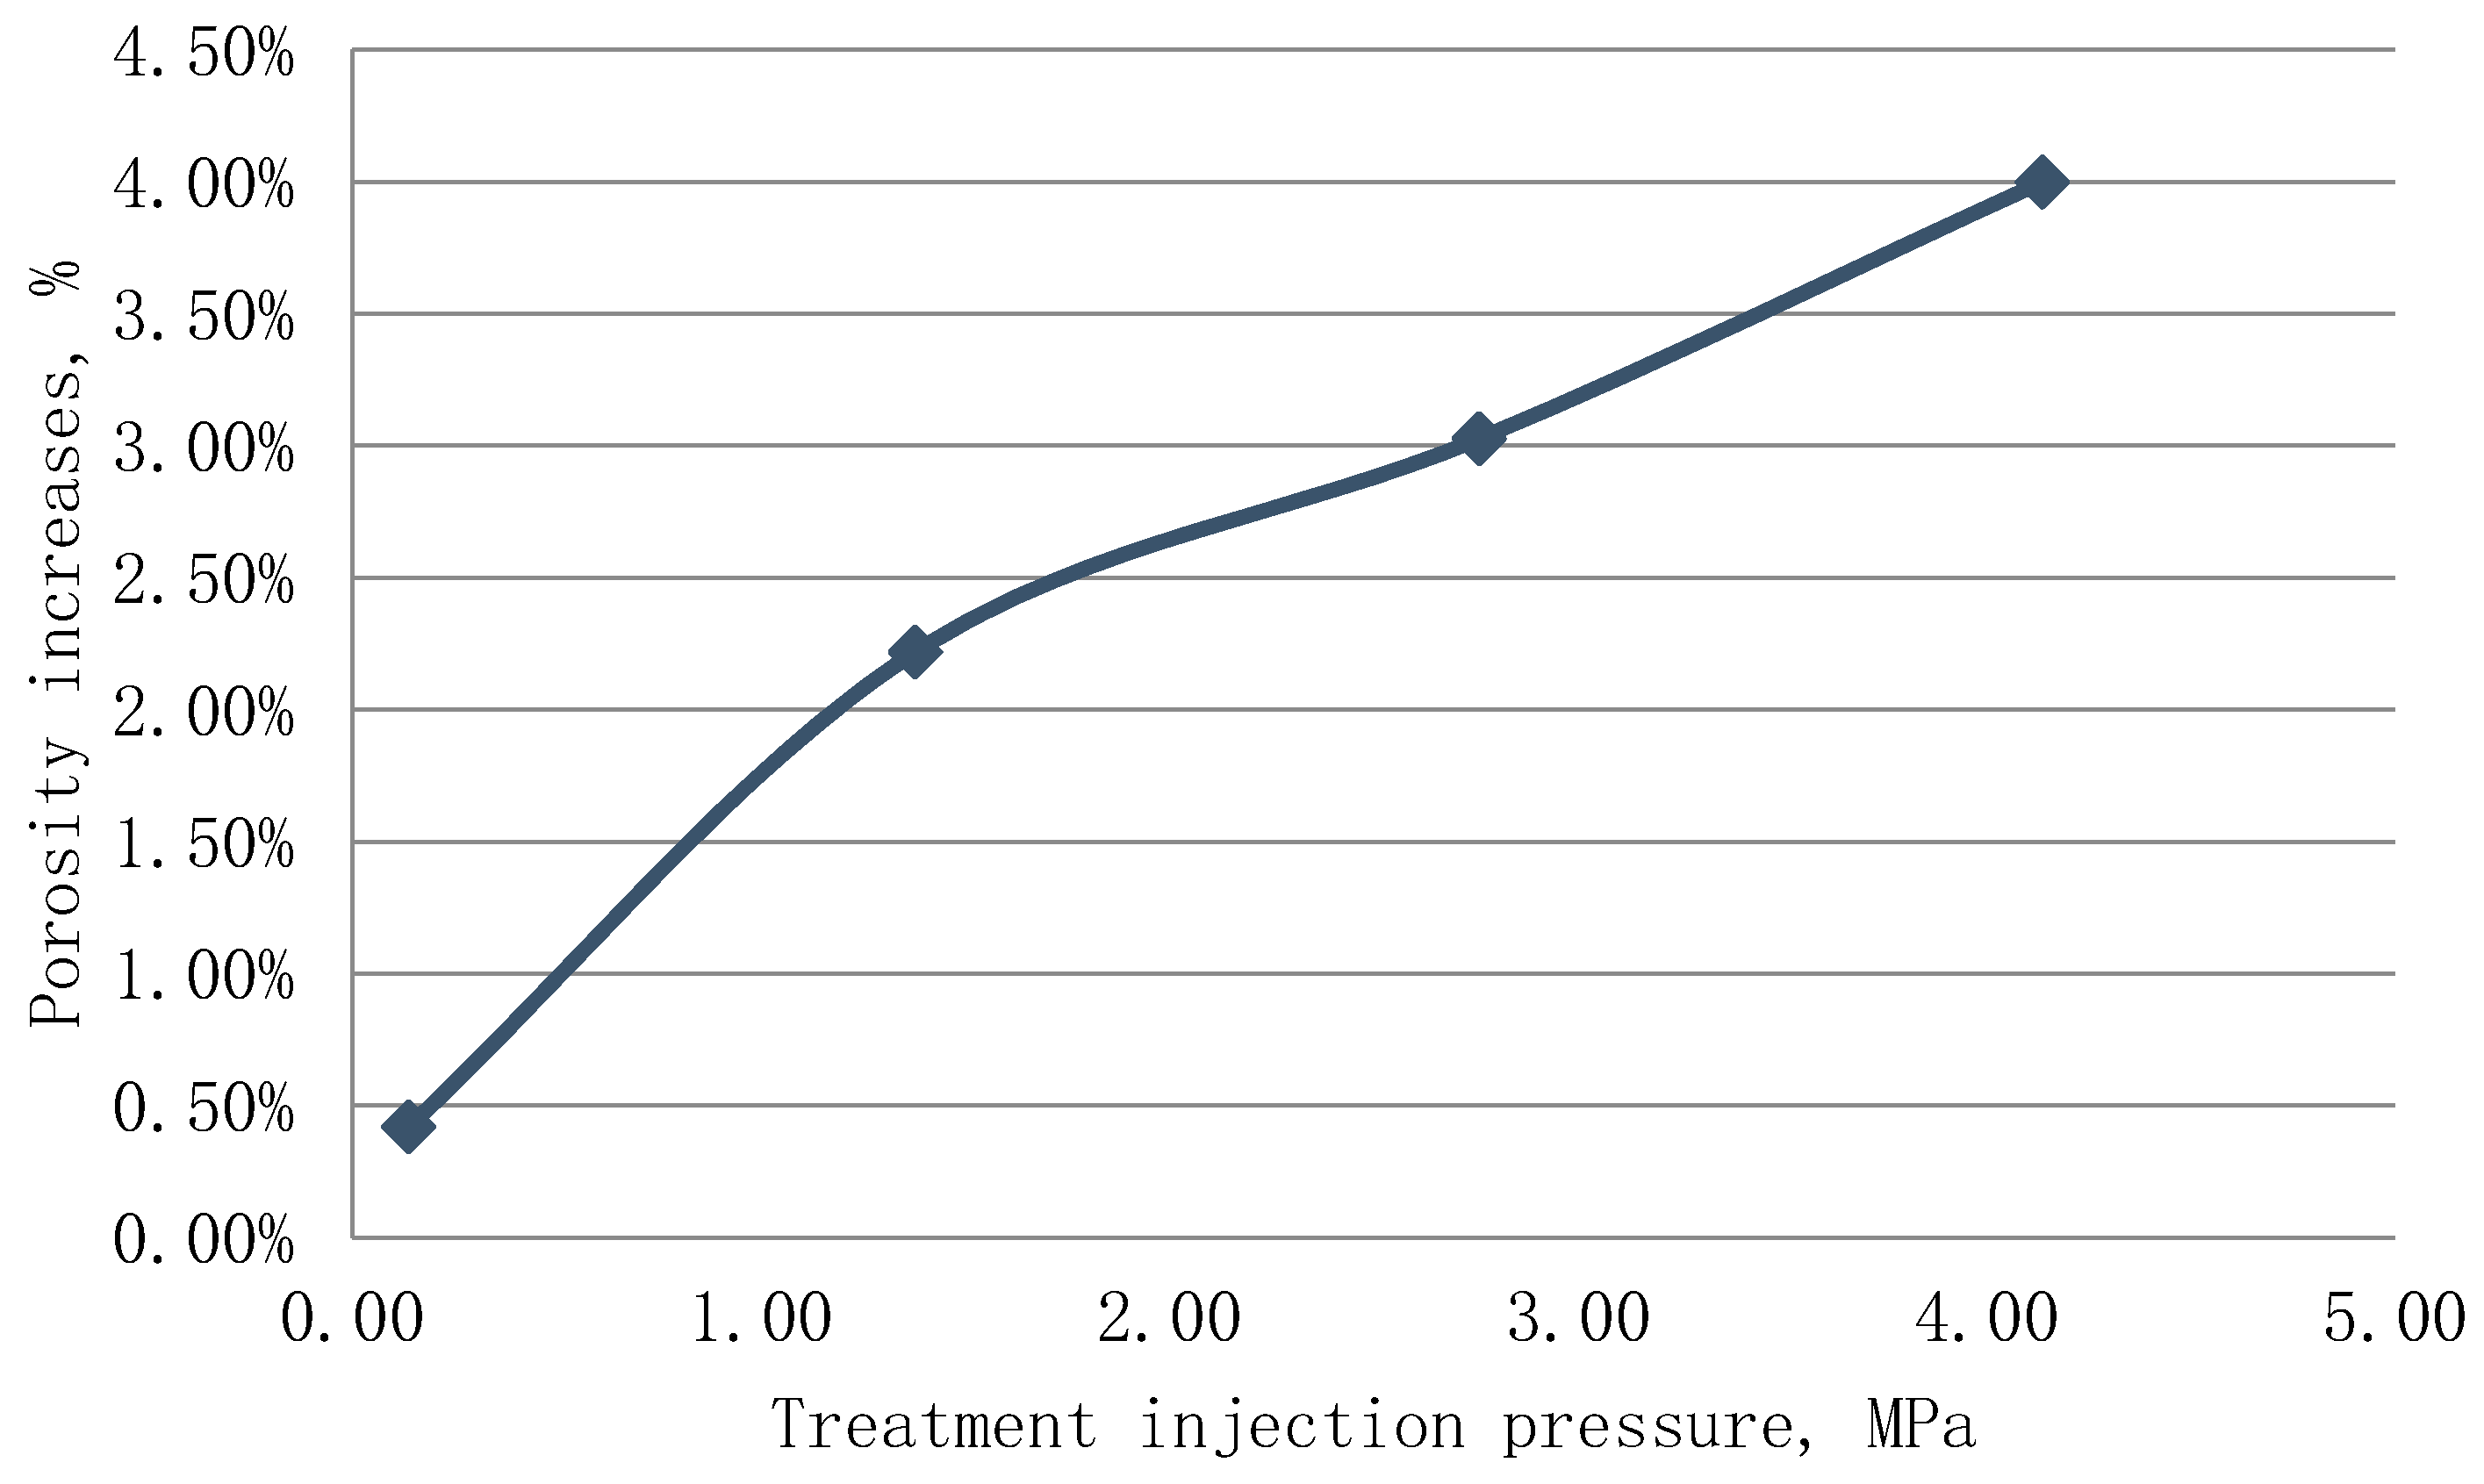
| Porosity Increase | 0.42% | 2.22% | 3.03% | 4.00% | ||||||
| Perm Before LN2, nD | 49.50 | 11.00 | 4.69 | 23.10 | 13.20 | 9.53 | 17.50 | 15.80 | 5.50 | 6.80 |
| Average, nD | 49.50 | 12.93 | 13.41 | 9.37 | ||||||
| Perm After LN2, nD | 1060 | 1470 | 2075 | 13,500 | 14,500 | 10,500 | 27,900 | 168,667 | 14,600 | 211,000 |
| Average, nD | 1060 | 5682 | 17,633 | 131,422 | ||||||
| Perm Increase, folds of increase over matrix permeability | 21 | 439 | 1315 | 14,031 | ||||||
Publisher’s Note: MDPI stays neutral with regard to jurisdictional claims in published maps and institutional affiliations. |
© 2021 by the authors. Licensee MDPI, Basel, Switzerland. This article is an open access article distributed under the terms and conditions of the Creative Commons Attribution (CC BY) license (http://creativecommons.org/licenses/by/4.0/).
Share and Cite
Khalil, R.; Emadi, H.; Altawati, F. Effects of Pressurizing Cryogenic Treatments on Physical and Mechanical Properties of Shale Core Samples—An Experimental Study. Gases 2021, 1, 33-50. https://doi.org/10.3390/gases1010003
Khalil R, Emadi H, Altawati F. Effects of Pressurizing Cryogenic Treatments on Physical and Mechanical Properties of Shale Core Samples—An Experimental Study. Gases. 2021; 1(1):33-50. https://doi.org/10.3390/gases1010003
Chicago/Turabian StyleKhalil, Rayan, Hossein Emadi, and Faisal Altawati. 2021. "Effects of Pressurizing Cryogenic Treatments on Physical and Mechanical Properties of Shale Core Samples—An Experimental Study" Gases 1, no. 1: 33-50. https://doi.org/10.3390/gases1010003
APA StyleKhalil, R., Emadi, H., & Altawati, F. (2021). Effects of Pressurizing Cryogenic Treatments on Physical and Mechanical Properties of Shale Core Samples—An Experimental Study. Gases, 1(1), 33-50. https://doi.org/10.3390/gases1010003