Article

Immunophenotyping and Functional Characterization of NK Cells in SARS-CoV-2 Infection

1
Department of Medical Microbiology and Immunology “Prof. Dr. Elissay Yanev”, and Research Institute, Medical University of Plovdiv, 4002 Plovdiv, Bulgaria
2
Infectious Diseases Clinic, University Hospital “St. George”, 4000 Plovdiv, Bulgaria
3
Institute of Molecular Biology, Bulgarian Academy of Sciences, Acad. G. Bonchev Str. Bl. 21, 1113 Sofia, Bulgaria
*
Author to whom correspondence should be addressed.
Immuno 2025, 5(3), 35; https://doi.org/10.3390/immuno5030035
Submission received: 23 June 2025 / Revised: 9 August 2025 / Accepted: 11 August 2025 / Published: 15 August 2025
(This article belongs to the Section Innate Immunity and Inflammation)

Abstract

The immune response to SARS-CoV-2 infection involves significant alterations in the phenotype and function of natural killer (NK) cells. This study aimed to investigate the dynamic changes in NK cell subsets during COVID-19 by analyzing their activation and inhibitory markers [CD3, CD14, CD16, CD19, CD25, CD45, CD56, CD57, CD69, CD159a (NKG2A), CD159c (NKG2C), CD314 (NKG2D), CD335 (NKp46)], cytotoxic potential (perforin, interferon-gamma, granzyme B), and direct cytotoxicity against a newly genetically modified K562 cell line. Peripheral blood samples were collected from COVID-19 patients on days 3–5 and day 30 post-symptom onset and were compared to healthy controls. 16-color flow cytometry analysis revealed distinct shifts in NK cell subpopulations, characterized by increased expression of the inhibitory receptor NKG2A and the activating receptors NKG2D and NKG2C, particularly in the CD56+CD16 subset. Elevated IFN-γ production on day 30 suggested a recovery-phase immune response, while the persistent upregulation of NKG2A indicated an ongoing regulatory mechanism. The CD16+CD56 subpopulation exhibited increased expression of the markers CD69 and CD25 over time; however, its cytotoxic potential, assessed through granzyme B levels and direct cytotoxicity assays, remained lower than that of healthy controls. Significant correlations were observed between CD57 and CD69 expression, as well as NKp46 and IFN-γ production, highlighting a coordinated balance between activation and regulatory mechanisms. These findings suggest that NK cells undergo functional adaptation during COVID-19, displaying signs of partial exhaustion while retaining antiviral potential. Understanding the interplay between NK cell activation and suppression may provide valuable insights into immune dysregulation in COVID-19 and inform potential therapeutic interventions.

1. Introduction

The COVID-19 pandemic, caused by the novel coronavirus SARS-CoV-2, has had a profound global impact, revealing complex interactions between the virus and the human immune system [1]. Among the most affected components of the immune response are NK cells—key effectors of the innate immune system that play a critical role in the early detection and elimination of virally infected cells [2]. NK cells contribute to immune defense through cytotoxic mechanisms and the secretion of cytokines such as interferon-gamma (IFN-γ), enabling rapid responses to viral threats [3].
Emerging evidence has revealed that SARS-CoV-2 infection leads to substantial dysregulation of NK cell function, with these alterations strongly correlating with disease severity and clinical outcomes [1]. Maucourant et al. demonstrated the presence of distinct NK cell immunotypes that are associated with severe COVID-19, indicating virus-driven reshaping of NK cell responses [2]. Functionally, COVID-19 patients exhibit impaired NK cell cytotoxicity and diminished cytokine production, particularly affecting the CD56bright NK cell subset, which normally plays a central role in cytokine-mediated antiviral defense [3]. This functional impairment is thought to be driven, at least in part, by elevated pro-inflammatory cytokines—such as interleukin-6 (IL-6)—which suppress the expression of activating NK cell receptors and contribute to an overall immunosuppressive state [4,5].
A growing body of literature highlights significant changes in NK cell receptor expression profiles during SARS-CoV-2 infection. Specifically, there is an upregulation of inhibitory receptors, including NKG2A and killer cell immunoglobulin-like receptors (KIRs), which has been linked to NK cell exhaustion and reduced cytotoxic potential [2,6,7,8]. In healthy individuals, NK cell activation is balanced by a repertoire of activating receptors such as NKG2D, NKp30, NKp44, and NKp46. However, in COVID-19 patients, a shift toward inhibitory signaling impairs NK cell function and antiviral capacity [4,5,9,10]. Notably, increased expression of NKG2A has been associated with reduced IFN-γ and TNF-α production, hallmarks of dysfunctional NK cell responses [3,11,12]. In addition, SARS-CoV-2 has been shown to downregulate ligands for activating receptors like NKG2D, further impairing the immune system’s ability to clear infected cells [9,13].
Beyond the acute phase, NK cell dysfunction may persist, potentially contributing to the long-term immunological sequelae observed in some COVID-19 survivors. Persistent alterations in NK cell phenotype—marked by sustained activation and signs of exhaustion—have been reported post-infection, raising concerns about their role in recovery dynamics and susceptibility to reinfection [14]. These findings underscore the importance of further characterizing NK cell responses in COVID-19 to inform future therapeutic strategies and improve long-term patient outcomes.
In this study, we investigated the dynamic changes in NK cell phenotype and function in COVID-19 patients by analyzing cell surface and cytoplasmic biomarker expression, alongside direct cytotoxicity against the K562mNG cell line. By comparing NK cell subpopulations across two time points with those of healthy controls, we aimed to characterize receptor expression patterns, effector functions, and potential dysfunction, with the goal of identifying immunological alterations relevant to disease progression, recovery, and therapeutic targeting.

2. Materials and Methods

2.1. Patients’ Selection

In this laboratory-based, observational, non-interventional study, two separate groups of COVID-19 patients were enrolled: during SARS-CoV-2 infection—Period 1 (P1) after a positive PCR test (performed upon hospital administration)—and the convalescent period (P2), 30 days after the positive PCR test. Group P1 consisted of 5 individuals: 3 females, 2 males with a mean age of 32.6 ± 3.77 years, who were administered at the infectious disease clinic at “St. George” University Hospital approximately 3–5 days after symptom onset. Symptoms included fever, headache, nausea, muscle aches, and shortness of breath; and lasted between 5 and 10 days. P2 included 15 individuals: 7 females, 8 males with a mean age of 35.47 ± 6.16 years. The patient cohort consisted of individuals with moderate SARS-CoV-2 infection, as defined by clinical and radiological signs of pneumonia without the need for supplemental oxygen, who were hospitalized for a period of up to two weeks for monitoring and supportive treatment. While no formal age or gender matching was performed during recruitment, the distributions of age and gender were similar between the two groups. The control group included healthy subjects (HC) (n = 20; 34.2 ± 6.96 years) with no history of SARS-CoV-2 infection. The conduction of this study was approved by the Research Ethics Committee of the Medical University of Plovdiv (4/4 May 2023).

2.2. Blood Samples’ Collection

Samples were collected during the first half of 2023. Peripheral blood mononuclear cells (PBMCs) were isolated from the peripheral blood samples by density gradient centrifugation [15]. Subsequently, the cells were frozen in 10% DMSO and stored at −80 °C until examination was performed [16].

2.3. Methods

2.3.1. Immunophenotyping

NK immunophenotyping was performed via flow cytometry, using a panel of monoclonal antibodies specific for the following surface receptors: CD3-BUV395, CD14-BV605, CD16-APC, CD19-BV605, CD25-PE-CF594, CD45-BUV496, CD56-BB700, CD57-FITC, CD69-PE, CD159a-BV480 (NKG2A), CD159c-BV786 (NKG2C), CD314-BV650 (NKG2D), CD335-BV711 (NKp46). The choice of NK cell markers was guided by biological relevance and the availability of validated antibodies in our laboratory at the time of the study. Dead cells were excluded from the analysis using Fixable Viability Stain780. For cytoplasmic labelling the following monoclonal antibodies were applicable: anti-perforin-BV421, anti-interferon-gamma-PE-Cy7, and anti-granzyme-B-R718. Intracellular staining was performed with BD Cytofix/Cytoperm, according to the manufacturer’s protocol. The samples were analyzed on a 16 color FACSAria III flow cytometer.
Based on the expression of CD16 and CD56, four subpopulations of NK cells were distinguished: CD56+CD16, CD16+CD56+, CD16+CD56 and CD56dimCD16 (Figure S1). CD16bright and CD16dim subsets were excluded from the final analysis due to low event counts across multiple samples, which precluded reliable statistical evaluation.
The expression levels of y-IFN, granzyme-B, perforin, CD57, CD69, CD25, NKG2D, NKp46, NKG2C, and NKG2A were analyzed in each of the subpopulations and presented as Median Fluorescent Intensity (MFI).

2.3.2. Direct Cytotoxicity Assay of NK Cells

To assess NK cell cytotoxicity, we used the K562 target cell line (ECACC, Cat. No. 89121407), which was endogenously labeled with nuclear fluorescent protein in order to facilitate the cytotoxicity assay by removing the extra step of fluorescently labeling the target cells. Within the modified K562mNG cell line, in order to establish the expression of PARP1, endogenously tagged with the fluorescent protein mNeonGreen, we performed genome editing by the use of CRISPR-Alt-R HighFidelity Cas9 technology from IDTDNA. The crRNA sequence used for targeting the poly(ADP-ribose) polymerase 1 (PARP1) gene was selected by the use of Geneious Prime ver. 2024.0 software, and is as follows: TAAGACCTCCCTGTGGTAAT. The synthetic pUC57-Mini PARP1-mNeonGreen donor plasmid was synthesized de novo by GeneScript (GenScript Biotech Corporation, Piscataway, NJ, USA). The donor plasmid encoded the left (0.2 kb) and right (0.2 kb) homology arms for the C-terminus of PARP1, and in addition, the mNeonGreen sequence. A linker sequence (5′ GGTGGAGGCGGTTCAGGCGGAGGTGGCTCTGGCGGTGGCGGATCG 3′) between the last codon of PARP1 and the mNeonGreen sequence was inserted to allow preservation of the protein conformation after the addition of the fluorescent tag.
A direct cytotoxicity assay of NK cells (DCA) via flow cytometry was performed [17,18]. Briefly, isolated PBMCs from participants were stimulated with 0.1 μg/106 cells IL-2 for 12 h, and then effector cells (E) were mixed with target cells (T) from the K562mNG line in a 20:1 ratio (E:T) and incubated for 4 h at 37 °C. The cells were then labeled with monoclonal antibodies against various cell-surface receptors to unambiguously distinguish NK cells from the rest of the sample (CD3-PerCP-Cy5.5, CD16-APC, CD45-AmCyan, CD56-APC, CD107a-PeCy7, propidium iodide). Sample analysis was performed on a FACS CantoII flow cytometer (Beckton Dickinson, Franklin Lakes, NJ, USA) with FACS DIVA software, ver. 6.1.3 (BD, San Jose, CA, USA). The percentage of dead target cells was calculated and presented as % specific cell death, according to the formula:
%   s p e c i f i c   c e l l   d e a t h = %   P I d e a d t a r g e t s %   s p o n t a n e o u s   P I   d e a d t a r g e t s 100 % s p o n t a n e o u s   P I d e a d t a r g e t s

2.4. Statistical Analysis

GraphPad Prism software ver. 8.0.1 and Python version 3.11.6 were used for statistical data processing. Normality of data distribution was assessed using the Shapiro–Wilk test. For data with a normal distribution, results are presented as mean ± standard deviation (SD). For non-normally distributed data, results are presented as median with interquartile range. Analyses included the Mann–Whitney U-test, Spearman’s correlation, and Linear regression. To control for Type I errors due to multiple comparisons, the significance levels were adjusted using the False Discovery Rate (FDR) correction method. Statistical significance was considered based on p value, where the threshold was set at ≤0.05.

3. Results

3.1. Distribution of NK Cell Subsets

Table 1 presents the distribution of four NK cell subpopulations—CD56+CD16+, CD56dim, CD56+CD16, and CD16+CD56—in peripheral blood from healthy controls and COVID-19 patients at two time points: P1 (early phase) and P2 (recovery phase). Among the observed changes, only two findings reached statistical significance: the frequency of CD56+CD16 cells was significantly higher at P2 compared to healthy controls (8.66% vs. 6.53%, p = 0.048), and the CD16+CD56 subset showed a significant increase from P1 to P2 (1.45% to 3.92%, p = 0.03). All other changes, including the apparent increase in the CD56+CD16+ subset from 18.35% at P1 to 38.89% at P2 (and 31.28% in healthy controls) and the recovery-related rise in the CD56dim subset (from 4.00% at P1 to 9.98% at P2, still below the healthy control level of 12.10%), did not reach statistical significance and should be interpreted as trends rather than definitive effects.

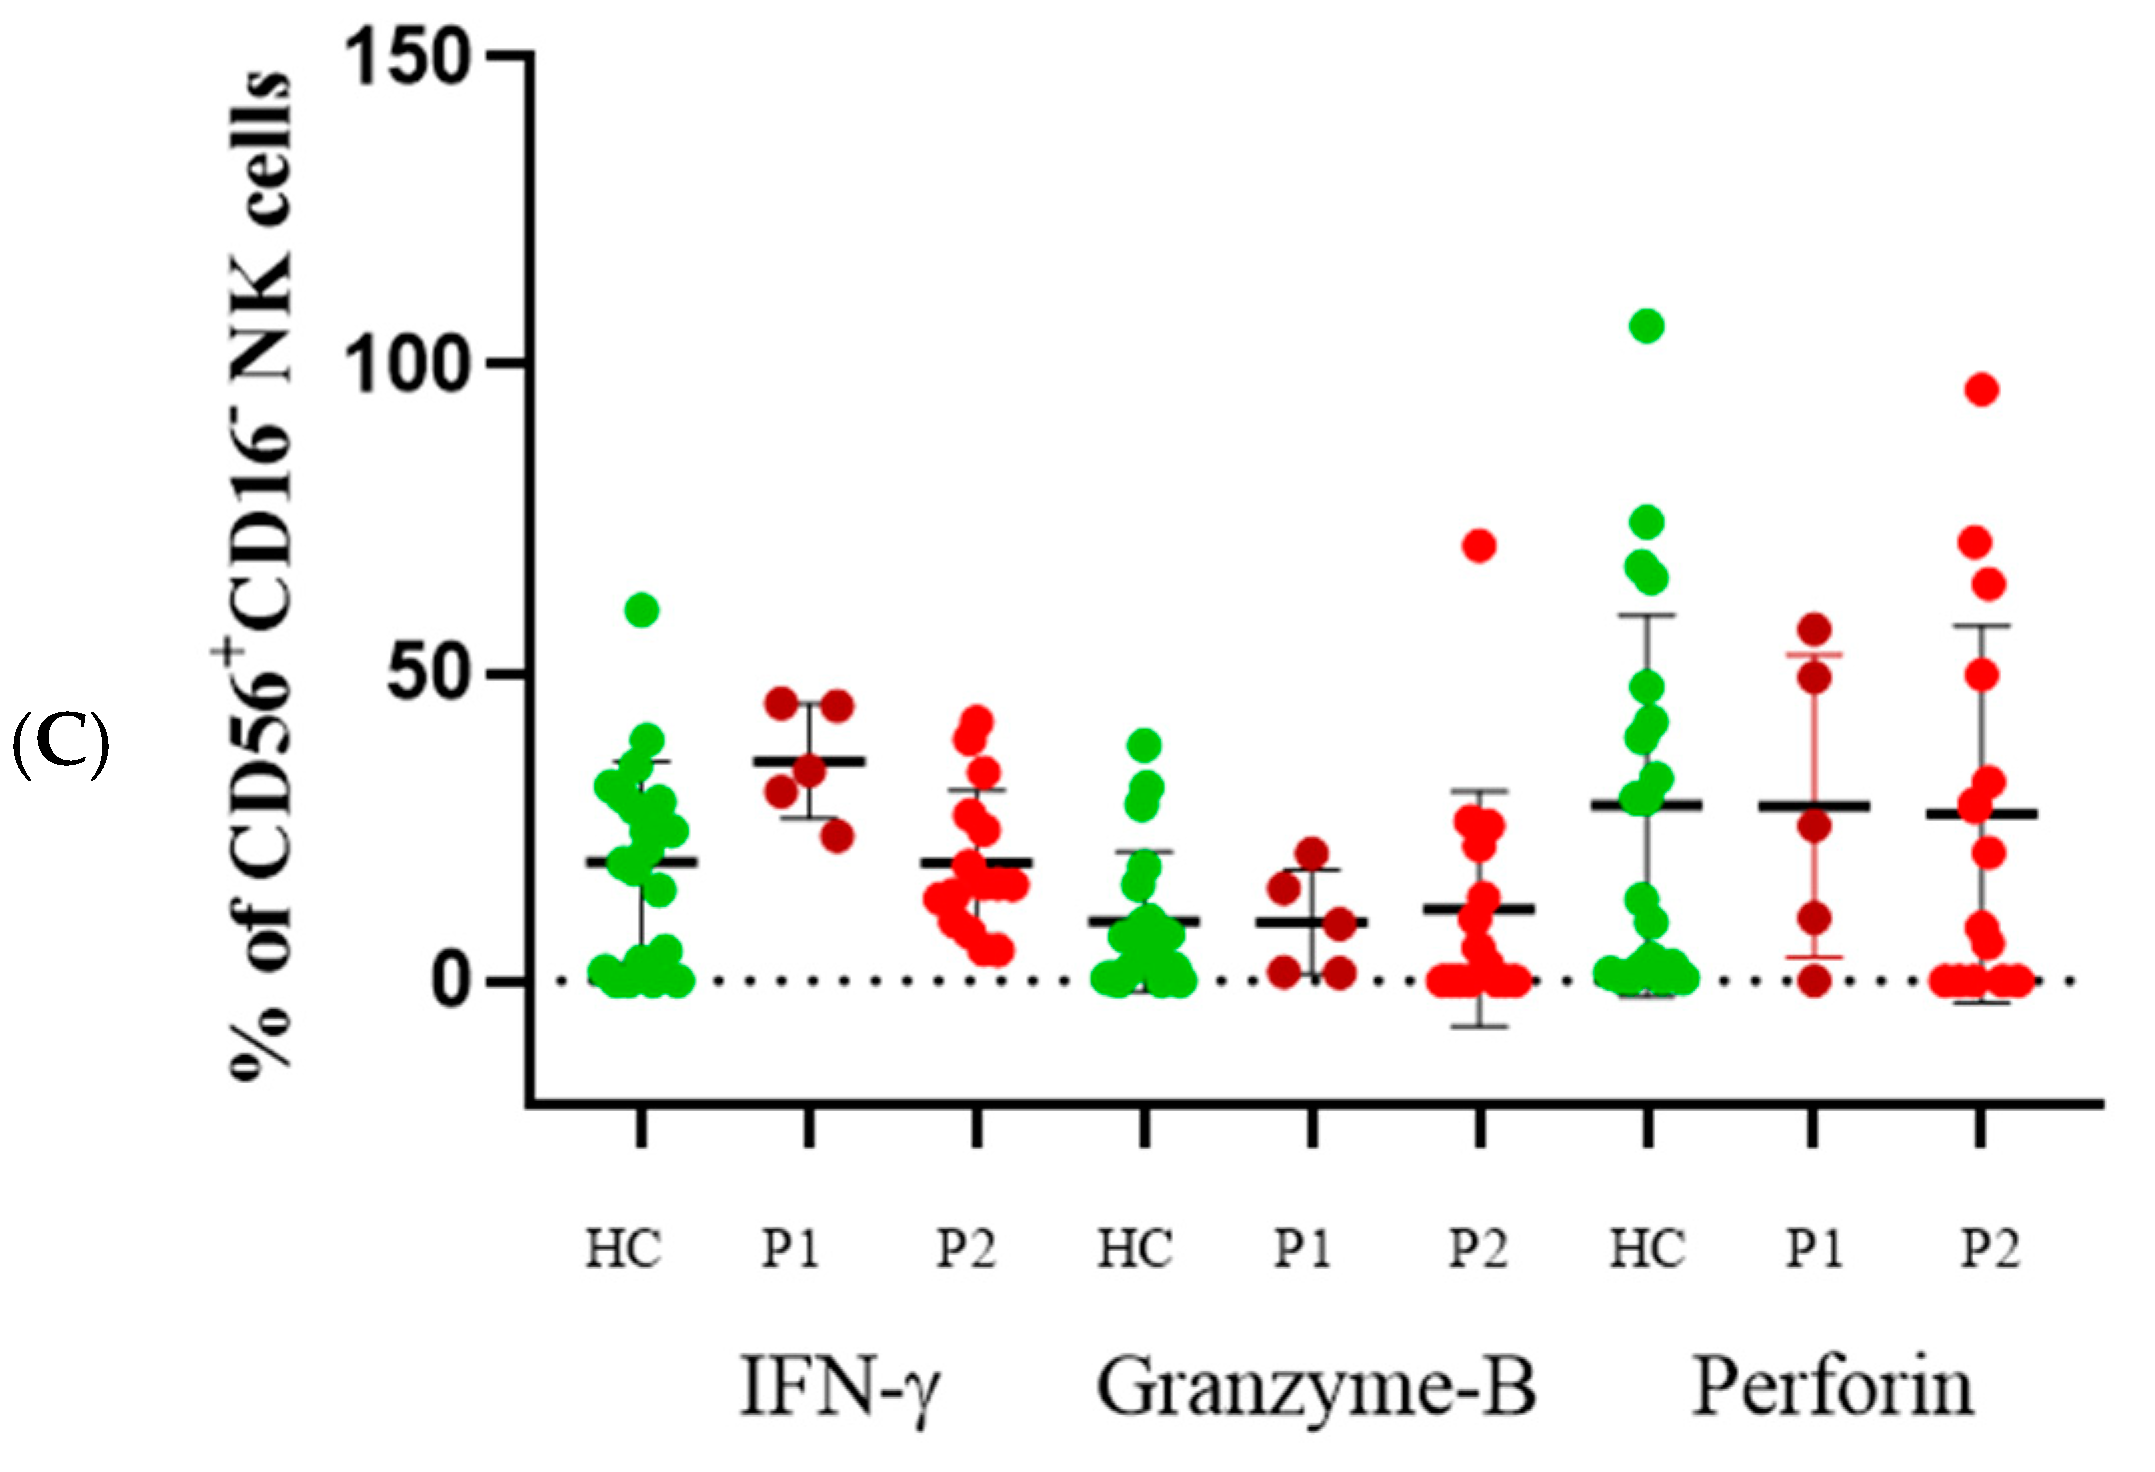
3.2. CD56+CD16 Cells

Results from P1 showed mean values of significantly increased NKG2A expression (56.05%), compared to P2 (46.86%, p = 0.0327) and healthy controls (19.23%, p = 0.0194) (Figure 1A). The same was observed for NKG2D expression (P1—86.45%, P2—78.36%, HC—47.21%). In terms of NKG2C expression, elevated levels compared to healthy controls were reported in both P1 (29.85%) and P2 (58.13%), with a peak reported in the latter. At P2, there was an even higher expression of NKG2A, as well as an increased percentage of NKG2D, NKG2C, and total number of cells belonging to this subpopulation.
Expression of receptors CD69 and CD25 showed no statistically significant differences between the HC, P1, and P2. Lower levels of CD69 were reported in P1 (0.75%) with an increase during P2 (3.11), rising above the HC levels (2.03%). CD25 showed a decrease in expression in both P1 (1.45%) and P2 (2.48%), compared to the healthy subjects (4.78) (Figure 1B). CD57 expression was observed on 1.8% of the cells at P1, on 10.28% at P2, and on 12.28% within the healthy controls in this NK cell subpopulation.
Intracellular staining for IFN-γ revealed higher levels in P1 (35.65%), which then declined in P2 (19.19%), reaching those of HC (19.82) (Figure 1C). Granzyme-B levels were similar between the three groups, with a tendency to increase in P2, without showing statistically significant differences (P1—9.6%, P2—13.59%, HC—10.09%). This pattern was also observed in terms of intracellular perforin expression (P1—28.35%, P2—30.37%, HC—28.48%).

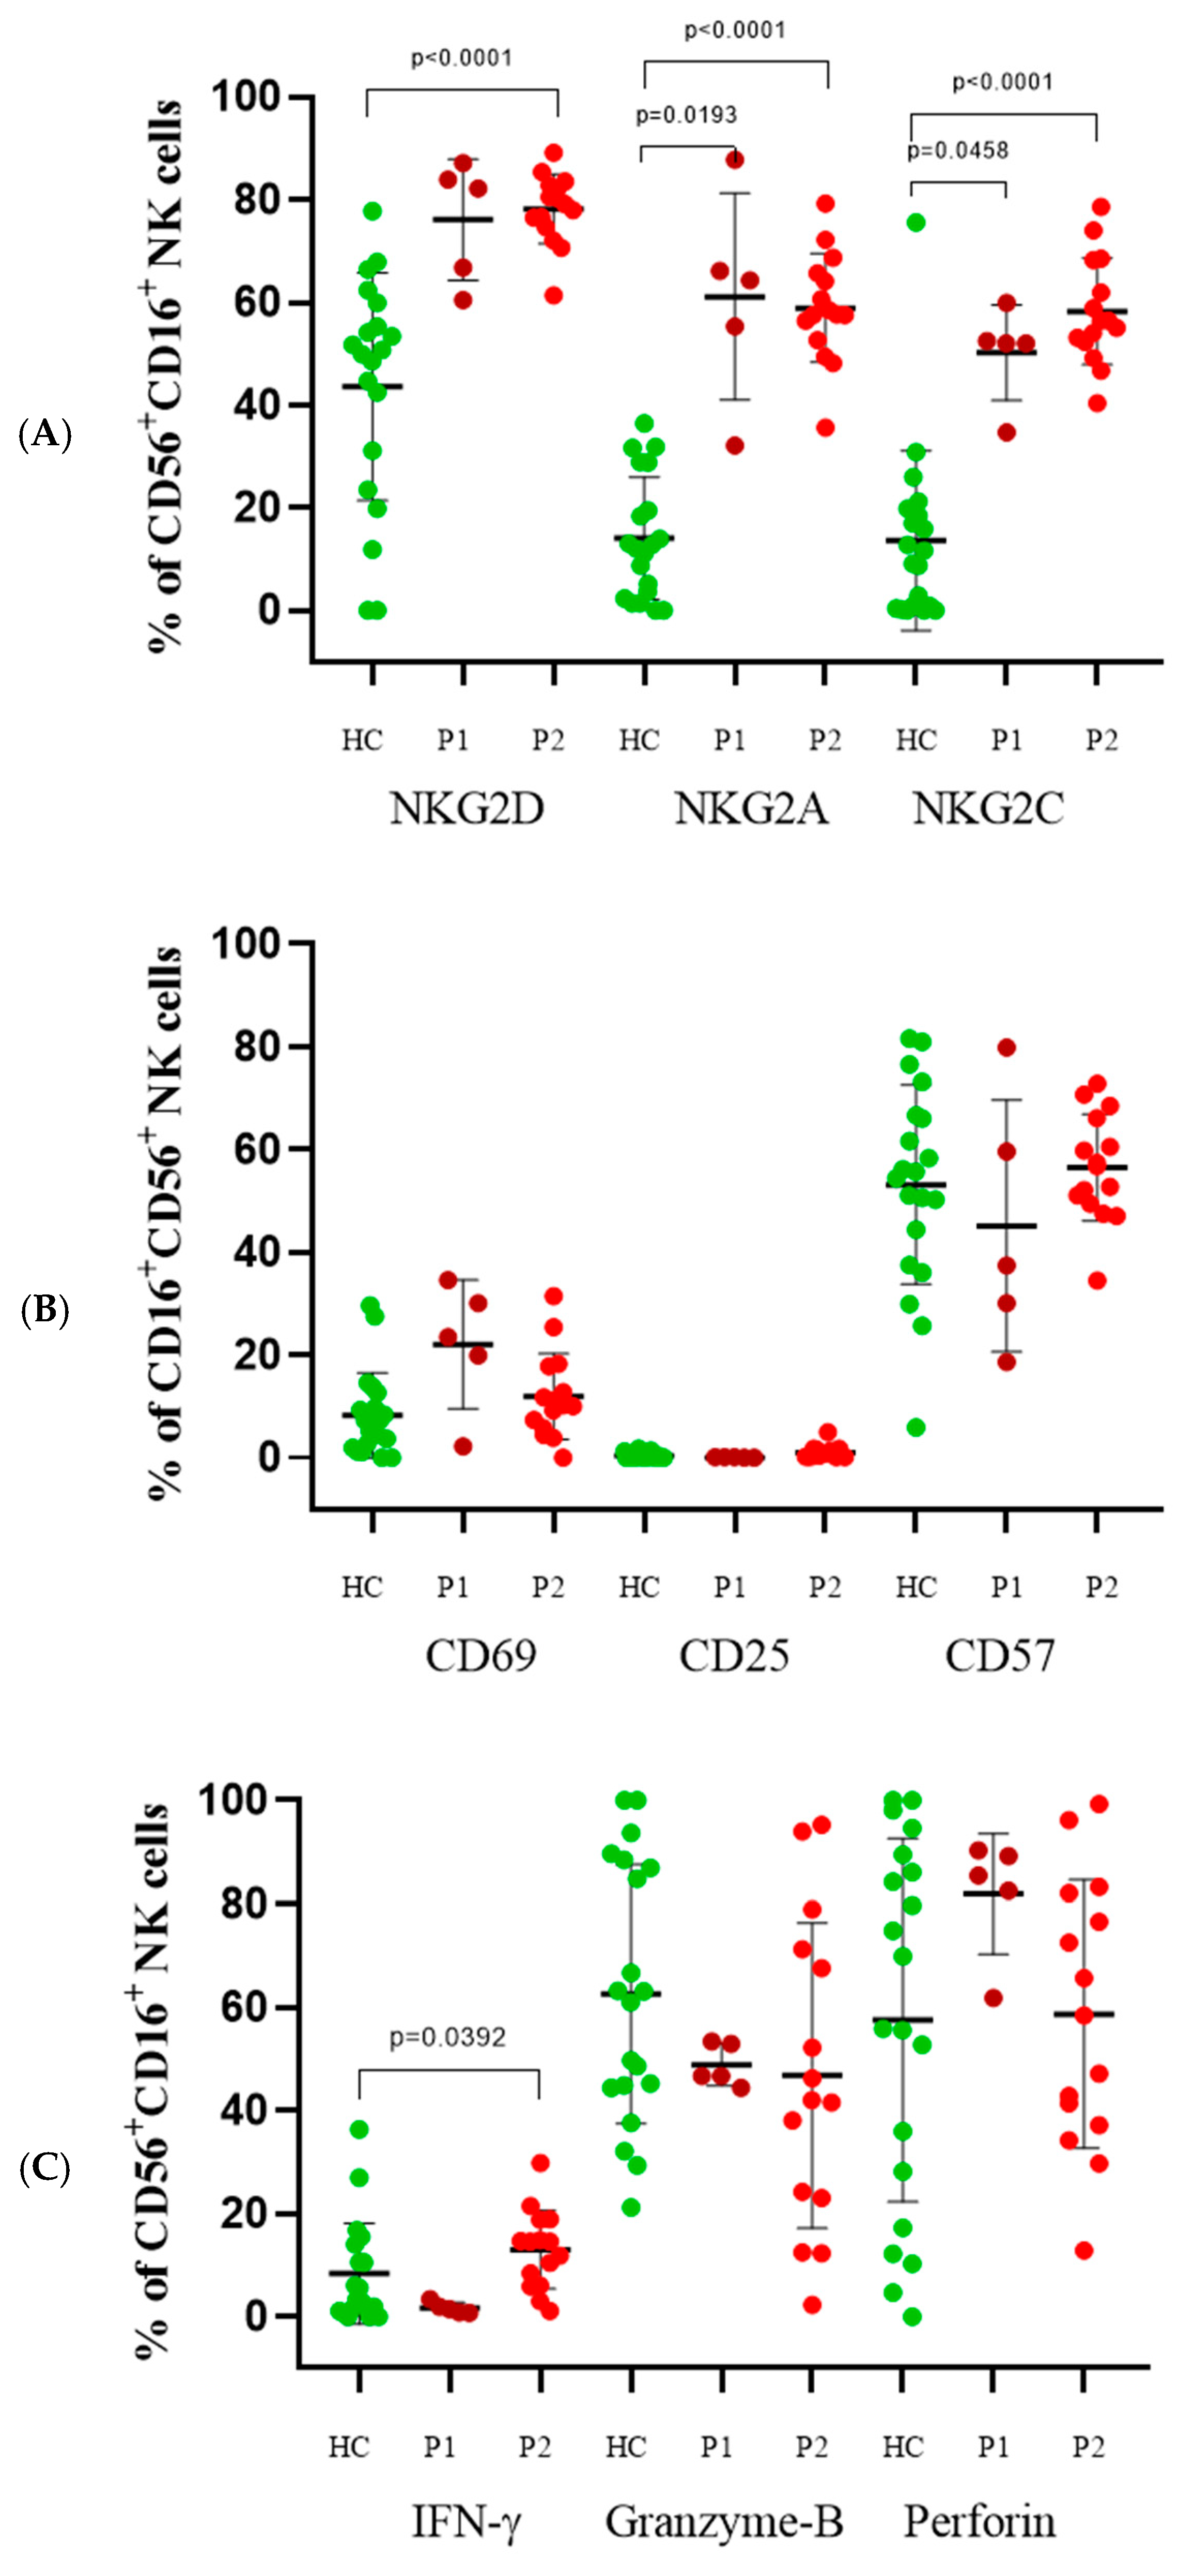
3.3. CD56+CD16+ Cells

In this subpopulation, we found higher levels of NKG2D at both time points compared to healthy subjects (P1—72.15%, P2—78.23%, HC—45.77%), with a statistically significant difference reported only between P2 and healthy subjects (Figure 2A). Results regarding NKG2A (P1—43.70%, P2—56.93%, HC—13.27%) and NKG2C receptors expression (P1—43.35%, P2—59.22%, HC—12.4%) were similar and elevated compared to healthy controls. The peak was reported in P2.
We reported higher mean levels of CD69-positive cells within this subpopulation in P1 (12.85%). Their levels drop in P2 (11.20%) but still exceed the HC (7.98%) (Figure 2B). The expression pattern for CD25 is lower levels during P1 (0.05%), which then drastically increased in P2 (0.9%), surpassing those of the healthy subjects (0.38%). Expression of CD57 showed slightly lower levels in P1 (44.85%), which then returned to those of HC (54.5%) and P2 (54.76%).
In this subpopulation, we also found decreased γ-interferon expression in P1 (2.15%) compared to healthy subjects (7.9%). Expression increased above the mean level of the control group at P2—14.03% (Figure 2C). Intracellular staining for the cytotoxic molecules granzyme-B and perforin is depicted in Figure 2C. Granzyme levels were lower in P1 (50.05%) compared to HC (61.88%) and further decreased in P2 (41.02%). Perforin expression was comparable between HC (56.99%) and P2 (59.74%). A peak, however, was found in P1 (76.05%).

3.4. CD16+CD56 Cells

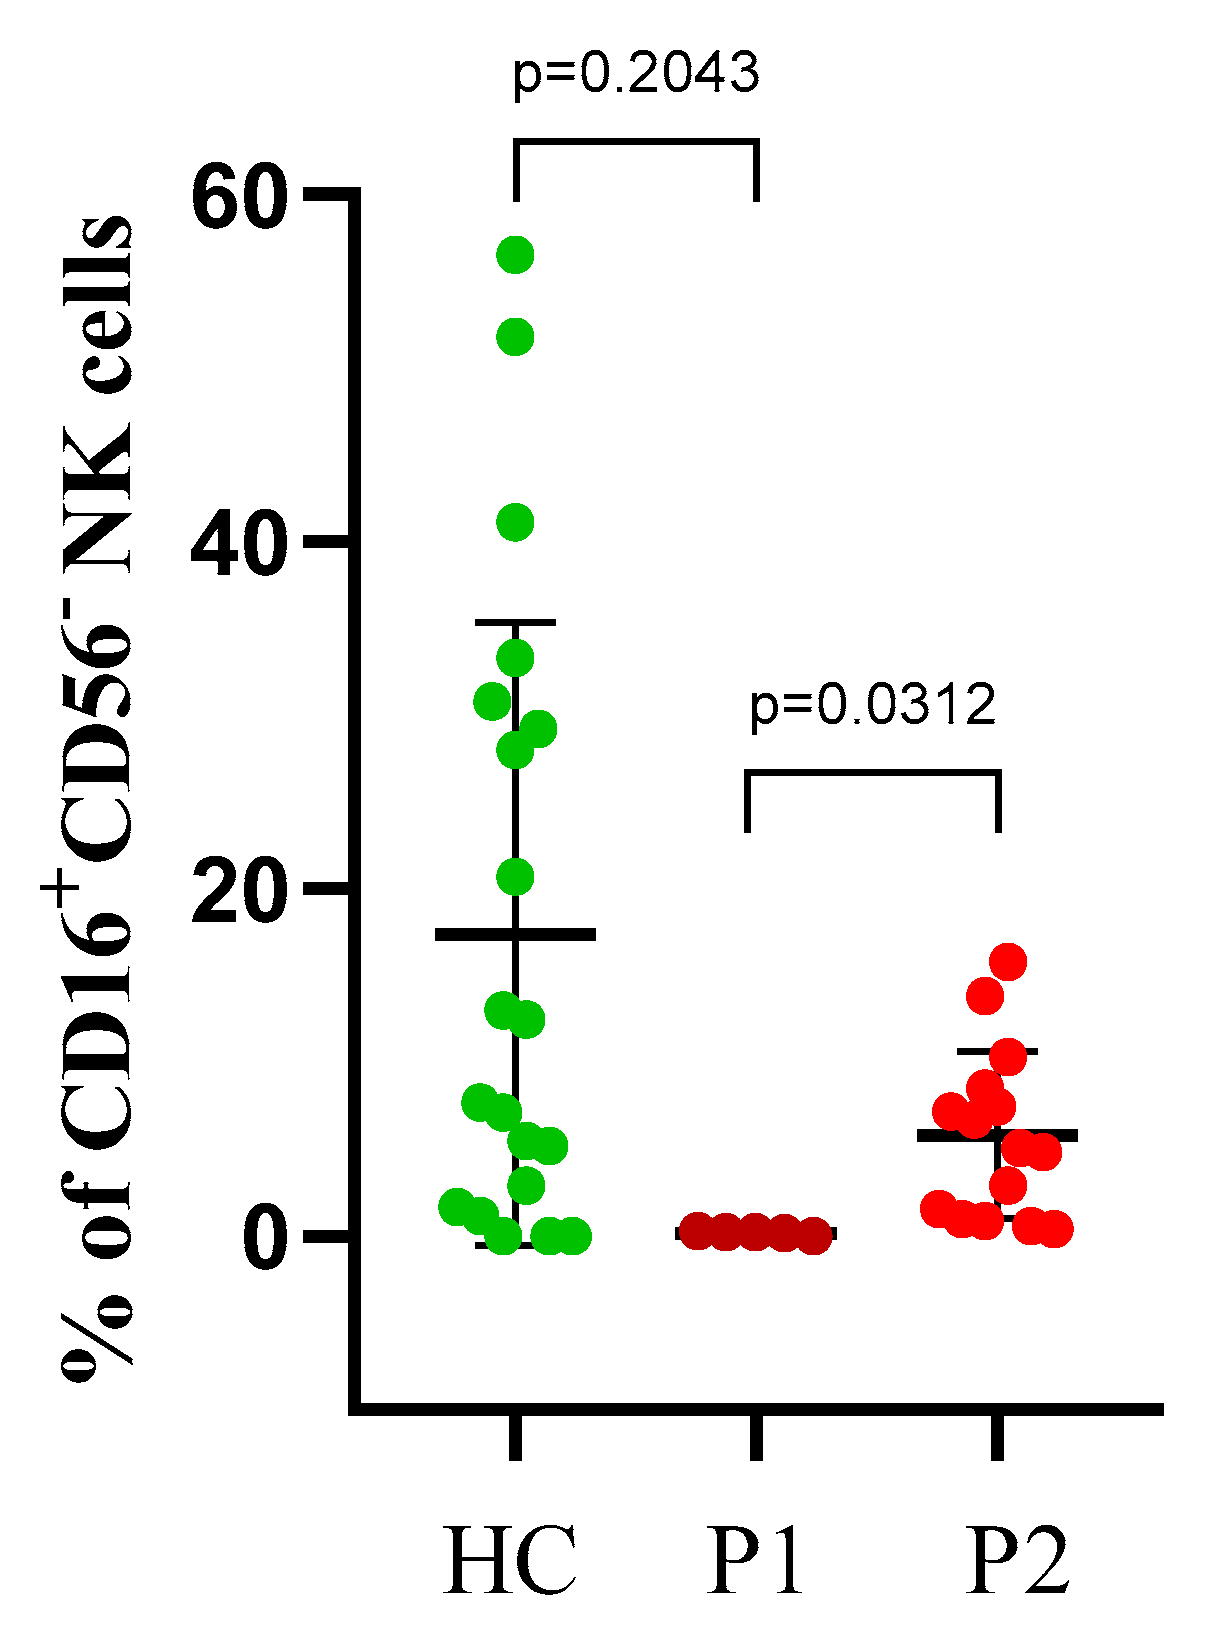
For the activating receptor NKp46, we observed almost absent expression in this subpopulation of cells in P1 (0.1%), which increased slightly in the P2 (5.83%) samples but did not reach the average values we report in the control group—17.58% (Figure 3).
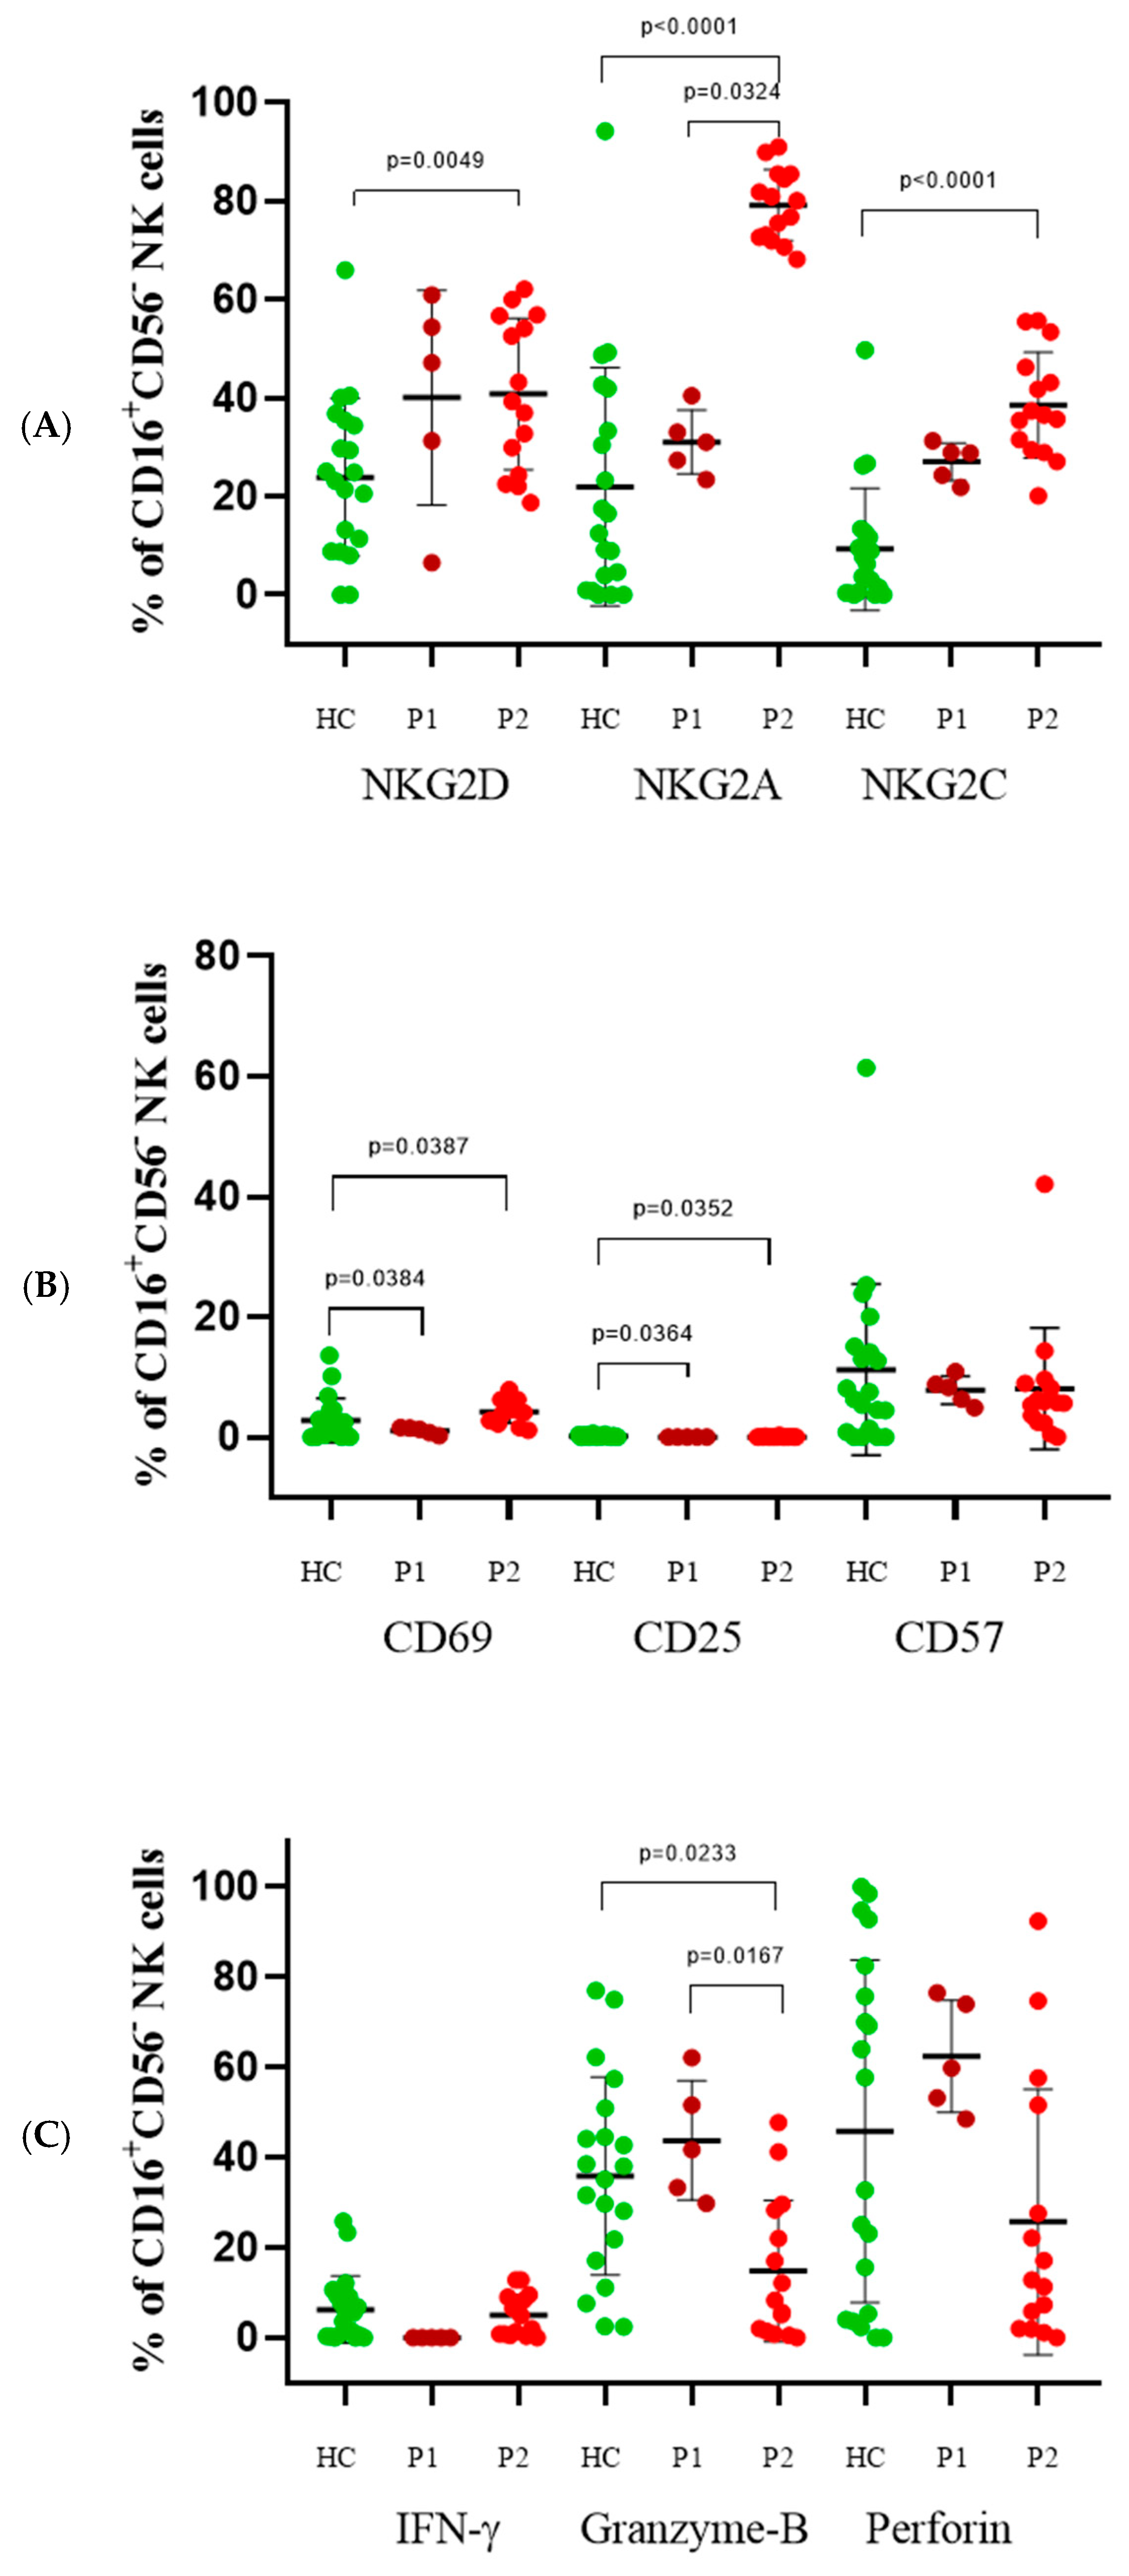
For the activating receptor NKG2D, we report an increase in the percentage of cells expressing it in P1 (46.1%), as well as in P2 (43.73%), compared to the control group—24.73% (Figure 4A). Regarding the expression of NKG2A (P1—31.95%, P2—79.44%, HC—22.27%) and NKG2C (P1—27.8%, P2—37.61%, HC—8.33%) receptors, we report a similar trend. Increased levels in P1, relative to the control group, with levels rising further in P2. In terms of CD69 (P1—0.9%, P2—3.85%, HC—2.55%) and CD25 (P1—0.0%, P2—0.03%, HC—0.1%) receptors’ expression, in P1 we reported lower values compared to the control group. An increase was found in P2 for CD69, higher levels than those in healthy subjects, while for CD25, the discrete increase was below the mean level of the control group (Figure 4B). CD57 levels were comparable between P1 (8.6%) and P2 (8.34%), both showing lower mean values than the HC (11.24%). Slightly elevated levels of granzyme-B were reported in P1 (40.75%) compared to the control group (33.06%), with a significant difference of lower secretion reported in P2—13.64% (Figure 4C). Perforin expression showed elevated levels in P1 (64.95%), which then declined in P2 (28.58%), becoming even lower than those of HC (46.51%), without the change being statistically significant. Similarly, this trend is observed in terms of IFN-γ levels as well (P1—0.0%, P2—5.11%, HC—6.71%).

3.5. CD56dim Cells

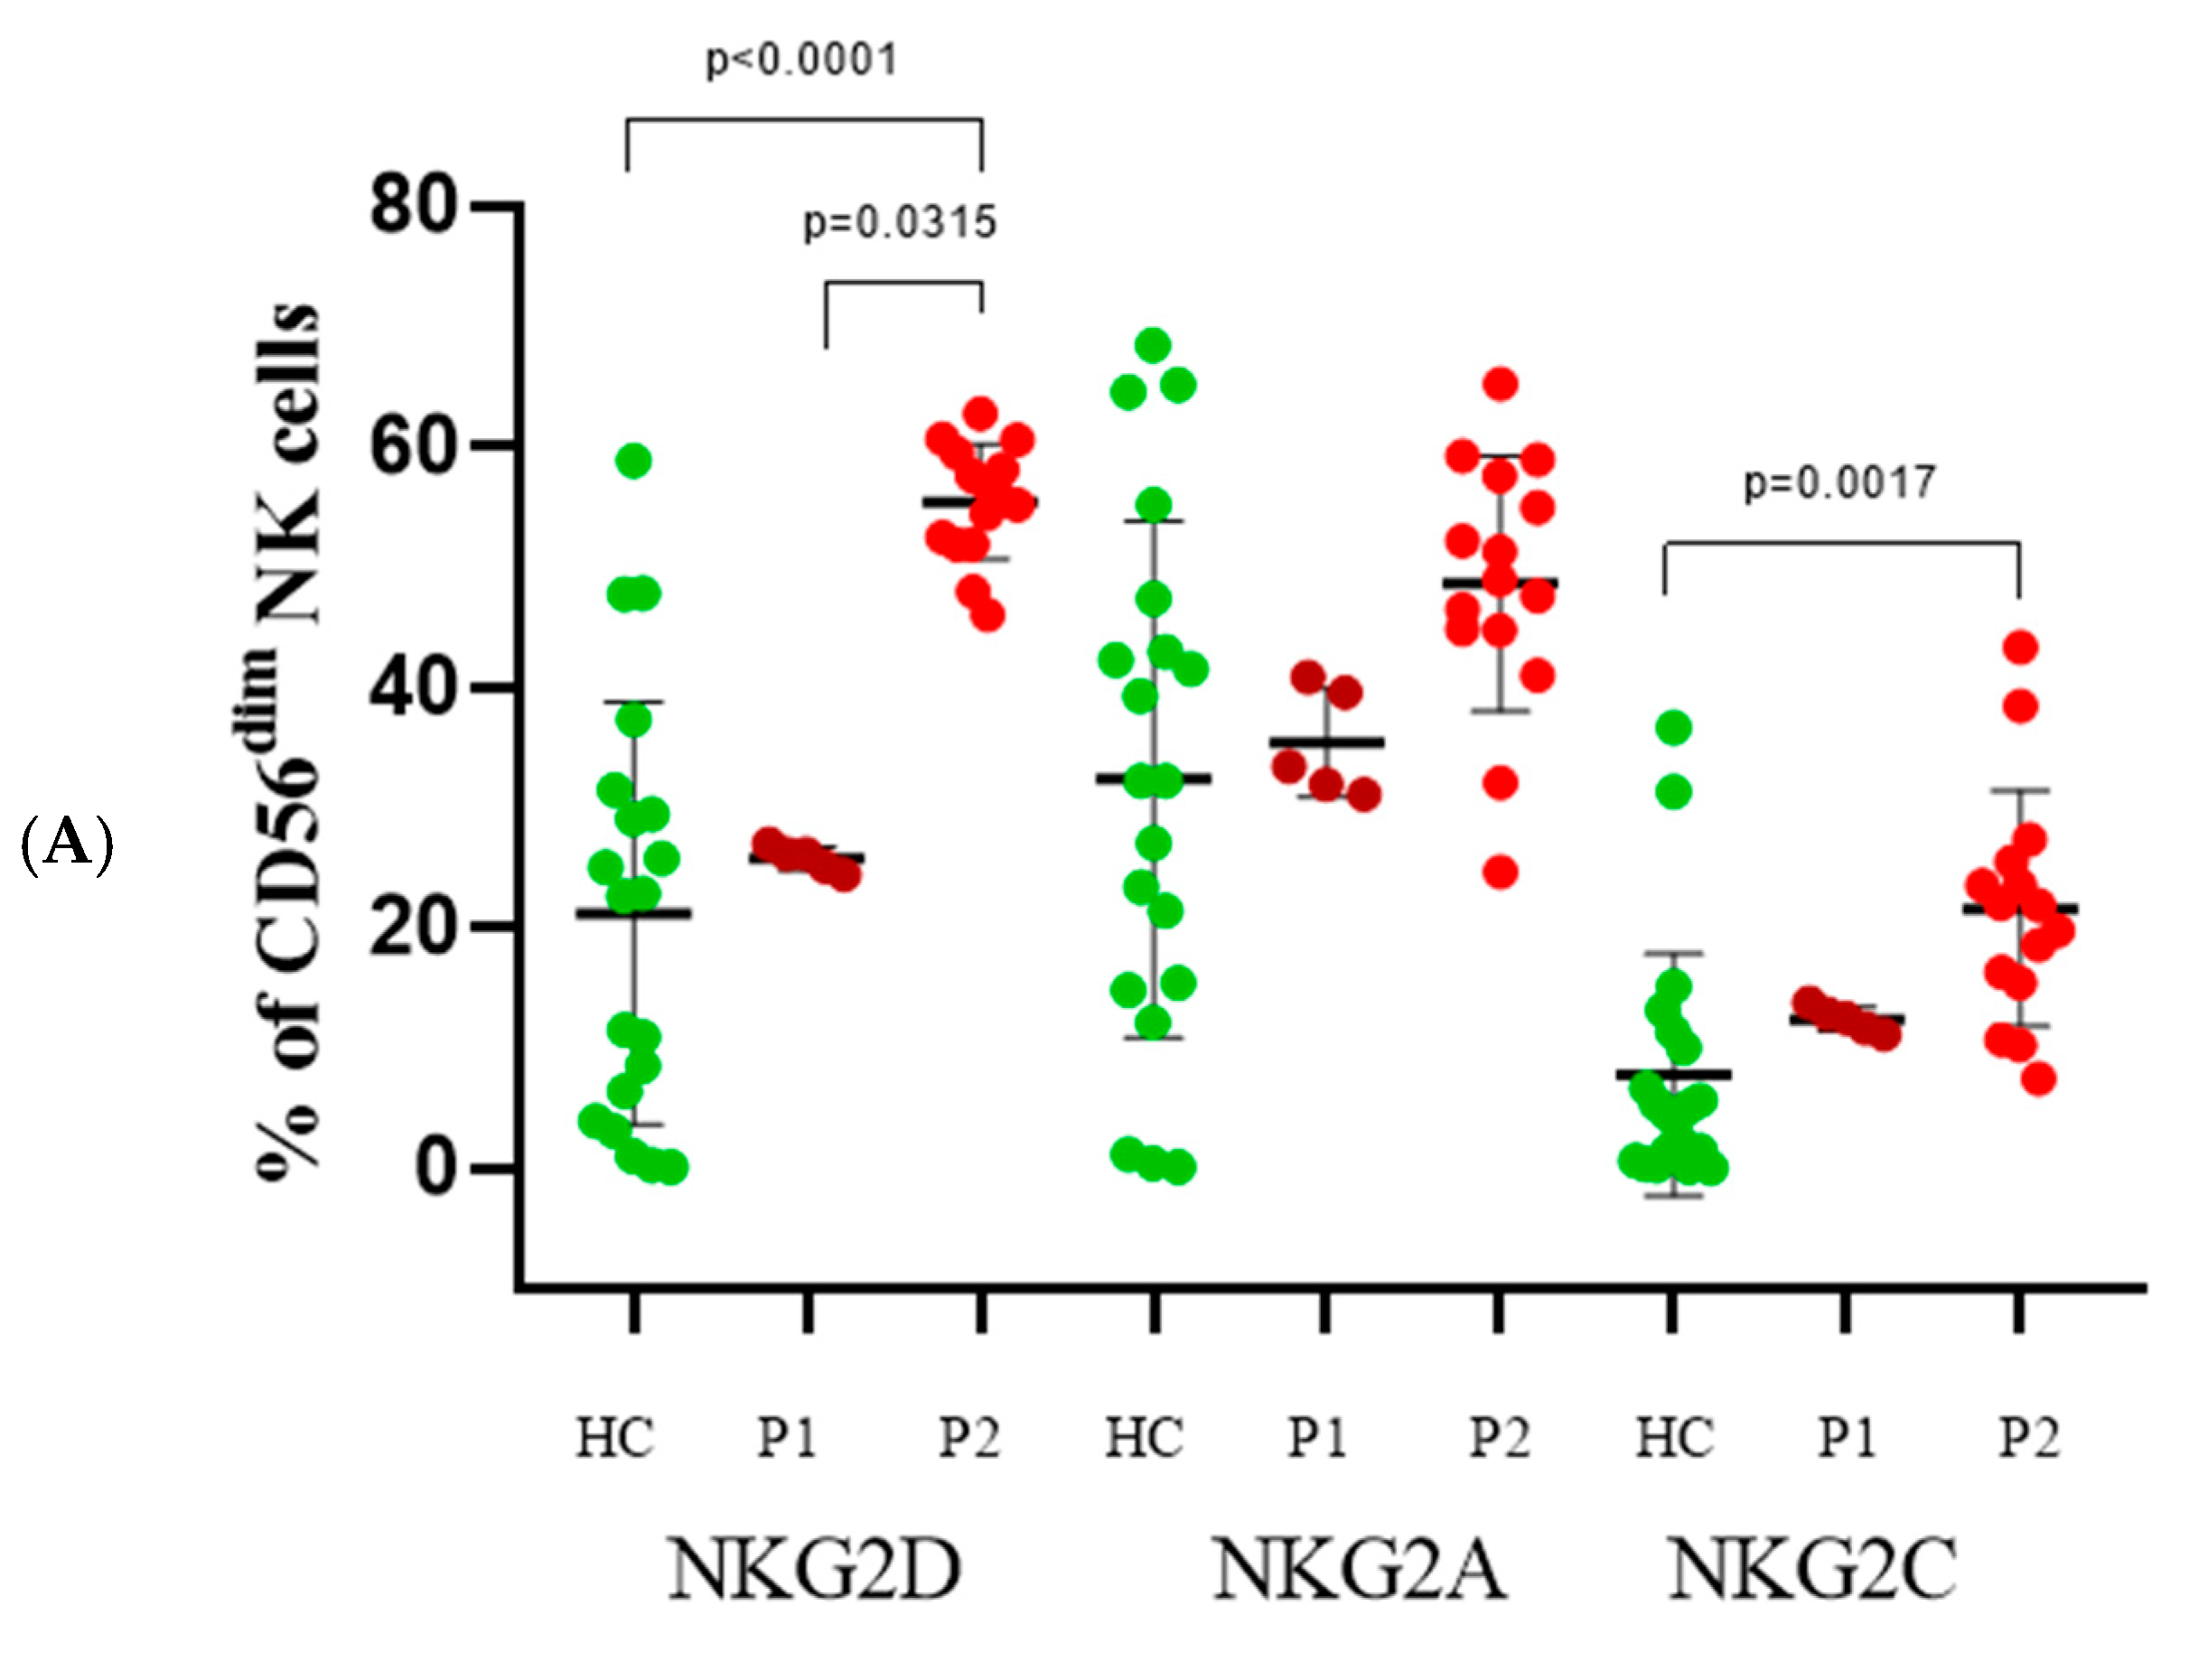
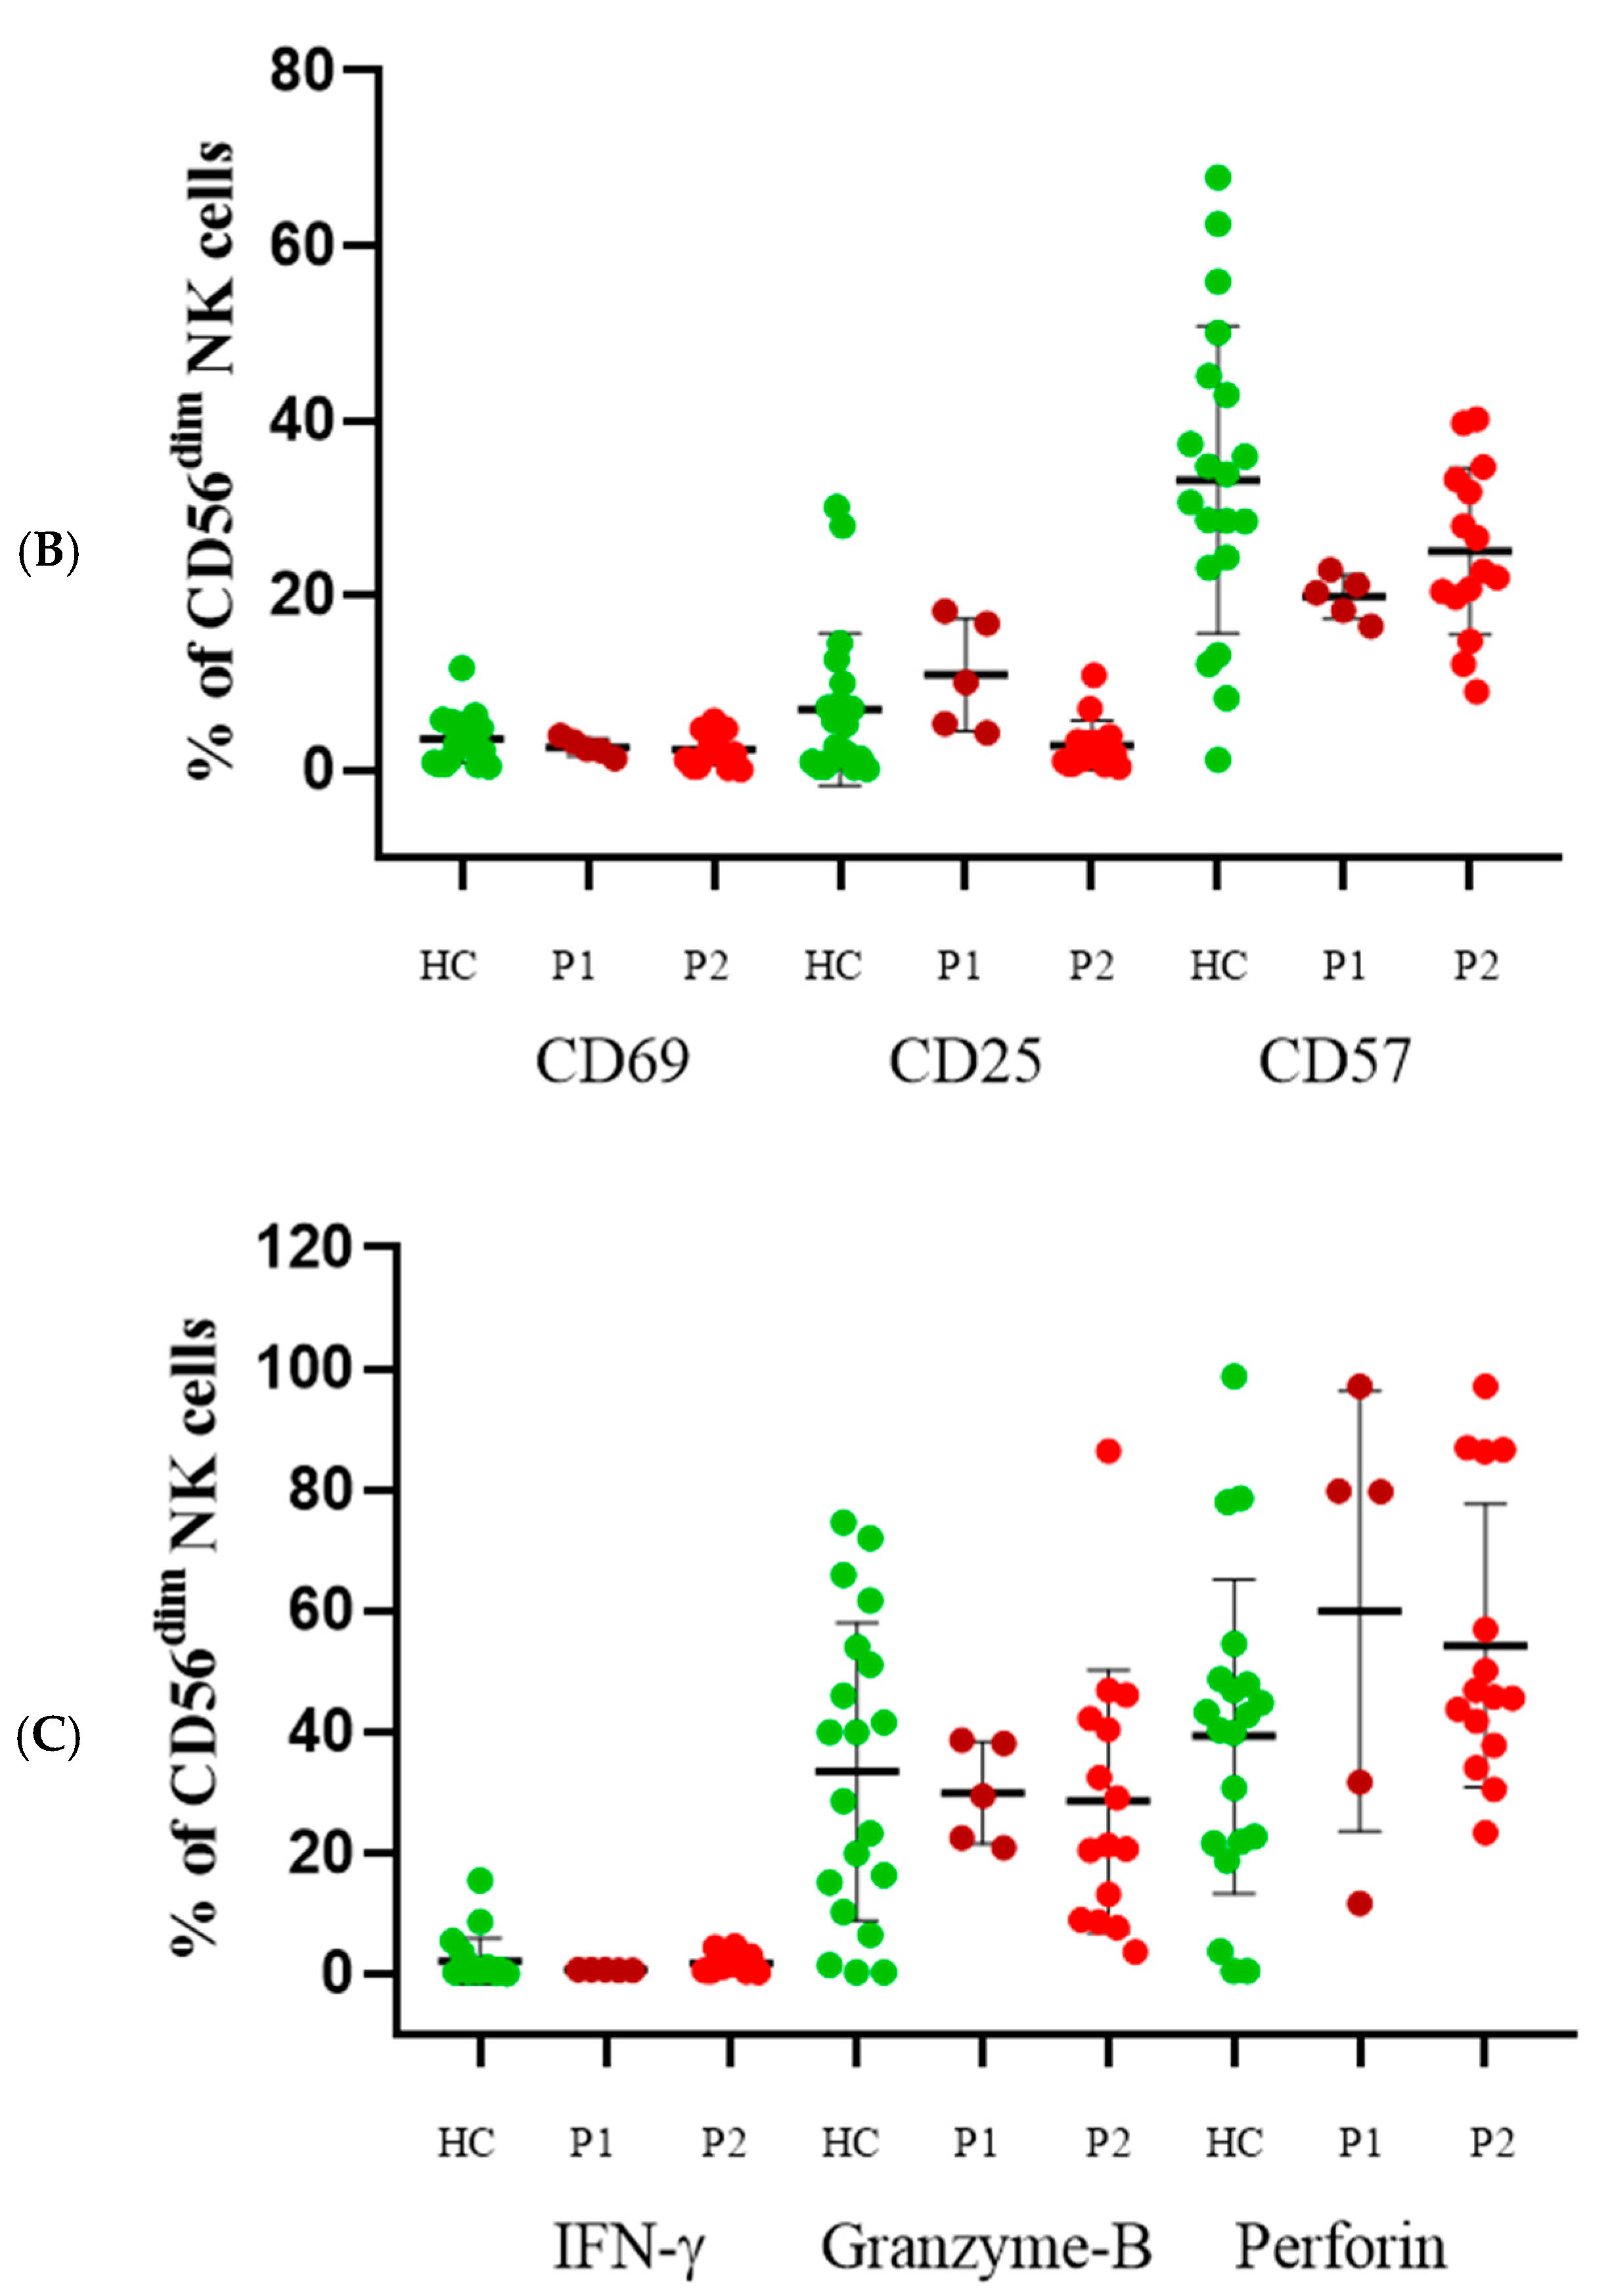
For this subpopulation we reported similar levels of NKG2D in HC (21.73%) and P1 (25.25%), with a statistically significant increase in P2—54.26% (Figure 5A). This trend is observed also in terms of NKG2C (P1—12.4%, P2—20.86%, HC—8.64%) expression levels and NKG2A (P1—36.35%, P2—47.16%, HC—31.28%), where the latter showed no statistically significant changes in the groups analyzed. Expression of CD69 (P1—3.1%, P2—2.32%, HC—3.33%) showed a statistically non-significant declining trend, with the lowest values being in P2 (Figure 5B). CD25 levels were increased in P1 (10.45%) but dropped even below HC (6.21%) in P2 (2.54%). When comparing the CD57 expression levels, we found the highest values being in the HC group—30.54%. A decrease was reported in P1 (19.65%), which slightly recovered in P2 (24.52%) but was still below the HC. Intracellular staining for interferon-y showed a peak in the HC (1.88%). A decline was observed in P1 (0.65%), which later slightly recovered in P2 (1.59%), but was still below the mean values of the healthy individuals (Figure 5C). Levels of granzyme-B showed a declining trend (P1—29.7%, P2—28.56%, HC—34.11%) that was not statistically significant. Perforin values, however, showed opposite results. We found an increase in P1 (55.7%), which was kept in P2 (55.62%).
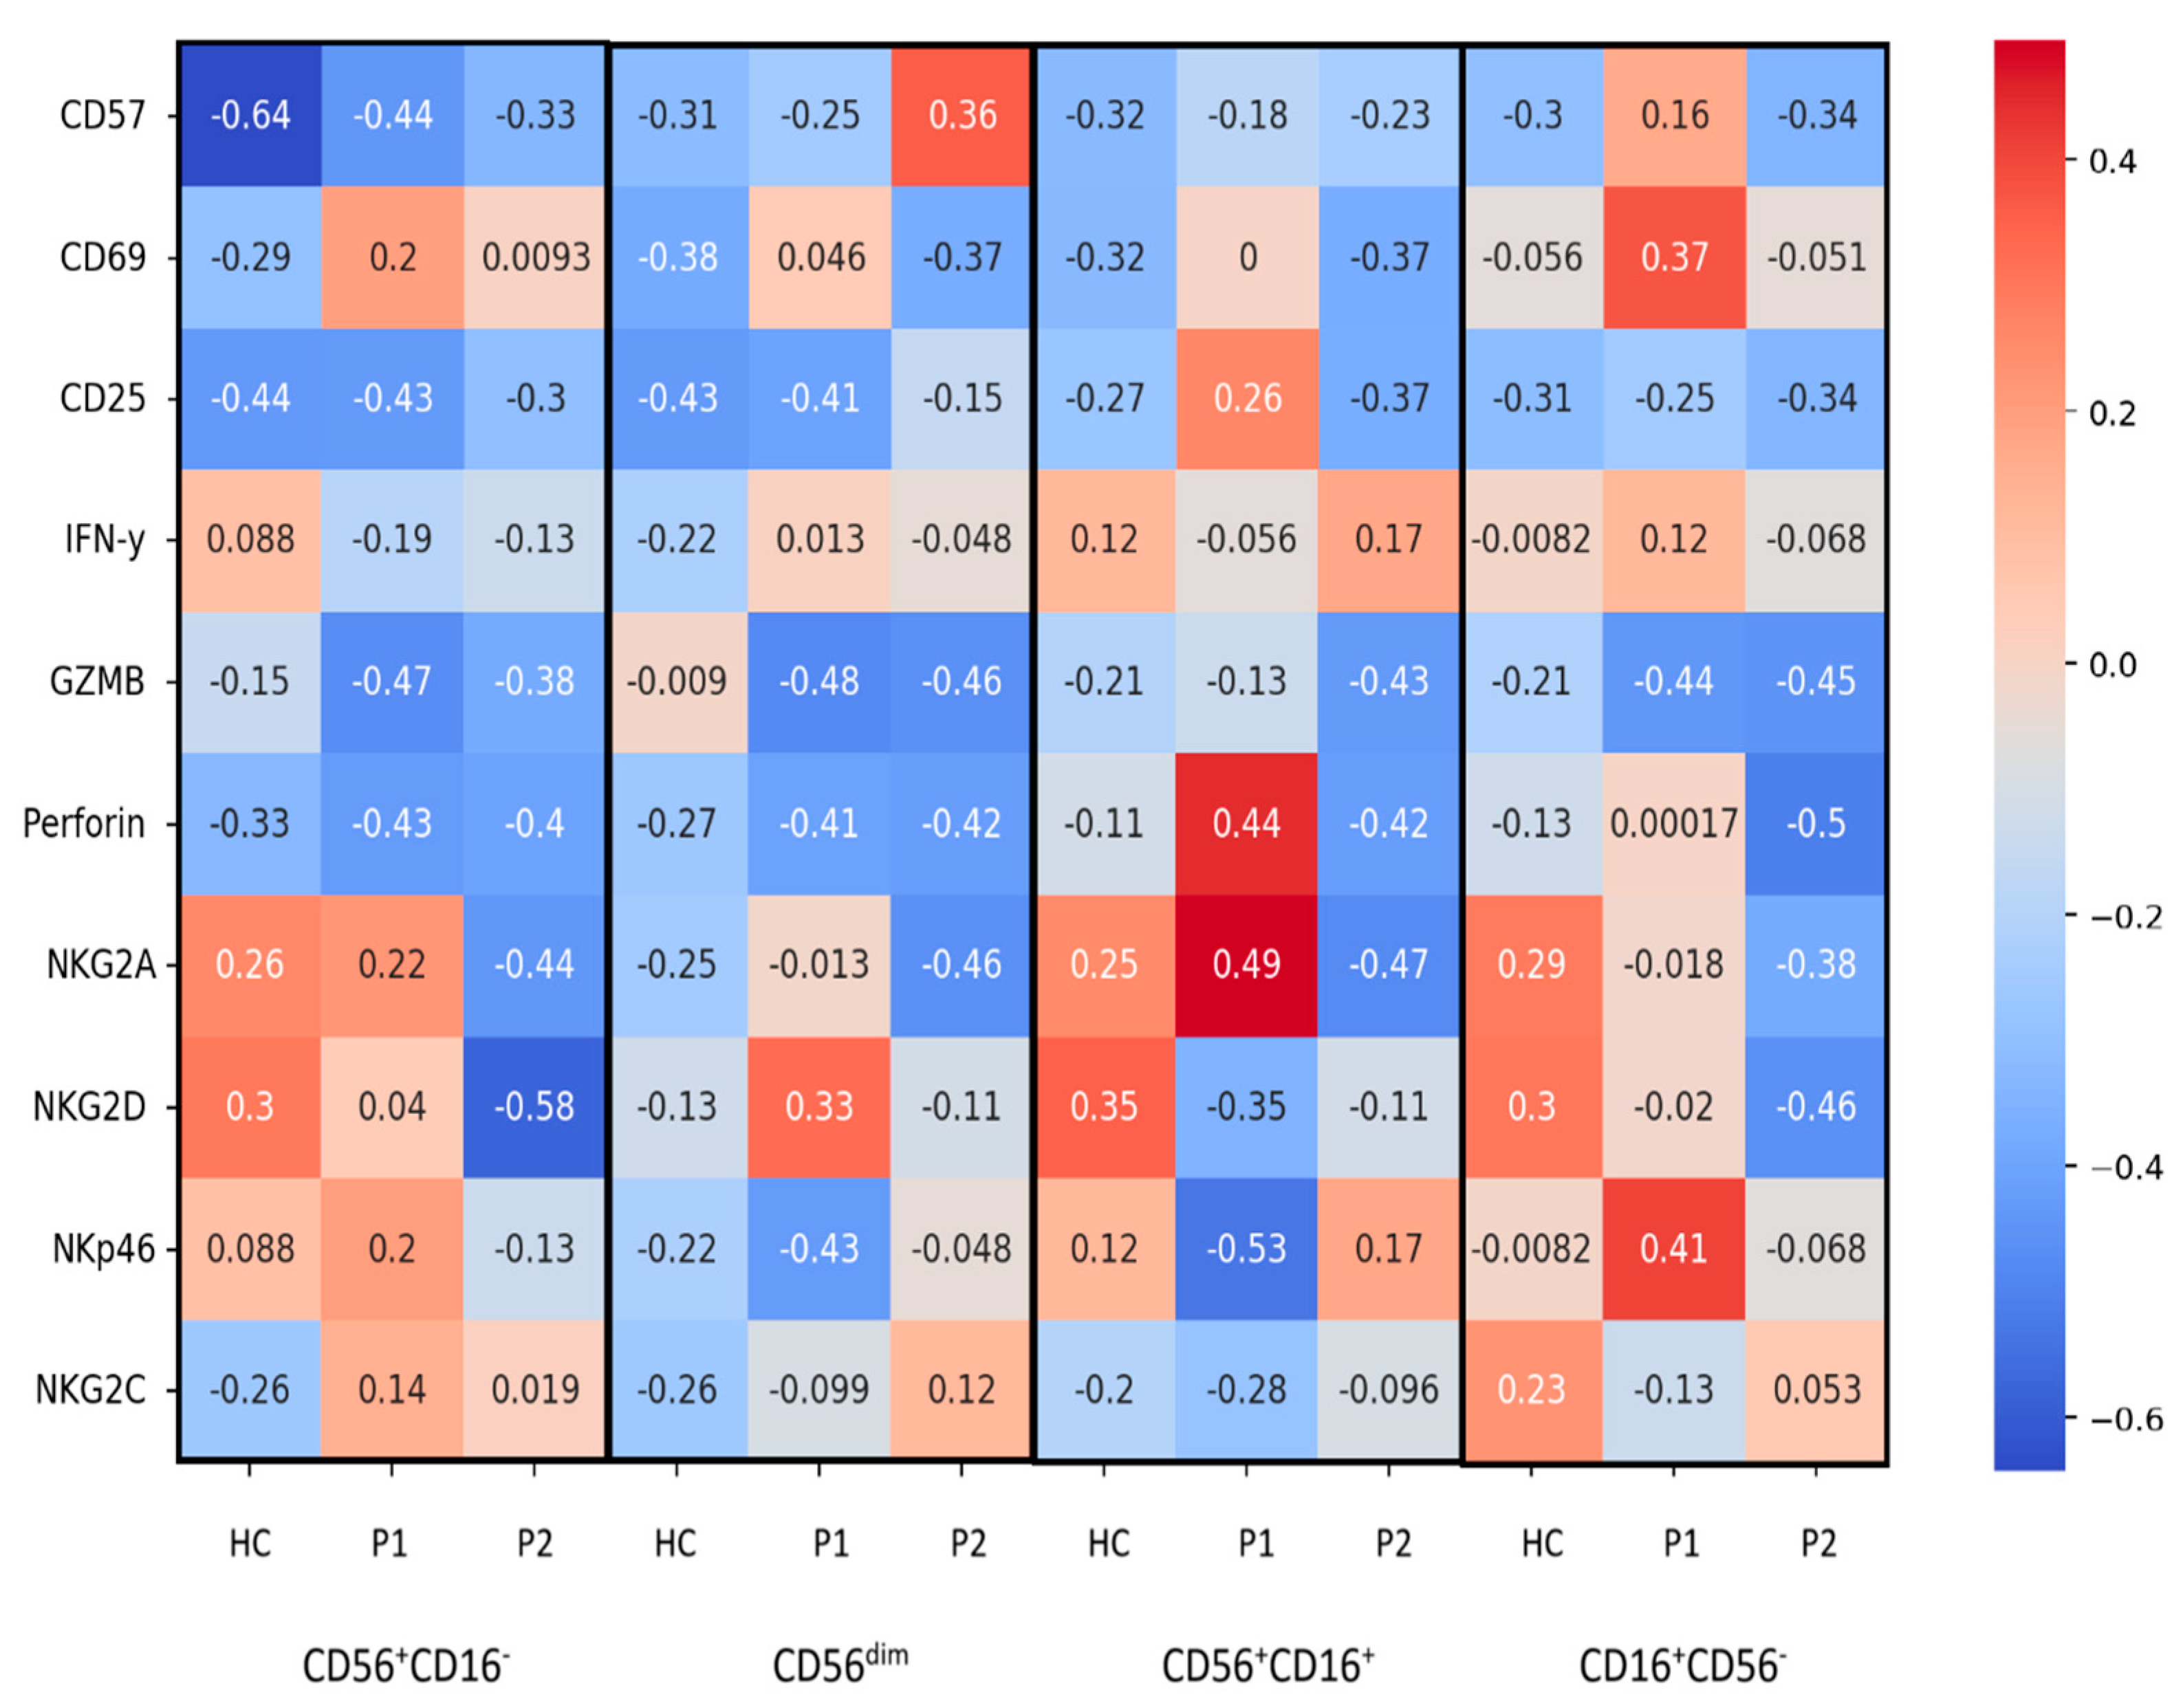
On the heatmap are depicted the MFI z-scores of all receptors in the four subpopulations of NK cells (Figure 6). Within the CD56+CD16 subpopulation we observed elevated z-scores for NKG2C at both P1 and P2 compared to HC, while NKG2D and NKG2A are similar or decreased compared to this subset in HC. CD57, a marker of terminal differentiation, is slightly higher in P1.
NKG2D expression in the CD56+CD16+ subpopulation is particularly low in P2, reflecting the absence of activation during convalescence, which is expected. NKG2A has increased. CD57 remains modest, consistent with a less mature phenotype, compared to the same subset in HC.
The CD16+CD56 subset displays decreased NKG2A and NKG2C at both P1 and P2, with NKG2D also reduced. CD69 and CD25, markers of activation and proliferation, show variable low expression, but they are more elevated in P1.
Within the CD56dim subset, healthy controls exhibit the lowest CD57 expression, which is slightly elevated in P1 and partially enhanced in P2. NKG2C are significantly upregulated in P2. NKG2A remains relatively stable but slightly increases in P2.
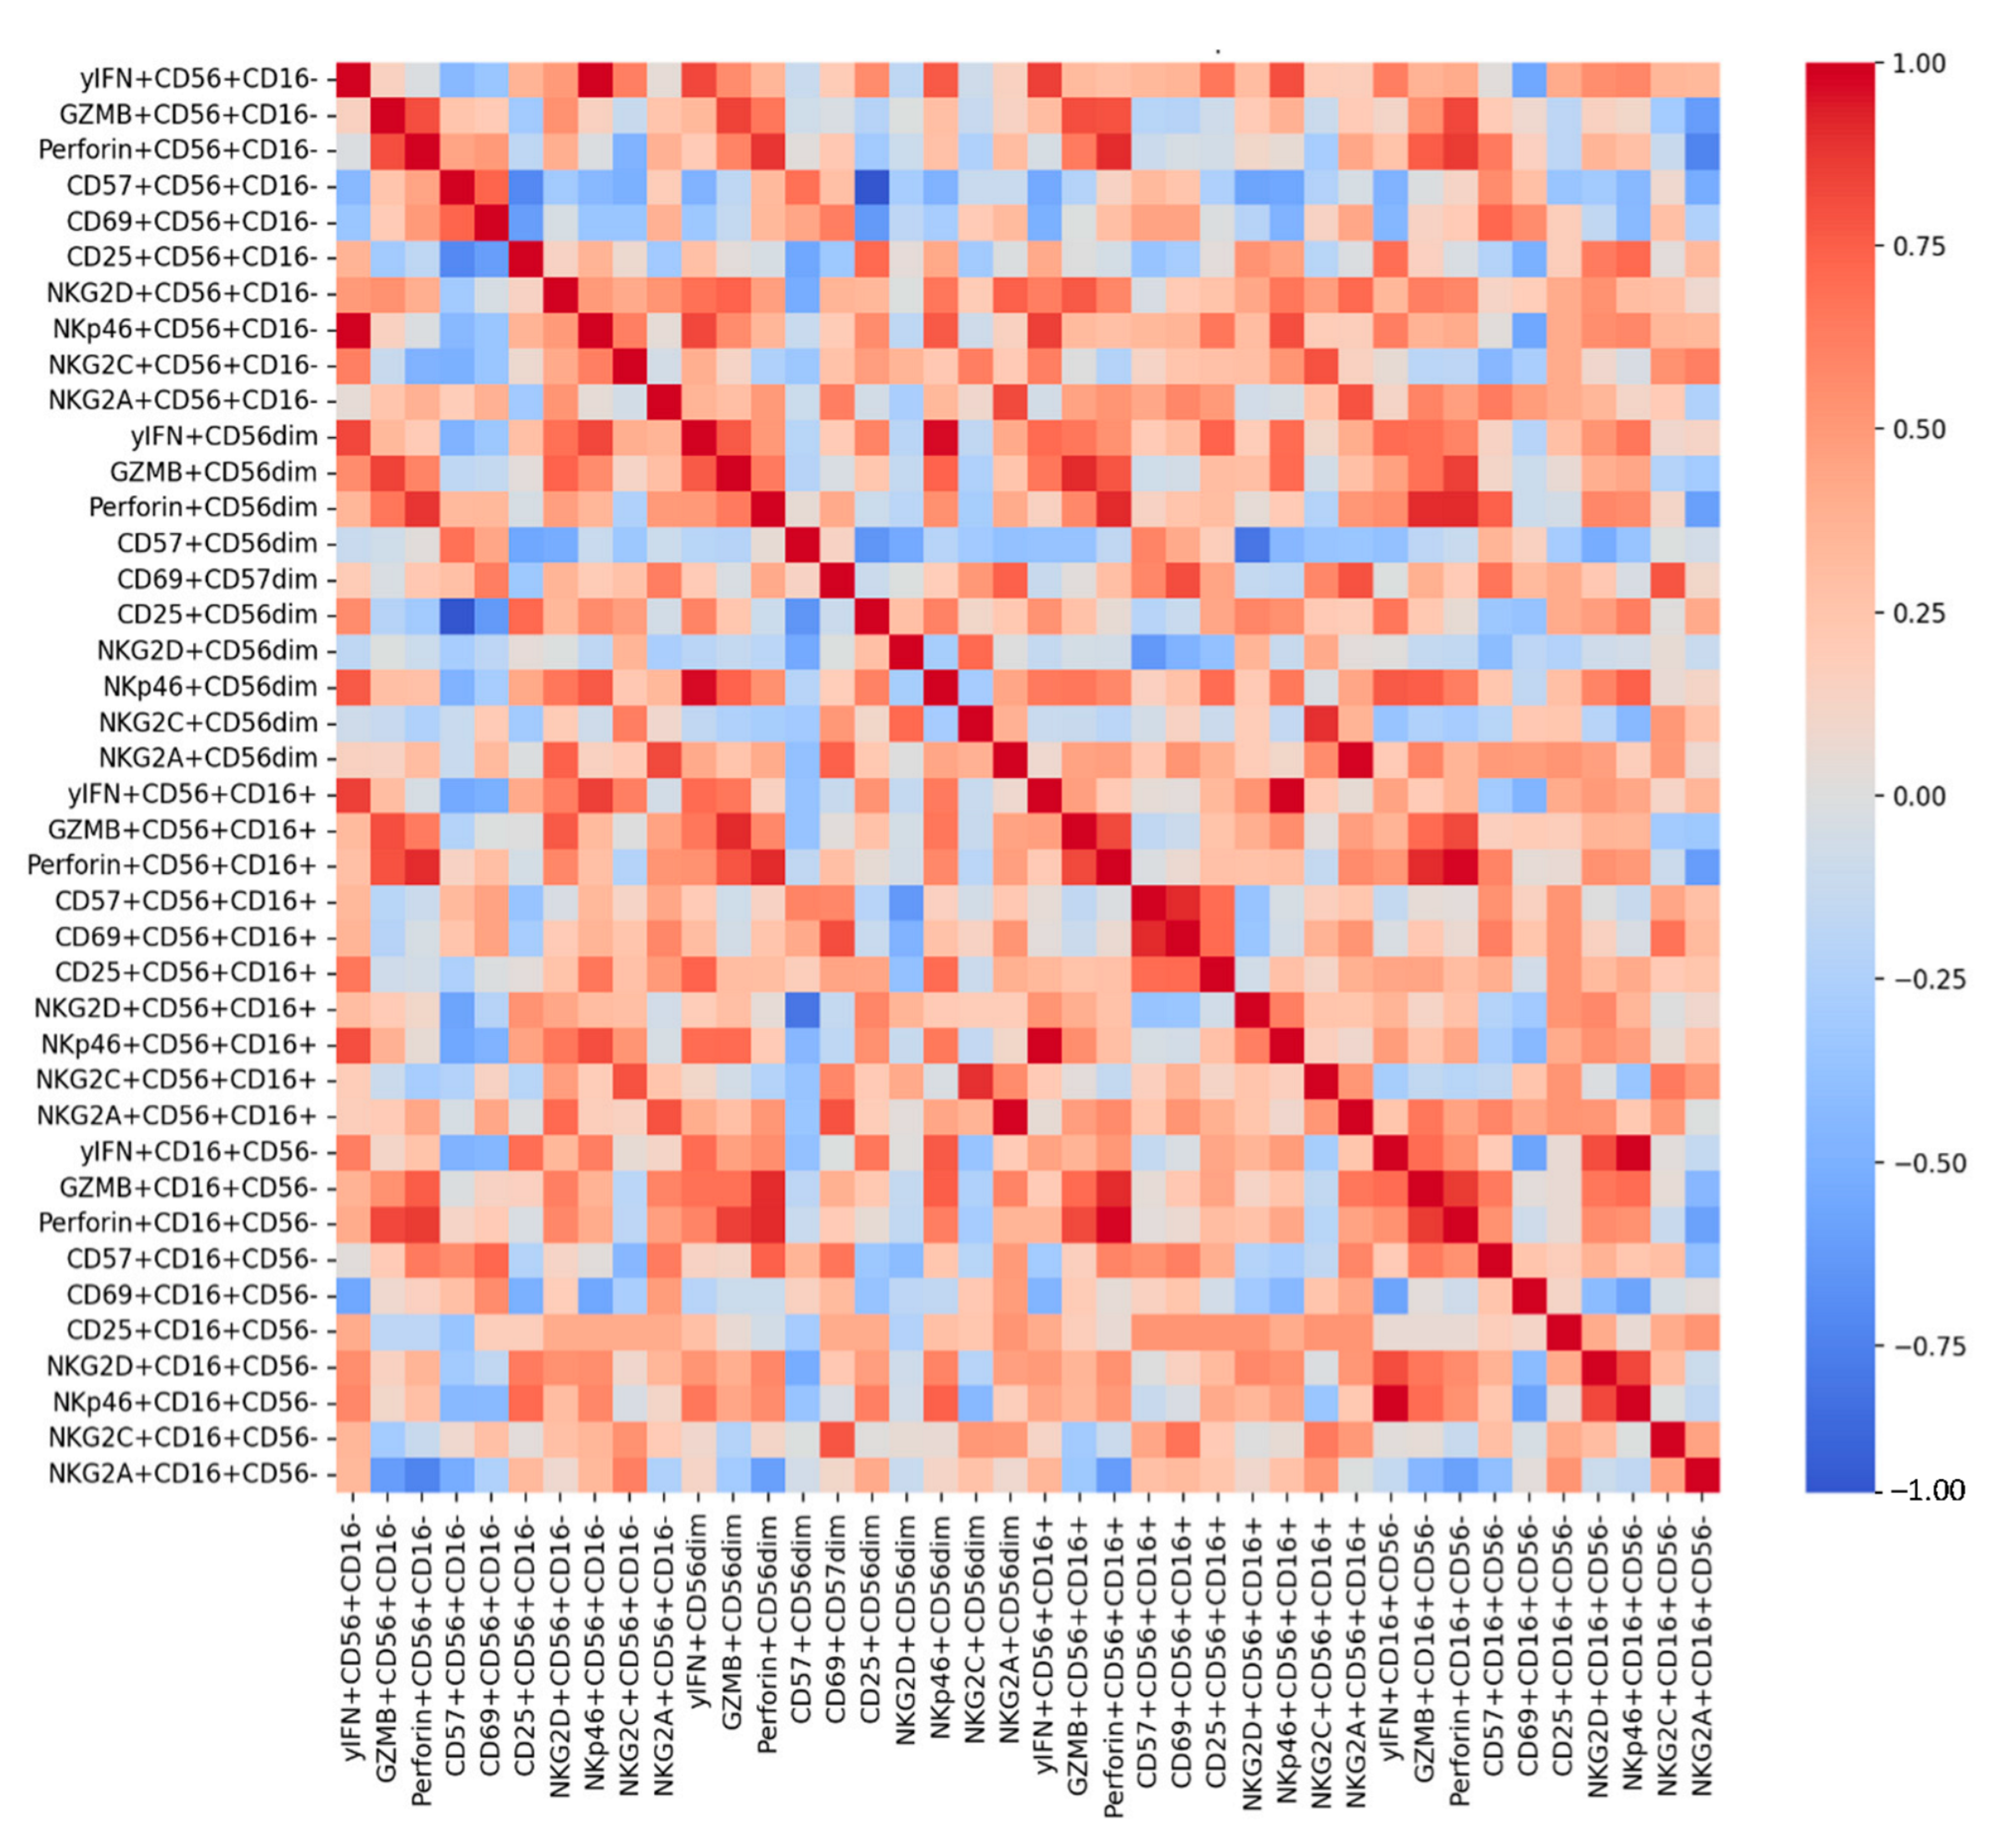
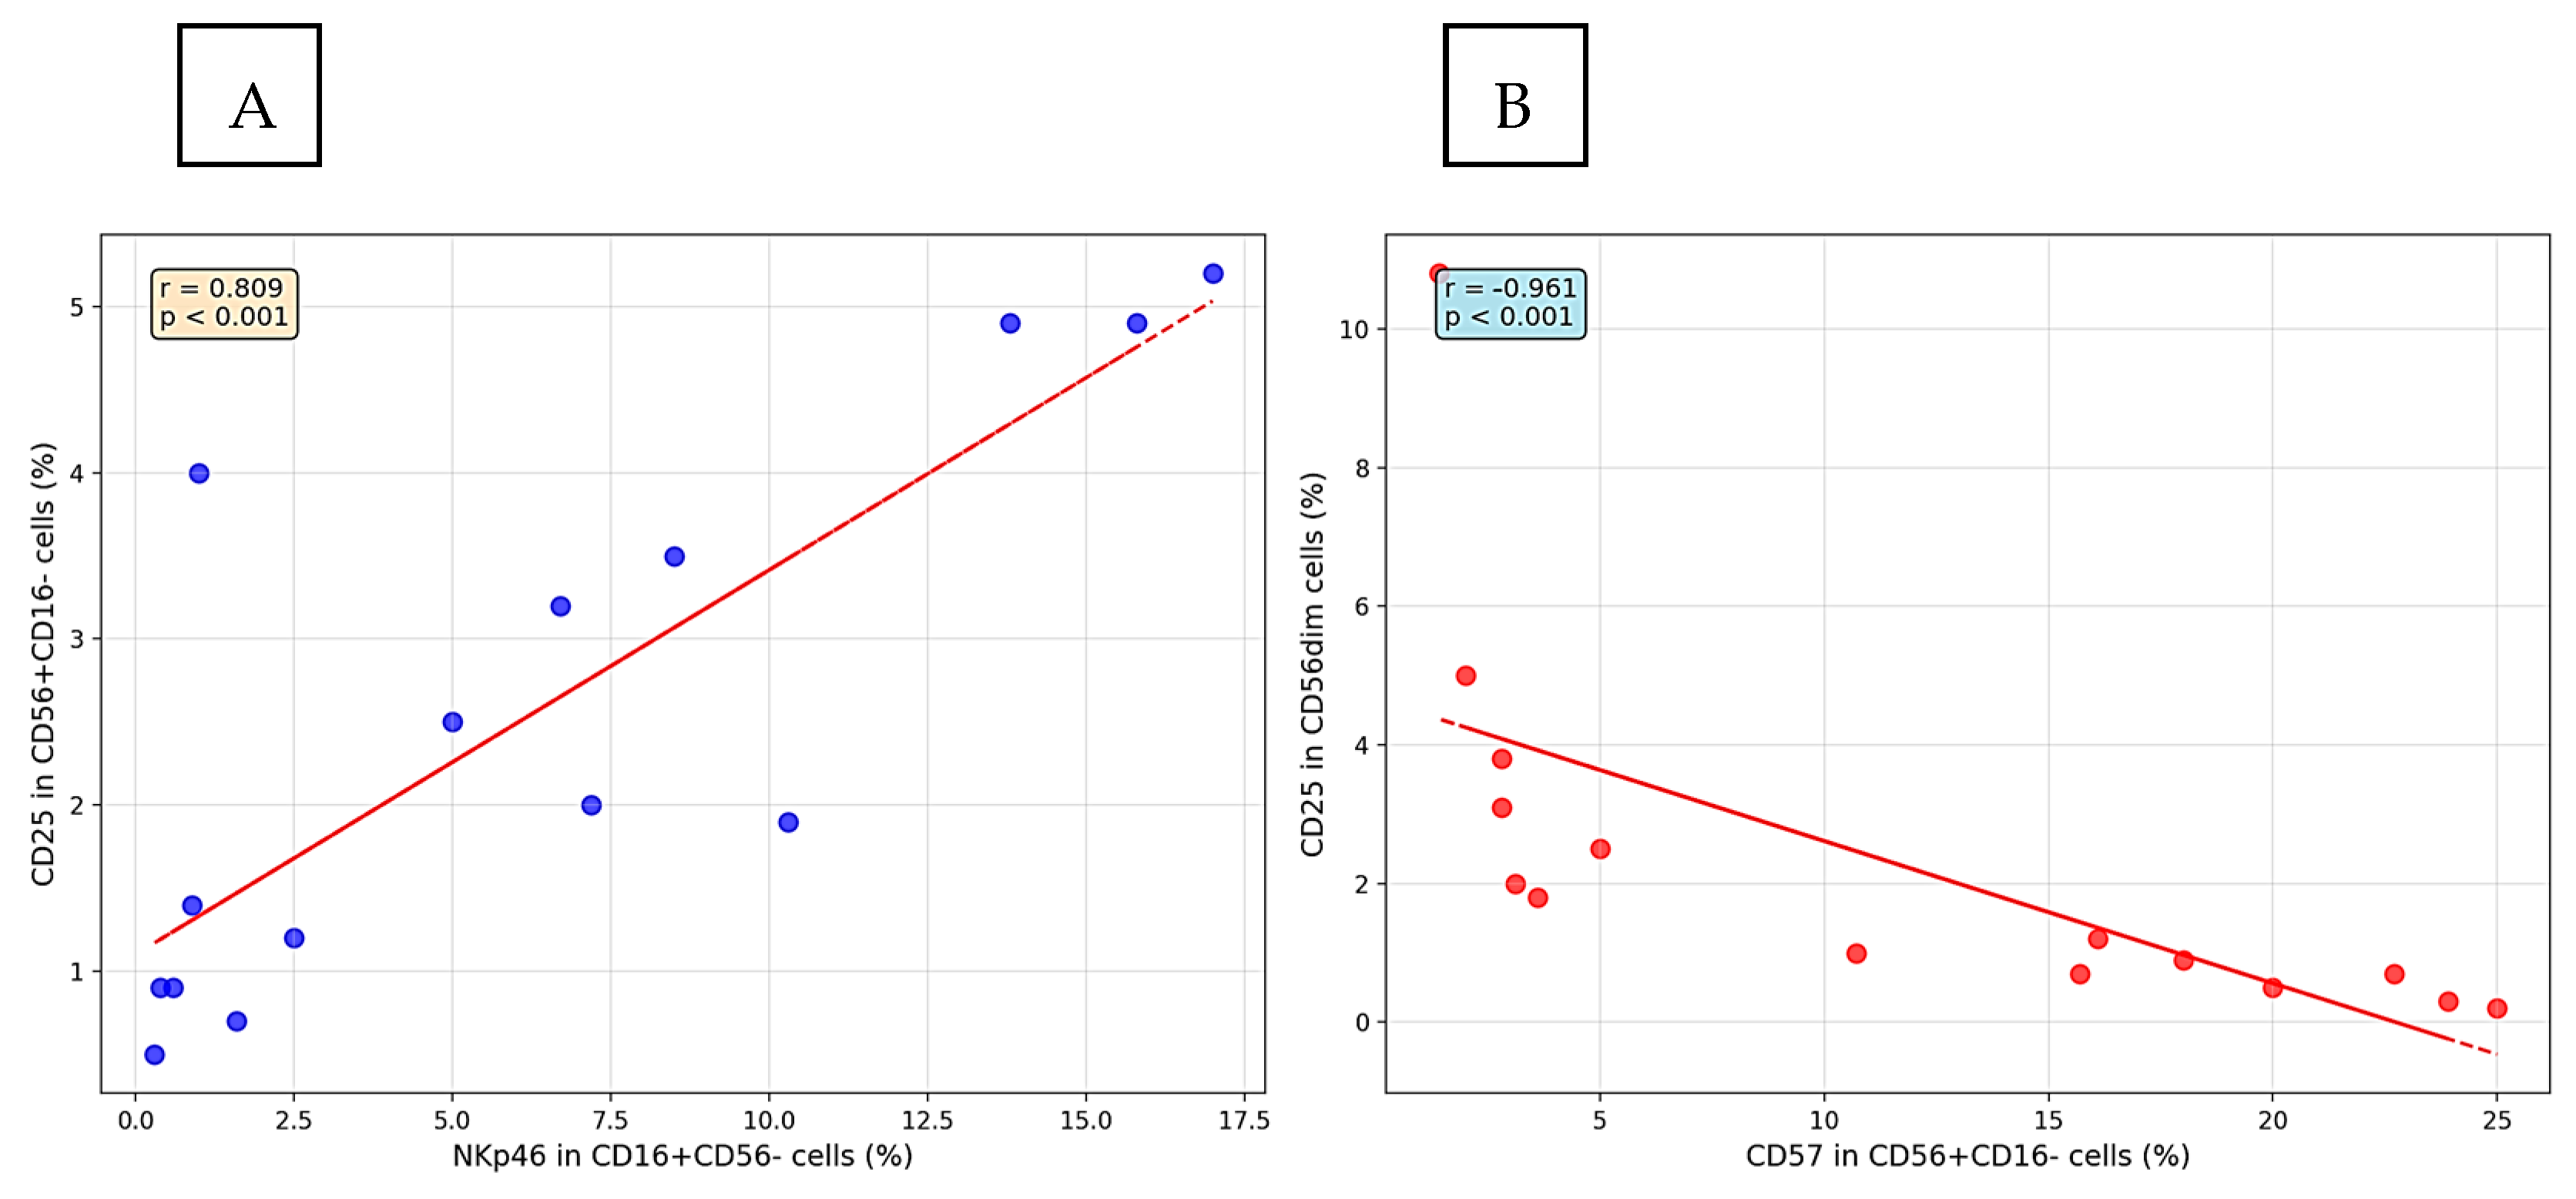
In Figure 7 we have depicted a heatmap correlation matrix for the phenotypic markers in P2. The heatmap illustrates Spearman correlations among functional and phenotypic markers across the four NK cell subpopulations. Distinct clusters of positive correlations are evident, indicating coordinated expression of several activation and effector molecules. Strong positive correlations were observed between CD57 and CD69 across multiple subpopulations, especially in CD56+CD16 cells (p = 0.021). CD25 and CD57 showed a negative correlation (Figure 8B), consistent with their association with proliferation and maturation, respectively. NKp46 expression in CD16+CD56 cells positively correlated with CD25 in CD56+CD16 cells (Figure 8A). IFN-γ expression positively correlated with NKp46 and GZMB, particularly in CD16+CD56 (p < 0.001 and p = 0.029) and CD56dim cells (p < 0.001 and p = 0.013). General clustering suggests that functional markers (IFN-γ, GZMB, perforin) tend to co-express within subpopulations, and their patterns are distinct between subsets.
Positive correlation (r = 0.713) was established between NKp46 expression in CD16+CD56 and CD25 expression in CD56+CD16 NK cells (Figure 8A). Correlations were also found between CD57 and CD69 expressions and a negative correlation between CD57 and CD25 levels—in P2 (Figure 8B).

3.6. Direct Cytotoxicity Assay

To identify unequivocally the target cells from the effector NK cells, we first gated the K562mNG cells on the FSC/SSC dotplot (Figure 9A). Then we gated the mNeonGreen-positive events (Figure 9B), and lastly we measured the propidium iodide fluorescence in these cells (Figure 9C) and compared them with the negative control (Figure 9D).
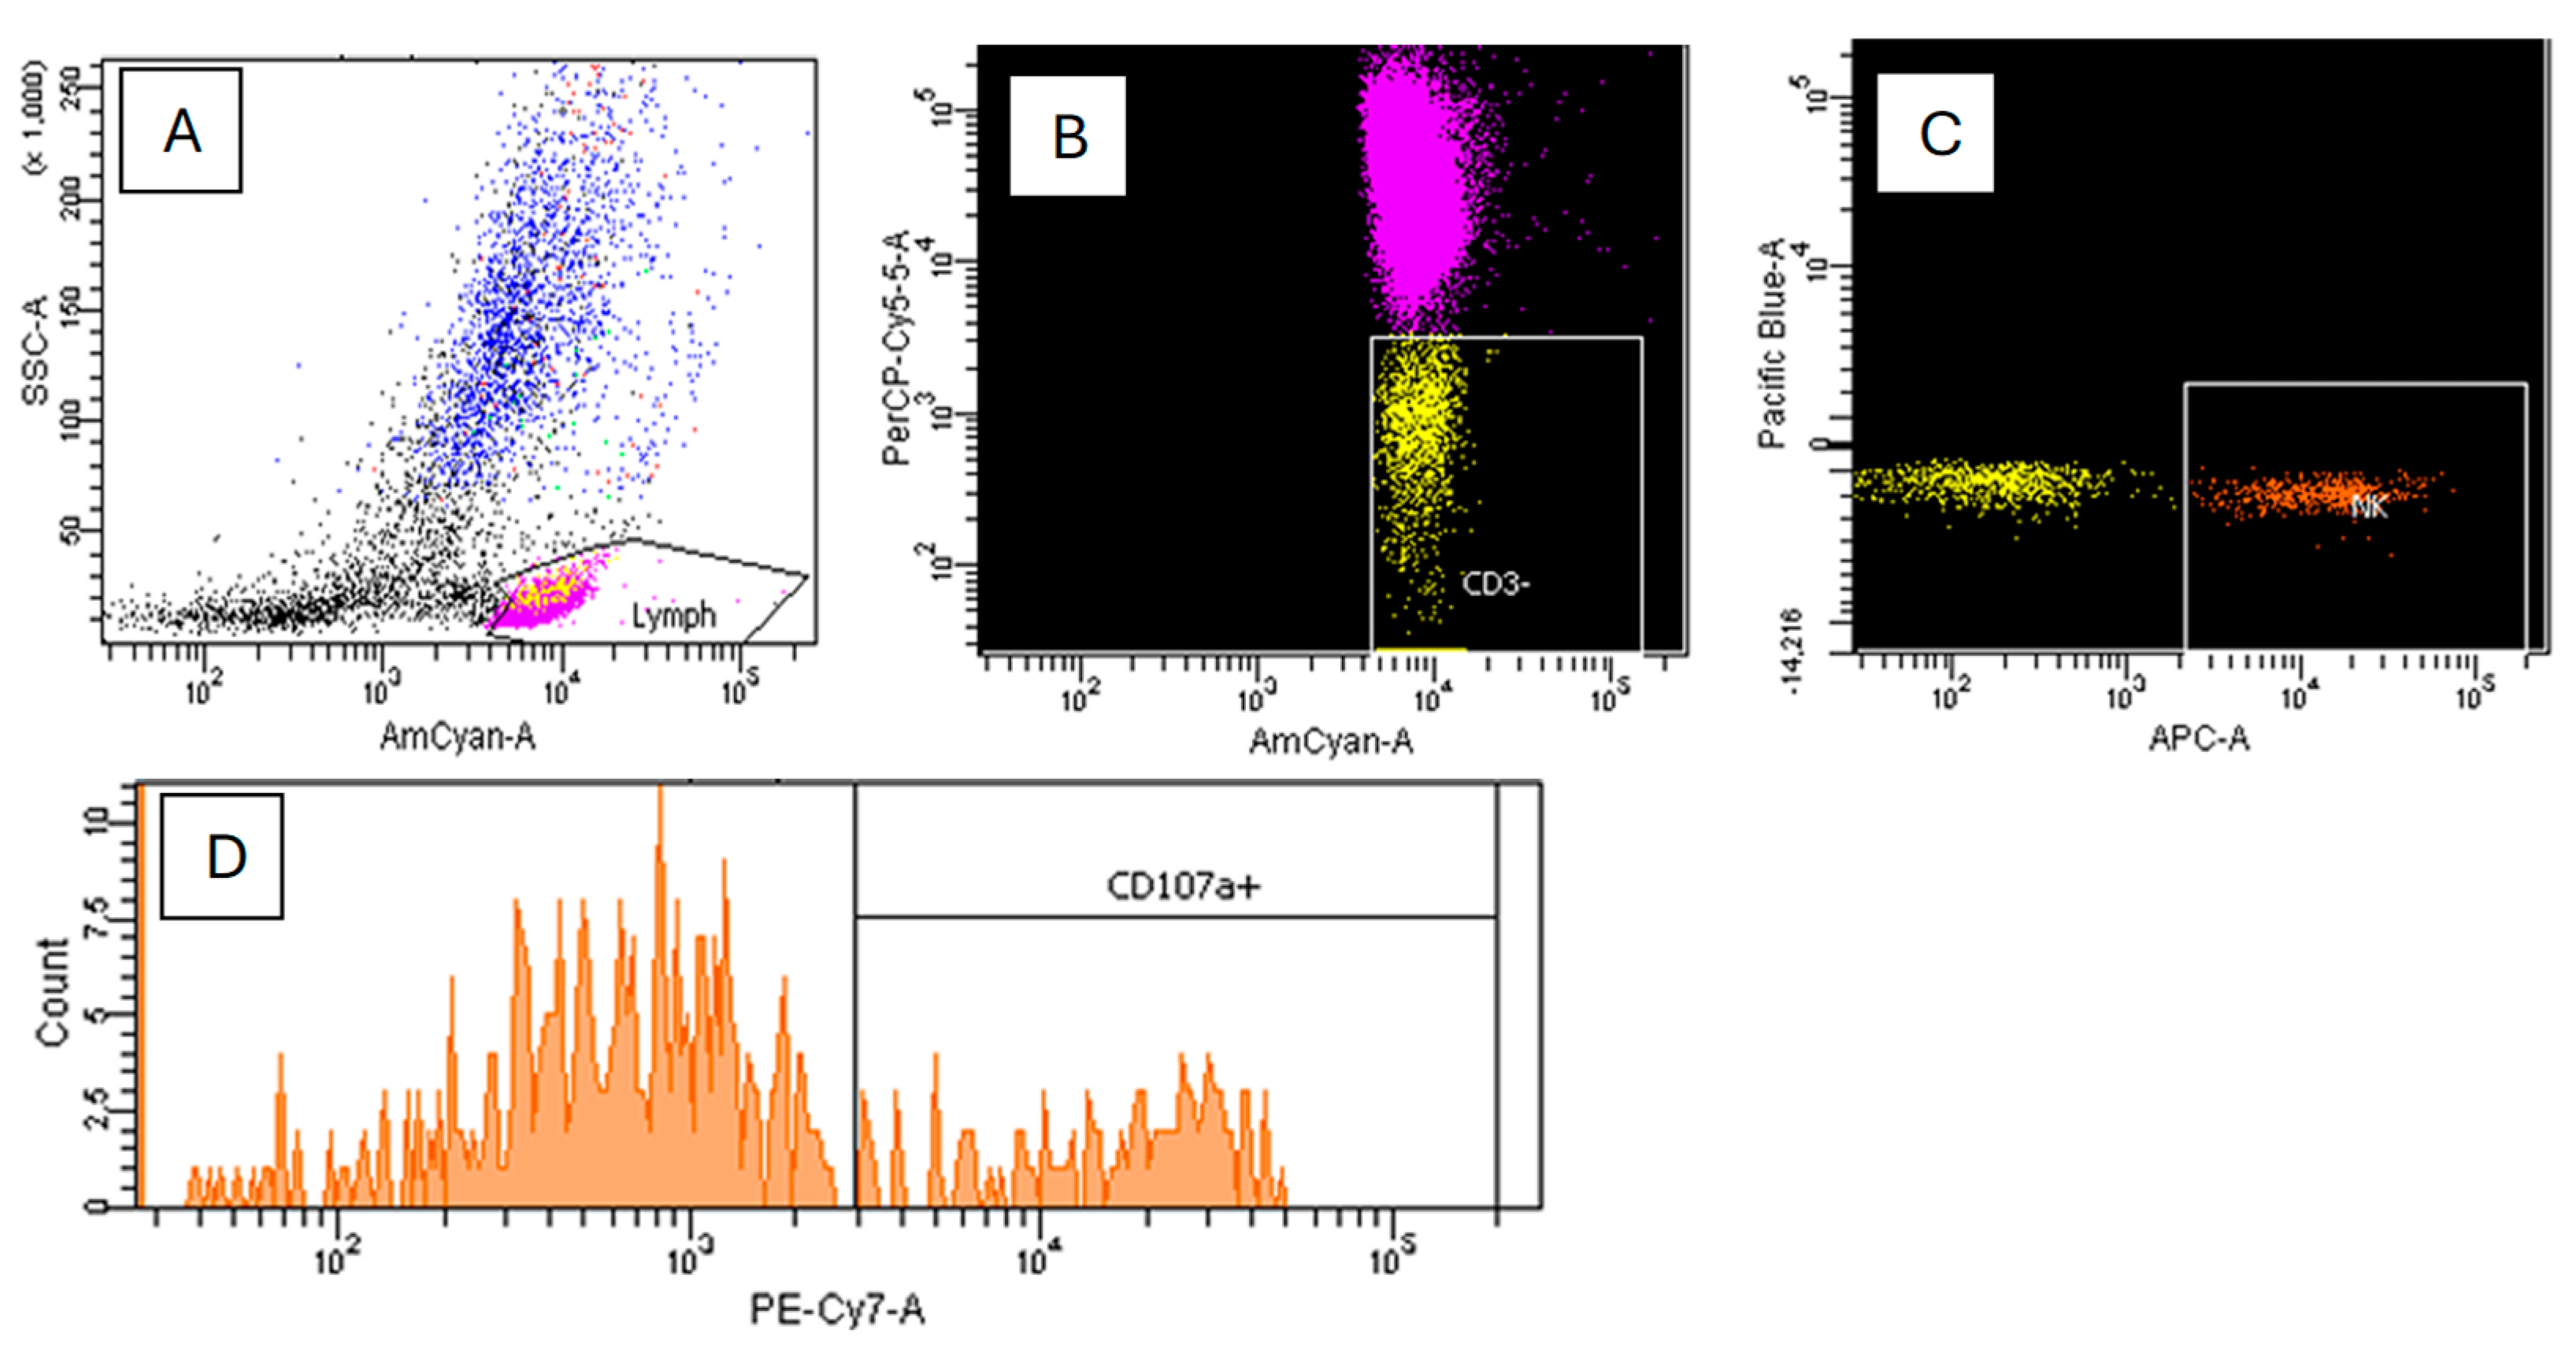
Effector cells were gated first as SSClow and CD45+ (Figure 10A). Then NK cells were identified as CD3 (Figure 10B) and CD16+CD56+ (Figure 10C). Finally, we measured the expression of CD107a (Figure 10D).
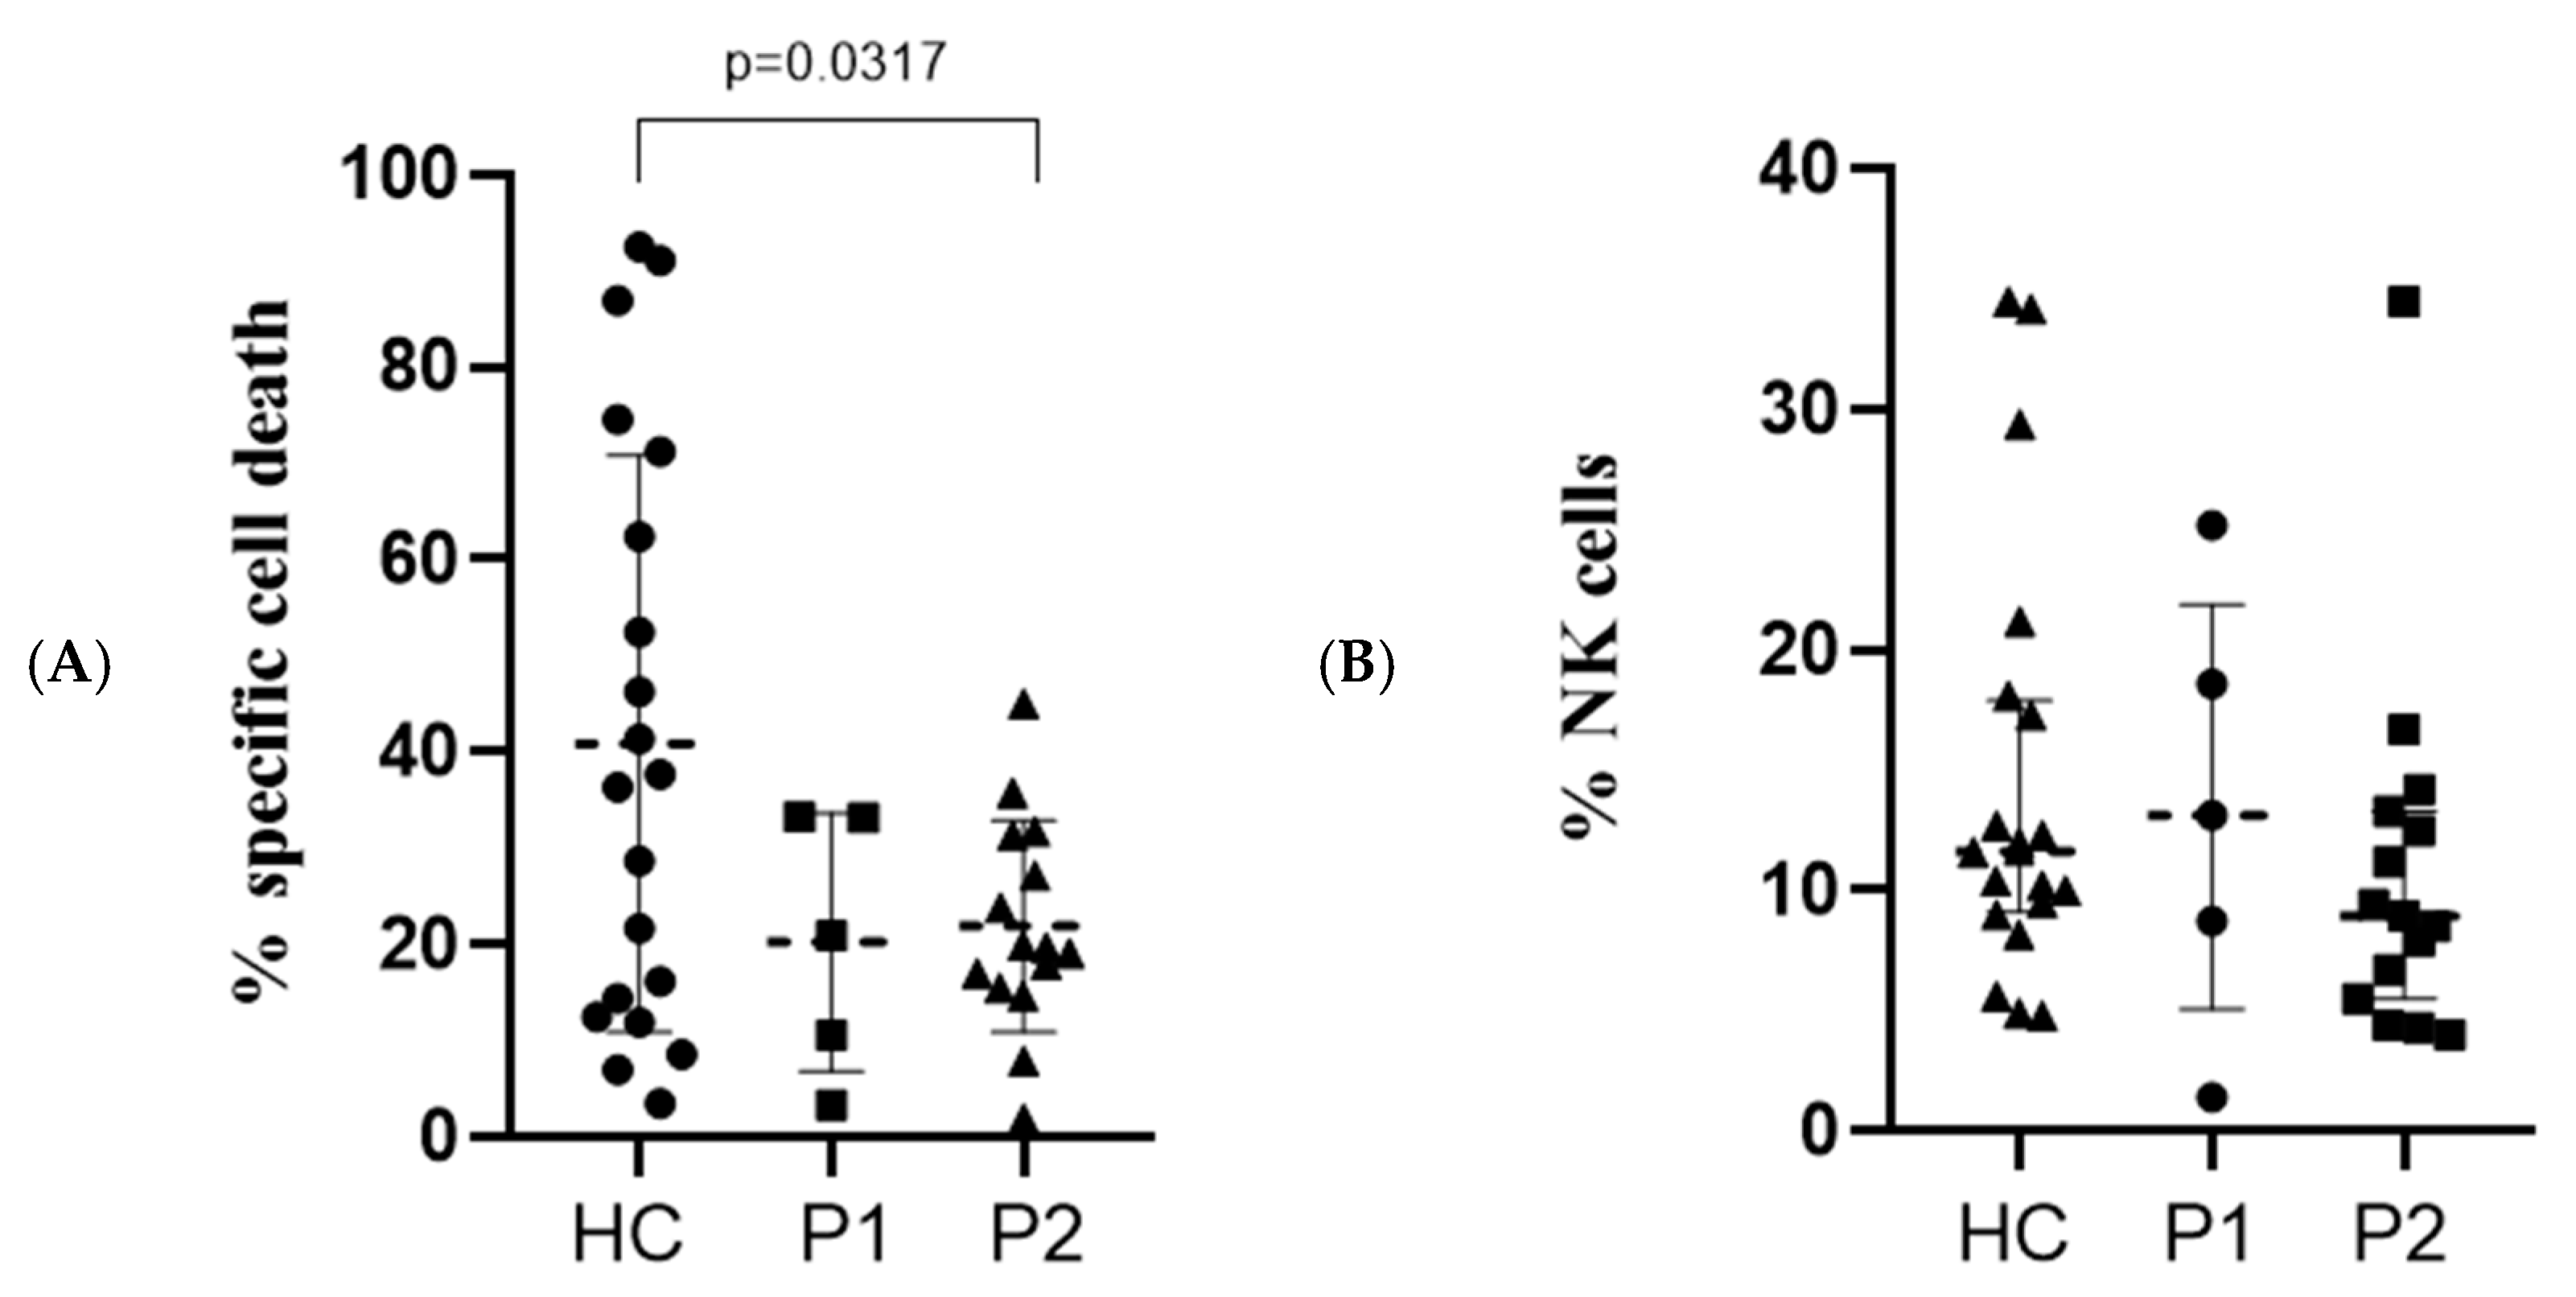
Regarding the direct NK cell cytotoxicity assay, we found a twofold lower percentage of dead target cells in P1 (18.32%) and P2 (19.73%) compared to the control group (47.59%) (Figure 11A).
For the expression of CD107a on the surface of NK cells during the direct cytotoxicity assay, results are presented in Figure 11B. A lower percentage of cells expressing the receptor was detected in P1 (13.15%) and P2 (11.30%) compared to the control group (15.74%), but this difference was not statistically significant.

4. Discussion

NK cells play a critical role in the immune response against viral infections, including SARS-CoV-2. Their function is tightly regulated by a balance of activating and inhibitory signals that determine their ability to eliminate infected cells while preventing excessive immune activation [19]. In the context of COVID-19, our results showed alterations in NK cell activity, with evidence suggesting a complex interplay between activation, exhaustion, and dysfunction. Understanding these changes is essential for elucidating the mechanisms of immune dysregulation in COVID-19 and their potential implications for disease severity and recovery.
The increased expression of interferon-gamma (IFN-γ) observed in P2 might indicate a significant enhancement in NK cell activity, which is crucial for the immune response against viral infections. This sustained elevation of IFN-γ suggests that the immune system is actively attempting to control viral replication and mitigate tissue damage during the later stages of infection. Studies have shown that IFN-γ production tends to be blunter in severe cases [2], compared to patients with moderate COVID-19. Furthermore, the persistence of IFN-γ expression may be attributed to the presence of residual viral antigens or a delayed resolution of inflammation, which can prolong immune activation [20], but not necessarily the functionality of NK cells, as shown from our results.
Our results showed elevated expression of NKG2D during the active stage of the SARS-CoV-2 infection, compared to HC, but still lower expression of CD107a and lower %DCA. Other researchers have reported downregulation of NKG2D on the surface of NK cells and have linked this to their weaker functionality [21,22], which is in contrast with our results; thus, other mechanisms might also play a crucial role in NK cell dysfunction in COVID-19, such as the inhibitory receptor NGK2A and its interplay with NKG2C.
We reported increased expression of NKG2A in both P1 and P2, compared to the healthy subjects. NKG2A is an inhibitory receptor that, when overexpressed, can lead to functional exhaustion of NK cells. Research has shown that COVID-19 patients, particularly those with severe manifestations, demonstrate elevated NKG2A levels on NK cells, which is associated with a compromised innate immune response [11,23]. For instance, Yasin et al. reported that high levels of NKG2A expression were observed in NK cells from bronchoalveolar lavage fluid of acute respiratory distress syndrome (ARDS) patients, indicating a more severe immune dysregulation compared to healthy individuals [11]. Similarly, Jaiswal et al. highlighted that the spike protein of SARS-CoV-2 enhances NKG2A expression, thereby inhibiting NK cell activation and viral clearance [24], which can also explain the functional impairment we observed in our study. This higher expression in combination with reduced functionality is one of the key findings, reported by other authors as well [7,12].
The lower cytotoxic activity reported in this study can be further supported by the findings of Bozzano et al. who support the notion that COVID-19 patients exhibit extensive activation of NK cells, yet this is accompanied by an increase in inhibitory receptors, including NKG2A, which may lead to functional impairment of these cells [25]. This phenomenon is further corroborated by Maucourant et al. who observed that the immunotypes of COVID-19 patients were characterized by high NKG2A expression and low NKG2C levels, indicating a potential mechanism for the observed immune evasion by the virus [2].
In terms of the lower numbers of CD16+CD56 subpopulation, similar findings have been reported by other authors. Research by Li et al. indicates that the frequency of NK cells, particularly the cytotoxic CD3CD16+ subset, is significantly lower in severe COVID-19 cases compared to mild cases and healthy controls, suggesting that decreased NK cell numbers are associated with increased disease severity [1]. Similarly, Mazzoni et al. found that COVID-19 patients exhibited reduced frequencies of NK cells capable of producing key cytokines like TNFα, further indicating impaired cytotoxic function in this population [3].
The elevated levels of granzyme B observed in NK cells from COVID-19 patients may reflect an initial activation response; however, the subsequent inability to effectively utilize these cytotoxic molecules against infected cells leads to a low cytotoxic capacity [10,26], in our case observed by the low %DCC and low expression of CD107a.
Moreover, our findings of NK cells being hyperactivated yet functionally impaired are not exclusive. For instance, while NK cells exhibit high levels of granzyme B, their ability to degranulate and kill target cells is compromised [3,27]. This phenomenon has been linked to a dysregulated immune response, where NK cells fail to respond adequately to target cells despite having the necessary cytotoxic machinery [10,25]. The presence of NK cell-monocyte crosstalk has also been implicated, suggesting that interactions with other immune cells may further hinder NK cell activation and function in COVID-19 [27,28].
Our study reports low levels of CD69, CD25, and almost absent expression of NKp46 on the surface of NK cells, especially among the CD16+CD56 subpopulation. In the context of COVID-19, the expression of CD69, a marker associated with cell activation and tissue residency, has been shown to be altered. While some studies report increased levels of CD69 in NK cells during severe COVID-19 [2,7,29] in combination with impaired NK cell functionality, our results show both diminished cytotoxicity and low levels of CD69.
The implications of low CD25 levels on NK cells in COVID-19 are profound. CD25 plays a role in the proliferation of NK cells following stimulation with interleukin-2 (IL-2) [30]. The diminished expression of CD25 in our COVID-19 patients may therefore reflect a broader dysfunction in NK cell responses, potentially leading to impaired antiviral activity and contributing to the severity of the disease. The low levels of CD25 in P1 in our patients compared to P2 and HC might be one of the reasons why we observe lower cytolytic activity.
This very low expression of the NKp46 receptor, critical for NK cell cytotoxicity, that we observe in our samples might be one of causes leading to a diminished cytotoxic capacity of the NK cells. Studies indicate that the downregulation of NKp46 is associated with impaired NK cell functions, which could contribute to the inability of the immune system to effectively control viral replication [31]. It has also been shown that expression levels of NKp46 contribute to faster viral clearance [32].
In our COVID-19 patients, particularly during the recovery phase, a notable negative correlation was observed between CD57 expression on CD56+CD16 NK cells and CD25 levels on CD56dim NK cells, which can be expected. This phenomenon can be attributed to the differentiation process of NK cells. As NK cells mature and express higher levels of CD57, they tend to lose their proliferative capacity, which is reflected in lower CD25 expression [2,12]. Studies have shown that CD56dim NK cells, which are crucial for cytokine production and cytotoxicity, can exhibit reduced CD25 levels as they become more terminally differentiated and express CD57 [33].
We documented a positive correlation between NKp46 expression on CD16+CD56 NK cells and CD25 expression on CD56+CD16 subsets in P2. This can be explained by potential prolonged viral clearance. The need for more active cytotoxic NK cells might drive the upregulation of CD25 on the surface of younger subsets of NK cells to ensure higher numbers of proliferating cells fighting the viral infection.
The correlation between NKp46 expression and y-IFN production in all subsets of NK cells has been demonstrated by other recent studies as well. They have indicated that NK cells expressing high levels of NKp46 are associated with increased cytotoxicity and higher secretion of IFN-γ. For instance, Liu et al. demonstrated that NKp46high NK cells exhibit enhanced cytolytic activity and IFN-γ production compared to NKp46dim NK cells [34]. This suggests that NKp46 serves as a marker for identifying NK cells with potent antiviral capabilities, particularly in the context of viral infections such as COVID-19. In combination with y-IFN secretion, it suggests an attempt of the immune system, pointed towards an activated state, to resolve the ongoing infection. Another study investigated the mechanisms governing IFN-γ production by NK cells in response to influenza-infected dendritic cells (DCs). The researchers found that blocking NKp46 with specific antibodies led to an 80–90% reduction in IFN-γ production, as well as CD69 expression [35]. This suggests that NKp46 recognition of infected DCs is essential for optimal IFN-γ secretion by NK cells.
The positive correlation between NKG2D and CD107a in CD56dim NK cells might be described as expected. This can suggest that higher NKG2D expression enhances NK cell degranulation capacity. The indication that NKG2D activation plays a crucial role in promoting NK cell cytotoxic functions has also been proposed by other researchers [36,37].
These correlations depict a highly coordinated NK cell response during COVID-19. Subsets with specialized roles—cytotoxicity (CD57+, NKp46+, NKG2D) and proliferation (CD25+)—appear to interact, balancing immune activation and regulation. This interplay is crucial for effective viral clearance while minimizing immunopathology. Further exploration could clarify how these relationships influence disease severity or resolution.
Perforin and granzyme-B secretion correlating within all subpopulations of NK cells is also an expected result. Perforin facilitates the entry of granzymes into target cells by forming pores in the target cell membrane, allowing granzymes to induce apoptosis. Given their collaborative roles in mediating cytotoxicity, it is logical to infer a positive correlation between their expressions.
Another correlation we reported, in the context of the cytolytic molecules, is the negative interplay between NKG2A expression and perforin/granzyme-B. In NK cells, the expression of the inhibitory receptor NKG2A has been associated with reduced cytotoxic activity. This reduction is characterized by decreased levels of cytotoxic molecules such as granzyme B and perforin [38]. The engagement of NKG2A with its ligand, HLA-E, transmits inhibitory signals that suppress NK cell activation and cytotoxic functions. This suppression includes the downregulation of granzyme B and perforin expression [39].
Our findings reveal distinct and dynamic changes in NK cell subpopulations during COVID-19. The persistent activation (IFN-γ, NKG2D, NKG2C) and upregulation of inhibitory markers (NKG2A) reflect a complex balance between immune activation and regulation:
  • Immune Dysregulation: The reduced cytotoxic potential (GZMB in CD16+CD56 cells) coupled with increased activation markers suggests a state of functional adaptation or partial exhaustion.
  • Adaptive-like Features: Elevated NKG2C expression indicates the recruitment of adaptive-like NK cells, possibly in response to prolonged viral or inflammatory stimuli.
  • Regulatory Balance: Sustained NKG2A upregulation highlights mechanisms to mitigate hyperinflammation, which is a hallmark of severe COVID-19.

5. Conclusions

This exploratory study investigates changes in NK cell activity following SARS-CoV-2 infection, highlighting a complex interplay among activation, exhaustion, and functional impairment. Our findings indicate that NK cells in COVID-19 may exhibit hyperactivation alongside features of dysfunction, potentially influenced by inhibitory receptor expression and altered immunoregulatory interactions. Specifically, the overexpression of NKG2A, together with lower levels of NKp46 and CD25, may contribute to reduced cytotoxic potential and impaired immune clearance. While these patterns are consistent with previously described features of NK cell dysregulation in COVID-19, the small sample size limits the generalizability of our results. These preliminary findings support the need for larger, longitudinal studies to validate our observations and explore therapeutic strategies aimed at restoring NK cell function.

6. Limitations of the Study

The main limitation of this study is the limited number of patients analyzed, which may constrain the statistical power and limit the broader applicability of the results. Additionally, the specific SARS-CoV-2 variants infecting the patients were not identified, which limits the ability to correlate NK cell responses with viral lineage–specific effects.

Supplementary Materials

The following supporting information can be downloaded at: https://www.mdpi.com/article/10.3390/immuno5030035/s1, Figure S1: Gating strategy for the immune phenotyping of NK cell subsets. S1(A): Time vs. FSC dotplot, where events are excluded at periods of time during acquisition where micro bubbles, micro clogs, or dry air were introduced; S1(B): FSC vs. SSC dotplot, used for parameters of acquisition adjustment (threshold, voltages); S1(C): FSC-area vs. FSC-height dotplot, where only single cells are selected, and doublets are excluded; S1(D): CD45 vs. FVS dotplot, where only viable (negative for FVS) and CD45-positive events are selected; S1(E): CD3 vs. CD14/CD19 dotplot, where only double negative events are selected; S1(F): CD16 vs. CD56 dotplot, where four subpopulations of NK cells are identified. Each subpopulation from S1(F) is then visualized on histograms S1(G): CD57 expression, S1(H): CD69 expression, S1(I): IFN-γ expression, S1(J): CD25 expression; S1(K): Granzyme-B expression; S1(L): NKp46 expression; S1(M): Perforin expression; S1(N): NKG2A expression; S1(O): NKG2D expression; S1(P): NKG2C expression.

Author Contributions

Conceptualization: H.T. and S.P.; data curation: S.P.; formal analysis: S.P. and T.K.; funding acquisition: H.T. and M.M.; investigation: S.P., M.B., M.I., A.B., D.K., Y.K. and S.S.; methodology: S.P., H.T., D.K., Y.K. and S.S.; project administration: S.P.; resources: S.P., H.T., M.M. and A.T.; software: S.P. and T.K.; supervision: H.T.; visualization: S.P.; writing—original draft: S.P.; writing—review: H.T. and M.M. All authors have read and agreed to the published version of the manuscript.

Funding

This research was financially supported by: 1. Medical University–Plovdiv through Doctoral and Postdoctoral project number: HO-10/2023. 2. Project No. BG-RRP-2.004-0007-C01 “Strategic Research and Innovation Program for the Development of MU Plovdiv (SRIPD-MUP)”, Creation of a Network of Research Higher Schools, National Plan for Recovery and Sustainability, financed by the European Union.

Institutional Review Board Statement

The study was conducted in accordance with the Declaration of Helsinki, and approved by the Institutional Ethics Committee of Medical University of Plovdiv, Protocol No. 4/4 May 2023 for studies involving humans.

Informed Consent Statement

Informed consent was obtained from all subjects involved in the study.

Data Availability Statement

The raw data supporting the conclusions of this article will be made available by the authors on request.

Conflicts of Interest

The authors declare no conflicts of interest.

Abbreviations

The following abbreviations are used in this manuscript:
NKNatural killer
IFN-γInterferon-gamma
IL-6Interleukin-6
KIRsKiller cell immunoglobulin-like receptors
PPeriod (of analysis)
HCHealthy subjects
PBMCsPeripheral blood mononuclear cells
DMSODimethyl sulfoxide
CDCluster of differentiation
MFIMedian fluorescent intensity
PARP1poly(ADP-ribose) polymerase 1
DCAdirect cytotoxicity assay
EEffector cells
TTarget cells
FSCForward scatter
SSCSide scatter

References

  1. Li, M.; Guo, W.; Dong, Y.; Wang, X.; Dai, D.; Liu, X.; Wu, Y.; Li, M.; Zhang, W.; Zhou, H.; et al. Elevated Exhaustion Levels of NK and CD8+ T Cells as Indicators for Progression and Prognosis of COVID-19 Disease. Front. Immunol. 2019, 11, 580237. [Google Scholar] [CrossRef]
  2. Maucourant, C.; Filipovic, I.; Ponzetta, A.; Aleman, S.; Cornillet, M.; Hertwig, L.; Strunz, B.; Lentini, A.; Reinius, B.; Brownlie, D.; et al. Natural killer cell immunotypes related to COVID-19 disease severity. Sci. Immunol. 2020, 5, eabd6832. [Google Scholar] [CrossRef] [PubMed]
  3. Mazzoni, A.; Salvati, L.; Maggi, L.; Capone, M.; Vanni, A.; Spinicci, M.; Mencarini, J.; Caporale, R.; Peruzzi, B.; Antonelli, A.; et al. Impaired immune cell cytotoxicity in severe COVID-19 is IL-6 dependent. J. Clin. Investig. 2020, 130, 4694–4703. [Google Scholar] [CrossRef]
  4. Varchetta, S.; Mele, D.; Oliviero, B.; Mantovani, S.; Ludovisi, S.; Cerino, A.; Bruno, R.; Castelli, A.; Mosconi, M.; Vecchia, M.; et al. Unique immunological profile in patients with COVID-19. Cell. Mol. Immunol. 2021, 18, 604–612. [Google Scholar] [CrossRef]
  5. Krämer, B.; Knoll, R.; Bonaguro, L.; ToVinh, M.; Raabe, J.; Astaburuaga-García, R.; Schulte-Schrepping, J.; Kaiser, K.M.; Rieke, G.J.; Bischoff, J.; et al. Early IFN-α signatures and persistent dysfunction are distinguishing features of NK cells in severe COVID-19. Immunity 2021, 54, 2650–2669. [Google Scholar] [CrossRef]
  6. Vietzen, H.; Zoufaly, A.; Traugott, M.; Aberle, J.; Aberle, S.W.; Puchhammer-Stöckl, E. Deletion of the NKG2C receptor encoding KLRC2 gene and HLA-E variants are risk factors for severe COVID-19. Genet. Med. 2021, 23, 963–967. [Google Scholar] [CrossRef] [PubMed]
  7. Tarantino, N.; Litvinova, E.; Samri, A.; Soulié, C.; Morin, V.; Rousseau, A.; Dorgham, K.; Parizot, C.; Bonduelle, O.; Beurton, A.; et al. Identification of natural killer markers associated with fatal outcome in COVID-19 patients. Front. Cell Infect. Microbiol. 2023, 13, 1165756. [Google Scholar] [CrossRef]
  8. Casado, J.L.; Moraga, E.; Vizcarra, P.; Velasco, H.; Martín-Hondarza, A.; Haemmerle, J.; Gómez, S.; Quereda, C.; Vallejo, A. Expansion of cd56dim cd16neg nk cell subset and increased inhibitory kirs in hospitalized COVID-19 patients. Viruses 2022, 14, 46. [Google Scholar] [CrossRef]
  9. Lenart, M.; Górecka, M.; Bochenek, M.; Barreto-Duran, E.; Szczepański, A.; Gałuszka-Bulaga, A.; Mazur-Panasiuk, N.; Węglarczyk, K.; Siwiec-Koźlik, A.; Korkosz, M.; et al. SARS-CoV-2 infection impairs NK cell functions via activation of the LLT1-CD161 axis. Front. Immunol. 2023, 14, 1123155. [Google Scholar] [CrossRef]
  10. Osman, M.; Faridi, R.M.; Sligl, W.; Shabani-Rad, M.T.; Dharmani-Khan, P.; Parker, A.; Kalra, A.; Tripathi, M.B.; Storek, J.; Tervaert, J.W.C.; et al. Impaired natural killer cell counts and cytolytic activity in patients with severe COVID-19. Blood Adv. 2020, 4, 5035–5039. [Google Scholar] [CrossRef]
  11. Yasin, M.M.; Shehata, I.H.; Elsheikh, N.G.; Elsayed, M.S. Expression of NKG2A inhibitory receptor on cytotoxic lymphocytes as an indicator of severity in Corona Virus Disease 2019 (COVID-19) patients. Egypt. J. Immunol. 2021, 28, 157–167. [Google Scholar] [CrossRef] [PubMed]
  12. Bergantini, L.; D’alessandro, M.; Cameli, P.; Cavallaro, D.; Gangi, S.; Cekorja, B.; Sestini, P.; Bargagli, E. Nk and T cell immunological signatures in hospitalized patients with COVID-19. Cells 2021, 10, 3182. [Google Scholar] [CrossRef] [PubMed]
  13. Lee, M.J.; Leong, M.W.; Rustagi, A.; Beck, A.; Zeng, L.; Holmes, S.; Qi, L.S.; Blish, C.A. SARS-CoV-2 escapes direct NK cell killing through Nsp1-mediated downregulation of ligands for NKG2D. Cell Rep. 2022, 41, 111892. [Google Scholar] [CrossRef]
  14. Claus, M.; Pieris, N.; Urlaub, D.; Bröde, P.; Schaaf, B.; Durak, D.; Renken, F.; Watzl, C. Early expansion of activated adaptive but also exhausted NK cells during acute severe SARS-CoV-2 infection. Front. Cell. Infect. Microbiol. 2023, 13, 1266790. [Google Scholar] [CrossRef]
  15. Riedhammer, C.; Halbritter, D.; Weissert, R. Peripheral Blood Mononuclear Cells: Isolation, Freezing, Thawing, and Culture. Methods Mol. Biol. 2014, 1304, 53–61. [Google Scholar] [CrossRef]
  16. Hønge, B.L.; Petersen, M.S.; Olesen, R.; Møller, B.K.; Erikstrup, C. Optimizing recovery of frozen human peripheral blood mononuclear cells for flow cytometry. PLoS ONE 2017, 12, e0187440. [Google Scholar] [CrossRef]
  17. Kandarian, F.; Sunga, G.M.; Arango-Saenz, D.; Rossetti, M. A Flow Cytometry-Based Cytotoxicity Assay for the Assessment of Human NK Cell Activity. J. Vis. Exp. 2017, 2017, e56191. [Google Scholar] [CrossRef]
  18. Mata, M.M.; Mahmood, F.; Sowell, R.T.; Baum, L.L. Effects of cryopreservation on effector cells for antibody dependent cell-mediated cytotoxicity (ADCC) and natural killer (NK) cell activity in 51Cr-release and CD107a assays. J. Immunol. Methods 2014, 406, 1–9. [Google Scholar] [CrossRef]
  19. Schiuma, G.; Beltrami, S.; Bortolotti, D.; Rizzo, S.; Rizzo, R. Innate Immune Response in SARS-CoV-2 Infection. Microorganisms 2022, 10, 501. [Google Scholar] [CrossRef] [PubMed]
  20. Beer, J.; Crotta, S.; Breithaupt, A.; Ohnemus, A.; Becker, J.; Sachs, B.; Kern, L.; Llorian, M.; Ebert, N.; Labroussaa, F.; et al. Impaired immune response drives age-dependent severity of COVID-19. J. Exp. Med. 2022, 219, e20220621. [Google Scholar] [CrossRef]
  21. Vavilova, J.D.; Ustiuzhanina, M.O.; Boyko, A.A.; Streltsova, M.A.; Kust, S.A.; Kanevskiy, L.M.; Iskhakov, R.N.; Sapozhnikov, A.M.; Gubernatorova, E.O.; Drutskaya, M.S.; et al. Alterations in the CD56− and CD56+ T Cell Subsets during COVID-19. Int. J. Mol. Sci. 2023, 24, 9047. [Google Scholar] [CrossRef]
  22. Fernández-Soto, D.; García-Jiménez, Á.F.; Casasnovas, J.M.; Valés-Gómez, M.; Reyburn, H.T. Elevated levels of cell-free NKG2D-ligands modulate NKG2D surface expression and compromise NK cell function in severe COVID-19 disease. Front. Immunol. 2024, 15, 1273942. [Google Scholar] [CrossRef]
  23. Yaqinuddin, A.; Kashir, J. Innate immunity in COVID-19 patients mediated by NKG2A receptors, and potential treatment using Monalizumab, Cholroquine, and antiviral agents. Med. Hypotheses 2020, 140, 109777. [Google Scholar] [CrossRef] [PubMed]
  24. Jaiswal, S.R.; Arunachalam, J.; Bhardwaj, A.; Saifullah, A.; Lakhchaura, R.; Soni, M.; Bhagawati, G.; Chakrabarti, S. Impact of adaptive natural killer cells, KLRC2 genotype and cytomegalovirus reactivation on late mortality in patients with severe COVID-19 lung disease. Clin. Transl. Immunol. 2022, 11, e1359. [Google Scholar] [CrossRef]
  25. Bozzano, F.; Dentone, C.; Perrone, C.; Di Biagio, A.; Fenoglio, D.; Parodi, A.; Mikulska, M.; Bruzzone, B.; Giacobbe, D.R.; Vena, A.; et al. Extensive activation, tissue trafficking, turnover and functional impairment of NK cells in COVID-19 patients at disease onset associates with subsequent disease severity. PLoS Pathog. 2021, 17, e1009448. [Google Scholar] [CrossRef] [PubMed]
  26. Malengier-Devlies, B.; Filtjens, J.; Ahmadzadeh, K.; Boeckx, B.; Vandenhaute, J.; De Visscher, A.; Bernaerts, E.; Mitera, T.; Jacobs, C.; Vanderbeke, L.; et al. Severe COVID-19 patients display hyper-activated NK cells and NK cell-platelet aggregates. Front. Immunol. 2022, 13, 861251. [Google Scholar] [CrossRef]
  27. Lee, M.; de Los Rios Kobara, I.; Barnard, T.; Torres, X.V.; Tobin, N.; Ferbas, K.; Rimoin, A.W.; O Yang, O.; Aldrovandi, G.M.; Wilk, A.J.; et al. NK cell-monocyte cross-talk underlies NK cell activation in severe COVID-19. bioRxiv 2023. [Google Scholar] [CrossRef]
  28. Leem, G.; Cheon, S.; Lee, H.; Choi, S.J.; Jeong, S.; Kim, E.S.; Jeong, H.W.; Jeong, H.; Park, S.-H.; Kim, Y.-S.; et al. Abnormality in the NK-cell population is prolonged in severe COVID-19 patients. J. Allergy Clin. Immunol. 2021, 148, 996–1006.e18. [Google Scholar] [CrossRef] [PubMed]
  29. Wilk, A.J.; Lee, M.J.; Wei, B.; Parks, B.; Pi, R.; Martínez-Colón, G.J.; Ranganath, T.; Zhao, N.Q.; Taylor, S.; Becker, W.; et al. Multi-omic profiling reveals widespread dysregulation of innate immunity and hematopoiesis in COVID-19. J. Exp. Med. 2021, 218, e20210582. [Google Scholar] [CrossRef]
  30. Ye, W.; Zhang, W.; Wu, S.; Zhu, M.; Xu, Z. Study of surface activation markers on CD3CD16+ NK cells and their correlation with clinical manifestations in children with infectious mononucleosis. Microbiol. Immunol. 2021, 65, 400–404. [Google Scholar] [CrossRef]
  31. Herrera, L.; Martin-Inaraja, M.; Santos, S.; Inglés-Ferrándiz, M.; Azkarate, A.; Perez-Vaquero, M.A.; Vesga, M.A.; Vicario, J.L.; Soria, B.; Solano, C.; et al. Identifying SARS-CoV-2 ‘memory’ NK cells from COVID-19 convalescent donors for adoptive cell therapy. Immunology 2022, 165, 234–249. [Google Scholar] [CrossRef] [PubMed]
  32. Hsieh, W.C.; Lai, E.Y.; Liu, Y.T.; Wang, Y.F.; Tzeng, Y.S.; Cui, L.; Lai, Y.-J.; Huang, H.-C.; Huang, J.-H.; Ni, H.-C.; et al. NK cell receptor and ligand composition influences the clearance of SARS-CoV-2. J. Clin. Investig. 2021, 131, e146408. [Google Scholar] [CrossRef] [PubMed]
  33. Srivastava, R.; Dhanushkodi, N.; Prakash, S.; Coulon, P.G.; Vahed, H.; Zayou, L.; Quadiri, A.; BenMohamed, L. High Frequencies of Phenotypically and Functionally Senescent and Exhausted CD56+CD57+PD-1+ Natural Killer Cells, SARS-CoV-2-Specific Memory CD4+ and CD8+ T cells Associated with Severe Disease in Unvaccinated COVID-19 Patients. bioRxiv 2022. [Google Scholar] [CrossRef]
  34. Liu, B.; Yang, G.X.; Sun, Y.; Tomiyama, T.; Zhang, W.; Leung, P.S.C.; He, X.-S.; Dhaliwal, S.; Invernizzi, P.; Gershwin, M.E.; et al. Decreased CD57 expression of natural killer cells enhanced cytotoxicity in patients with primary sclerosing cholangitis. Front. Immunol. 2022, 13, 912961. [Google Scholar] [CrossRef]
  35. Draghi, M.; Pashine, A.; Sanjanwala, B.; Gendzekhadze, K.; Cantoni, C.; Cosman, D.; Moretta, A.; Valiante, N.M.; Parham, P. NKp46 and NKG2D Recognition of Infected Dendritic Cells Is Necessary for NK Cell Activation in the Human Response to Influenza Infection. J. Immunol. 2007, 178, 2688–2698. [Google Scholar] [CrossRef]
  36. Kim, J.M.; Yi, E.; Cho, H.; Choi, W.S.; Ko, D.H.; Yoon, D.H.; Hwang, S.-H.; Kim, H.S. Assessment of NK Cell Activity Based on NK Cell-Specific Receptor Synergy in Peripheral Blood Mononuclear Cells and Whole Blood. Int. J. Mol. Sci. 2020, 21, 8112. [Google Scholar] [CrossRef]
  37. Deguine, J.; Breart, B.; Lemaître, F.; Bousso, P. Cutting Edge: Tumor-Targeting Antibodies Enhance NKG2D-Mediated NK Cell Cytotoxicity by Stabilizing NK Cell–Tumor Cell Interactions. J. Immunol. 2012, 189, 5493–5497. [Google Scholar] [CrossRef]
  38. Gaddy, J.; Broxmeyer, H.E. Cord blood CD16+56- cells with low lytic activity are possible precursors of mature natural killer cells. Cell. Immunol. 1997, 180, 132–142. [Google Scholar] [CrossRef] [PubMed]
  39. Wang, Y.; Xu, H.; Zheng, X.; Wei, H.; Sun, R.; Tian, Z. High Expression of NKG2A/CD94 and Low Expression of Granzyme B Are Associated with Reduced Cord Blood NK Cell Activity. Cell. Mol. Immunol. 2007, 4, 377–382. [Google Scholar]
Figure 1. (A): Expression of NKG2D, NKG2A, and NKG2C in the CD56+CD16 NK cell population tested in P1 (n = 5), P2 (n = 15), and healthy controls (n = 20); (B): Expression of CD69, CD25, and CD57 in the CD56+CD16 NK cell population tested in P1, P2, and in healthy controls. (C): Intracellular expression of IFN−γ, Granzyme−B, and Perforin in the CD56+CD16 NK-cell population examined in P1, P2 and in healthy controls. Data from the Mann–Whitney U−test is shown as mean ± SD.
Immuno 05 00035 g001aImmuno 05 00035 g001b
Figure 2. (A): Expression of NKG2D, NKG2A, and NKG2C in the CD56+CD16+ NK cell population tested in P1, P2, and in healthy controls; (B): Expression of CD69, CD25, and CD57 in the CD56+CD16+ NK cell population tested in P1 (n = 5), P2 (n = 15), and in healthy controls (n = 20). (C): Intracellular expression of IFN-γ, Granzyme-B, and Perforin in the CD56+CD16+ NK-cell population examined in P1, P2, and in healthy controls. Data from the Mann–Whitney U-test is shown as mean ± SD.
Immuno 05 00035 g002
Figure 3. Expression of NKp46 in the CD16+CD56 NK-cell population examined in P1 (n = 5), P2 (n = 15), and in healthy controls (n = 20). Data from the Mann–Whitney U−test is shown as mean ± SD.
Immuno 05 00035 g003
Figure 4. (A): Expression of NKG2D, NKG2A, and NKG2C in the CD16+CD56 NK cell population tested in P1, P2, and in healthy controls; (B): Expression of CD69, CD25, and CD57 in the CD16+CD56 NK cell population tested in P1 (n = 5), P2 (n = 15), and in healthy controls (n = 20). (C): Intracellular expression of IFN−γ, Granzyme−B, and Perforin in the CD16+CD56 NK-cell population examined in P1, P2 and in healthy controls. Data from the Mann–Whitney U−test is shown as mean ± SD.
Immuno 05 00035 g004
Figure 5. (A): Expression of NKG2D, NKG2A, and NKG2C in the CD56dim NK cell population tested in P1 (n = 5), P2 (n = 15), and in healthy controls (n = 20); (B): Expression of CD69, CD25, and CD57 in the CD56dim NK cell population tested in P1, P2, and in healthy controls. (C): Intracellular expression of IFN-γ, Granzyme-B, and Perforin in the CD56dim NK-cell population examined in P1 (n = 5), P2 (n = 15), and in healthy controls (n = 20). Data from the Mann–Whitney U-test is shown as mean ± SD.
Immuno 05 00035 g005aImmuno 05 00035 g005b
Figure 6. Heatmap representing the MFI z-score of all phenotypic markers in all four subpopulations of NK cells, analyzed in HC, P1, and P2.
Immuno 05 00035 g006
Figure 7. Heatmap generated from a correlation matrix displaying pairwise correlations between variables. Colors indicate the strength and direction of the correlations (blue = negative, red = positive). Correlation coefficients were calculated using Spearman’s method. Significance levels were adjusted for multiple comparisons using the FDR correction. Relationships are shown between the different phenotypic markers in the four subpopulations of NK cells in P2.
Immuno 05 00035 g007
Figure 8. (A): Correlation analysis showing a positive correlation between NKp46 expression in CD16+CD56 and CD25 expression in CD56+CD16 subpopulations. (B): Correlation analysis showing the negative correlation between two survey parameters for individuals in P2. As CD57 expression increased in one subpopulation, there was a decrease in CD25 expression in the other subpopulation.
Immuno 05 00035 g008
Figure 9. (A): Target cells are initially gated, based on their FSC and SSC characteristics; (B): Target cells are gated, based on positive expression for mNeonGreen fluorescent protein; (C): Dead target cells are gated as positive for propidium iodide; (D): Dead cells in the negative control sample.
Immuno 05 00035 g009
Figure 10. (A): Effector cells are gated as SSClow and CD45+ (purple); (B): NK cells are gated as CD3 (yellow); (C): NK cells are gated as CD16+CD56+ (orange); (D): CD107a expression is gated on the histogram, where all events come from the NK cells gate.
Immuno 05 00035 g010
Figure 11. (A): Results from a direct cytotoxicity assay. Results show the percentage of dead target cells determined in P1, P2, and in healthy subjects. Data from the Mann–Whitney U-test is shown as mean ± SD; (B): Percentage of NK cells expressing CD107a during the assay to determine direct cytotoxicity. Data is presented as median and interquartile range.
Immuno 05 00035 g011
Table 1. Summary of the relative frequencies (expressed as percentages of total NK cells) of four NK cell subpopulations—CD56+CD16+, CD56dim, CD56+CD16, and CD16+CD56.
NK Cell SubpopulationsP1P2HC
% From NK CellsSD% From NK CellsSD% From NK CellsSD
CD56+CD16+18.35±7.7538.89±13.5131.28±20.92
CD56dim4±3.19.98±5.3312.1±11.46
CD56+CD163.5±0.78.66 a±4.726.53 a±5.86
CD16+CD561.45 b±0.053.92 b±1.651.63±1.61
a p < 0.05 for comparison between P2 and HC. b p < 0.05 for comparison between P1 and P2.
Disclaimer/Publisher’s Note: The statements, opinions and data contained in all publications are solely those of the individual author(s) and contributor(s) and not of MDPI and/or the editor(s). MDPI and/or the editor(s) disclaim responsibility for any injury to people or property resulting from any ideas, methods, instructions or products referred to in the content.