Abstract
Existing tools (including GeneXpert) for diagnosis of multidrug resistant TB (MDR-TB) have limited utility when sputum samples for microbiological analyses cannot be obtained. There is the need for immunological biomarkers which could serve as putative diagnostic markers of MDR-TB. We measured and compared the serum cytokine levels of inflammatory cytokines (IFN-γ, TNF-α, IL12p70, IL-17A, granzyme B) and anti-inflammatory cytokines (IL-10, IL-6, IL-4) among MDR-TB, drug-susceptible (DS)-TB and healthy controls (no-TB) using the Human Magnetic Luminex Multiplex Immunoassay. Levels of IFN-γ and IL-4 were respectively 1.5 log lower and 1.9 log higher in MDR-TB compared to DS-TB cases. Moreover, IFN-γ, TNF-α, IL-10, IL-6, and IL-4 levels were significantly higher in individuals with MDR-TB and DS-TB cases compared to healthy controls. Pairs of cytokines, IL-4 and IFN-γ (p = 0.019), IL-4 and TNF (p = 0.019), and Granzyme B and TNF-α (p = 0.019), showed significant positive correlation in MDR-TB. Serum cytokine profiles can be exploited for immunodiagnostics, as made evident by the Interferon Gamma Release Assays (IGRAs) for TB infection. Using area under the curve values, no single or multiple cytokine combinations could discriminate between DS- and MDR-TB in this study. Studies with a larger sample size and more cytokines could better address the issue.
1. Introduction
Among the top ten leading causes of death worldwide, tuberculosis (TB) ranks ninth but remains the leading cause of death from a single infectious agent. Compounding the control of TB is the growing global phenomenon of antibiotic drug resistance. The long duration of TB therapy (6 to 9 months) ironically makes M. tuberculosis an ideal candidate for drug and multidrug resistance (MDR). MDR-TB, defined as resistance to the two most effective first-line drugs (isoniazid and rifampicin), is a worldwide clinical problem associated with high morbidity and mortality [1]. It is difficult to treat and requires longer treatment periods. The global prevalence of MDR-TB is alarming with most reported cases from Africa and Asia [2,3].
According to the global tuberculosis report (2020), the coverage of rifampicin resistance testing, unarguably the most potent and effective of TB medicines, was 59% for new and 81% for previous bacteriologically confirmed TB cases. The fact that millions of deaths (53 million 2000–2016) are averted when TB cases are diagnosed early and successfully treated lends credence to the assertion that like most infectious disease, TB can be effectively controlled and even eliminated by early diagnosis and prompt treatment [4]. However, the challenges to implementing a test-and-treat strategy are even more complex in the face of MDR-TB. This challenge of late diagnosis has been improved by scaling up MDR-TB/RR-TB (Rifampicin-Resistant-TB) detection using GeneXpert, from 7% in 2012 to 61% in 2019 [4,5]. However, the use of GeneXpert for diagnosis of multidrug resistant TB (MDR-TB) is limited by the difficulty in producing quality sputum specimen for microbiological analyses in specific cases such as pediatric or extrapulmonary TB. Identification of sputum-independent samples for diagnosis of MDR-TB are needed.
A blood sample is best suited for such a purpose not only due to the ease of access, but it represents a reservoir of immune cells trafficking to and from the sites of active disease and lymphoid organs [6]. Analytes such as cytokines in blood components associated with a TB disease state could be a useful surrogate marker [7,8,9,10]. In this dispensation of increasing numbers of MDR-TB cases, the search for cytokine biomarkers with the potential to discriminate DS-TB cases from MDR-TB cases is crucial. Mounting data supports the critical role of cytokines in the immune response to mycobacterial infections [11,12,13].
MDR-TB is characterized by disturbance between protective and pathogenic effects induced by the immunosuppression of Th1 and Th2 type responses [11,14,15]. However, the role of Th2 cytokines as classical antagonists of the Th1 profile has not been fully elucidated. The identification of an immunological biomarker with the potential to segregate MDR-TB from drug-susceptible TB (DS-TB) could lay the foundation for point-of-care tests to provide correlates of early treatment effect, risk of relapse, and eventual development into MDR-TB.
In this study, we measured the concentration of selected TB pathogenesis-associated proinflammatory, anti-inflammatory cytokines in the serum of MDR-TB patients, DS-TB patients, and healthy controls with no TB to identify associated cytokine profiles. We hypothesized that individuals with MDR-TB disease will have different cytokine signatures compared with those with DS-TB disease or no TB. We aimed to identify specific biosignatures as putative biomarkers, which may be useful at the early phase of diagnosis for monitoring therapeutic effects even before confirmation of M. tuberculosis growth or clearance in culture.
2. Materials and Methods
2.1. Study Participants and Sampling
Sixty-seven (69) serum samples from 21 MDR-TB, 25 DS-TB, and 23 no-TB (QuantiFERON TB test-negative) individuals were used. The study participants were recruited from the chest clinic of Korle-Bu teaching hospital and other regional TB referral centers across Ghana between January and May 2015 by convenient sampling for an MDR-TB study and a TB biomarker study. DS-TB cases were confirmed by sputum microscopy using the auramine stained fluorescence microscopy technique. MDR species were confirmed by culture on Lowenstein Jensen (LJ) media, followed by drug sensitivity testing using the proportion method. Isolates that were sensitive to isoniazid and rifampicin were considered as susceptible and patients categorized as DS-TB patients. Isolates that showed resistance to both isoniazid and rifampicin were considered as multidrug-resistant (MDR) and patients categorized as MDR-TB patients.
QuantiFERON-TB negative participants were considered as healthy controls (no TB infection) using the QuantiFERON-TB Gold test (Cellestis, Victoria, Australia) and the QFT-IT Analysis Software according to manufacturer’s instructions. From all participants, blood samples (2–5 mL) were collected in vacutainer tubes without anti-coagulants. After 30–60 min at room temperature, samples were centrifuged at 1500 rpm for 15 min, and the resulting sera were stored at −80 °C until analysis. Blood samples from MDR-TB and DS-TB patients were taken prior to anti-TB therapy initiation. Patients with HIV/AIDS, cancer, or those on steroid therapy were excluded from this study. Samples were blinded for all patient information except study number and sampling day until after testing.
2.2. Quantification of Serum Cytokines
Cytokine quantification was performed by multiplexing using the Luminex™ 200 system (Luminex, Austin, TX, USA) following manufacturer’s instructions. The Luminex-200 system uses uniformly sized microspheres internally labeled with graded proportions of a red and a near-infrared fluorescence Au uniform, 658 and 712 nm, providing the capacity to interrogate and classify 100 discrete beads. TNF-α, IFN-γ, IL-4, IL-6, IL-10, IL-17A, Granzyme B, and IL-12p70 were analyzed in 1:2 diluted samples in this 8-plex assay. All samples were run in duplicate.
2.3. Statistical Analysis
All data were entered in Microsoft Excel 2010, and demographic details (age profile, geographical distributions, educational status, and other risk factors) were assessed using descriptive statistics. To compare concentration differences of each of the eight analytes between the groups, GraphPad Prism V 7.03 (Mann−Whitney U test) was used for analysis of graphs. Numeric variables were expressed as median (interquartile range) for all cytokines in the different population groups. Statistical analysis was performed using SPSS (V 23). Pairwise analysis was performed by chi square. Spearman analysis was employed to assess correlations among continuous variables. Receiver operating characteristic (ROC) curves were constructed and the area under the ROC curve (AUROC) was used to evaluate the sensitivity of each cytokine level to discriminate between different population groups [16].
3. Results
3.1. Characteristics of Participants
A total of sixty-nine (69) serum samples were used for the study, 21 MDR-TB (30.4%), 25 DS-TB (36.2%), and 23 no-TB (33.3%). The average ages were similar for the three groups: 46 years (range 15–56) for MDR-TB, 36 years (range 20–58) for DS-TB, and 40 years (range 25–52 for No-TB). The socio-demographic characteristics of the MDR-TB and DS-TB cases are shown in Table 1.

Table 1.
Socio-demographic characteristics of MDR-TB and DS-TB cases.
3.2. Analyzing Biosignatures of Patients with MDR-TB and DS-TB
Results of the multiplex assay were expressed as median concentration (pg/mL) and used for the analysis (Mann−Whitney U test). There was 1.5-fold decrease and 1.9-fold increase in IFN-γ and IL-4 concentration, respectively, in MDR-TB compared to DS-TB patients (Figure 1). This trend was not observed for the six remaining cytokines. The average concentrations for all the eight cytokines were lowest in the healthy control group. The concentrations of IFN-γ, TNF-α, IL-6, IL-10, and IL-4 were significantly higher in DS-TB cases compared to healthy controls (p = 0.0003, 0.005, 0.0075, 0.0115, and 0.0110, respectively). Similarly, the concentrations of TNF-α, IL-4, and IFN-γ were significantly higher in MDR-TB patients compared to healthy controls (p < 0.0001, 0.0003, 0.0222, respectively), as shown in Figure 1.
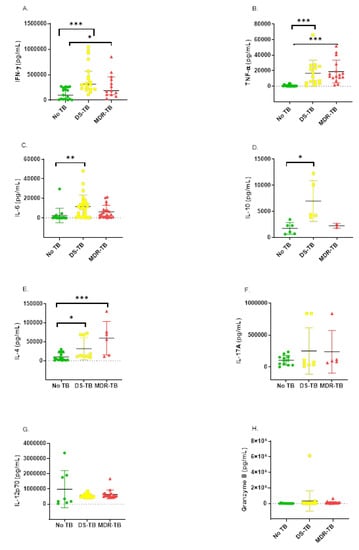
Figure 1.
Background corrected serum concentrations of cytokines (A–H) in participants with MDR-TB (triangle), DS-TB (square), and No-TB (circle). Statistical differences were analyzed using Mann−Whitney U tests (* = p < 0.01, ** = p < 0.001, *** = p < 0.0001).
3.3. Ability of Cytokine Responses to Discriminate between Groups
3.4. Receiver Operating Characteristic (ROC) Analyses
We performed ROC analysis to determine the diagnostic potential of each of the eight cytokines to discriminate between any two of the three study groups. Based on the area under the curve values, no single cytokine could significantly (p < 0.05) discriminate between DS-TB and MDR-TB (graphs not shown). However, TNF-α, Granzyme B, IL-6, IL-4, and IFN-γ could significantly discriminate between either No-TB and DS-TB or No-TB and MDR TB. The representative curves showing the cytokines with the best diagnostic accuracy between and among these groups are shown in Figure 2.
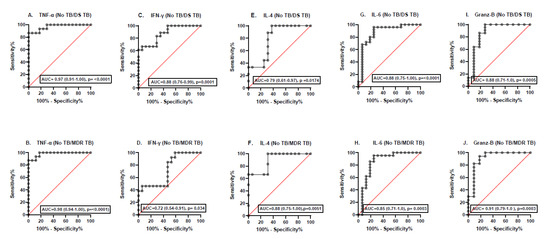
Figure 2.
ROC curves (A–J) showing the accuracies of individual serum cytokines in distinguishing between No-TB and MDR-TB or DS-TB.
3.5. Correlation between the Eight Serum Cytokines
A Spearman rho test of correlation between serum cytokines was performed. There was a significantly positive correlation between the following pairs of cytokines in healthy controls: IL-12 and IL-6 (p = 0.028); DS-TB: Granzyme B and IL-6 (p = 0.023), IL-12p70 and IL-17A (p = 0.001); MDR-TB: IL-4 and IFN-γ (p = 0.019), IL-4 and TNF (p = 0.019), and Granzyme B and TNF-α (p = 0.019). In general, there were high positive correlations (r > 0.7) between IL-17A and IL-4, IL-12 p70 and IL-17 A (MDR-TB), and IL-10 and Granzyme B (DS-TB). There was also high negative correlation between IL-4 and IFN-γ, IL-17A and IFN-γ, IL-4 and TNF-α, and IL-17A and TNF-α (MDR-TB); TNF-α and IL-10 (DS-TB); and IL-12p70 and IL-6 (No-TB) (Figure 3).
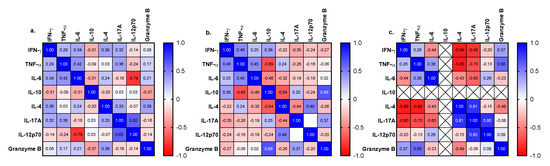
Figure 3.
Heat map of Spearman rho correlations between cytokines measured in serum of participants with No-TB (a), DS-TB (b), and MDR-TB (c).
4. Discussion
M. tuberculosis infection triggers complex host−pathogen interactions, which culminate in the induction of several inflammatory mediators such as cytokines [12,16]. We have identified that the concentration of IFN-γ and IL-4 were respectively 1.5 log lower and 1.9 log higher in MDR-TB compared to DS-TB cases. In addition, the concentration of IFN-γ, TNF-α, IL-10, IL-6, and IL-4 were significantly higher in MDR-TB and DS-TB cases compared to the healthy controls (No-TB).
In a similar study, serum levels of IFN-γ were significantly elevated in new, under-treatment and MDR-TB cases compared to healthy controls, but there was no significant difference between under treatment and MDR-TB patients [17,18]. Whole blood stimulation of culture filtrate protein of M. tuberculosis reported no significant difference in IFN-γ levels between DS-TB and MDR-TB [13]. Recent studies on IFN-γ have reported its pro-inflammatory role in addition to it serving as the major activator of macrophages towards protective immune response [19,20,21]. Interestingly, the mean concentration of IFN-γ was predominant in MDR-TB cases with poor treatment outcome [22]. As a dominant cytokine within the Th1 subset [14], one may expect a positive correlation between disease progression and down-regulation of IFN-γ. Notably, the distinctive potential of IFN-γ in DS-TB and MDR-TB may involve a complex array of mechanisms that vary from its diagnostic potential.
IL-4 is a Th2 cytokine believed to be an indicator of weak cytotoxic activity detected in DS and MDR-TB patients [23,24]. The high concentration of IL-4 in MDR-TB compared to DS-TB and healthy control individuals from this study suggest that high IL-4 levels may favor disease progression. Reports from India investigating serum concentration of IL-4 showed significant elevation in MDR-TB cases compared to healthy controls, as observed in our study [25,26]. The pattern of change in regulatory T cells was seen to increase in drug-susceptible TB compared to successfully treated patients [27]. Assessment of regulatory T cells [28] supports the high level of IL-10 in DS-TB observed in this study compared to the healthy controls owing to their possible inhibitory effects [29]. Considering these changes, we assume a decreased Th1-lymphocyte activity coupled with heightened Th2 activity in these groups of MDR-TB patients compared to DS-TB.
The observed increase in IL-10 levels in active disease states from this study suggests a probable immunoregulatory role against the deleterious effect of the elevated IFN-γ and TNF-α levels through inflammatory reactions. Thus, the argument that the relationship between IL-10 (anti-inflammatory cytokine) and IFN-γ, TNF-α (pro-inflammatory cytokine) is not necessarily an antagonistic one [23,30] is buttressed; rather, the relationship appears to act in complementary fashion [31].
In this study, granzyme B, TNF-α, IFN-γ, IL-6, and IL-4 individually show a relatively greater potential (AUC 73% to 97% p < 0.05) to discriminate between either No-TB and DS-TB or No-TB and MDR-TB. IL-10 had the lowest (AUC 36.6% p = 0.554) predictive potential. This observation could be partly attributed to the least number of readable values recorded. TNF-α and IL-4 levels in MDR-TB and new cases were significantly elevated compared to patients under treatment [19]. In another study, IL-4 significantly increases in MDR-TB patients compared to healthy controls [32].
Statistically significant sensitivity patterns were observed for all the cytokines comparing MDR-TB and negative controls except for IL-17A, IL-10, and IL-12p70. The AUC of active TB (DS-TB) and healthy controls (No-TB) follows a similar pattern excluding IL-17A and IL-12p70. In M. tuberculosis infection, production of IL-12p70 is one of the earliest events in the activation of cell-mediated immunity [33,34] and hence may not be an excellent predictor in advanced stages of M. tuberculosis infection.
Due to the difficulty in recruiting participants with MDR-TB, we had to perform the analysis with samples from only 21 MDR patients, and to maintain proportionality, we used samples from 25 DS-TB and 23 healthy control individuals. The small sample size notwithstanding, our results show that serum cytokine profiles have the potential to be exploited for immunodiagnostics as some cytokines were clearly elevated in DS-TB and MDR-TB, compared to healthy controls with no TB. This has been made evident by the Interferon Gamma Release Assays (IGRAs) which use a specific IFN-γ cut-off to discriminate between TB infected and non-infected individuals. We did not have a cohort that had other respiratory diseases but no TB (No-TB, but non-healthy), which could have given more insight into serum cytokine levels during TB infection versus other respiratory infections.
5. Conclusions
Our study shows that MDR-TB is associated with lower levels of serum IFN-γ and higher levels of IL-4 compared to DS-TB. Moreover, Granzyme B, TNF-α, IFN-γ, IL-4, and IL-6 showed the greatest potential to distinguish between No-TB and DS-TB or MDR-TB. Using AUC values, no single or multiple cytokine combinations could discriminate between DS- and MDR-TB in this study. Ultimately, the utility of serum cytokines in development of immunodiagnostic assays for MDR-TB will depend on the generation of validated single/multiple cytokine cut-off levels that will be sufficiently robust to distinguish between MDR-TB from DS-TB. This should be further evaluated in larger cohort of participants and with inclusion of more host analytes.
Author Contributions
Conceptualization, G.I.M., D.J.-S.; methodology, G.I.M., A.N.B., A.B. and D.J.-S.; software, G.I.M. and A.N.B.; validation, G.I.M., A.N.B., E.O. and S.A.-B.; formal analysis, G.I.M. and A.N.B.; investigation, G.I.M. and A.N.B.; resources, G.I.M., A.N.B. and K.K.A.; data curation, G.I.M., A.N.B. and A.B.; writing—original draft preparation, G.I.M. and A.N.B.; writing—review and editing, G.I.M., D.J.-S. and K.K.A. and T.A.; visualization, G.I.M. and K.K.A.; supervision, G.I.M., K.K.A., M.F.O., E.O. and S.A.-B.; project administration, G.I.M. and K.K.A.; funding acquisition, G.I.M. and K.K.A. All authors have read and agreed to the published version of the manuscript.
Funding
This work was supported by the following funding sources: a grant (to G.I.M.) from the Bill and Melinda Gates Foundation through the postdoctoral training program in Infectious Diseases at Noguchi Memorial Institute for Medical Research, Ghana (Global Health Grant OPP52155). Publication charges were covered by grant to G.I.M. and A.N.B. by DELTAS Africa Initiative [Afrique One—ASPIRE/DEL-15-008]. Afrique One—ASPIRE is funded by a consortium of donors including the African Academy of Sciences (AAS), Alliance for Accelerating Excellence in Science in Africa (AESA), the New Partnership for Africa’s Development Planning and Coordinating (NEPAD) Agency, the Wellcome Trust [107753/A/15/Z], and the UK government.
Informed Consent Statement
The study was conducted according to the guidelines of the Declaration of Helsinki, and Samples used for this study were from research studies approved by the Ethics Review Committee of the School of Biomedical and Allied Health Sciences, University of Ghana (SBAHS/10080166/AA/MLS/2015-2016, SBAHS-MD./10551247/AA/5A/2016-2017) and the Institutional Review Board (IRB) of the Noguchi Memorial Institute for Medical Research (NMIMR-IRB CPN 114/15-16). All participants provided written informed consent for the collection of samples and subsequent analyses.
Data Availability Statement
The data presented in this study are available in the article.
Acknowledgments
We are grateful to the TB patients and healthy controls who consented to partake in this study and the health personnel of the hospitals where the participants were recruited. We also appreciate the technical support of Jones Amo-Amponsah and Ivy Amanor of the Immunology and Bacteriology Department of NMIMR.
Conflicts of Interest
The authors declare no conflict of interest.
References
- Gandhi, N.R.; Nunn, P.; Dheda, K.; Schaaf, H.S.; Zignol, M.; van Soolingen, D.; Jensen, P.; Bayona, J. Multidrug-resistant and extensively drug-resistant tuberculosis: A threat to global control of tuberculosis. Lancet 2010, 375, 1830–1843. [Google Scholar] [CrossRef]
- Diandé, S.; Sangaré, L.; Kouanda, S.; Dingtoumda, B.I.; Mourfou, A.; Ouédraogo, F.; Sawadogo, I.; Nébié, B.; Gueye, A.; Sawadogo, L.T.; et al. Risk factors for multidrug-resistant tuberculosis in four centers in Burkina Faso, West Africa. Microb. Drug Resist. 2009, 15, 217–221. [Google Scholar] [CrossRef] [PubMed]
- WHO. Global Tuberculosis Report. 2019. Available online: https://www.who.int/teams/global-tuberculosis-programme/tb-reports/global-report-2019 (accessed on 20 June 2021).
- Putra, I.W.G.A.E.; Kurniasari, N.M.D.; Dewi, N.P.E.P.; Suarjana, I.K.; Duana, I.M.K.; Mulyawan, I.K.H.; Riono, P.; Alisjahbana, B.; Probandari, A.; Notobroto, H.B.; et al. The implementation of early detection in tuberculosis contact investigation to improve case finding. J. Epidemiol. Glob. Health 2019, 9, 191. [Google Scholar] [CrossRef]
- Boakye-Appiah, J.K.; Steinmetz, A.R.; Pupulampu, P.; Ofori-Yirenkyi, S.; Tetteh, I.; Frimpong, M.; Oppong, P.; Opare-Sem, O.; Norman, B.R.; Stienstra, Y.; et al. High prevalence of multidrug-resistant tuberculosis among patients with rifampicin resistance using GeneXpert Mycobacterium tuberculosis/rifampicin in Ghana. Int. J. Mycobacteriology 2016, 5, 226–230. [Google Scholar] [CrossRef]
- Cliff, J.M.; Lee, J.-S.; Constantinou, N.; Cho, J.-E.; Clark, T.G.; Ronacher, K.; King, E.C.; Lukey, P.T.; Duncan, K.; Van Helden, P.D.; et al. Distinct phases of blood gene expression pattern through tuberculosis treatment reflect modulation of the humoral immune response. J. Infect. Dis. 2012, 207, 18–29. [Google Scholar] [CrossRef]
- Denkinger, C.M.; Pai, M.; Patel, M.; Menzies, D. Gamma interferon release assay for monitoring of treatment response for active tuberculosis: An explosion in the spaghetti factory. J. Clin. Microbiol. 2013, 51, 607–610. [Google Scholar] [CrossRef] [PubMed][Green Version]
- Butov, D.; Kuzhko, M.M.; Makeeva, N.I.; Butova, T.; Stepanenko, H.L.; Dudnyk, A.B. Association of interleukins genes polymorphisms with multi-drug resistant tuberculosis in Ukrainian population. Adv. Respir. Med. 2016, 84, 168–173. [Google Scholar] [CrossRef] [PubMed]
- Domingo-Gonzalez, R.; Prince, O.; Cooper, A.; Khader, S.A. Cytokines and chemokines in Mycobacterium tuberculosis infection. Microbiol. Spectr. 2016, 4, 4–5. [Google Scholar] [CrossRef]
- Djoba Siawaya, J.F.; Beyers, N.; Van Helden, P.; Walzl, G. Differential cytokine secretion and early treatment response in patients with pulmonary tuberculosis. Clin. Exp. Immunol. 2009, 156, 69–77. [Google Scholar] [CrossRef] [PubMed]
- Tan, Q.; Xie, W.P.; Min, R.; Dai, G.Q.; Xu, C.-C.; Pan, H.Q.; Miao, C.D.; Yang, Z.; Xu, W.G.; Wang, H. Characterization of Th1- and Th2-type immune response in human multidrug-resistant tuberculosis. Eur. J. Clin. Microbiol. Infect. Dis. 2011, 31, 1233–1242. [Google Scholar] [CrossRef]
- Flynn, J.L.; Chan, J.; Triebold, K.J.; Dalton, D.K.; Stewart, T.A.; Bloom, B.R. An essential role for interferon gamma in resistance to Mycobacterium tuberculosis infection. J. Exp. Med. 1993, 178, 2249–2254. [Google Scholar] [CrossRef]
- Sauzullo, I.; Mengoni, F.; Lichtner, M.; Massetti, A.P.; Rossi, R.; Iannetta, M.; Marocco, R.; Del Borgo, C.; Soscia, F.; Vullo, V.; et al. In vivo and in vitro effects of antituberculosis treatment on mycobacterial interferon-γ T cell response. PLoS ONE 2009, 4, e5187. [Google Scholar] [CrossRef]
- Bafica, A.; Scanga, C.A.; Feng, C.; Leifer, C.; Cheever, A.; Sher, A. TLR9 regulates Th1 responses and cooperates with TLR2 in mediating optimal resistance to Mycobacterium tuberculosis. J. Exp. Med. 2005, 202, 1715–1724. [Google Scholar] [CrossRef]
- Adekambi, T.; Ibegbu, C.C.; Cagle, S.; Kalokhe, A.S.; Wang, Y.F.; Hu, Y.; Day, C.L.; Ray, S.M.; Rengarajan, J. Biomarkers on patient T cells diagnose active tuberculosis and monitor treatment response. J. Clin. Investig. 2015, 125, 1827–1838. [Google Scholar] [CrossRef]
- Jacobs, R.; Malherbe, S.; Loxton, A.; Stanley, K.; van der Spuy, G.; Walzl, G.; Chegou, N.N. Identification of novel host biomarkers in plasma as candidates for the immunodiagnosis of tuberculosis disease and monitoring of tuberculosis treatment response. Oncotarget 2016, 7, 57581–57592. [Google Scholar] [CrossRef] [PubMed]
- Kellar, K.L.; Gehrke, J.; Weis, S.E.; Mahmutovic-Mayhew, A.; Davila, B.; Zajdowicz, M.J.; Scarborough, R.; LoBue, P.A.; Lardizabal, A.A.; Daley, C.L.; et al. Multiple cytokines are released when blood from patients with tuberculosis is stimulated with Mycobacterium tuberculosis antigens. PLoS ONE 2011, 6, e26545. [Google Scholar] [CrossRef] [PubMed]
- Moideen, K.; Kumar, N.P.; Bethunaickan, R.; Banurekha, V.V.; Nair, D.; Babu, S. Heightened systemic levels of anti-inflammatory cytokines in pulmonary tuberculosis and alterations following anti-tuberculosis treatment. Cytokine 2020, 127, 154929. [Google Scholar] [CrossRef] [PubMed]
- Cavalcanti, Y.V.N.; Brelaz, M.C.A.; Neves, J.K.D.A.L.; Ferraz, J.C.; Pereira, V.R.A. Role of TNF-alpha, IFN-gamma, and IL-10 in the development of pulmonary tuberculosis. Pulm. Med. 2012, 2012, 745483. [Google Scholar] [CrossRef] [PubMed]
- Fortes, A.; Pereira, K.; Antas, P.R.Z.; Franken, C.L.M.C.; Dalcolmo, M.; Ribeiro-Carvalho, M.M.; Sampaio, E.P. Detection of in vitro interferon-γ and serum tumour necrosis factor-α in multidrug-resistant tuberculosis patients. Clin. Exp. Immunol. 2005, 141, 541–548. [Google Scholar] [CrossRef]
- Ferreira, C.M.; Barbosa, A.M.; Barreira-Silva, P.; Silvestre, R.; Cunha, C.; Carvalho, A.; Rodrigues, F.; Correia-Neves, M.; Castro, A.G.; Torrado, E. Early IL-10 promotes vasculature-associated CD4+ T cells unable to control Mycobacterium tuberculosis infection. JCI Insight 2021. [Google Scholar] [CrossRef]
- Geffner, L.; Yokobori, N.; Basile, J.; Schierloh, P.; Balboa, L.; Romero, M.M.; Ritacco, V.; Vescovo, M.; Montaner, P.G.; Lopez, B.; et al. Patients with multidrug-resistant tuberculosis display impaired Th1 responses and enhanced regulatory t-cell levels in response to an outbreak of multidrug-resistant Mycobacterium tuberculosis M and Ra strains. Infect. Immun. 2009, 77, 5025–5034. [Google Scholar] [CrossRef]
- Ashenafi, S.; Aderaye, G.; Bekele, A.; Zewdie, M.; Aseffa, G.; Hoang, A.T.N.; Carow, B.; Habtamu, M.; Wijkander, M.; Rottenberg, M.; et al. Progression of clinical tuberculosis is associated with a Th2 immune response signature in combination with elevated levels of SOCS3. Clin. Immunol. 2014, 151, 84–99. [Google Scholar] [CrossRef]
- Scriba, T.J.; Netea, M.G.; Ginsberg, A.M. Key recent advances in TB vaccine development and understanding of protective immune responses against Mycobacterium tuberculosis. Semin. Immunol. 2020, 50, 101431. [Google Scholar] [CrossRef]
- Shahemabadi, A.S.; Hosseini, A.Z.; Shaghsempour, S.; Masjedi, M.R.; Rayani, M.; Pouramiri, M. "Evaluation of T cell immune responses in multi-drug-resistant tuberculosis (MDR-TB) patients to Mycobacterium tuberculosis total lipid antigens. Clin. Exp. Immunol. 2007, 149, 285–294. [Google Scholar] [CrossRef] [PubMed]
- Lim, H.-J.; Park, J.S.; Cho, Y.-J.; Yoon, H.I.; Park, K.U.; Lee, C.-T.; Lee, J.H. CD4+FoxP3+ T regulatory cells in drug-susceptible and multidrug-resistant tuberculosis. Tuberculosis 2013, 93, 523–528. [Google Scholar] [CrossRef] [PubMed]
- Larson, R.P.; Shafiani, S.; Urdahl, K.B. Foxp3+ regulatory T cells in tuberculosis. In The New Paradigm of Immunity to Tuberculosis; Springer: New York, NY, USA, 2013; pp. 165–180. [Google Scholar]
- Hall, A.M.; Ward, F.J.; Vickers, M.A.; Stott, L.-M.; Urbaniak, S.J.; Barker, R.N. Interleukin-10–mediated regulatory T-cell responses to epitopes on a human red blood cell autoantigen. Blood J. Am. Soc. Hematol. 2002, 100, 4529–4536. [Google Scholar] [CrossRef] [PubMed]
- da Silva, M.V.; Tiburcio, M.G.S.; Machado, J.R.; Silva, D.A.A.; Rodrigues, D.B.R.; Rodrigues, V.; Oliveira, C.J.F. Complexity and controversies over the cytokine profiles of T helper cell subpopulations in tuberculosis. J. Immunol. Res. 2015, 2015, 639107. [Google Scholar] [CrossRef]
- Jankovic, D.; Trinchieri, G. IL-10 or not IL-10: That is the question. Nat. Immunol. 2007, 8, 1281–1283. [Google Scholar] [CrossRef] [PubMed]
- Fatima, N.; Shameem, M.; Nabeela; Khan, H. M. Changes in serum levels of TNF-α & IL-4 among New, under-treatment & MDR TB patients. Microbiol. Res. J. Int. 2015, 7, 159–166. [Google Scholar]
- Leem, A.Y.; Song, J.H.; Lee, E.H.; Lee, H.; Sim, B.; Kim, S.Y.; Chung, K.S.; Kim, E.Y.; Jung, J.Y.; Park, M.S.; et al. Changes in cytokine responses to TB antigens ESAT-6, CFP-10 and TB 7.7 and inflammatory markers in peripheral blood during therapy. Sci. Rep. 2018, 8, 1159. [Google Scholar] [CrossRef]
- Soto, G.F.F.; Cedeño, N.V.; de Fernández, C.A.; Lascano, P.P.; Nieto, M.F.; Ron, M.T.P. Mycobacterium tuberculosis infection: Participation of TH1, TH2, TH17 and regulatory T cells in the immune response. Acta Med. Iran. 2018, 56, 484–493. [Google Scholar]
- Sharma, S.; Bose, M. Role of cytokines in immune response to pulmonary tuberculosis. Asian Pac. J. Allergy Immunol. 2001, 19, 213. [Google Scholar] [PubMed]


Publisher’s Note: MDPI stays neutral with regard to jurisdictional claims in published maps and institutional affiliations. |
© 2021 by the authors. Licensee MDPI, Basel, Switzerland. This article is an open access article distributed under the terms and conditions of the Creative Commons Attribution (CC BY) license (https://creativecommons.org/licenses/by/4.0/).