1. Introduction
Microscopy of stained peripheral blood smears still holds significant relevance in hematological studies [
1,
2,
3]. This simple protocol requires the expertise of physicians, who provide the robustness and versatility of the human power of pattern recognition but, simultaneously, the protocol has the limitation of being time-consuming. Despite recent reports showing that blood stains can be conflictive and imprecise, morphological modifications associated with leukemia and cancer observed on blood smears still play a significant role in diagnostics [
4,
5]. Routine analyses use automated methods, such as flow cytometry or electronic cell counters, to gather a sufficient quantity and quality of measures but lack the structural and morphological assessment of blood cells. On the other hand, the morphological evaluation of leukocytes by a pathologist usually lacks quantitative numerical values that are feasibly unattainable by human means [
6,
7,
8,
9,
10,
11,
12,
13,
14,
15,
16,
17,
18,
19,
20,
21].
Giemsa stains have been reported as a possible histological staining method at the beginning of the 20th century [
22]; however, the first written report of their use on peripheral blood smears dates to 1968 [
1]. Since then, they have been extensively used for a myriad of diagnostics, ranging from parasitic infections, kidney or liver diseases, myeloproliferative or lymphoproliferative disorders, several types of cancer, and different types of anemia [
2,
3,
23,
24], in addition to their routine use to determine percentages of the leukocyte subtypes. The longevity of this diagnostic method relies on its simplicity, fast output, low demand for resources, and the expertise of physicians. The low demand allows its applicability in areas with minimal resources. In contrast to microscopy-based methods, high-throughput instruments, like flow cytometers, are often combined with immunofluorescence protocols to obtain quantitative information on cell markers. However, this requires far more complex methods than peripheral blood smears and an investment that would several-fold surpass the resources needed for brightfield microscopy of peripheral blood smears. Furthermore, these methods do not report on cellular morphologies, which are often linked to important signaling networks [
25,
26] of biological processes, such as ERK and PI3K/AKT/mTOR pathways [
17,
27,
28,
29,
30,
31,
32,
33], which have been shown to be associated with pathological conditions and morphological changes. Furthermore, it has been published that the mechanical qualities of immune cells are closely related to their activity state [
34,
35,
36,
37], erythrocytes’ membrane flexibility reflects their ability to take up oxygen [
38,
39,
40,
41,
42], and the size distribution of platelets can be used to trace back abnormal physiological conditions [
43]. It should also be considered that changes in plasma compositions regarding lipid, protein, and ionic concentration can lead to structural changes in blood cells measurable in peripheral blood smears [
41,
44].
Commonly, blood stains are analyzed only in a qualitative manner, which is accompanied by quantitative laboratory assays ordered by physicians. The diagnosis and treatment of various diseases rely on the conjunct application of these protocols. Understandably, quantitative measurement of cell morphology by human means is unfeasible due to the time demands and the impracticality of the measurements. Therefore, blood stains are mainly used for qualitative evaluations while treatment decisions are made on the basis of quantitative laboratory tests. However, by enhancing the information output of blood stains and quantifying cellular morphologies, the evaluation of a patient could be refined by this technically simple method, and the battery of laboratory assays might be reduced. This could enable a more personalized and tailored treatment at an early stage.
The field of hematology is well-suited for AI applications, and several algorithms have been developed to classify blood cells. These algorithms have pros and cons, but overall, they have been proven quite effective in identifying cell types, with a minimal rate of misclassifications [
7,
8,
9,
10,
45,
46,
47,
48,
49]. However, so far, they have usually only been applied to one blood cell type, and in most cases have not been combined with cellular border detection, leaving the potential for the multifactorial quantification of morphology at the single cell level unrealized. On the other hand, high-throughput methods, such as flow cytometry, which have the required quantitative power, lack morphological information [
13,
16]. It seems evident that multidimensional quantifications of cellular morphology bear a great potential for precision diagnostics [
12,
15,
17,
50,
51,
52,
53,
54,
55,
56]. Up to now, quantitative morphological assessments of leukocytes have mainly focused on neutrophils and lymphocytes, the more abundant immune cell types [
15,
16,
19,
20,
57,
58,
59,
60,
61,
62], while less common cells, like eosinophils, are hardly analyzed in these correlative analyses. The aim of our study was to assess all cell types of blood circulation and fill the gap between non-numerical/morphological techniques and numerical/non-morphological methods, such as flow cytometry, expanding the realm of AI blood cell identification from late to early diagnostics. A current challenge of pathology is that the time capacity of expert pathologists is quite limited, meaning that they can investigate only a limited number of patient samples in more detail by microscopy; the overwhelming majority of samples are analyzed by automated cell counters, delivering only percentages and very basic quantitative measures. AI-based analysis of (automatically acquired) microscopy images can address this challenge by taking over an important part of human expertise in morphological assessment. Furthermore, it can outperform the human observer by delivering precise numerical values for geometries or shape factors. In our study, we achieved that by developing an artificial intelligence algorithm for microscopy images of blood stains to classify all circulatory cells into their specific subtypes and deliver quantitative and numerical values in a way that can be automated and that allows for applying multidimensional metrics and new methods of diagnostics. In essence, the more sophisticated multidimensional quantifications that we present in this study aim to transform mere qualitative morphological assessments of physicians into quantitative analyses that can be used for precision diagnostics of physiological and pathological conditions.
2. Materials and Methods
Blood was collected from nine healthy subjects from the ring fingers pricked with a lancet (Heinz Herenz Hamburg #1110102) and spread over microscopy glass slides as a monocellular layer following the traditional blood smear method described below.
For leukocyte concentrates, a phlebotomy was performed to collect blood in EDTA-coated tubes from six healthy individuals. These six individuals are accounted for in the peripheral blood smear group. A total of 9 mL of freshly collected blood was centrifuged in a Sigma 4–16 KS centrifuge (Sigma Zentrifugen, Osterode am Harz, Germany) at 300× g for 7 min. After the blood was separated into an erythrocyte-rich (bottom) and erythrocyte-poor (top) liquid–liquid 2-phase system, the erythrocyte-poor layer was put into a separated 10 mL tube, which was further centrifuged at 700× g for 10 min. The resulting pellet was resuspended in 150 µL of the supernatant. The resulting resuspended pellet was subsequently spread out on microscopy slides as the WBC concentrate.
A drop of blood or a WBC concentrate was placed on the end of a glass microscope slide opposite the frosted ends. A beveled microscope glass slide (Knittel Glass, Braunschweig, Germany, VS1147#1FKB.01) was placed at a 45° angle in front of the drop. The drop was touched with the beveled slide, and once the fluid was distributed on the edge of the slide, it was smeared toward the frosted end of the microscope slide. The smeared fluid was left to dry for 15 min. The dry slides were fixed with −20 °C methanol for 9 min and air-dried again. A 1 µg/mL solution of DAPI, diluted in distilled water, was used to label the fixed smears for 5 min, followed by air drying. The DAPI-labeled smears were then stained with a GIEMSA solution for 30 min, according to the manufacturer’s specifications (Chemlab, Zedelgem, Belgium, CL04.0502), and mounted with a 125 g/L glycerin solution, followed by sealing of the edges with nail polish.
The DAPI-Giemsa co-stained smears were imaged with an Olympus IX71 inverted microscope (Tokyo, Japan) equipped with a DFK 72BUC02 color camera (Middleton, WI, USA), an iXon Ultra 888 EMCCD camera (Abingdon, UK), a 73006081 Ludl filter wheel (Hawthorne, CA, USA), a CoolLED pE-4000 light source (Andover, UK), a 100× Olympus oil objective, and a halogen lamp. The setup was controlled using the free and open-source software “Micro-Manager 2.0” (
https://micro-manager.org/Citing_Micro-Manager accessed on 3 January 2023). Four images were taken for each field of view selected: one color image, one transmission image, one image using the 385 nm excitation line and a 447/60 blue emission filter (DAPI), and one image using the 565 nm excitation line and a 593/40 red emission filter (red equivalent).
The algorithms that we present in this study are based on 2138 images taken from 31 peripheral blood smears and 20 smears of white blood cell concentrates. As mentioned above, images were acquired using two different cameras: a color camera and a monochromatic camera. The color images were used for the manual classification of blood cells. Due to the difference in pixel size and field of view, an algorithm was developed to match the segments and sizes of the images. The code for matching the segments is available in our repository (
https://github.com/MCamposMedina/Image-matching accessed on 9 November 2023). Once the images were processed, they were uploaded to the online image analysis software platform IKOSA 1.3, a product provided by our industrial partner (KML Vision GmbH, Graz, Austria, available from
https://app.ikosa.ai/ accessed on 27 December 2023). The development of the algorithms was based on providing initial annotations of the different cell types by an experienced observer. The computational training of the AI was then autonomous, and all internal pre-existing parameters were application-agnostic. All internal variables were calculated during the AI training phase based on the information provided by the training dataset. An instance segmentation AI algorithm was trained with 80% of the images and validated with the remaining 20%. The images used for the training and validation were randomly allocated. Each developed algorithm was later tested with images excluded from the training/validation set. In addition to the commonly used 80/20 ratio of training versus validation datasets, other ratios were tested as well.
In order to quantify the performance of the algorithms, we used 3 statistical parameters:
Accuracy,
Recall, and
IoU (intersection over union, Jaccard index), as specified below. These quantifications take into account the observational errors (
FPs = false positives,
FNs = false negatives), and we compared them to the correct observations (
TPs = true positives,
TNs = true negatives). Their corresponding equations are:
3. Results
3.1. Development of a Workflow for Image Analysis
Based on our camera hardware and our goal to compare color with monochrome/fluorescence image acquisition, we first had to establish a workflow for matching the images of the two different cameras.
3.1.1. Image Matching Segment Extraction
The three monochromatic images constrained a 1024 × 1024 (79 × 79 µm) pixel field of view, whereas the color image provided a 648 × 484 pixel field (48 × 36 µm). The color images were white-normalized using an ad hoc Python script, which is publicly available in our repository (
https://github.com/MCamposMedina/Image-matching accessed on 9 November 2023). The monochromatic images were resized and realigned accordingly using an in-house Python 3.9.13 script. The field of view captured by the color image was then extracted from the monochromatic images using the open-source Python library OpenCV (
https://www.oreilly.com/library/view/mastering-opencv-4/9781789344912/c7cd6c68-e4be-46d3-b5b1-474066284ee6.xhtml accessed on 4 April 2023). Once the corresponding image segment was extracted, the monochromatic images were saved in a three-channel stack.
3.1.2. Algorithm Training and Validation
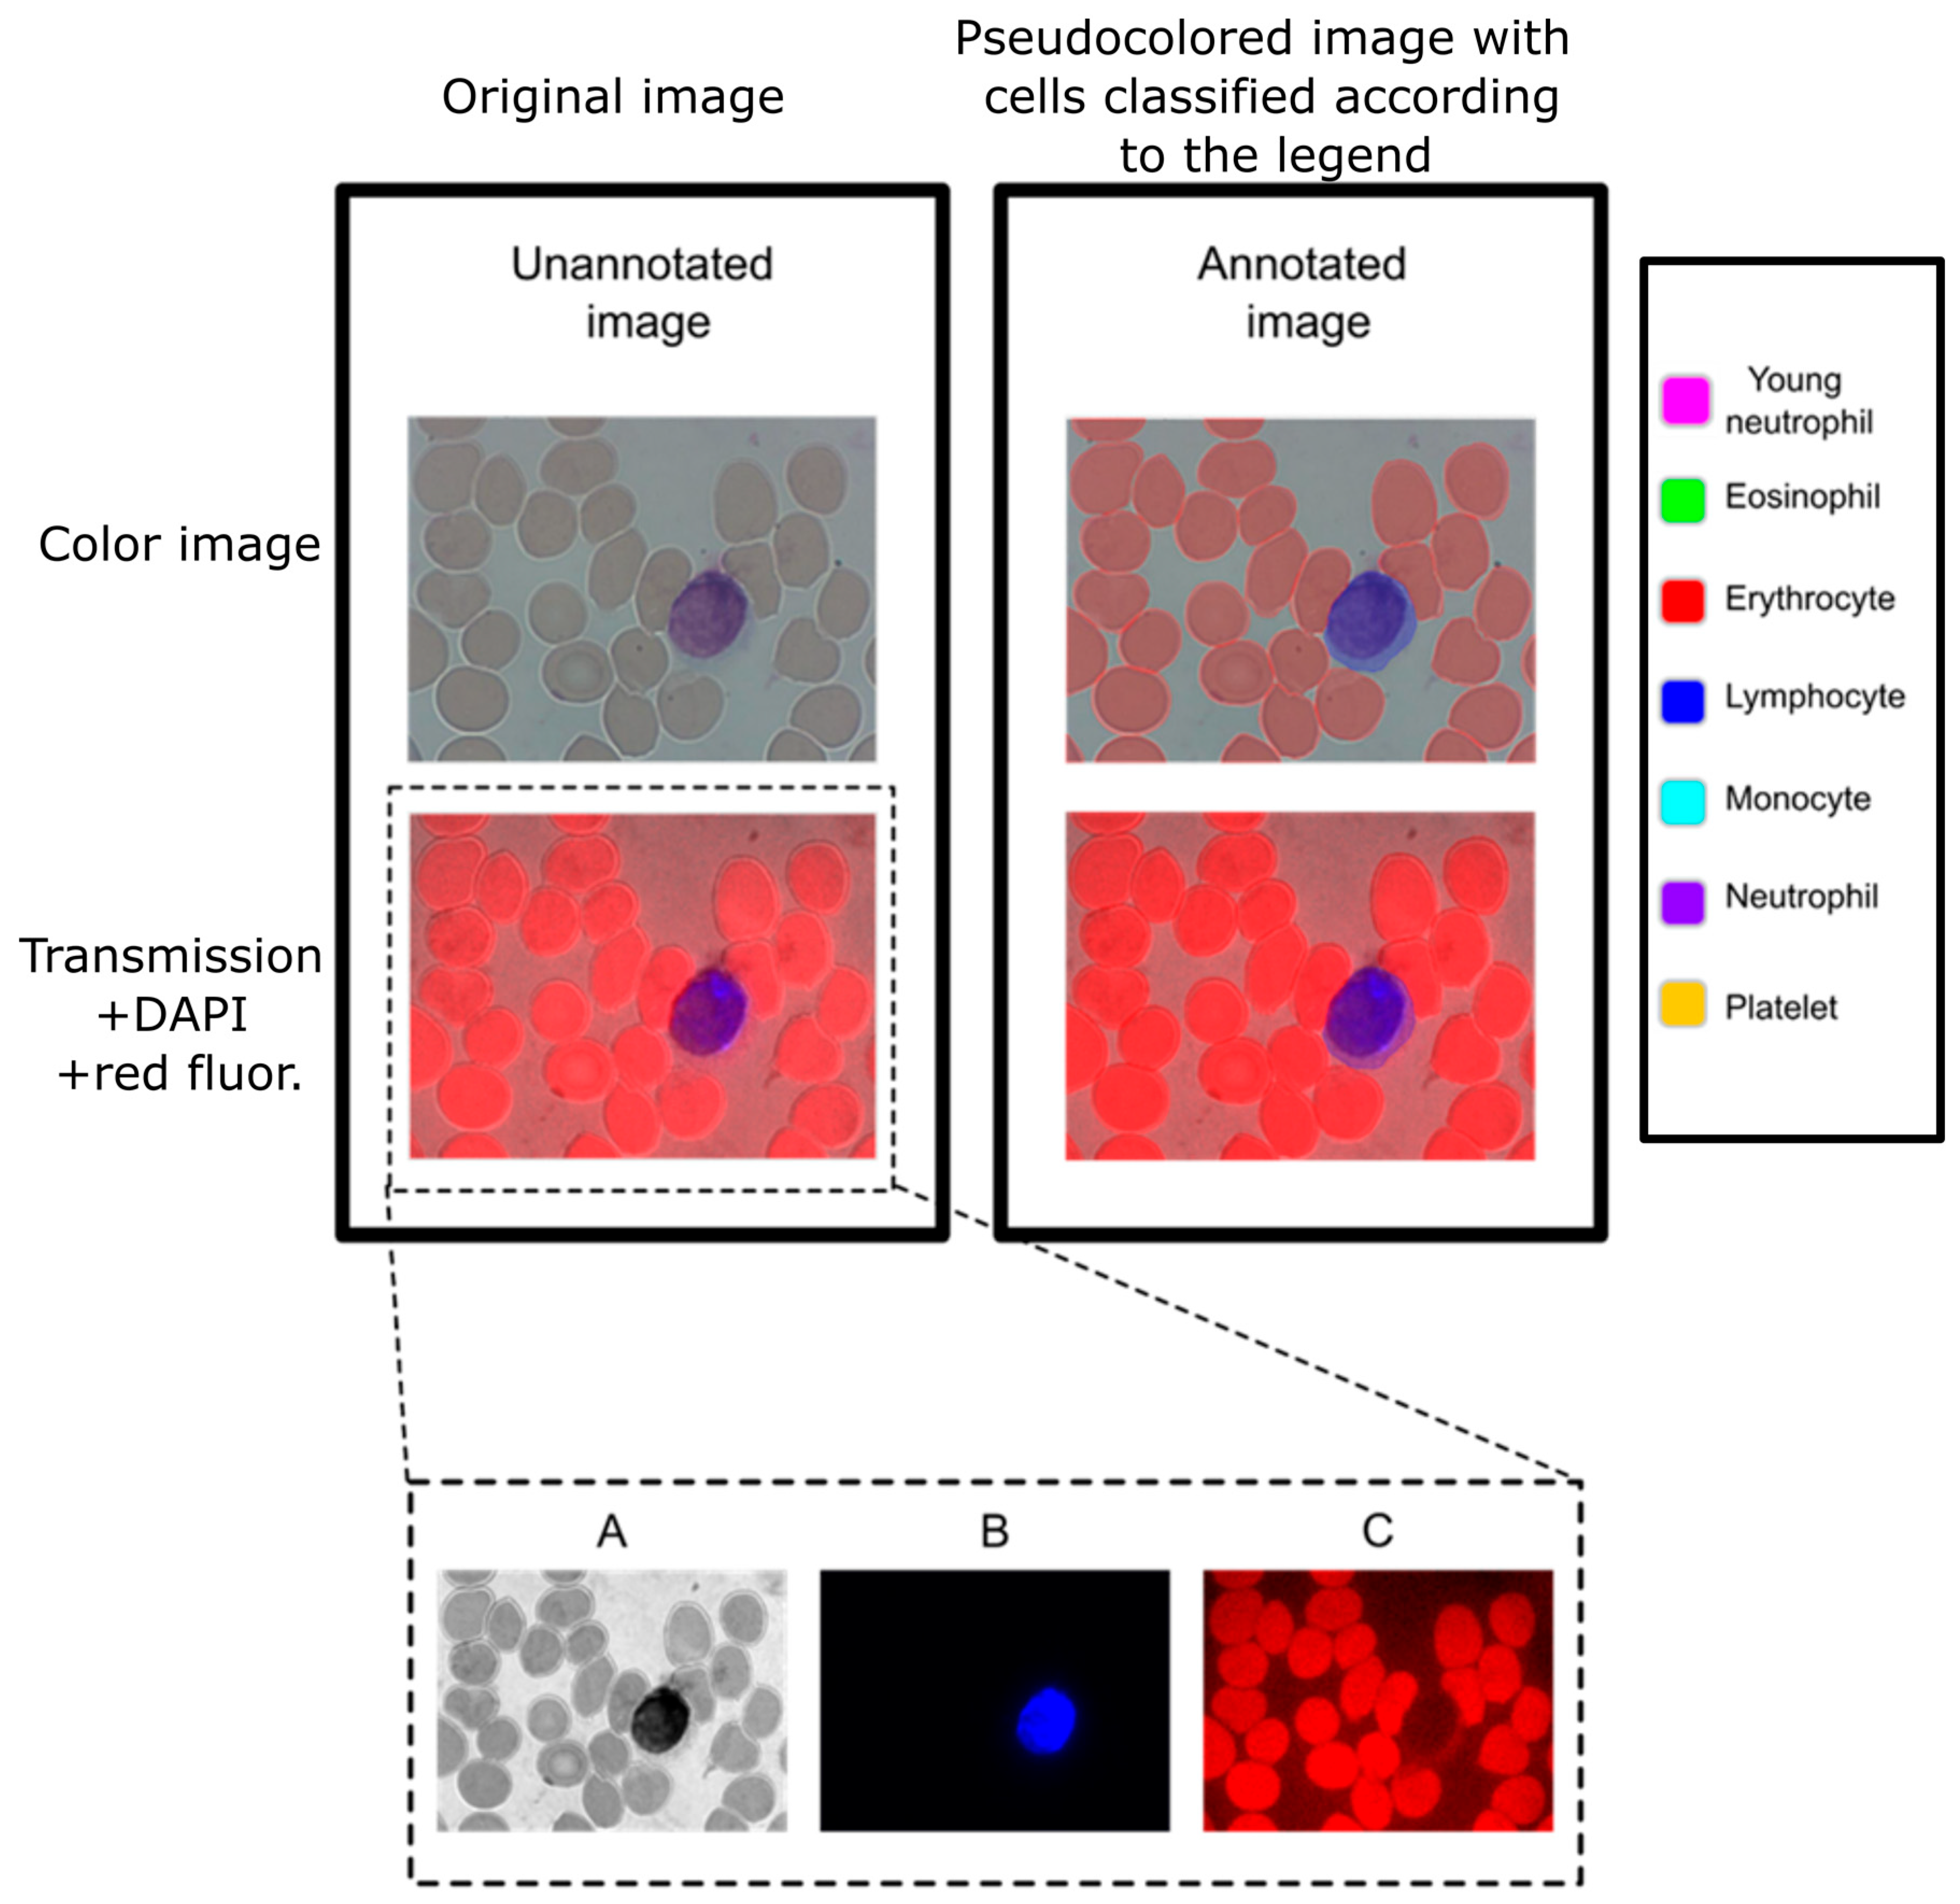
Each object was adequately identified and annotated in the color images according to one of the following seven labels: erythrocyte, young neutrophil, segmented neutrophil, lymphocyte, eosinophil, monocyte, and platelet. The annotation of the object consisted of using a hand-drawn tool to highlight the area that corresponds to the label assigned to the object (
Figure 1). The 2138 images contain the objects’ distribution shown below in
Table 1.
Interestingly, when we tested Giemsa stains on the fluorescence channels, we noticed that it provided a clear signal in the red channel (
Figure 1). By taking advantage of this endogenous fluorescence, we characterized cells based on their cytoplasm red-equivalent fluorescence together with the DAPI fluorescence of the nucleus for automated cell recognition.
Considering that our algorithm had to assign multiple labels of the same type in a single image, as is obviously the case for erythrocytes, we selected an instance segmentation-oriented algorithm, which is appropriate for object-based classification (while semantic segmentation is a pixel-based classification). The AI instance segmentation algorithm was initially trained using 80% of the annotated images. The remaining 20% was used for the validation of the algorithm. The 80/20 ratio is a well-established principle, as it prevents overfitting. To verify the robustness of the 80/20 ratio against other ratios of training/validation, we tested three other ratios (see
Supplementary Table S1) to ensure the best-performing algorithm. The one with the lowest observational errors was designated as the main functioning algorithm. Since the training and validation images were randomly selected, this configuration avoids introducing selection bias and provides cross-validation. Two primary cell detection and classification types of algorithms were developed. One was trained with color images, and the other one was trained with the three-channel monochromatic stack (transmission, DAPI, red, TDR). The annotations made on the color images were copied to the TDR image set. Consequently, both algorithms contain the same number of images and annotations.
3.2. Multidimensional Quantifications
In addition to the AI-based segmentation of objects (cells), we aimed for a deeper analysis of the identified objects based on internal structures and textures. Similar to the GLCM quantification [
63,
64,
65], our interpretation of textures focused on quantifying the distribution of intensities according to their spatial distribution. However, we collected the intensities of the surrounding eight pixels of each pixel that belonged to the realization of an object. In this way, the edge corners only take into account pixels that lie within the detected area. The intensities 1–255 were quantified according to the intensity values surrounding them. Based on the matrix of intensities, the corresponding probability distribution was calculated as:
Finally, texture quantification was based on Shannon’s definition of entropy [
66], which follows the following equation:
where:
S = Texture entropy of an object;
= Probability of a pixel having a value of i to be surrounded by a pixel of value j;
= Eight-bit-based intensity value;
= Number of pixels with the value of i surrounded by pixels of value j.
3.3. Cell Detection and Measurements
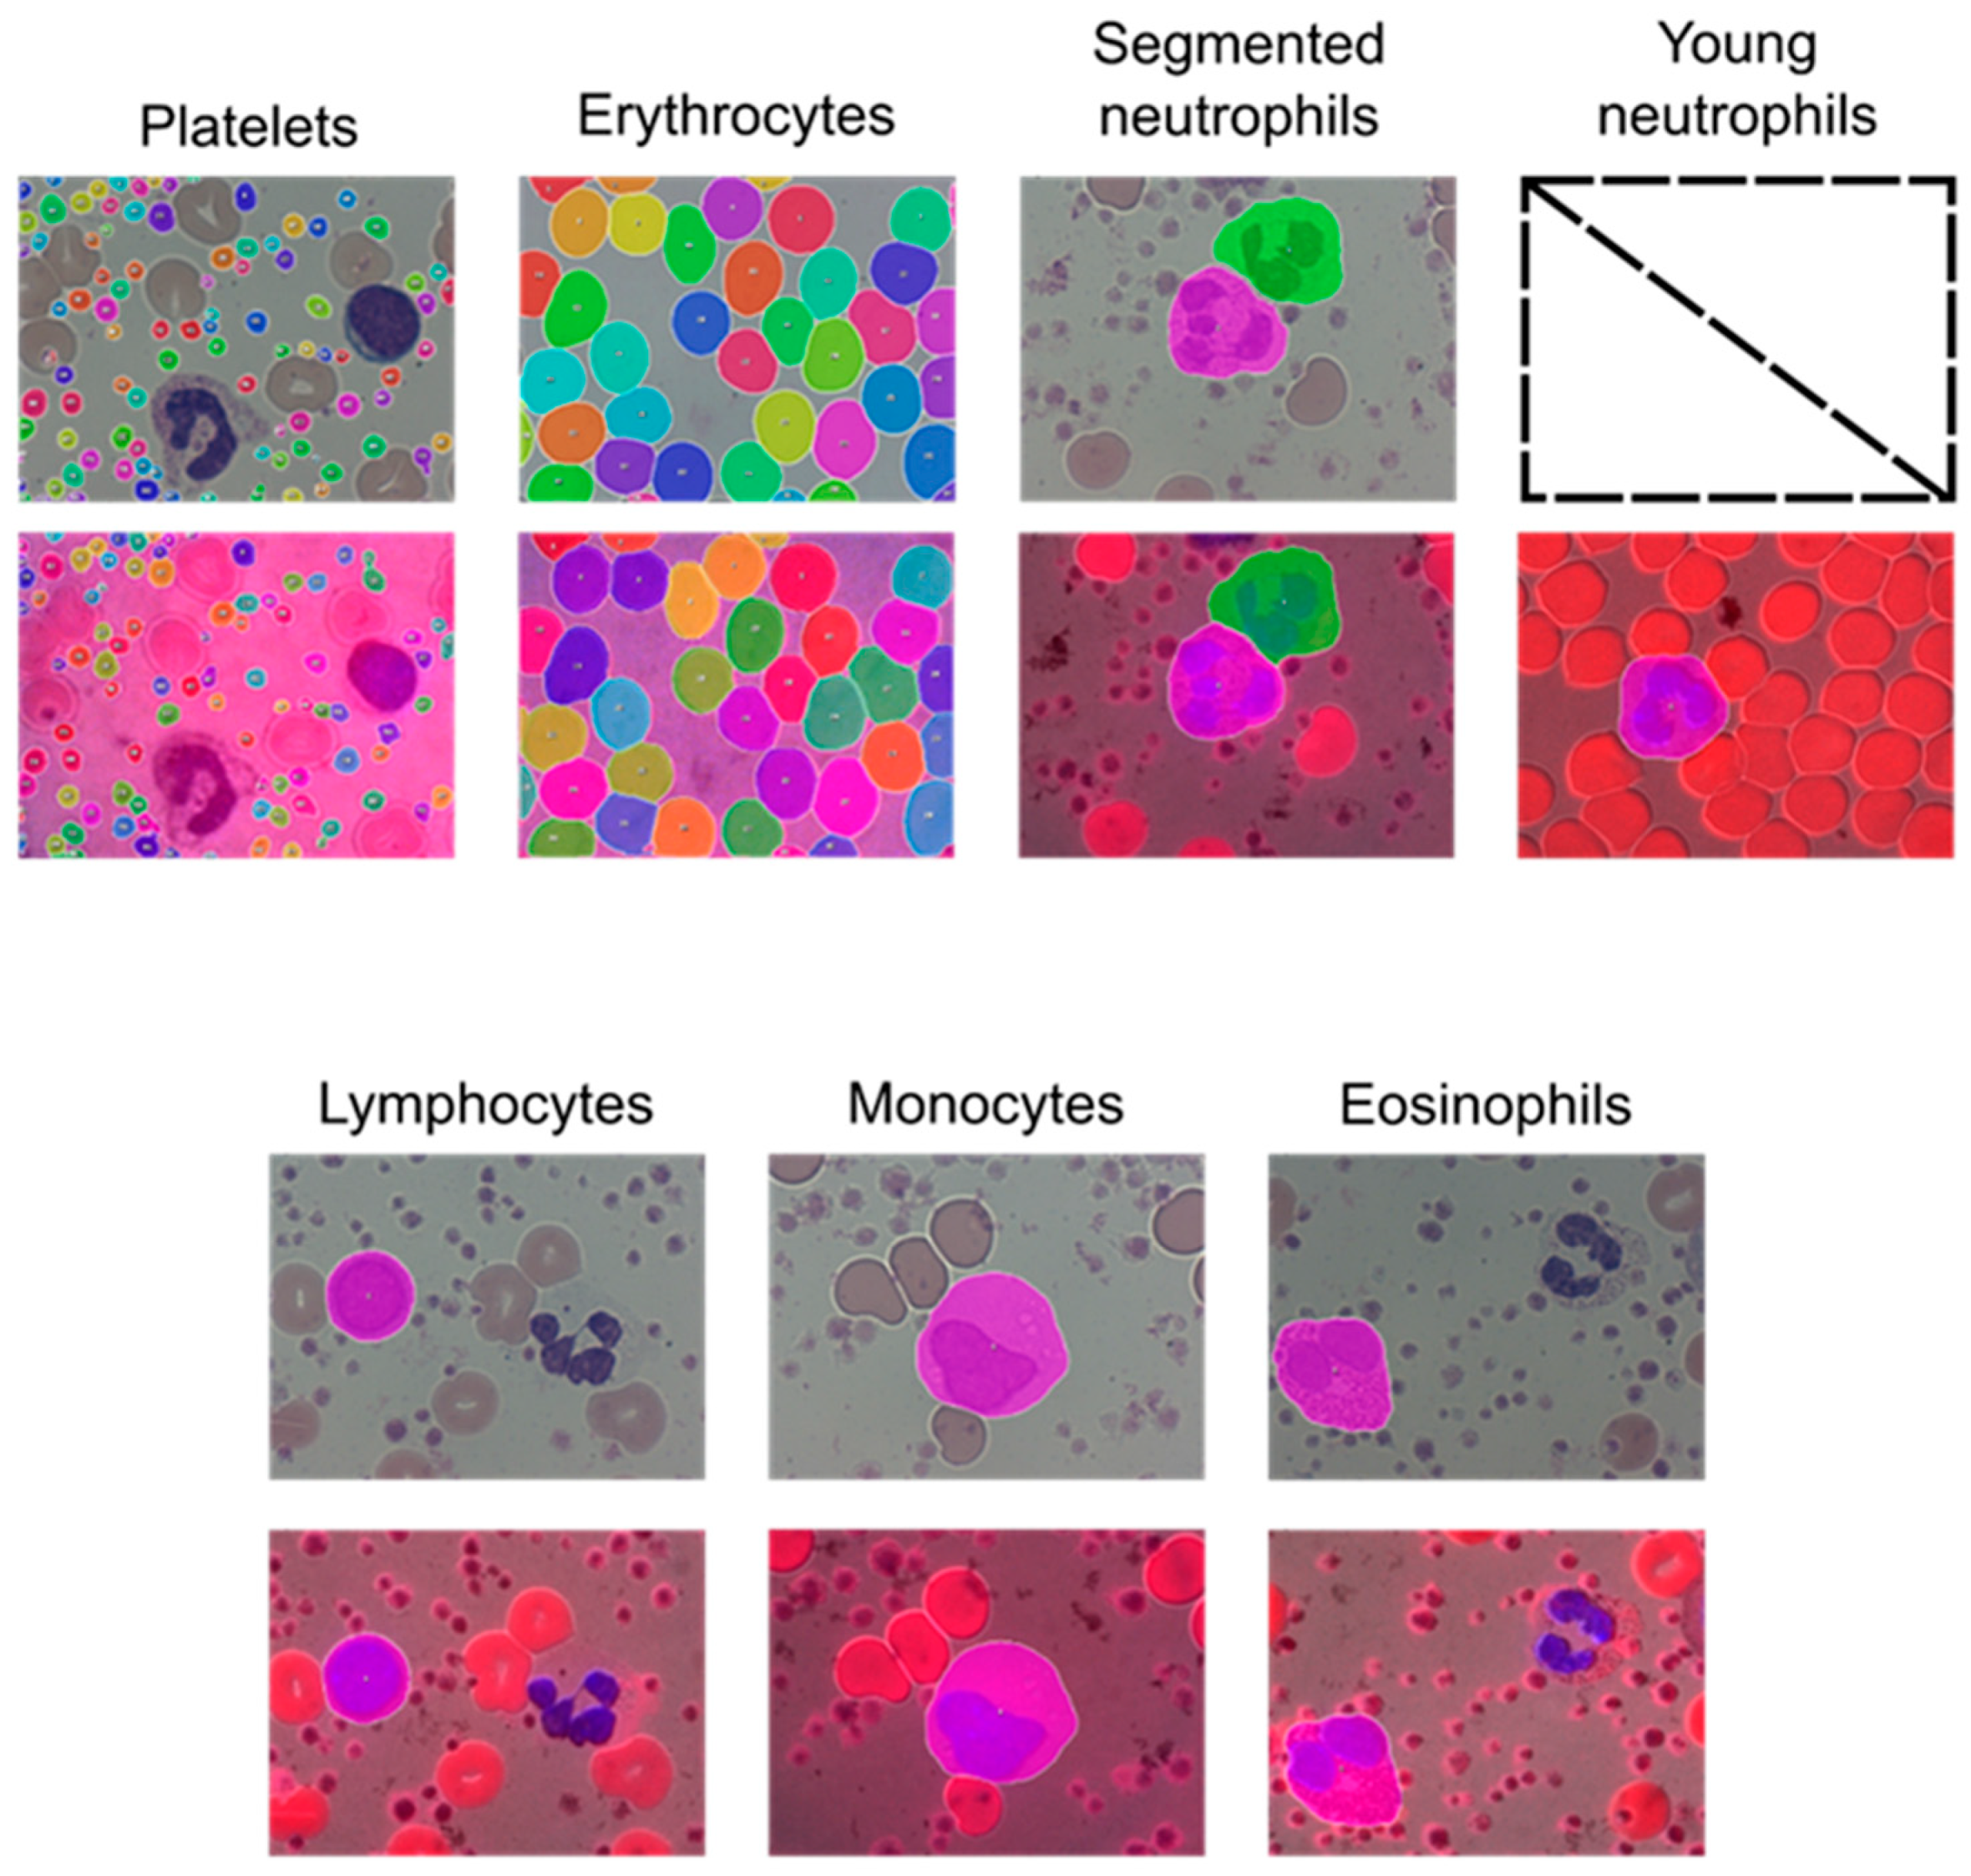
As can be observed in
Figure 2, both algorithms—the one with color images and the one with fluorescence/monochrome-transmission images—could detect the blood cells that they were trained to classify, except for young neutrophils. There was no significant difference in the area detected by either of the algorithms. It should be considered that the objects are detected regardless of the number of realizations, as can be seen for the erythrocytes and the platelets. Additionally, it is crucial to mention that all the measurements and calculations were performed with cells that were not touching the border of the field of view. A future version of the IKOSA platform will exclude these objects automatically.
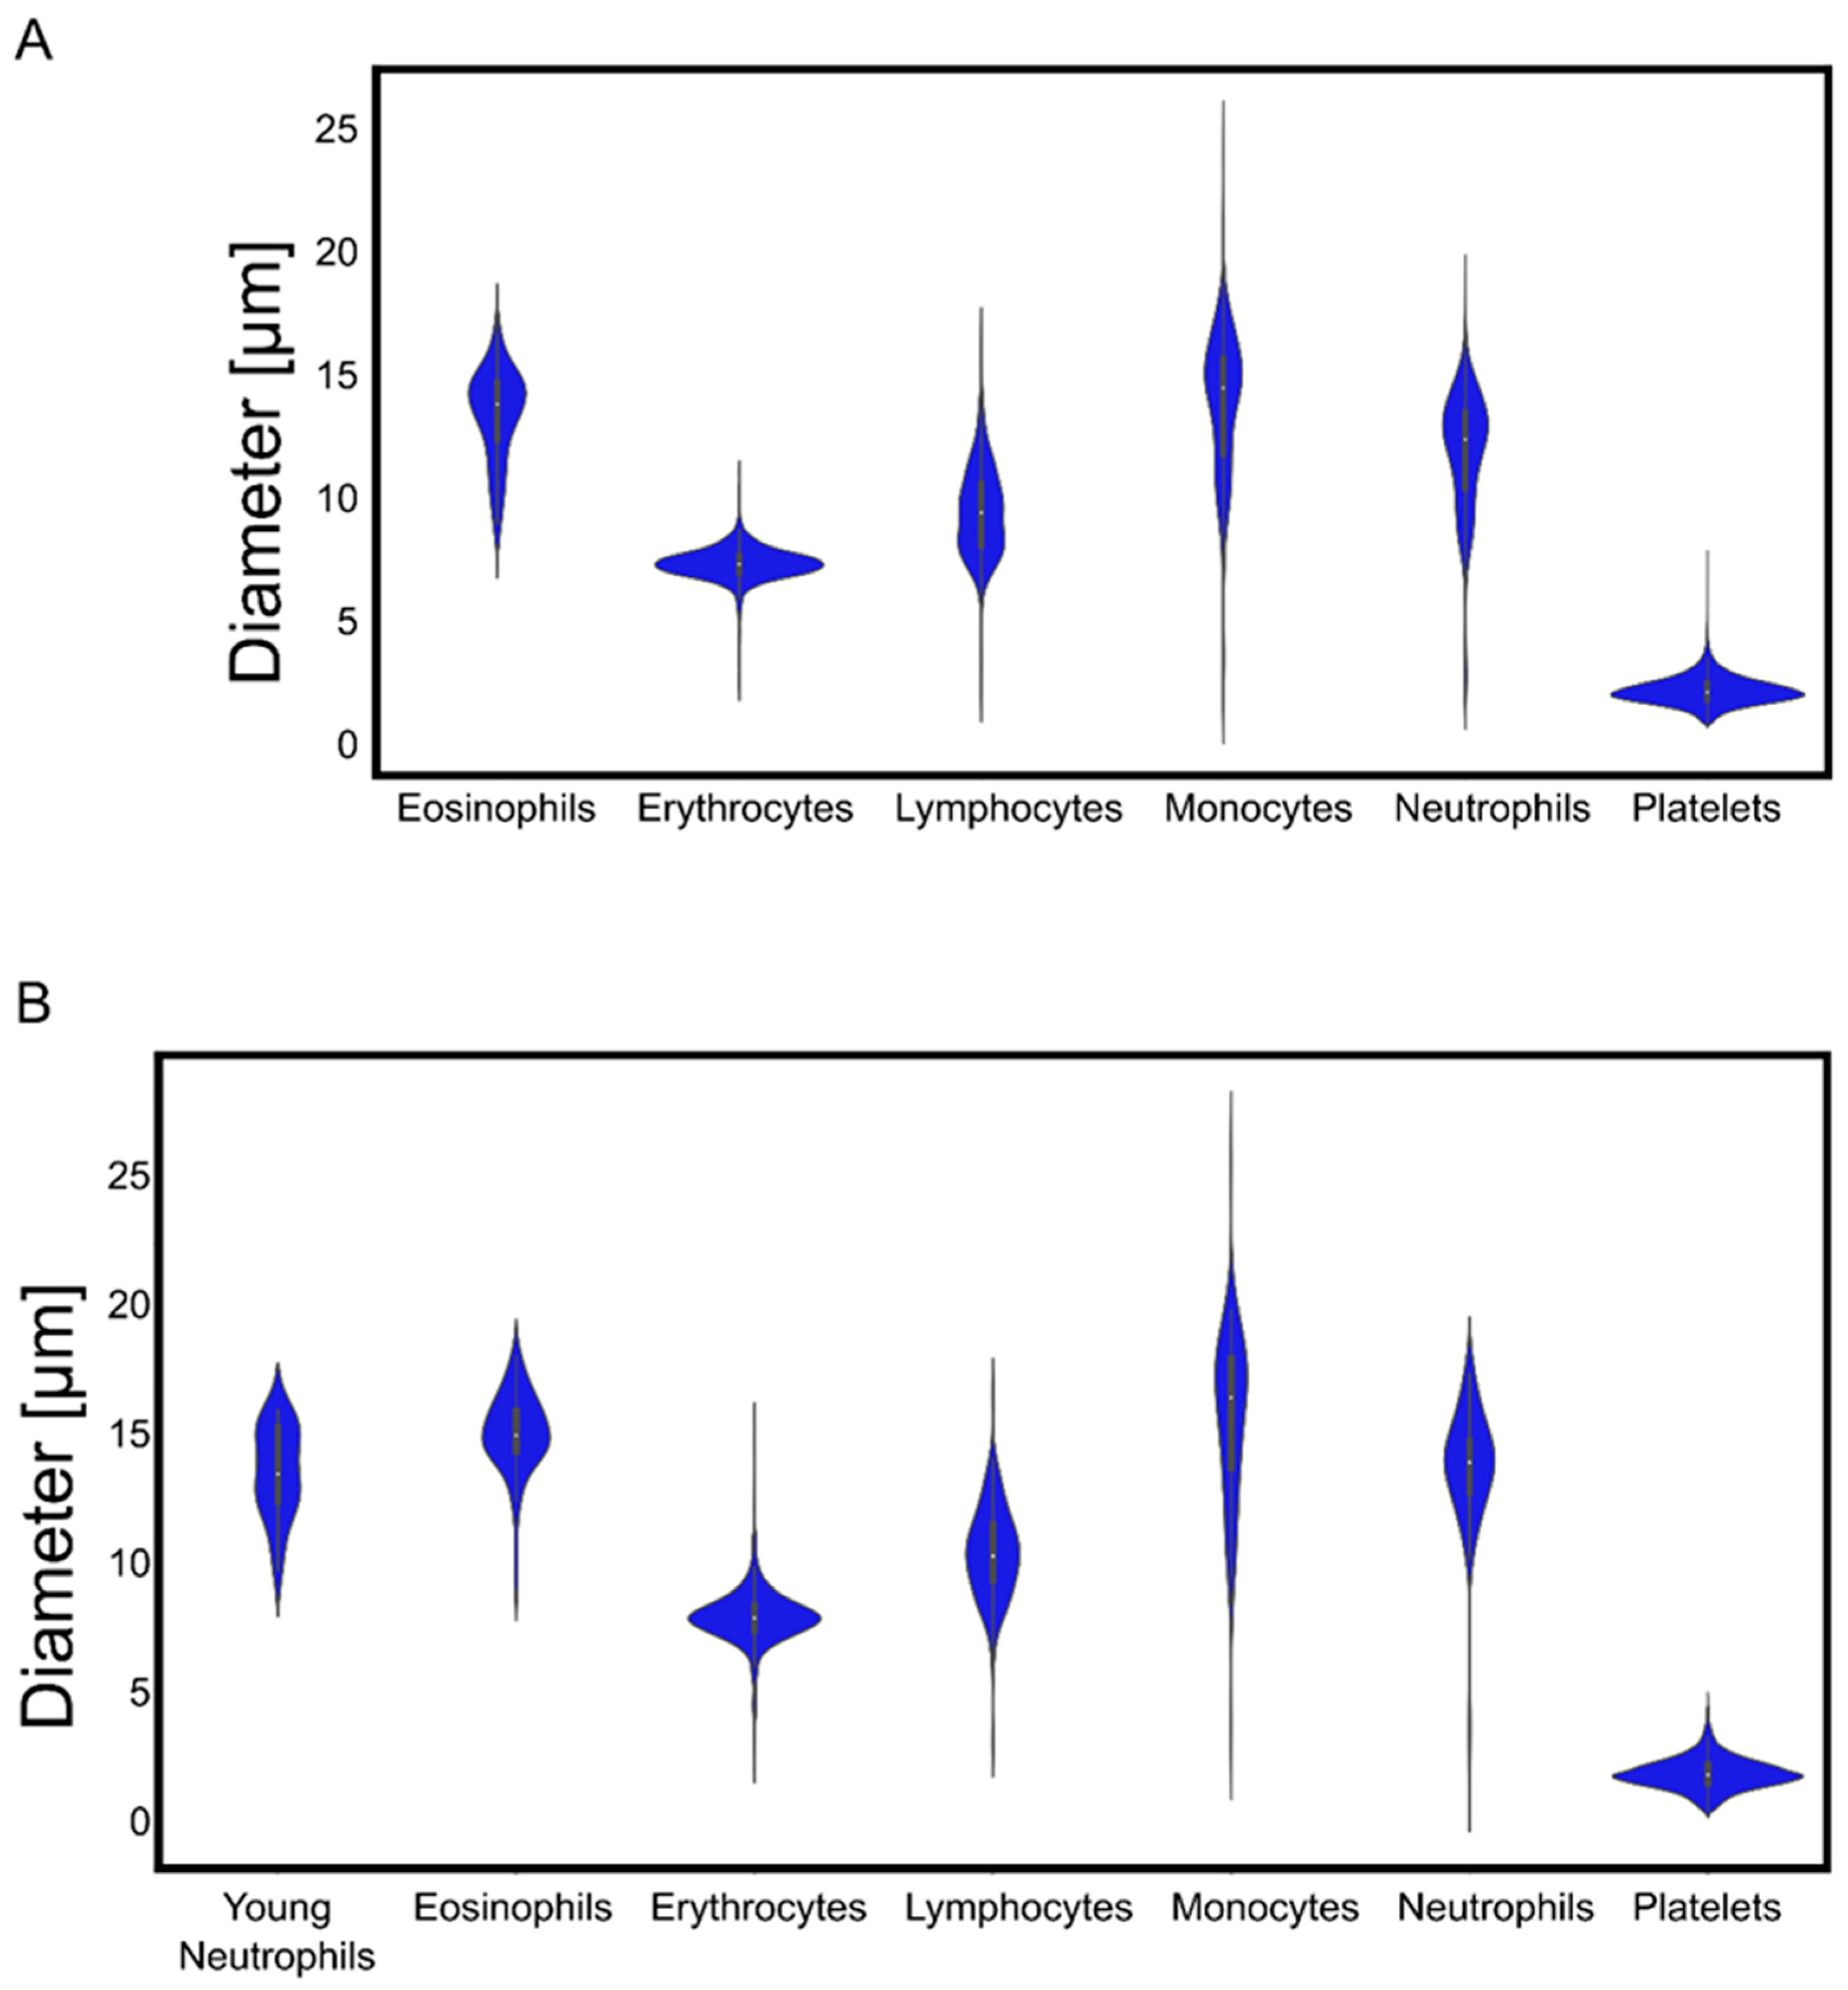
To corroborate the reliability of the measurements that follow the object detection, we determined the diameters of each type of blood cell identified by the algorithm and compared them to the values reported in the literature [
4,
6,
43,
67,
68,
69,
70,
71,
72]. This demonstrated that our cell recognition delivered the diameters that are typical for each object’s respective cell type (see
Table 2). Furthermore, we tested our algorithm on publicly available images of leukocytes classified by independent pathologists. It has to be noted that the techniques presented in this study are only capable of correctly detecting the blood cells included in the development of the algorithm. Therefore, using images containing other cells, structures, textures, or an arrangement of colors similar to those found in any of the identifiable blood cells (erythrocytes, platelets, young neutrophils, segmented neutrophils, monocytes, lymphocytes, and eosinophils) could lead to erroneous detections (if the algorithm is applied to the wrong type of sample).
Supplementary Figure S1 shows the results of the algorithm applied to images that do not contain any blood cells but rather adherent endothelial cells, demonstrating that the error rate is low with unrelated cells. Nevertheless, it is evident that the algorithm should only be applied to the type of sample (blood and leukocyte smears) for which it had been developed.
We found very narrow distributions of erythrocyte and platelet diameters, while leukocytes exhibited a broader variability of sizes (
Figure 3).
According to the observational error metrics (
Table 3 and
Table 4), the algorithm trained using color images was slightly more efficient than its monochromatic counterpart. However, as presented in
Figure 2, as well as
Table 3 and
Table 4, only the algorithm based on the monochromatic images was able to correctly differentiate between young neutrophils and segmented neutrophils. Hence, the multidimensional calculations shown below were based on detections with the TDR algorithm. We also used alternative randomizations of images into training and validation datasets (in total three different randomizations) to build up additional algorithms and tested their performances and variation. This revealed very similar results with only very low coefficients of variation (
Supplementary Tables S2 and S3).
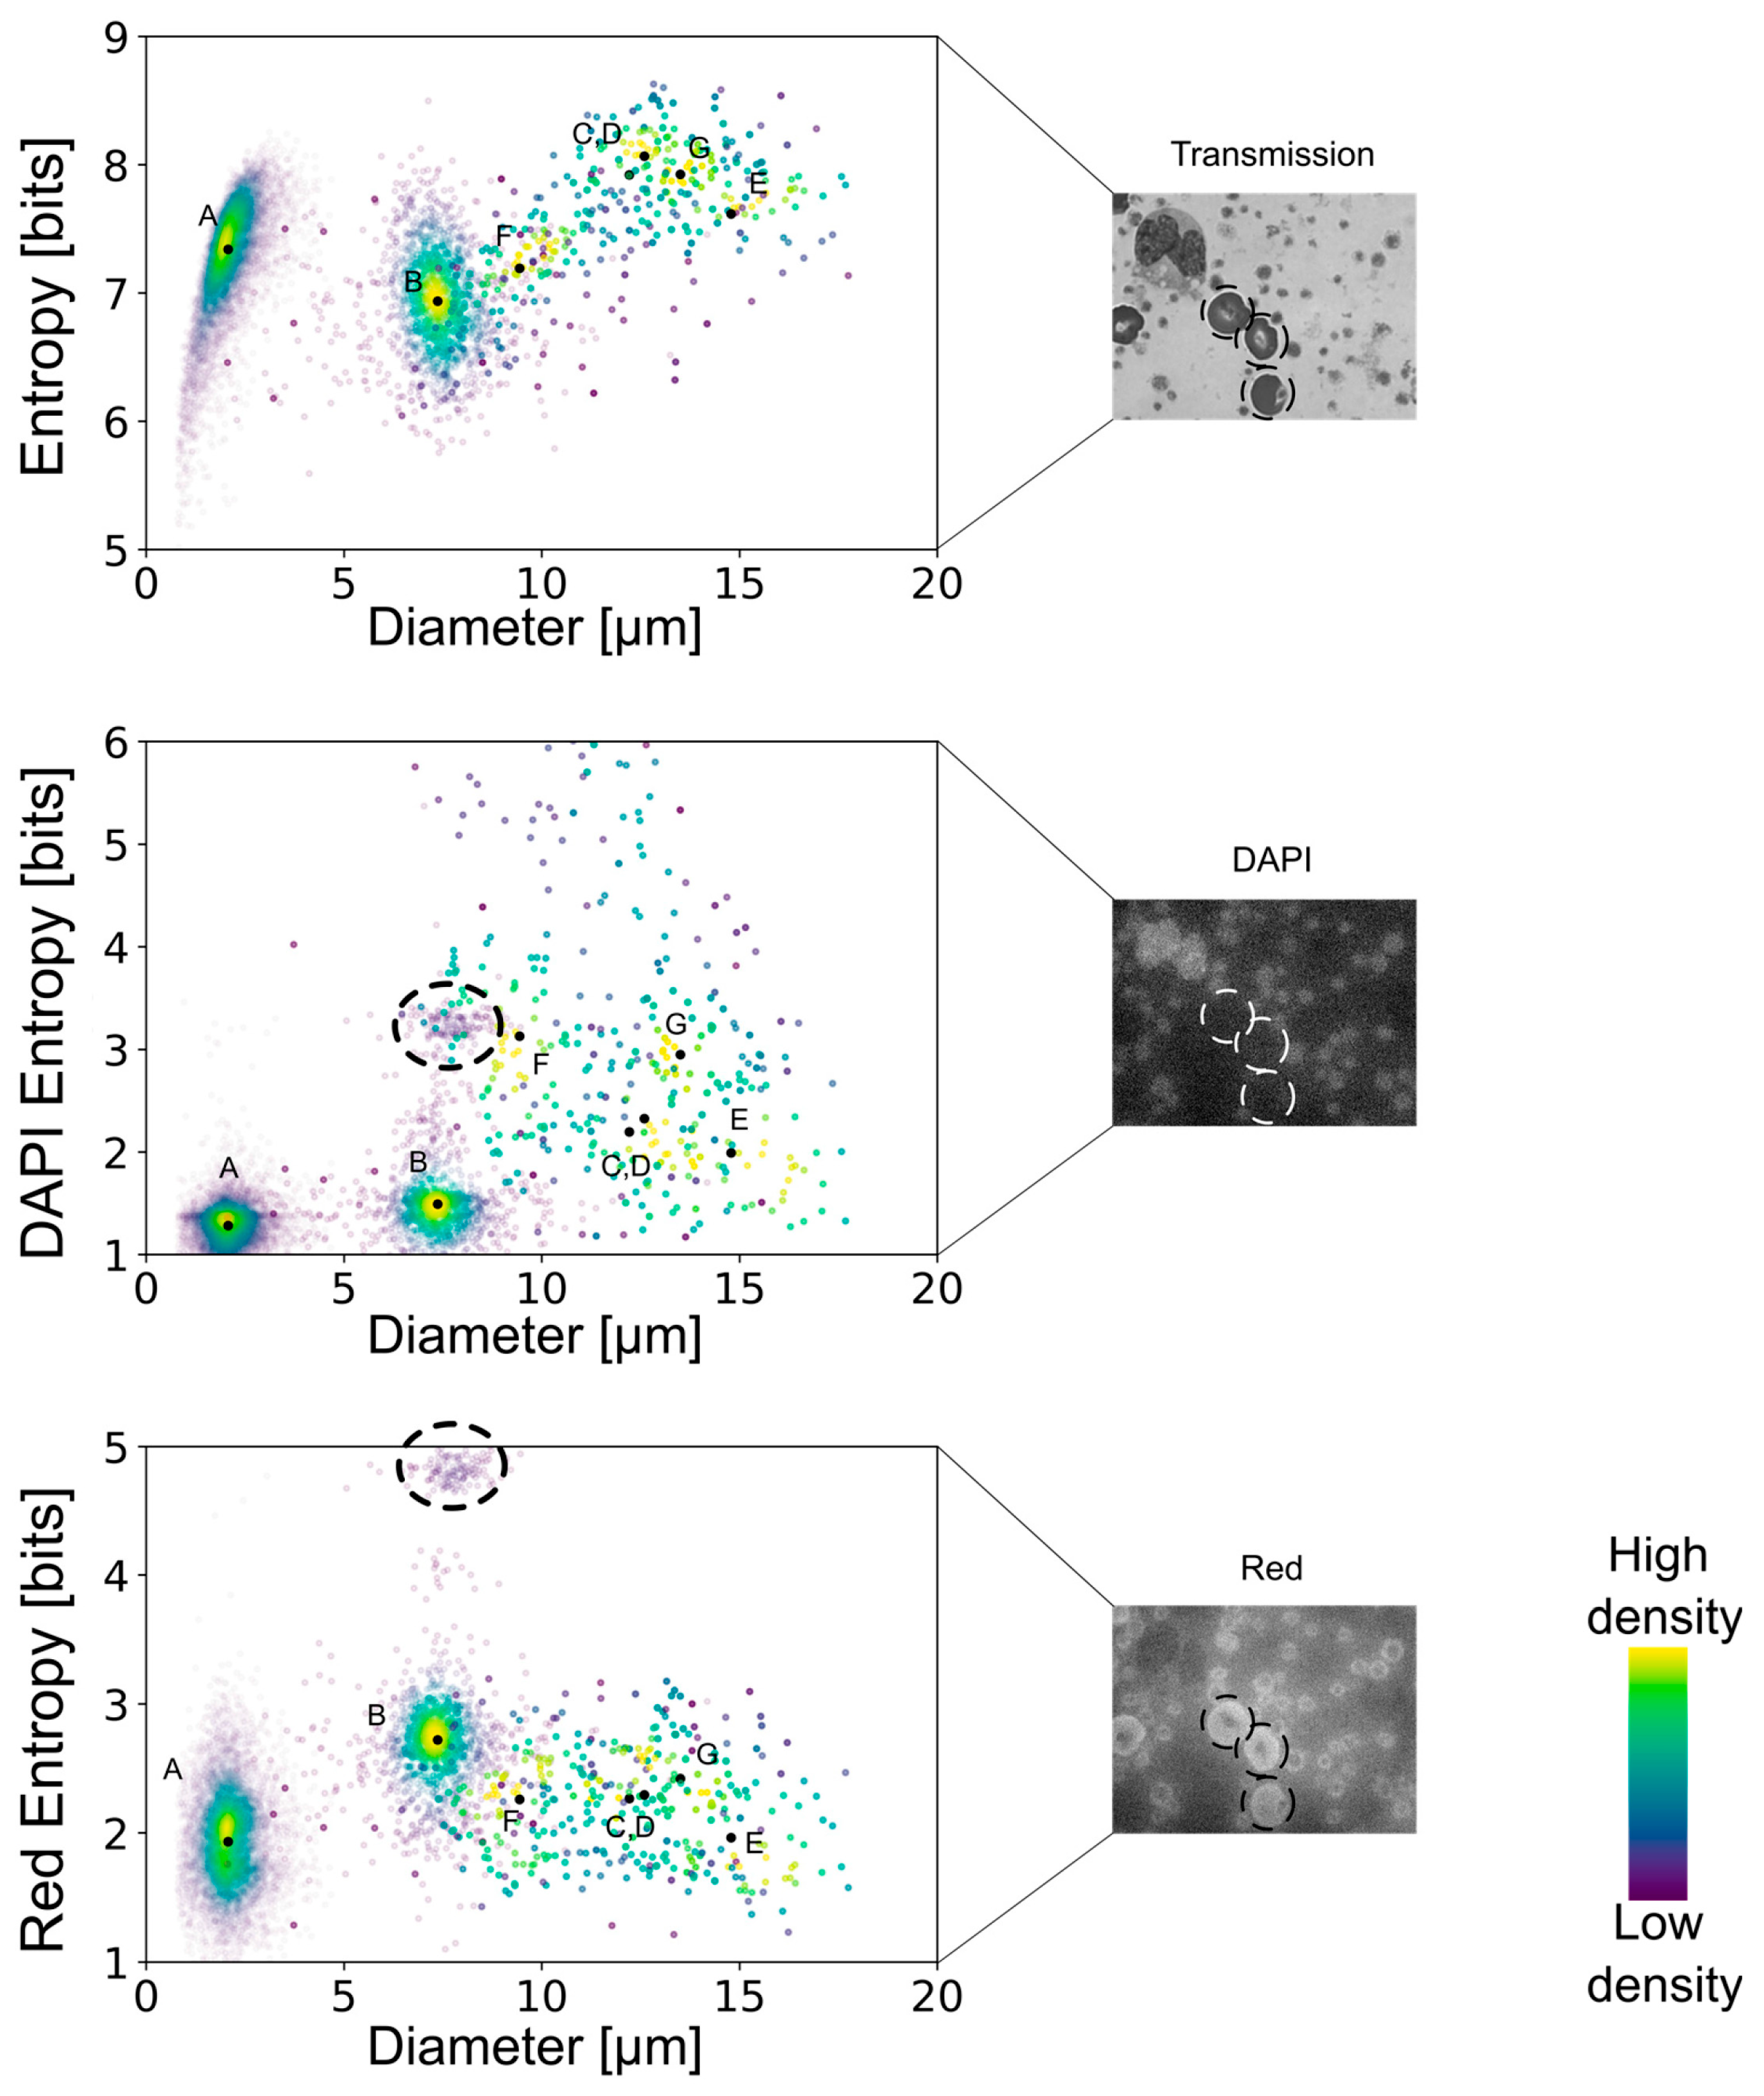
By combining the spatial distribution of pixels with their corresponding intensities, a multidimensional analysis allowed the quantification of the smoothness or roughness observed in the transmission, DAPI, or red-equivalent channels. Shannon’s entropy interpretation suggests that a cell that shows a uniform distribution of intensities throughout would show lower entropy values. On the contrary, cells with high variability in their internal structures comprise a more diverse histogram of spatially dependent intensities and are thus associated with higher entropy levels. Moreover, discontinuities in the intensities of a cell’s cytoplasm would also correlate to higher entropy values.
The multidimensional quantifications of the transmission images showed the lowest entropy values for erythrocytes, similarly low values for lymphocytes and platelets, and increasingly higher values for the remaining leukocyte subtypes (
Figure 4). Nonetheless, there was no clear separation, especially between the leukocyte subtypes, except for the lymphocytes. However, the DAPI staining-based multidimensional quantification revealed a more cell type-specific grouping. Young neutrophils, segmented neutrophils, and monocytes yielded similar values, whereas the other leukocyte subtypes were clearly separated. Interestingly, erythrocytes were separated into two distinct populations in the DAPI quantifications, similar to the red fluorescence-based multidimensional analysis. After surveying the images, the distinct values in the DAPI and red-equivalent quantifications were caused by a population of erythrocytes that had platelets on top of them mimicking internal structures, thereby causing a higher entropy. All the erythrocytes in that population belonged to the white blood cell concentrated smears (which always had some remaining erythrocytes), indicating that this was a preparation artifact.
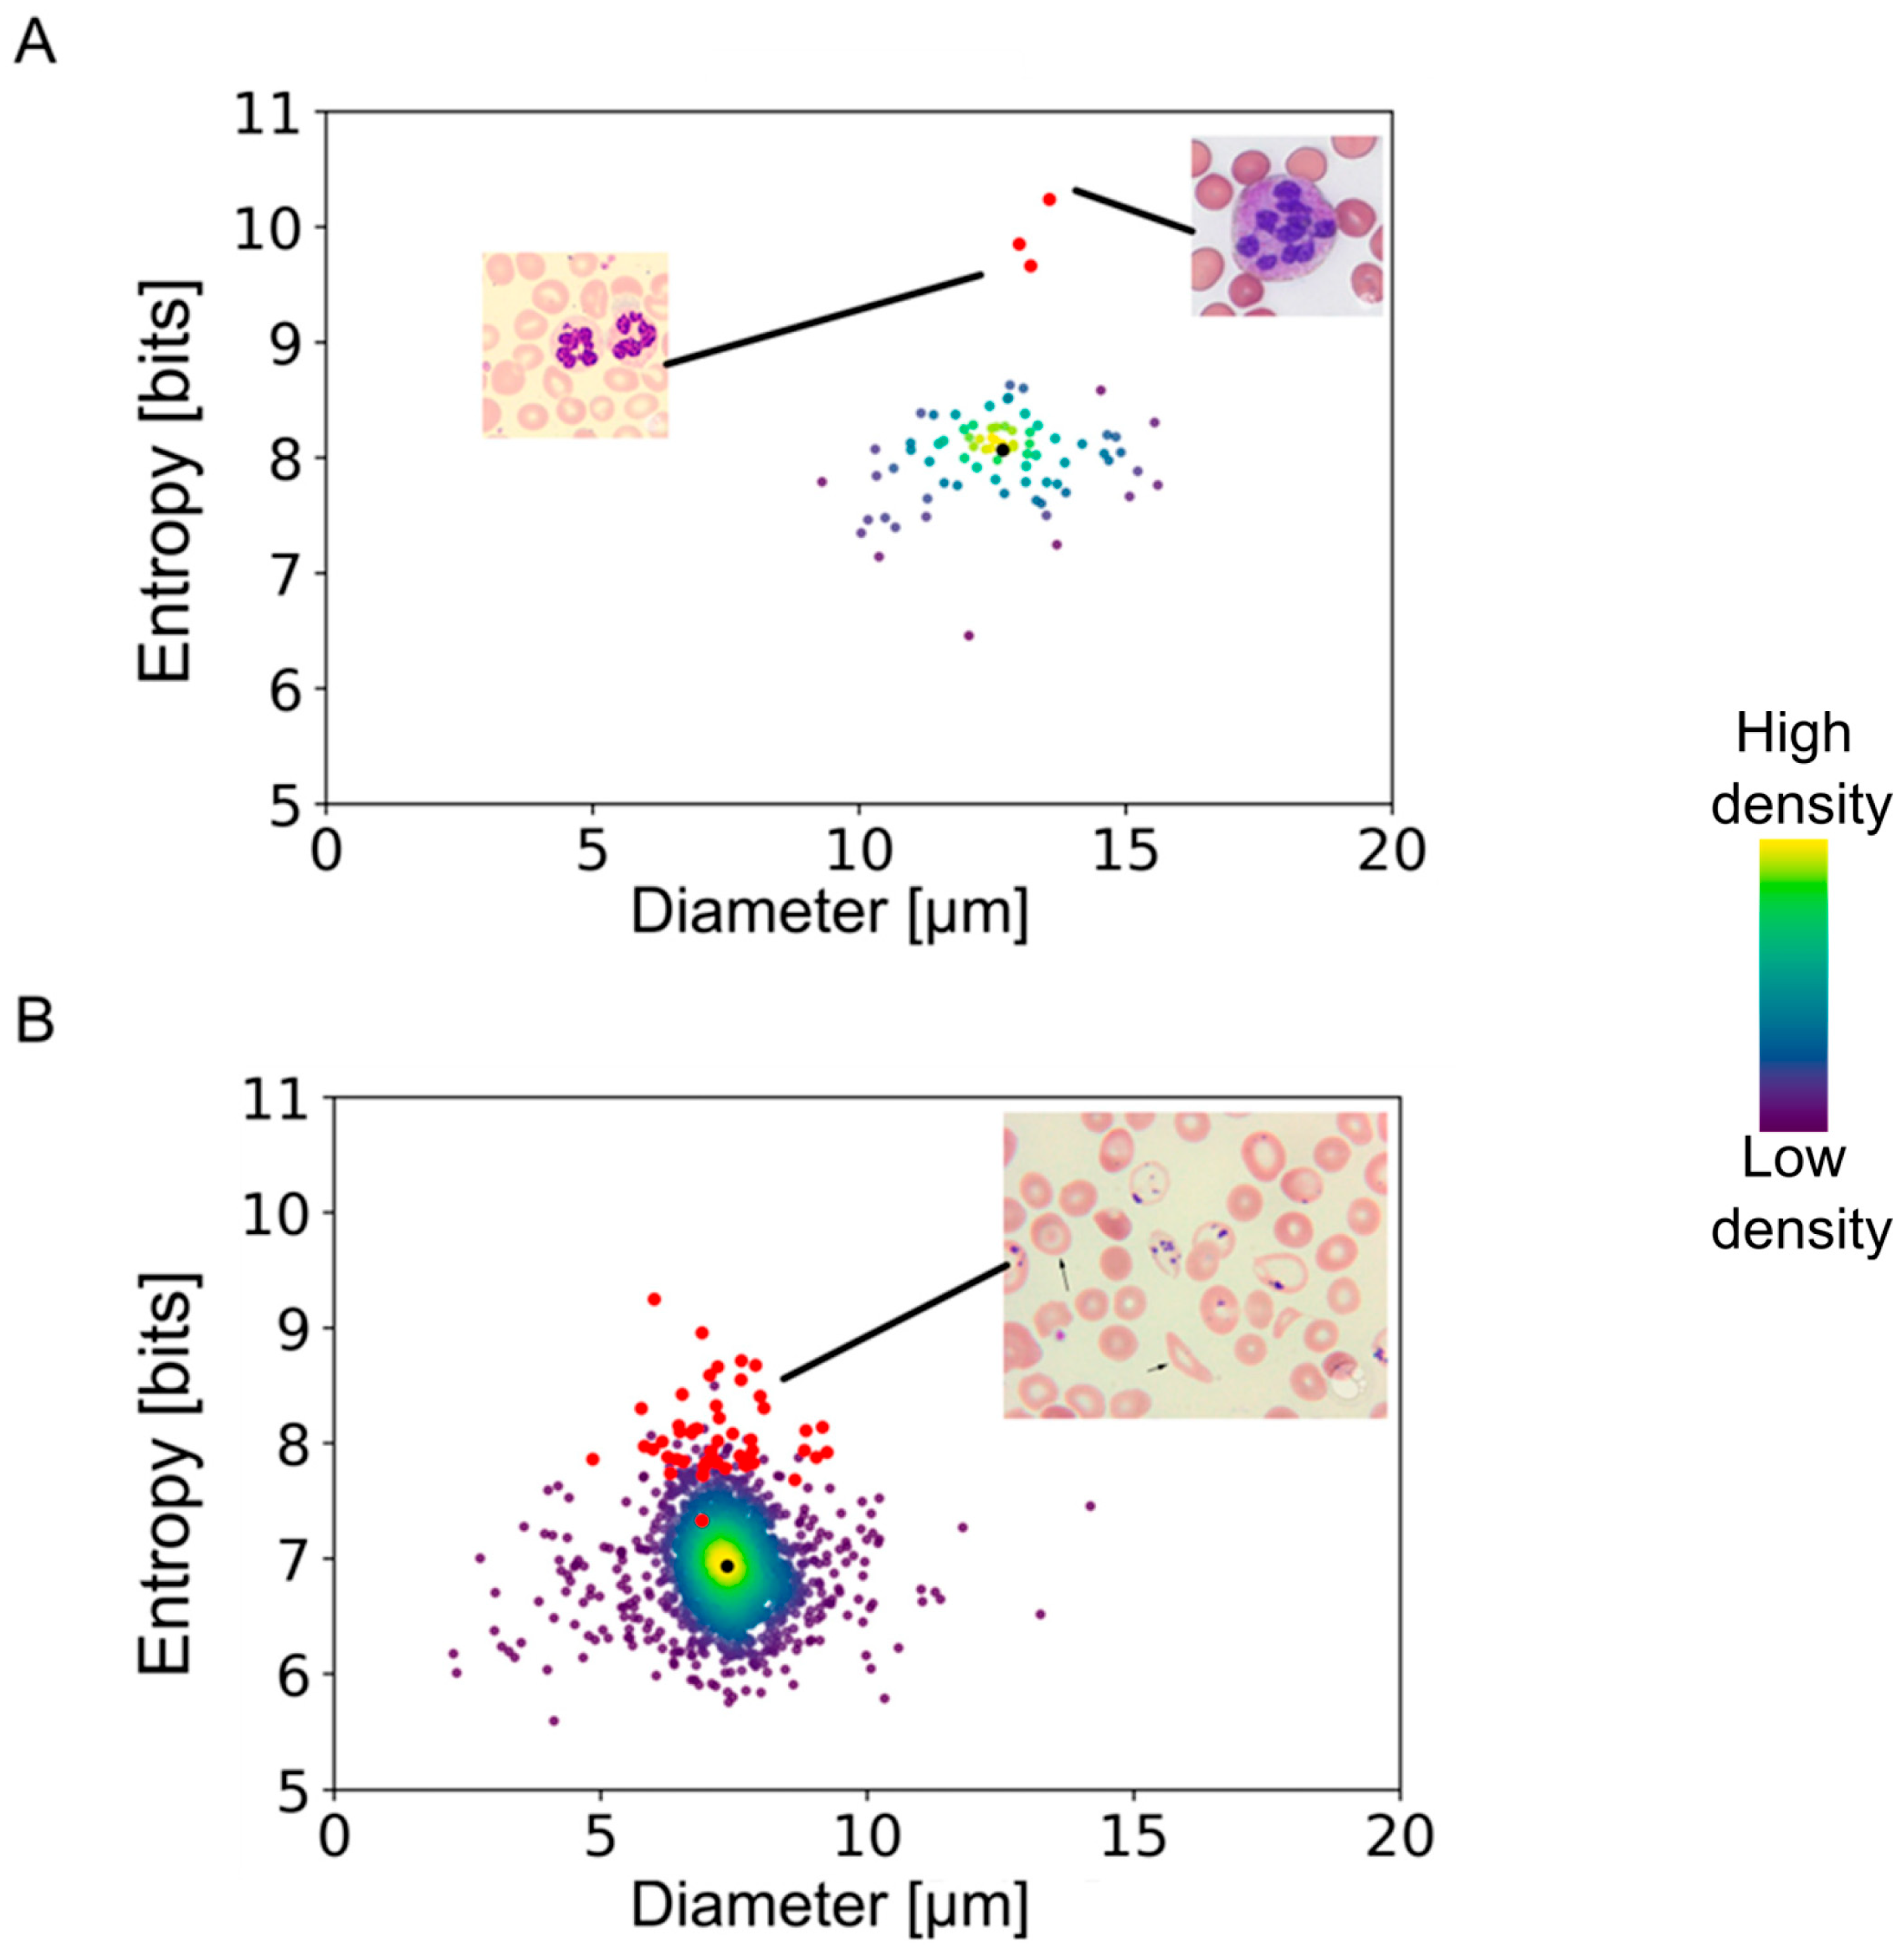
In order to test the applicability of our method to the assessment of disease states, we applied our algorithm to images from a public database (provided by the American Society of Hematology:
https://imagebank.hematology.org/ accessed on 10 November 2023) containing pathological conditions. The results presented in
Figure 5 show highly segmented neutrophils from an anemia patient and erythrocytes with Pappenheimer bodies and basophilic stippling obtained from a patient with sickle cell disease. Neutrophils with a clear pathological condition deviated from the entropy/diameter clusters of normal cells. The separation observed in the entropy–cell diameter plane was higher for cells with more drastic structural modifications than cells with minor morphological changes. In the case of sickle cell erythrocytes, the separation was smaller than the heavily segmented neutrophils, apparently due to lower aberrations of internal structures.
4. Discussion
The big advantage of an AI-based workflow used to identify the various cell types of the blood is that objects cannot only be detected and classified in an automated manner without any human workload; these objects can also be measured and quantified in a way that exceeds the possibilities of human observers. In our study, we were able to demonstrate that adding a nuclear dye and taking advantage of the endogenous fluorescence of the Giemsa components can improve the AI-based algorithm and cell recognition, thereby extending the exploratory potential of a traditional hematological diagnostic method, like blood smear microscopy. Importantly, the inclusion of the DAPI staining in the Giemsa protocol does not significantly increase the requirements of the method regarding resources or equipment.
The algorithms that we developed with our samples and images correctly detected and identified blood cells taken from publicly available databases and delivered the expected parameters for cell diameters, demonstrating their robustness for quantitative measurements. Moreover, the color-trained algorithm was able to nullify the effect of different tonalities in the cells’ cytoplasm, abnormal shapes, and foreign bodies in their internal structures. As is known from various pathological conditions, the shape of cells can change with disease state. Erythrocytes and platelets usually exhibit a very well-defined size, and deviations from it are clear signs of pathological conditions [
40,
43,
73]. Since we used blood from healthy subjects in this study, the distribution of cell diameters that we observed for both these cell types was compact, even after considering the overlapping in the erythrocytes. However, it can be anticipated that, for example, the erythrocyte distribution width changes with chemotherapy treatment of cancer patients, given that this affects cell division and thus erythropoiesis and that this can be used for therapy monitoring purposes [
74].
In contrast to erythrocytes and platelets, the leukocytes’ diameters measured in our images showed a higher variance. Lymphocytes and monocytes increase in size as a sign of maturity [
21,
60]. Monocytes become larger before they migrate into the lymphatic system, followed by their differentiation into macrophages [
42,
75,
76]. Similarly, neutrophils have been characterized as leukocytes, whose mechanical properties are intrinsically related to their activation state [
11,
36,
77]. Although activated neutrophils are usually not found in the blood, their plasticity leads to deformations that are expected to slightly broaden their size distribution once a blood smear is performed. Testing our algorithm with blood stain images from megaloblastic anemia patients verified that aberrations of neutrophils can be detected in a quantitative manner via entropy measures, emphasizing the potential of this automated image analysis for diagnostic purposes. Interestingly, little is known about the morphodynamics of eosinophils. Instead, an elevation or a reduction in their numbers has been used as a marker for various disease states. Considering eosinophils’ crucial role in parasitic infections and allergies, quantifying their morphology might help to find trends in the dynamics of such pathologies.
It is clear that our study is not the first one on the application of AI methods to the classification of blood cells. There are several published reports on related approaches, especially for pathological conditions, such as anemia and leukemia [
2,
7,
47,
78]. However, most reported models have focused on structural modifications in only one specific type of blood cell, usually erythrocytes or lymphocytes. Furthermore, previously published AI models yield qualitative information about the cells studied, while our model yields quantitative information on the blood cells’ morphology. This opens new possibilities to assess structural modifications associated with diseases that affect hematopoiesis or cellular activation states. It might be possible, for example, to detect developing leukemia by morphological anomalies, which are imperceivable to the human eye but are noticeable by AI algorithms, even before a significant increase in leukocyte numbers is observed. As shown in
Figure 5, these imperceivable abnormalities can manifest as deviations from entropy or shape factor values expected for normal cells. As mentioned before, most of the previously reported algorithms were, by design, constrained to detect only one type of blood cell, and some required up to 10,000 images. The algorithms that we present in this study achieve comparable values of accuracy (>90%) and recall (>95%) for all our detectable objects [
8,
9,
45,
46,
48,
49,
78,
79]. However, the similarities between segmented neutrophils and young neutrophils required a higher number of cells for exact discrimination. In combination with the rather low number of young neutrophils (comprising about 3–5% of the leukocytes), it is clear that this limits the algorithm’s ability to discriminate between these two states of neutrophils. An over-sampling of neutrophils was consequently required to differentiate young and mature neutrophils. Nevertheless, this had to be performed only for the training of the AI so that subsequent analyses are able to discriminate them precisely, at least with the algorithm that was based on a combination of transmitted light and DAPI, as well as red fluorescence (the TDR algorithm). Naturally, having a limited number of realizations of an object causes some loss of accuracy of the algorithm, and objects that slightly differ from what is found in the database might be overlooked.
An interesting observation during our study was that the AI algorithms initially had difficulties distinguishing between certain cells, such as eosinophils and erythrocytes, which are easily discriminated by human observers. The reason for this was apparently that the red color of erythrocytes was similar to the red staining of eosinophils, despite their clear differences in size and structure. However, with an increasing number of objects in the training dataset, this issue was solved. This finding emphasizes that AI algorithms based on neural networks find their decisions in a way that differs significantly from humans. Consequently, either sufficient numbers of objects have to be applied for the training of the algorithm, or additional parameters, such as cell diameters, have to be used as “gating” values to deliver precise classifications. The latter would have required a completely different set-up of machine learning, which was unfeasible in the current study. Nevertheless, our approach demonstrated a clear advantage of analyzing the pixels’ intensities and arrangement to achieve an entropy quantification, which turned out to be a simple yet efficient way of clustering cells according to their visual features. This method quantifies how complex a cell’s internal structure is. Consequently, cells with similar internal structures in a given staining are not easily separable. However, adding DAPI fluorescence to the entropy analysis proved to be an effective way to improve the classification. All the leukocyte subtypes showed individual clustering, except for the segmented neutrophils, which could not be separated from the young neutrophils. As expected, the leukocyte’s red-fluorescence entropy values had insignificantly different values. In addition, the second population of erythrocytes that we observed only in the white blood concentrated smears implies that cell preparation routines can affect the analysis. Nevertheless, our entropy-related measurement method detected internal structure modifications that are not reflected in differences in geometric parameters, such as cell diameters or perimeters.
5. Conclusions
In conclusion, we think that our multidimensional analysis, including the entropy measurements, bears the potential to detect alterations in internal structures that are associated with pathological states.
Although extensive research has been published on correlations between pathological conditions (such as depression, chemotherapy effects, stroke risks) and leukocyte size, erythrocyte diameter, or leukocyte type distribution, none of these reports have explored internal cellular structures. Our algorithm can potentially follow the development of diseases and responses to therapies by tracking subtle morphological changes whose latter stages are well-defined in histological studies, including parasite infections, various types of cancer, hematological conditions, or autoimmune diseases. We conclude that the algorithms developed during this study provide a means for automatizing the visual recognition and morphological quantification of different types of blood cells. In addition, combining the traditional Giemsa stain with DAPI enhances the recognition rate of otherwise similar cells, particularly young neutrophils and segmented neutrophils. Furthermore, our results cast light on the potential role of multidimensional analysis employing measurements of generalized GLCM entropy as a marker for blood cells’ general condition.
The algorithms that we present in this study have been established for the blood of healthy individuals and proved to discover pathological alterations seen in public image databases. Nevertheless, the algorithms and the AI training have to be extended to samples comprising well-defined disease states to unleash their full potential. However, we are confident that our approach lays the foundation for a new range of studies to quantify and characterize the blood cells of patients in various disease states. Since blood smear microscopy is technically very simple and does not require any expensive equipment, our AI-based analysis approach has the potential of widespread application. Even small diagnostic labs or general practitioners could use it and apply it for routine analysis of their patients. Comparing individual results with the database of common features and following personal changes over time, for instance, during treatment phases, has the potential to contribute to personalized precision health care.
Supplementary Materials
The following supporting information can be downloaded at
https://www.mdpi.com/article/10.3390/jmp5010003/s1, Figure S1: Control of the color-AI-trained algorithm detection, Figure S2: Example of automatic detection of erythrocytes in color images using three different algorithms; Table S1: Statistical quantification of the observational erythrocyte-associated errors for the color-trained algorithms; Table S2: Statistical quantification of the observational errors for three color-trained algorithms using three different randomizations of images into training and validation datasets; Table S3: Statistical quantification of the observational errors for three TDR-trained algorithms using three different randomizations of images into training and validation datasets.
Author Contributions
Conceptualization, J.A.S., M.C.-M., M.M.-R. and P.K.-F.; methodology, M.C.-M., A.B., M.M.-R. and P.K.-F.; software, M.C.-M., M.M.-R. and P.K.-F.; validation, M.C.-M. and A.B.; formal analysis, M.C.-M. and P.K.-F.; investigation, J.A.S., M.C.-M. and A.B.; resources, J.A.S., M.M.-R. and P.K.; data curation, M.C.-M. and A.B.; writing—original draft preparation, M.C.-M.; writing—review and editing, J.A.S., M.M.-R. and P.K.-F.; visualization, J.A.S. and M.C.-M.; supervision, J.A.S., M.C.-M., M.M.-R. and P.K.; project administration, J.A.S., M.M.-R. and P.K.; funding acquisition, J.A.S., M.M.-R. and P.K. All authors have read and agreed to the published version of the manuscript.
Funding
This research was funded by the Austrian Research Promotion Agency (FFG), grant number FO999895307.
Institutional Review Board Statement
The study was conducted in accordance with the Declaration of Helsinki, and approved by the Institutional Ethics Committee of the Medical University of Vienna (approval number: EK-Nr. 1738/2015, date of approval: 23 October 2015).
Informed Consent Statement
Informed consent was obtained from all subjects involved in the study. Blood sampling was approved by the ethical commission of the Medical University of Vienna.
Data Availability Statement
The data presented in this study are available on request from the corresponding author. Codes for image processing routines are deposited under the links provided in the text. Links to publicly accessible image databases used in this study are provided in the text as well.
Acknowledgments
We gratefully acknowledge the technical support provided by Judit Mihaly-Bison, Mario Hilpert, and Bhuma Wysoudil.
Conflicts of Interest
P.K.-F., M.M.-R. and P.K. are employed by KML Vision GmbH. The remaining authors declare that the research was conducted in the absence of any commercial or financial relationships that could be construed as a potential conflict of interest.
References
- Cho, B.R.; Kenzy, S.G.; Kim, U.H. Atypical cells in the peripheral blood of chickens exposed to Marek’s disease agent. Can. J. Comp. Med. 1968, 32, 562–567. [Google Scholar]
- Alcaraz-Quiles, J.; Molina, Á.; Laguna, J.; Rodríguez-García, M.; Gutiérrez, G.; Luis Bedini, J.; Merino, A. Peripheral blood morphology review and diagnostic proficiency evaluation by a new Spanish EQAS during the period 2011–2019. Int. J. Lab. Hematol. 2021, 43, 44–51. [Google Scholar] [CrossRef] [PubMed]
- Adewoyin, A.S.; Nwogoh, B. Peripheral blood film—A review. Ann. Ib. Postgrad. Med. 2014, 12, 71–79. [Google Scholar] [PubMed]
- Palmer, L.; Briggs, C.; McFadden, S.; Zini, G.; Burthem, J.; Rozenberg, G.; Proytcheva, M.; Machin, S.J. ICSH recommendations for the standardization of nomenclature and grading of peripheral blood cell morphological features. Int. J. Lab. Hematol. 2015, 37, 287–303. [Google Scholar] [CrossRef]
- Beckman, A.K.; Ng, V.L.; Jaye, D.L.; Gaddh, M.; Williams, S.A.; Yohe, S.L.; Zhang, L.; Linden, M.A. Clinician-ordered peripheral blood smears have low reimbursement and variable clinical value: A three-institution study, with suggestions for operational efficiency. Diagn. Pathol. 2020, 15, 112. [Google Scholar] [CrossRef]
- Prinyakupt, J.; Pluempitiwiriyawej, C. Segmentation of white blood cells and comparison of cell morphology by linear and naïve Bayes classifiers. Biomed. Eng. Online 2015, 14, 63. [Google Scholar] [CrossRef]
- Kutlu, H.; Avci, E.; Özyurt, F. White blood cells detection and classification based on regional convolutional neural networks. Med. Hypotheses 2020, 135, 109472. [Google Scholar] [CrossRef]
- Acevedo, A.; Alférez, S.; Merino, A.; Puigví, L.; Rodellar, J. Recognition of peripheral blood cell images using convolutional neural networks. Comput. Methods Programs Biomed. 2019, 180, 105020. [Google Scholar] [CrossRef]
- Rodellar, J.; Alférez, S.; Acevedo, A.; Molina, A.; Merino, A. Image processing and machine learning in the morphological analysis of blood cells. Int. J. Lab. Hematol. 2018, 40 (Suppl. S1), 46–53. [Google Scholar] [CrossRef]
- Shitong, W.; Min, W. A new detection algorithm (NDA) based on fuzzy cellular neural networks for white blood cell detection. IEEE Trans. Inf. Technol. Biomed. 2006, 10, 5–10. [Google Scholar] [CrossRef] [PubMed]
- Nesargi, P.; Niranjan, H.S.; Bandiya, P.; Benakappa, N. Neutrophil Volume, conductivity and scatter (VCS) as a screening tool in neonatal sepsis. Sci. Rep. 2020, 10, 4457. [Google Scholar] [CrossRef]
- Chaves, F.; Tierno, B.; Xu, D. Neutrophil volume distribution width: A new automated hematologic parameter for acute infection. Arch. Pathol. Lab. Med. 2006, 130, 378–380. [Google Scholar] [CrossRef]
- Aydemir, Y.; Pınar, A.; Hızal, G.; Demir, H.; Saltık Temizel, I.N.; Özen, H.; Akbıyık, F.; Yüce, A. Neutrophil volume distribution width as a new marker in detecting inflammatory bowel disease activation. Int. J. Lab. Hematol. 2017, 39, 51–57. [Google Scholar] [CrossRef]
- Güneş, M. Is neutrophil/eosinophil ratio at admission a prognostic marker for in-hospital mortality of acute ischemic stroke? J. Stroke Cerebrovasc. Dis. 2020, 29, 104999. [Google Scholar] [CrossRef]
- Seyit, M.; Avci, E.; Nar, R.; Senol, H.; Yilmaz, A.; Ozen, M.; Oskay, A.; Aybek, H. Neutrophil to lymphocyte ratio, lymphocyte to monocyte ratio and platelet to lymphocyte ratio to predict the severity of COVID-19. Am. J. Emerg. Med. 2021, 40, 110–114. [Google Scholar] [CrossRef]
- Kara, A.; Guven, M.; Yilmaz, M.S.; Demir, D.; Elden, H. Are neutrophil, platelet and eosinophil-to-lymphocyte ratio and red blood cell distribution width can be used for nasal polyposis? Eur. Arch. Otorhinolaryngol. 2018, 275, 409–413. [Google Scholar] [CrossRef]
- Dinç, T.; Sapmaz, A.; Erkuş, Y.; Yavuz, Z. Complicated or non-complicated appendicitis? That is the question. Ulus. Travma Acil Cerrahi Derg. 2022, 28, 390–394. [Google Scholar] [CrossRef] [PubMed]
- Beyazal, O.F. Does complete blood count have a role in the prediction of deep vein thrombosis? Vascular 2023, 17085381231175260. [Google Scholar] [CrossRef] [PubMed]
- Vives Corrons, J.L.; Colomer, D.; Pujades, A.; Matutes, E.; Pastor, C.; Aymerich, M. Relationship between lymphocyte size and enzyme activities in two morphological variants of B-chronic lymphocytic leukaemia. Acta Haematol. 1989, 82, 22–26. [Google Scholar] [CrossRef]
- Rozman, C.; Montserrat, E.; Feliu, E.; Woessner, S. Lymphocyte size and survival of patients with chronic lymphocytic leukaemia (B-type). Scand. J. Haematol. 1980, 24, 315–320. [Google Scholar] [CrossRef] [PubMed]
- Brohée, D.; Nève, P. Effect of dietary high doses of vitamin E on the cell size of T and B lymphocyte subsets in young and old CBA mice. Mech. Ageing Dev. 1995, 85, 147–159. [Google Scholar] [CrossRef] [PubMed]
- Wilson, T.M. On the chemistry and staining properties of certain derivatives of the methylene blue group when combined with eosin. J. Exp. Med. 1907, 9, 645–670. [Google Scholar] [CrossRef] [PubMed][Green Version]
- Mohammed, E.A.; Mohamed, M.M.A.; Far, B.H.; Naugler, C. Peripheral blood smear image analysis: A comprehensive review. J. Pathol. Inform. 2014, 5, 9. [Google Scholar] [CrossRef]
- Clark, I.A.; Richmond, J.E.; Wills, E.J.; Allison, A.C. Immunity to intra-erythrocytic protoza. Lancet 1975, 2, 1128–1129. [Google Scholar] [CrossRef] [PubMed]
- Saha, A.K.; Dallo, S.F.; Detmar, A.L.; Osmulski, P.; Gaczynska, M.; Huang, T.H.-M.; Ramasubramanian, A.K. Cellular cholesterol regulates monocyte deformation. J. Biomech. 2017, 52, 83–88. [Google Scholar] [CrossRef] [PubMed]
- Wen, J.; Ling, R.; Chen, R.; Zhang, S.; Dai, Y.; Zhang, T.; Guo, F.; Wang, Q.; Wang, G.; Jiang, Y. Diversity of arterial cell and phenotypic heterogeneity induced by high-fat and high-cholesterol diet. Front. Cell Dev. Biol. 2023, 11, 971091. [Google Scholar] [CrossRef]
- Lavoie, H.; Gagnon, J.; Therrien, M. ERK signalling: A master regulator of cell behaviour, life and fate. Nat. Rev. Mol. Cell Biol. 2020, 21, 607–632. [Google Scholar] [CrossRef]
- Niogret, C.; Birchmeier, W.; Guarda, G. SHP-2 in Lymphocytes’ Cytokine and Inhibitory Receptor Signaling. Front. Immunol. 2019, 10, 2468. [Google Scholar] [CrossRef]
- Ünal, E.B.; Uhlitz, F.; Blüthgen, N. A compendium of ERK targets. FEBS Lett. 2017, 591, 2607–2615. [Google Scholar] [CrossRef]
- Ersahin, T.; Tuncbag, N.; Cetin-Atalay, R. The PI3K/AKT/mTOR interactive pathway. Mol. Biosyst. 2015, 11, 1946–1954. [Google Scholar] [CrossRef]
- Gold, M.R. B cell development: Important work for ERK. Immunity 2008, 28, 488–490. [Google Scholar] [CrossRef]
- Goldfarb, A.N. ERK expands its empire. Leuk. Res. 2005, 29, 1235–1236. [Google Scholar] [CrossRef] [PubMed]
- Yasuda, T.; Kurosaki, T. Regulation of lymphocyte fate by Ras/ERK signals. Cell Cycle 2008, 7, 3634–3640. [Google Scholar] [CrossRef] [PubMed]
- Anderson, G.J.; Roswit, W.T.; Holtzman, M.J.; Hogg, J.C.; Van Eeden, S.F. Effect of mechanical deformation of neutrophils on their CD18/ICAM-1-dependent adhesion. J. Appl. Physiol. 2001, 91, 1084–1090. [Google Scholar] [CrossRef]
- Kitagawa, Y.; Van Eeden, S.F.; Redenbach, D.M.; Daya, M.; Walker, B.A.; Klut, M.E.; Wiggs, B.R.; Hogg, J.C. Effect of mechanical deformation on structure and function of polymorphonuclear leukocytes. J. Appl. Physiol. 1997, 82, 1397–1405. [Google Scholar] [CrossRef]
- Ekpenyong, A.E.; Toepfner, N.; Fiddler, C.; Herbig, M.; Li, W.; Cojoc, G.; Summers, C.; Guck, J.; Chilvers, E.R. Mechanical deformation induces depolarization of neutrophils. Sci. Adv. 2017, 3, e1602536. [Google Scholar] [CrossRef]
- de Jesus Gonzalez-Contreras, F.; Zarate, X. Neutrophil extracellular traps: Modulation mechanisms by pathogens. Cell. Immunol. 2022, 382, 104640. [Google Scholar] [CrossRef]
- Evans, E.A.; La Celle, P.L. Intrinsic material properties of the erythrocyte membrane indicated by mechanical analysis of deformation. Blood 1975, 45, 29–43. [Google Scholar] [CrossRef]
- Waters, C.M.; Sporn, P.H.S.; Liu, M.; Fredberg, J.J. Cellular biomechanics in the lung. Am. J. Physiol. Lung Cell. Mol. Physiol. 2002, 283, L503–L509. [Google Scholar] [CrossRef]
- Starodubtseva, M.N.; Kuznetsova, T.G.; Yegorenkov, N.I.; Cherenkevich, S.N. Structural and mechanical characteristics of erythrocyte membranes in patients with type 2 diabetes mellitus. Bull. Exp. Biol. Med. 2008, 145, 99–103. [Google Scholar] [CrossRef]
- Kuck, L.; Peart, J.N.; Simmonds, M.J. Calcium dynamically alters erythrocyte mechanical response to shear. Biochim. Biophys. Acta Mol. Cell Res. 2020, 1867, 118802. [Google Scholar] [CrossRef]
- Garcia-Herreros, A.; Yeh, Y.-T.; Peng, Z.; Del Álamo, J.C. Cyclic mechanical stresses alter erythrocyte membrane composition and microstructure and trigger macrophage phagocytosis. Adv. Sci. 2022, 9, e2201481. [Google Scholar] [CrossRef]
- Robier, C. Platelet morphology. J. Lab. Med. 2020, 44, 231–239. [Google Scholar] [CrossRef]
- Charafeddine, K.M.; Youssef, A.M.; Mahfouz, R.A.R.; Sarieddine, D.S.; Daher, R.T. Comparison of neutrophil volume distribution width to C-reactive protein and procalcitonin as a proposed new marker of acute infection. Scand. J. Infect. Dis. 2011, 43, 777–784. [Google Scholar] [CrossRef]
- Zhao, J.; Zhang, M.; Zhou, Z.; Chu, J.; Cao, F. Automatic detection and classification of leukocytes using convolutional neural networks. Med. Biol. Eng. Comput. 2017, 55, 1287–1301. [Google Scholar] [CrossRef] [PubMed]
- Shouval, R.; Fein, J.A.; Savani, B.; Mohty, M.; Nagler, A. Machine learning and artificial intelligence in haematology. Br. J. Haematol. 2021, 192, 239–250. [Google Scholar] [CrossRef] [PubMed]
- Salah, H.T.; Muhsen, I.N.; Salama, M.E.; Owaidah, T.; Hashmi, S.K. Machine learning applications in the diagnosis of leukemia: Current trends and future directions. Int. J. Lab. Hematol. 2019, 41, 717–725. [Google Scholar] [CrossRef]
- Radakovich, N.; Nagy, M.; Nazha, A. Artificial intelligence in hematology: Current challenges and opportunities. Curr. Hematol. Malig. Rep. 2020, 15, 203–210. [Google Scholar] [CrossRef] [PubMed]
- Landau, M.S.; Pantanowitz, L. Artificial intelligence in cytopathology: A review of the literature and overview of commercial landscape. J. Am. Soc. Cytopathol. 2019, 8, 230–241. [Google Scholar] [CrossRef]
- Lin, Z.; Lawrence, W.R.; Huang, Y.; Lin, Q.; Gao, Y. Classifying depression using blood biomarkers: A large population study. J. Psychiatr. Res. 2021, 140, 364–372. [Google Scholar] [CrossRef] [PubMed]
- Vatansever, S.; Schlessinger, A.; Wacker, D.; Kaniskan, H.Ü.; Jin, J.; Zhou, M.-M.; Zhang, B. Artificial intelligence and machine learning-aided drug discovery in central nervous system diseases: State-of-the-arts and future directions. Med. Res. Rev. 2021, 41, 1427–1473. [Google Scholar] [CrossRef]
- Alsuwaidi, L.; Al Heialy, S.; Shaikh, N.; Al Najjar, F.; Seliem, R.; Han, A.; Hachim, M. Monocyte distribution width as a novel sepsis indicator in COVID-19 patients. BMC Infect. Dis. 2022, 22, 27. [Google Scholar] [CrossRef]
- Knoll, R.; Schultze, J.L.; Schulte-Schrepping, J. Monocytes and Macrophages in COVID-19. Front. Immunol. 2021, 12, 720109. [Google Scholar] [CrossRef] [PubMed]
- Cusinato, M.; Hadcocks, L.; Yona, S.; Planche, T.; Macallan, D. Increased monocyte distribution width in COVID-19 and sepsis arises from a complex interplay of altered monocyte cellular size and subset frequency. Int. J. Lab. Hematol. 2022, 44, 1029–1039. [Google Scholar] [CrossRef] [PubMed]
- Olingy, C.E.; Dinh, H.Q.; Hedrick, C.C. Monocyte heterogeneity and functions in cancer. J. Leukoc. Biol. 2019, 106, 309–322. [Google Scholar] [CrossRef] [PubMed]
- Morell-Garcia, D.; Toledo-Pons, N.; Sanchis, P.; Bauça, J.M.; Sánchez, J.M.; Peña-Zarza, J.; Giménez, P.; Pierola, J.; de la Peña-Bravo, M.; Alonso-Fernández, A.; et al. Red cell distribution width: A new tool for the severity prediction of sleep apnoea syndrome in children. ERJ Open Res. 2020, 6, 00278–2019. [Google Scholar] [CrossRef] [PubMed]
- Sekiguchi, D.R.; Smith, S.B.; Sutter, J.A.; Goodman, N.G.; Propert, K.; Louzoun, Y.; Rogers, W.; Luning Prak, E.T. Circulating lymphocyte subsets in normal adults are variable and can be clustered into subgroups. Cytom. B Clin. Cytom. 2011, 80, 291–299. [Google Scholar] [CrossRef]
- Hou, S.-K.; Lin, H.-A.; Chen, S.-C.; Lin, C.-F.; Lin, S.-F. Monocyte Distribution Width, Neutrophil-to-Lymphocyte Ratio, and Platelet-to-Lymphocyte Ratio Improves Early Prediction for Sepsis at the Emergency. J. Pers. Med. 2021, 11, 732. [Google Scholar] [CrossRef] [PubMed]
- Shiftan, T.A.; Mendelsohn, J. The circulating “atypical” lymphocyte. Hum. Pathol. 1978, 9, 51–61. [Google Scholar] [CrossRef]
- Klement, J.D.; Redd, P.S.; Lu, C.; Merting, A.D.; Poschel, D.B.; Yang, D.; Savage, N.M.; Zhou, G.; Munn, D.H.; Fallon, P.G.; et al. Tumor PD-L1 engages myeloid PD-1 to suppress type I interferon to impair cytotoxic T lymphocyte recruitment. Cancer Cell 2023, 41, 620–636.e9. [Google Scholar] [CrossRef]
- Porpaczy, E.; Skrabs, C.; Schwarzinger, I.; Augustin, D.; Thalhammer, R.; Jaeger, U. Increased lymphocyte cell size with blastoid morphology associated with splenic rupture following cessation of ibrutinib. Br. J. Haematol. 2018, 181, 431. [Google Scholar] [CrossRef]
- Oltulu, R.; Katipoğlu, Z.; Gündoğan, A.O.; Mirza, E.; Belviranlı, S. Evaluation of inflammatory biomarkers in patients with keratoconus. Eur. J. Ophthalmol. 2022, 32, 154–159. [Google Scholar] [CrossRef]
- Haralick, R.M.; Shanmugam, K.; Dinstein, I. Textural Features for Image Classification. IEEE Trans. Syst. Man Cybern. 1973, 3, 610–621. [Google Scholar] [CrossRef]
- Murata, S.; Herman, P.; Lakowicz, J.R. Texture analysis of fluorescence lifetime images of AT- and GC-rich regions in nuclei. J. Histochem. Cytochem. 2001, 49, 1443–1451. [Google Scholar] [CrossRef] [PubMed]
- Murata, S.; Herman, P.; Lakowicz, J.R. Texture analysis of fluorescence lifetime images of nuclear DNA with effect of fluorescence resonance energy transfer. Cytometry 2001, 43, 94–100. [Google Scholar] [CrossRef] [PubMed]
- Shannon, C.E. A mathematical theory of communication. Bell Syst. Tech. J. 1948, 27, 379–423. [Google Scholar] [CrossRef]
- Shvalov, A.N.; Soini, J.T.; Chernyshev, A.V.; Tarasov, P.A.; Soini, E.; Maltsev, V.P. Light-scattering properties of individual erythrocytes. Appl. Opt. 1999, 38, 230–235. [Google Scholar] [CrossRef] [PubMed]
- Borovoi, A.G.; Naats, E.I.; Oppel, U.G. Scattering of light by a red blood cell. J. Biomed. Opt. 1998, 3, 364–372. [Google Scholar] [CrossRef]
- Young, B.; Lowe, J.S.; Stevens, A.; Heath, J.W. Wheater’s Functional Histology: A Text and Colour Atlas, 5th ed.; Churchill Livingstone: Edinburgh, Scotland, 2006; p. 448. ISBN 978-0-443-06850-8. [Google Scholar]
- Uhm, T.G.; Kim, B.S.; Chung, I.Y. Eosinophil development, regulation of eosinophil-specific genes, and role of eosinophils in the pathogenesis of asthma. Allergy Asthma Immunol. Res. 2012, 4, 68–79. [Google Scholar] [CrossRef] [PubMed]
- Chiu, P.-L.; Chang, C.-H.; Lin, Y.-L.; Tsou, P.-H.; Li, B.-R. Rapid and Safe Isolation of Human Peripheral Blood B and T Lymphocytes through Spiral Microfluidic Channels. Sci. Rep. 2019, 9, 8145. [Google Scholar] [CrossRef] [PubMed]
- Fingerhut, L.; Dolz, G.; de Buhr, N. What is the evolutionary fingerprint in neutrophil granulocytes? Int. J. Mol. Sci. 2020, 21, 4523. [Google Scholar] [CrossRef]
- Picas, L.; Rico, F.; Deforet, M.; Scheuring, S. Structural and mechanical heterogeneity of the erythrocyte membrane reveals hallmarks of membrane stability. ACS Nano 2013, 7, 1054–1063. [Google Scholar] [CrossRef] [PubMed]
- Yaegashi, D.; Oikawa, M.; Yokokawa, T.; Misaka, T.; Kobayashi, A.; Kaneshiro, T.; Yoshihisa, A.; Nakazato, K.; Ishida, T.; Takeishi, Y. Red Blood Cell Distribution Width Is a Predictive Factor of Anthracycline-Induced Cardiotoxicity. Front. Cardiovasc. Med. 2020, 7, 594685. [Google Scholar] [CrossRef] [PubMed]
- Foster, K.M.; Papavassiliou, D.V.; O’Rear, E.A. Elongational stresses and cells. Cells 2021, 10, 2352. [Google Scholar] [CrossRef] [PubMed]
- Ożańska, A.; Szymczak, D.; Rybka, J. Pattern of human monocyte subpopulations in health and disease. Scand. J. Immunol. 2020, 92, e12883. [Google Scholar] [CrossRef] [PubMed]
- Hidalgo, A.; Chilvers, E.R.; Summers, C.; Koenderman, L. The neutrophil life cycle. Trends Immunol. 2019, 40, 584–597. [Google Scholar] [CrossRef]
- Lee, S.Y.; Chen, C.M.E.; Lim, E.Y.P.; Shen, L.; Sathe, A.; Singh, A.; Sauer, J.; Taghipour, K.; Yip, C.Y.C. Image Analysis Using Machine Learning for Automated Detection of Hemoglobin H Inclusions in Blood Smears—A Method for Morphologic Detection of Rare Cells. J. Pathol. Inform. 2021, 12, 18. [Google Scholar] [CrossRef]
- Theofilatos, K.; Stojkovic, S.; Hasman, M.; van der Laan, S.W.; Baig, F.; Barallobre-Barreiro, J.; Schmidt, L.E.; Yin, S.; Yin, X.; Burnap, S.; et al. Proteomic atlas of atherosclerosis: The contribution of proteoglycans to sex differences, plaque phenotypes, and outcomes. Circ. Res. 2023, 133, 542–558. [Google Scholar] [CrossRef]
| Disclaimer/Publisher’s Note: The statements, opinions and data contained in all publications are solely those of the individual author(s) and contributor(s) and not of MDPI and/or the editor(s). MDPI and/or the editor(s) disclaim responsibility for any injury to people or property resulting from any ideas, methods, instructions or products referred to in the content. |
© 2024 by the authors. Licensee MDPI, Basel, Switzerland. This article is an open access article distributed under the terms and conditions of the Creative Commons Attribution (CC BY) license (https://creativecommons.org/licenses/by/4.0/).


