1. Introduction
At the time of discovery [
1] the symbol “L1 protein” was used for CP, but a proper name was introduced when its antimicrobial activity had been found [
2]. Its distribution in cells, tissues, body fluids, and excretions are summarized in the paper by Johne et al. [
3]. Briefly, it is a dominant cytosol protein in neutrophil granulocytes, monocytes, and most types of squamous epithelial cells. By binding zinc and other trace metals, CP will inhibit the growth of, or even kill, microbes and cells in culture [
4]. CP is increased in stools from patients with organic diseases in the GI tract [
5], and the levels reflect the disease activity in IBD, for which reason fecal CP determinations are used routinely in clinical medicine all over the world.
The problem that various commercial CP assay kits give different results might theoretically be solved if a common monoclonal anti-CP is used, but other sources of variation must also be considered. In particular, the structure of CP in stools is different from that in the standard so that the methods do not comply with the requirements of immunoassays. Estimates of CP in stools are also dependent upon the extraction yield, which may vary from 20 to about 60 per cent, but such values are seldom given in commercial kits. Fecal CP did not bind to any of eight different monoclonal antibodies against the CP subunit S100A8 suggesting that it may be lost during passage of CP through the GI tract (Fagerhol, unpublished). By consequence, falsely low concentrations will be obtained if the standard (purified or recombinant CP) contains the subunit S100A8 in contrast to fecal CP, and the antibodies bind to both S100A8 and S100A9. We, therefore, prepared anti-S100A9 monoclonals for use in such assays.
We decided to study fecal CP by use of chromatographic methods, and to develop new ELISA procedures that will detect CP in different molecular configurations. Furthermore, we developed an efficient and simple fecal extraction buffer, and the first fecal CP standard that gave consistent results after storage at 5C for four months.
Most CP immunoassays are of the sandwich type ELISA that requires the presence of at least two antigenic epitopes on the protein. Falsely low estimates will be found if the protein is altered or present in complexes so that fewer or only one epitope is available. We were able to solve this problem by taking advantage of the strong binding of CP to the plastic in some microplates; this led to a new method that we have called FELISA, based on the direct binding of standards and fecal CP to wells.
We have established a series of Hybrid ELISA methods (named HELISA), where antibodies against chromatin components are used for coating of wells; after incubation with samples, enzyme labelled anti-CP is used for development. In this way, we found that most of the fecal CP subfractions contain chromatin components.
By generation of a series of new anti-S100A9 monoclonals, we could show that immunoassays will not give correct results unless the antibodies react with all subfractions.
While NET formation is a vital antimicrobial defense system, it has been shown that NETs may also be pathogenic by inducing platelet aggregation [
6], causing tissue damage by blocking the microcirculation [
7] and contribute to establishment of cancer metastases [
8]. Furthermore, CP bound to the chromatin may be harmful by depriving cells of vital trace metals such as Zn and Mn. Our HELISAs provide new tools for studies on NET generation and turnover during GI disease, including the pathogenic effects of excessive concentrations of CP.
2. Materials and Methods
Stool samples were collected from 156 children, age six to 14 years, with abdominal symptoms. The fecal CP test results would be important for further diagnostic procedures, especially endoscopy, as well as determination of IBD disease activity and adjustment of treatment. Patients were included serially independent of diagnosis or other factors. Samples were frozen at −22 °C for up to 12 months before thawing and extraction according to the kit insert of the CalproLab commercial kit (Calpro AS,1366 Lysaker, Norway), or by use of a novel stool extraction procedure developed for the FELISA method. To prevent microbial growth, 0.2% ProClin 300 (Sigma Aldrich, St. Louis, MO, USA) was added to all buffers.
2.1. Antibodies
Ten new anti-CP monoclonals were generated by immunization of mice (ProMab Corp, Richmond, CA, USA) with recombinant S100A9 rather than CP to avoid production of anti-S100A8.
A group of five balb/c mice were immunized with S100A9 protein over the course of 8–10 weeks. Bleeds were drawn following the third injection and sera samples were tested in ELISA for antibody titers. The mouse with the best titer was sacrificed and its spleen cells were fused with SP2/0 myeloma cells to generate hybridomas. Hybridomas were cultured in ten 96-well plates and supernatants were screened by ELISA. The top ten clones were further evaluated in desired applications. The top clones were selected and subcloned by limiting dilution to generate monoclonal hybridoma cell lines. The purified antibody was generated from these hybridoma cell lines via ascites production and purification by protein G.
2.2. ELISA Methods
Three new assays for CP were developed:
(1) A sandwich type called the MiMo ELISA, where a mixture of highly selected monoclonals were used for coating and HRP-conjugates of the same for development. Wells were coated with 50 µL MiMo at five µg/mL in 0.1 M sodium citrate pH 6 for two hours at RT or at 5 °C several days. Wells were washed three times with TBS with 0.05% Tween-20. Standards (recombinant CP) and samples were diluted in washing buffer added 1% BSA, 5 mM calcium chloride, and 20 µM zinc chloride pH 7.5 (sample dilution buffer). A total of 50 µL of standards and samples were incubated with shaking for 40 min at RT followed by washing and incubation again for 40 min with 50 µL of HRP-anti-MiMo diluted 1:80,000 in the same buffer. After a final wash, 100 µL tetramethylbenzidine (Abcam, Cambridge, UK) was added to the wells and read after 20–30 min.
(2) A method called FELISA was established, where samples and standards are added to wells without any catching antibody, taking advantage of the property of CP to bind strongly to the plastic surface of wells. Since other proteins may also bind to the plastic, the stool extraction buffer should not contain BSA or other proteins. Standards, consisting of recombinant S100A9 and extracts are diluted in TBS with 5 mM EDTA. A total of 50 µL of samples and standards were incubated at RT for 40 min in MaxiSorp microplates from Nunc, Denmark. After washing, wells were blocked by incubation with 150 µL TBS with 1% BSA at RT for 15 min. After washing again, wells were added 50 µL of HRP-MiMo properly diluted in TBS with 1% BSA and incubated at RT for 30 min. After a final washing, 100 µL tetramethylbenzidine substrate was added to the wells and read after 20–30 min.
(3) A competitive S100A9 ELISA was developed where wells are coated with recombinant S100A9, 5 µg/mL in TBS, for one hour at RT or at 5 °C for several days. Standards and samples are diluted in the sample dilution buffer and incubated at RT for 30 min. After washing, wells are incubated with properly diluted HRP-anti-S100A9 at RT for 30 min, followed by washing and, finally, adding 100 µL of substrate. Plates were read after 20–30 min.
2.3. Chromatography
Anion exchange chromatography was run on a 1.5 by 4 cm column with Q Sepharose Fast Flow from Cytiva, Sweden. Running buffer: TBS with 5 mM EDTA diluted 1:4 in distilled water. Flow rate: 1 mL per minute. A volume of 1 mL fecal extracts was diluted to 5 mL in running buffer before application on the column. After washing the column with 15 mL of running buffer, elution was performed by passing through a stepwise gradient of sodium chloride from 100 to 2000 mM in running buffer. In some instances, 4000 mM salt was used finally, or the 2000 mM buffer added an equal volume of 1M sodium citrate adjusted to pH 3. Flow rate was kept at 1 mL per min. Fractions of one to two ml were collected and tested.
Size exclusion chromatography was performed using a HiLoad 26/600 Superdex 200 column from Cytiva, Sweden; flow rate: 50 microliters per min; fraction volumes were two ml. Running buffer: TBS with 5 mM EDTA pH 7.5.
2.4. Fecal Extraction
A new fecal extraction procedure was established for the FELISA method: 5 mg stool samples are extracted with 1.5 mL TBS, pH 5 with 5 mM EDTA using an extraction device from ScheBo-Biotech AG, Germany. After addition of the samples, tubes were vortexed for 30 s, left at RT for 5 min and vortexed again and centrifuged at 1000× g for 10 min. Before assays, the extracts were further diluted 1:1000 in the same buffer. Standards and samples should not contain high concentrations of proteins, e.g., albumin, since they may compete with CP for binding to the plastic in the wells.
3. Results
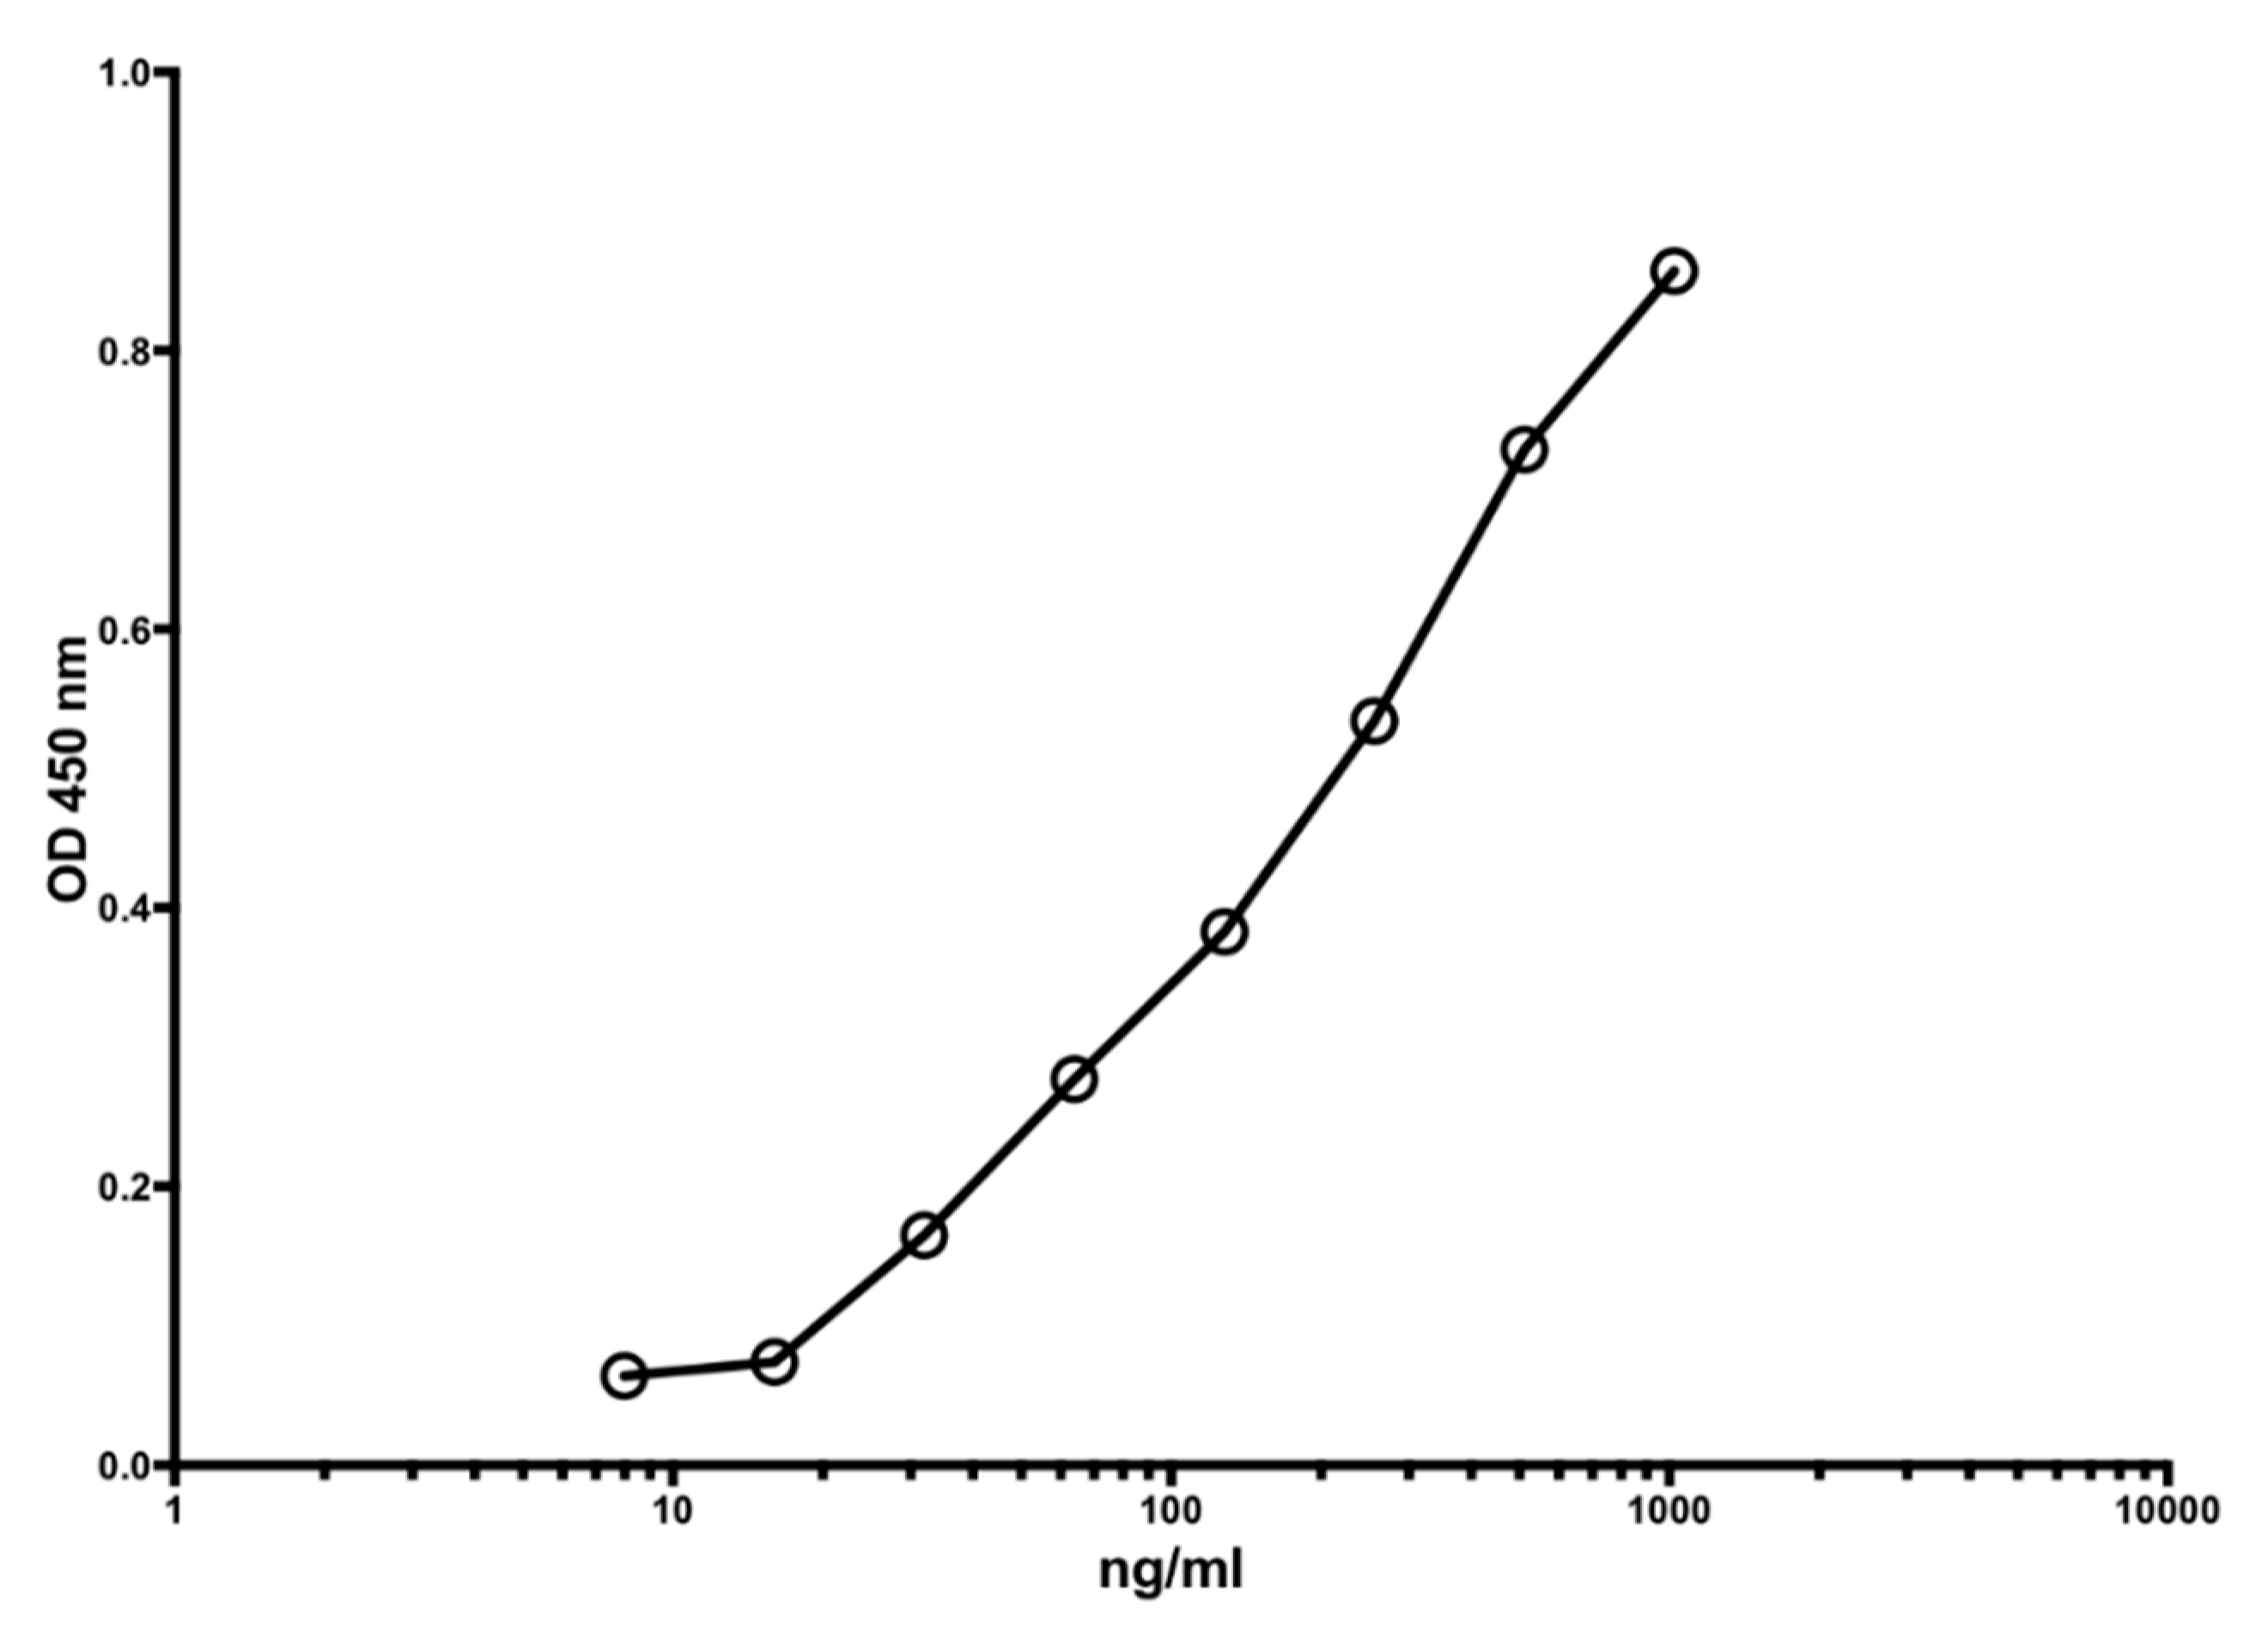
Figure 1 shows a typical standard curve of the MiMo ELISA. The assay range is from 5 to 1000 ng/mL, and the mean CV is about 5%. In
Figure 2 is shown the standard curve of the FELISA. The assay range is from 10 to 2000 ng/mL. The mean coefficient of variation when testing fecal extracts was about 2% even by manual pipetting.
Figure 3 shows the standard curve for the competitive S100A9 ELISA. The assay range was 10 to 5000 ng/mL, and the CV between 0.5 and 9.2 per cent.
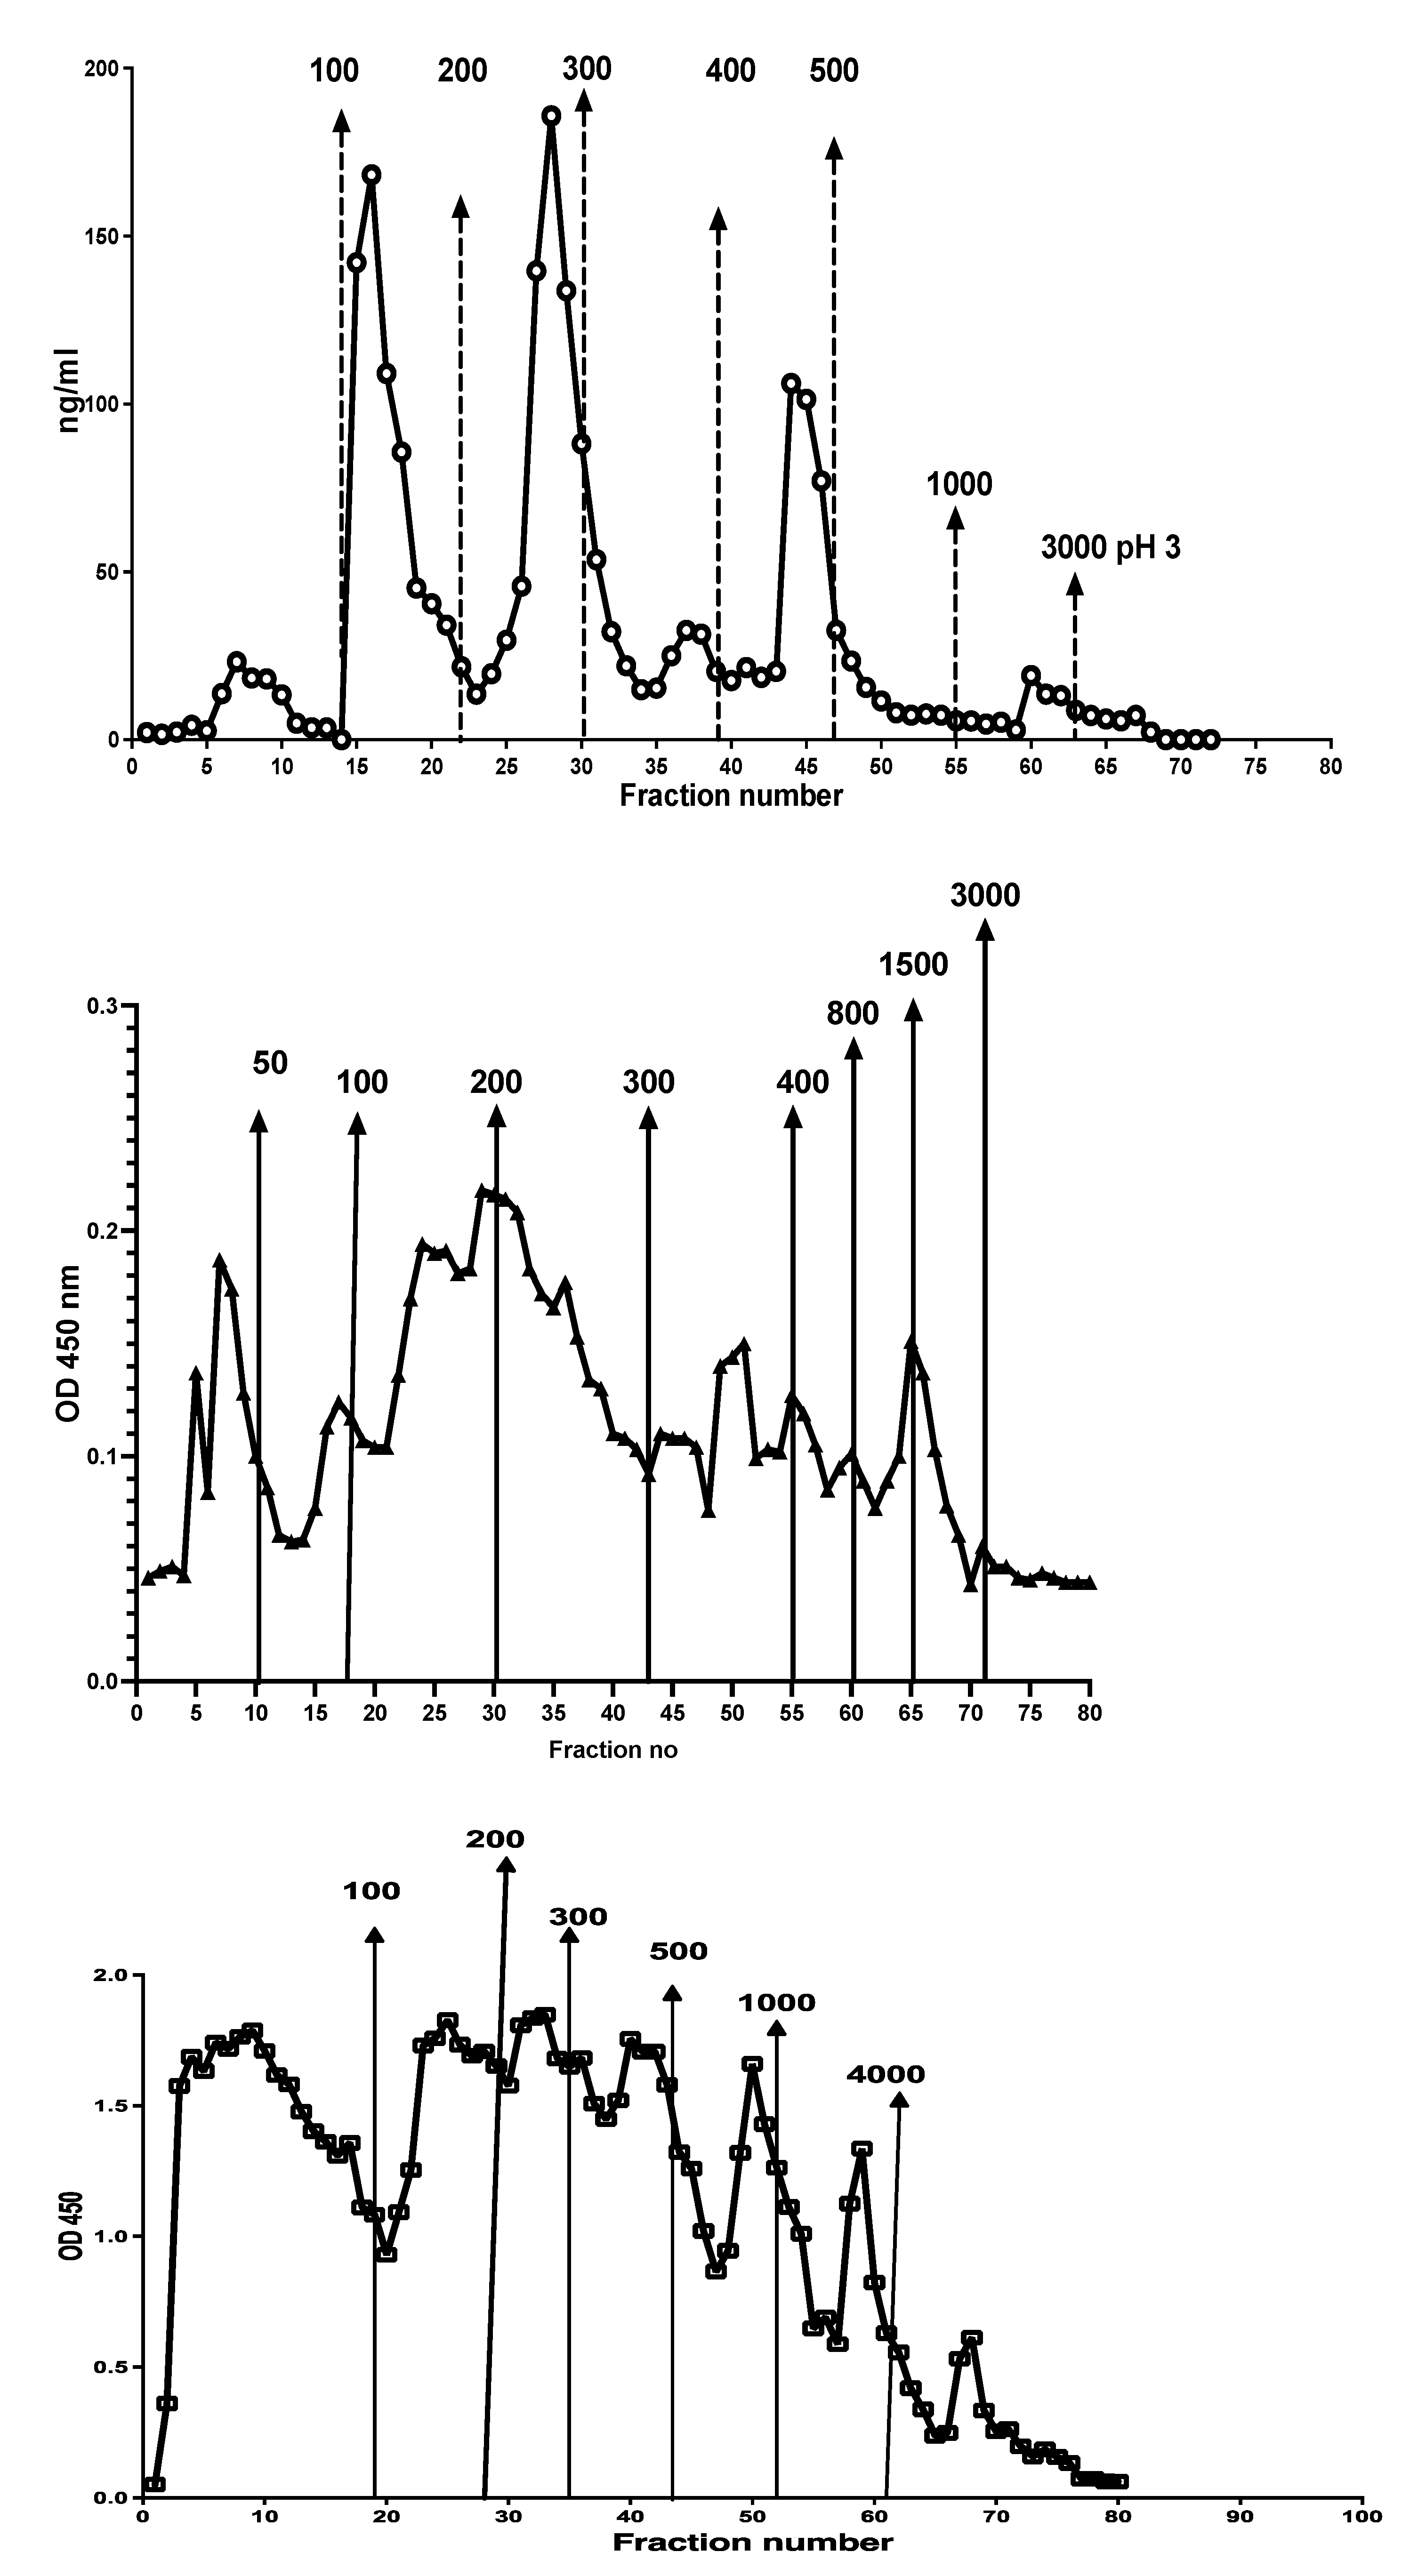
Figure 4 shows the peaks obtained when an IBD patient stool extract, prepared by use of a CalproLab kit, was run on the Q-sepharose chromatographic column. The fractions were run on a CalproLab ELISA kit and on the MiMo ELISA. Up to ten fractions, differing in net negative electric charge, were eluted from the column, and most of them reacted much stronger with the MiMo ELISA than the CalproLab kit, suggesting that the antibodies in the latter do not detect properly fecal CP in all fractions.
In
Figure 5 is shown the reactivity of different monoclonals against Q sepharose chromatographic fractions. Clearly, no single monoclonal properly detected all CP subfractions.
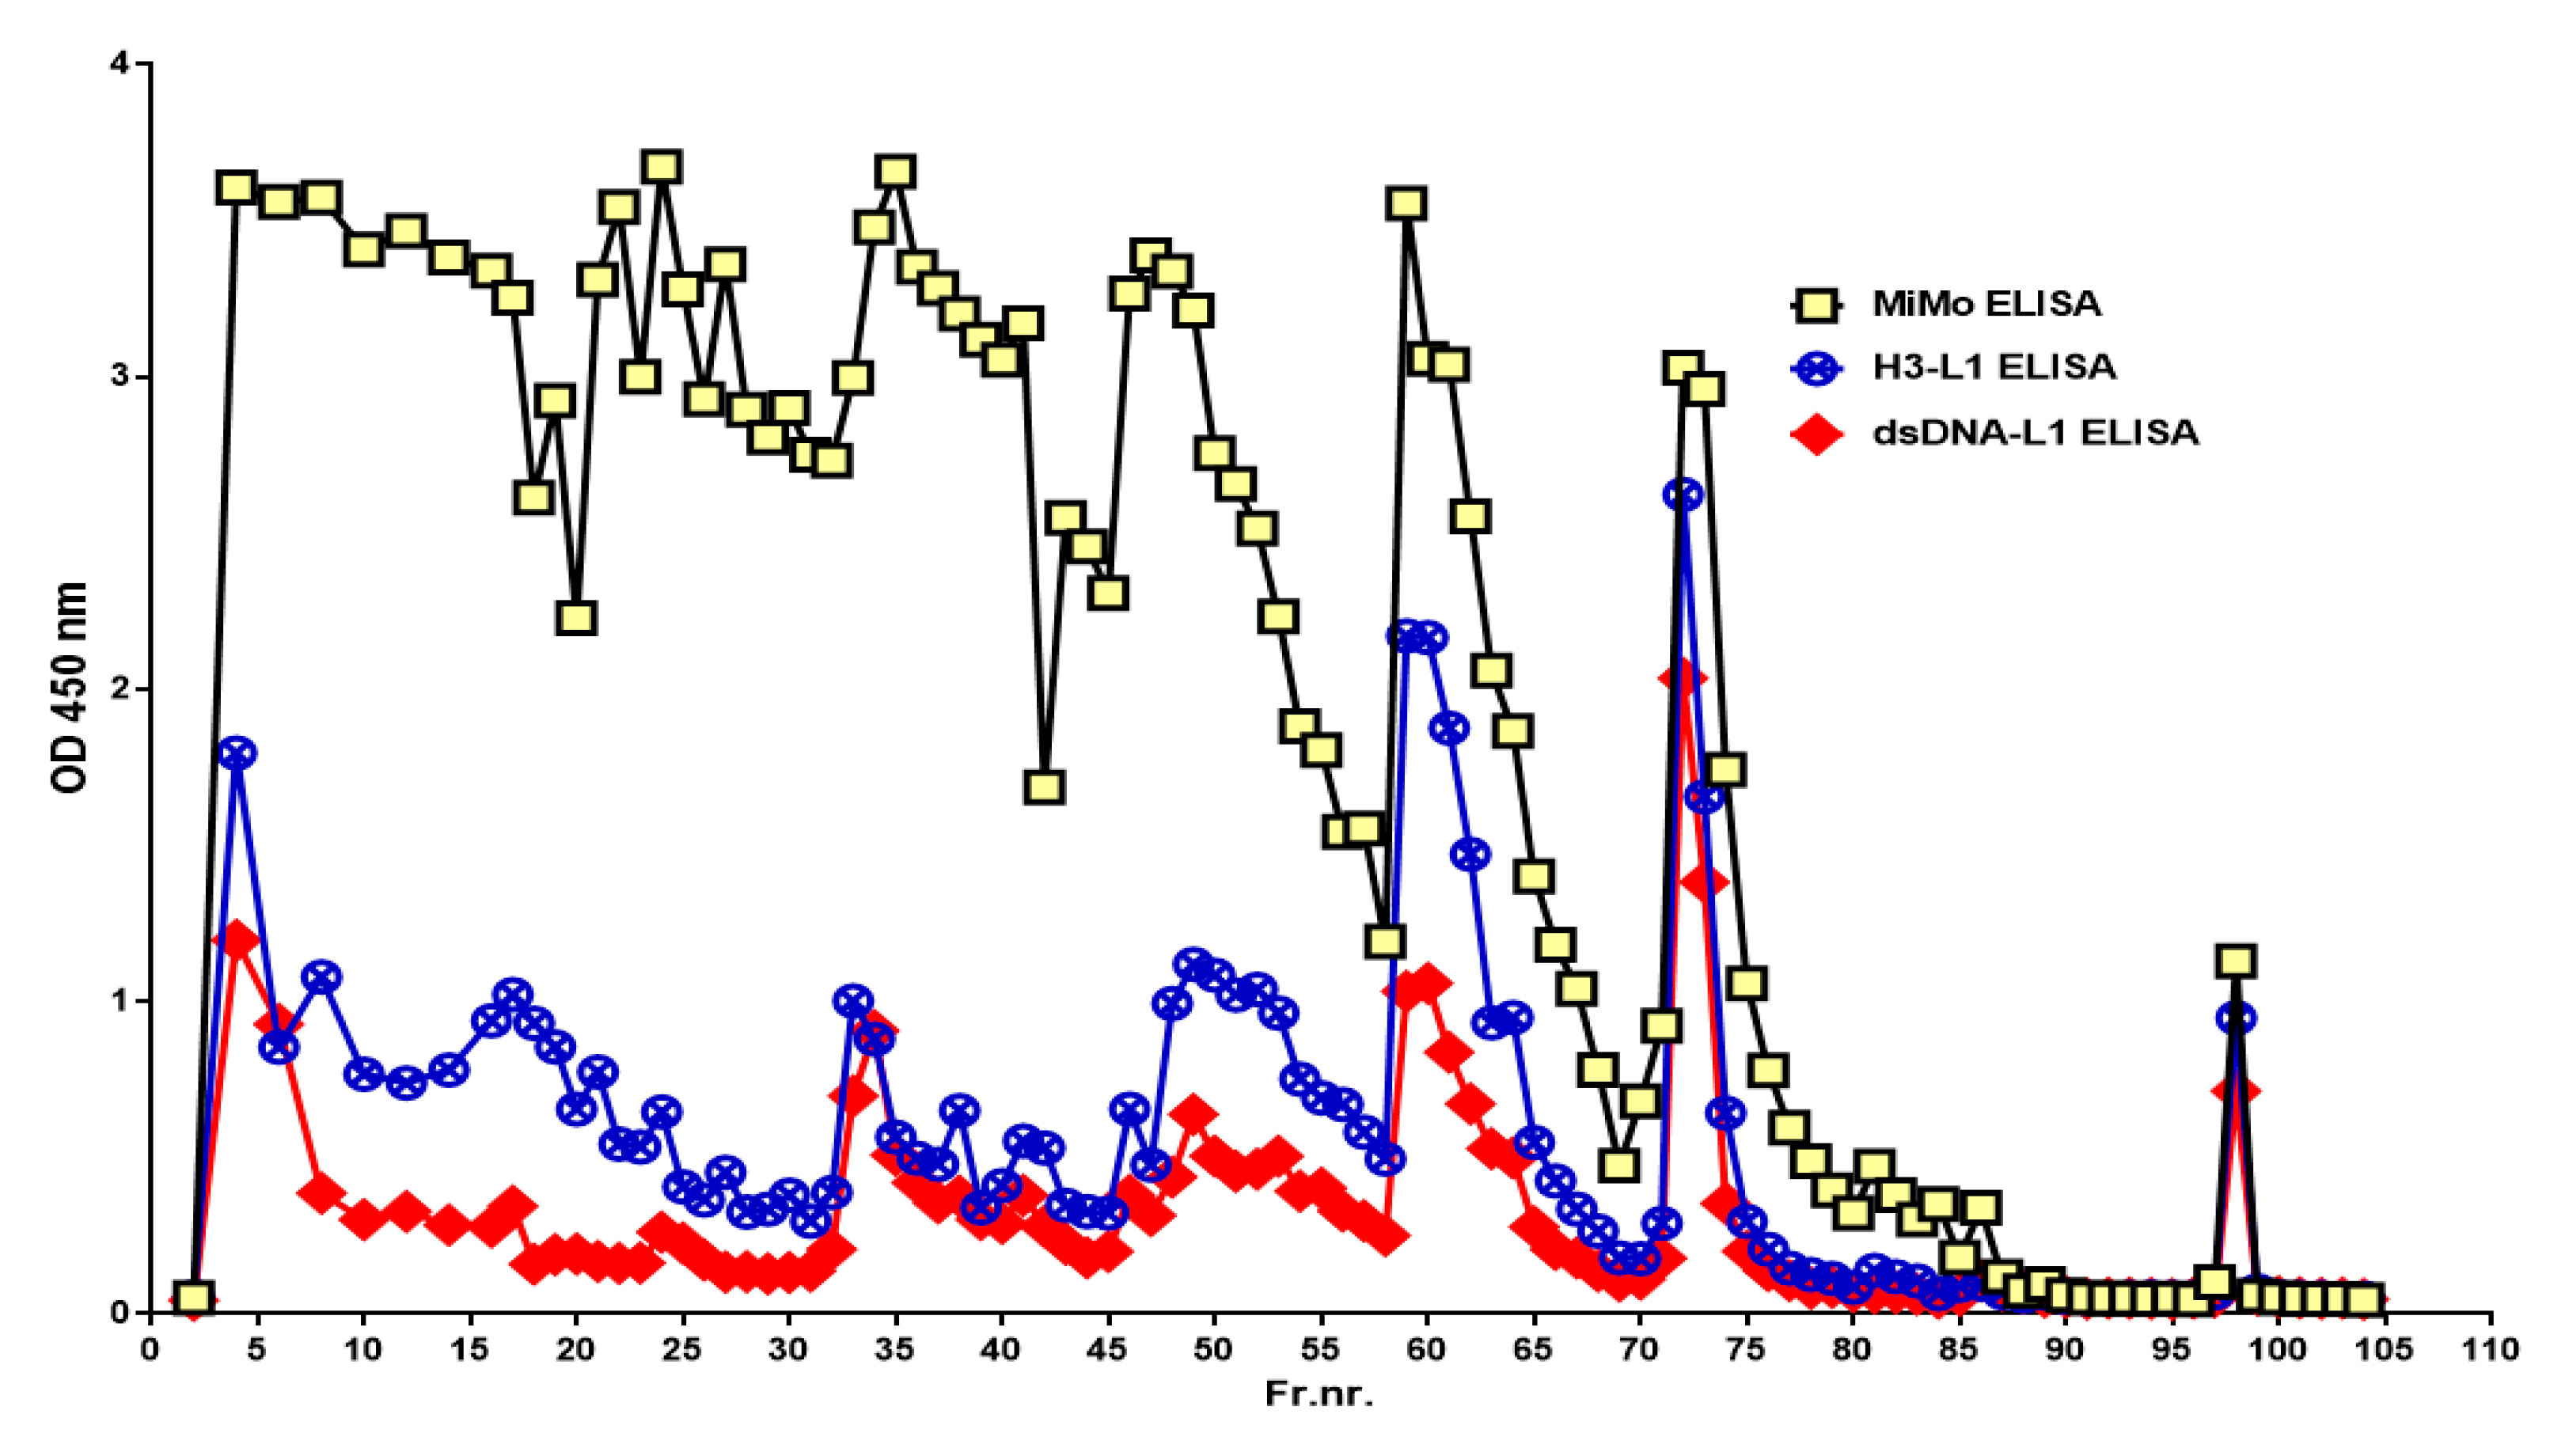
When the chromatographic fractions were tested on the HELISA, reactivity was detected in nearly all fractions when anti-Histone 3 or anti-dsDNA was used for coating and HRP conjugated anti-CP for development, see
Figure 6. Similar patterns were obtained when anti-Histone 4 or anti-ssDNA were used for coating, but the fractions eluted with 50-, 300-, and 500-mM sodium chloride contained relatively more histone than DNA (data not shown). The histone and DNA HELISA values followed the CP peaks.
Different chromatographic patterns were found when extracts from different patients were run on the column as shown in
Figure 7. The number of fractions and their relative CP contents varied between samples.
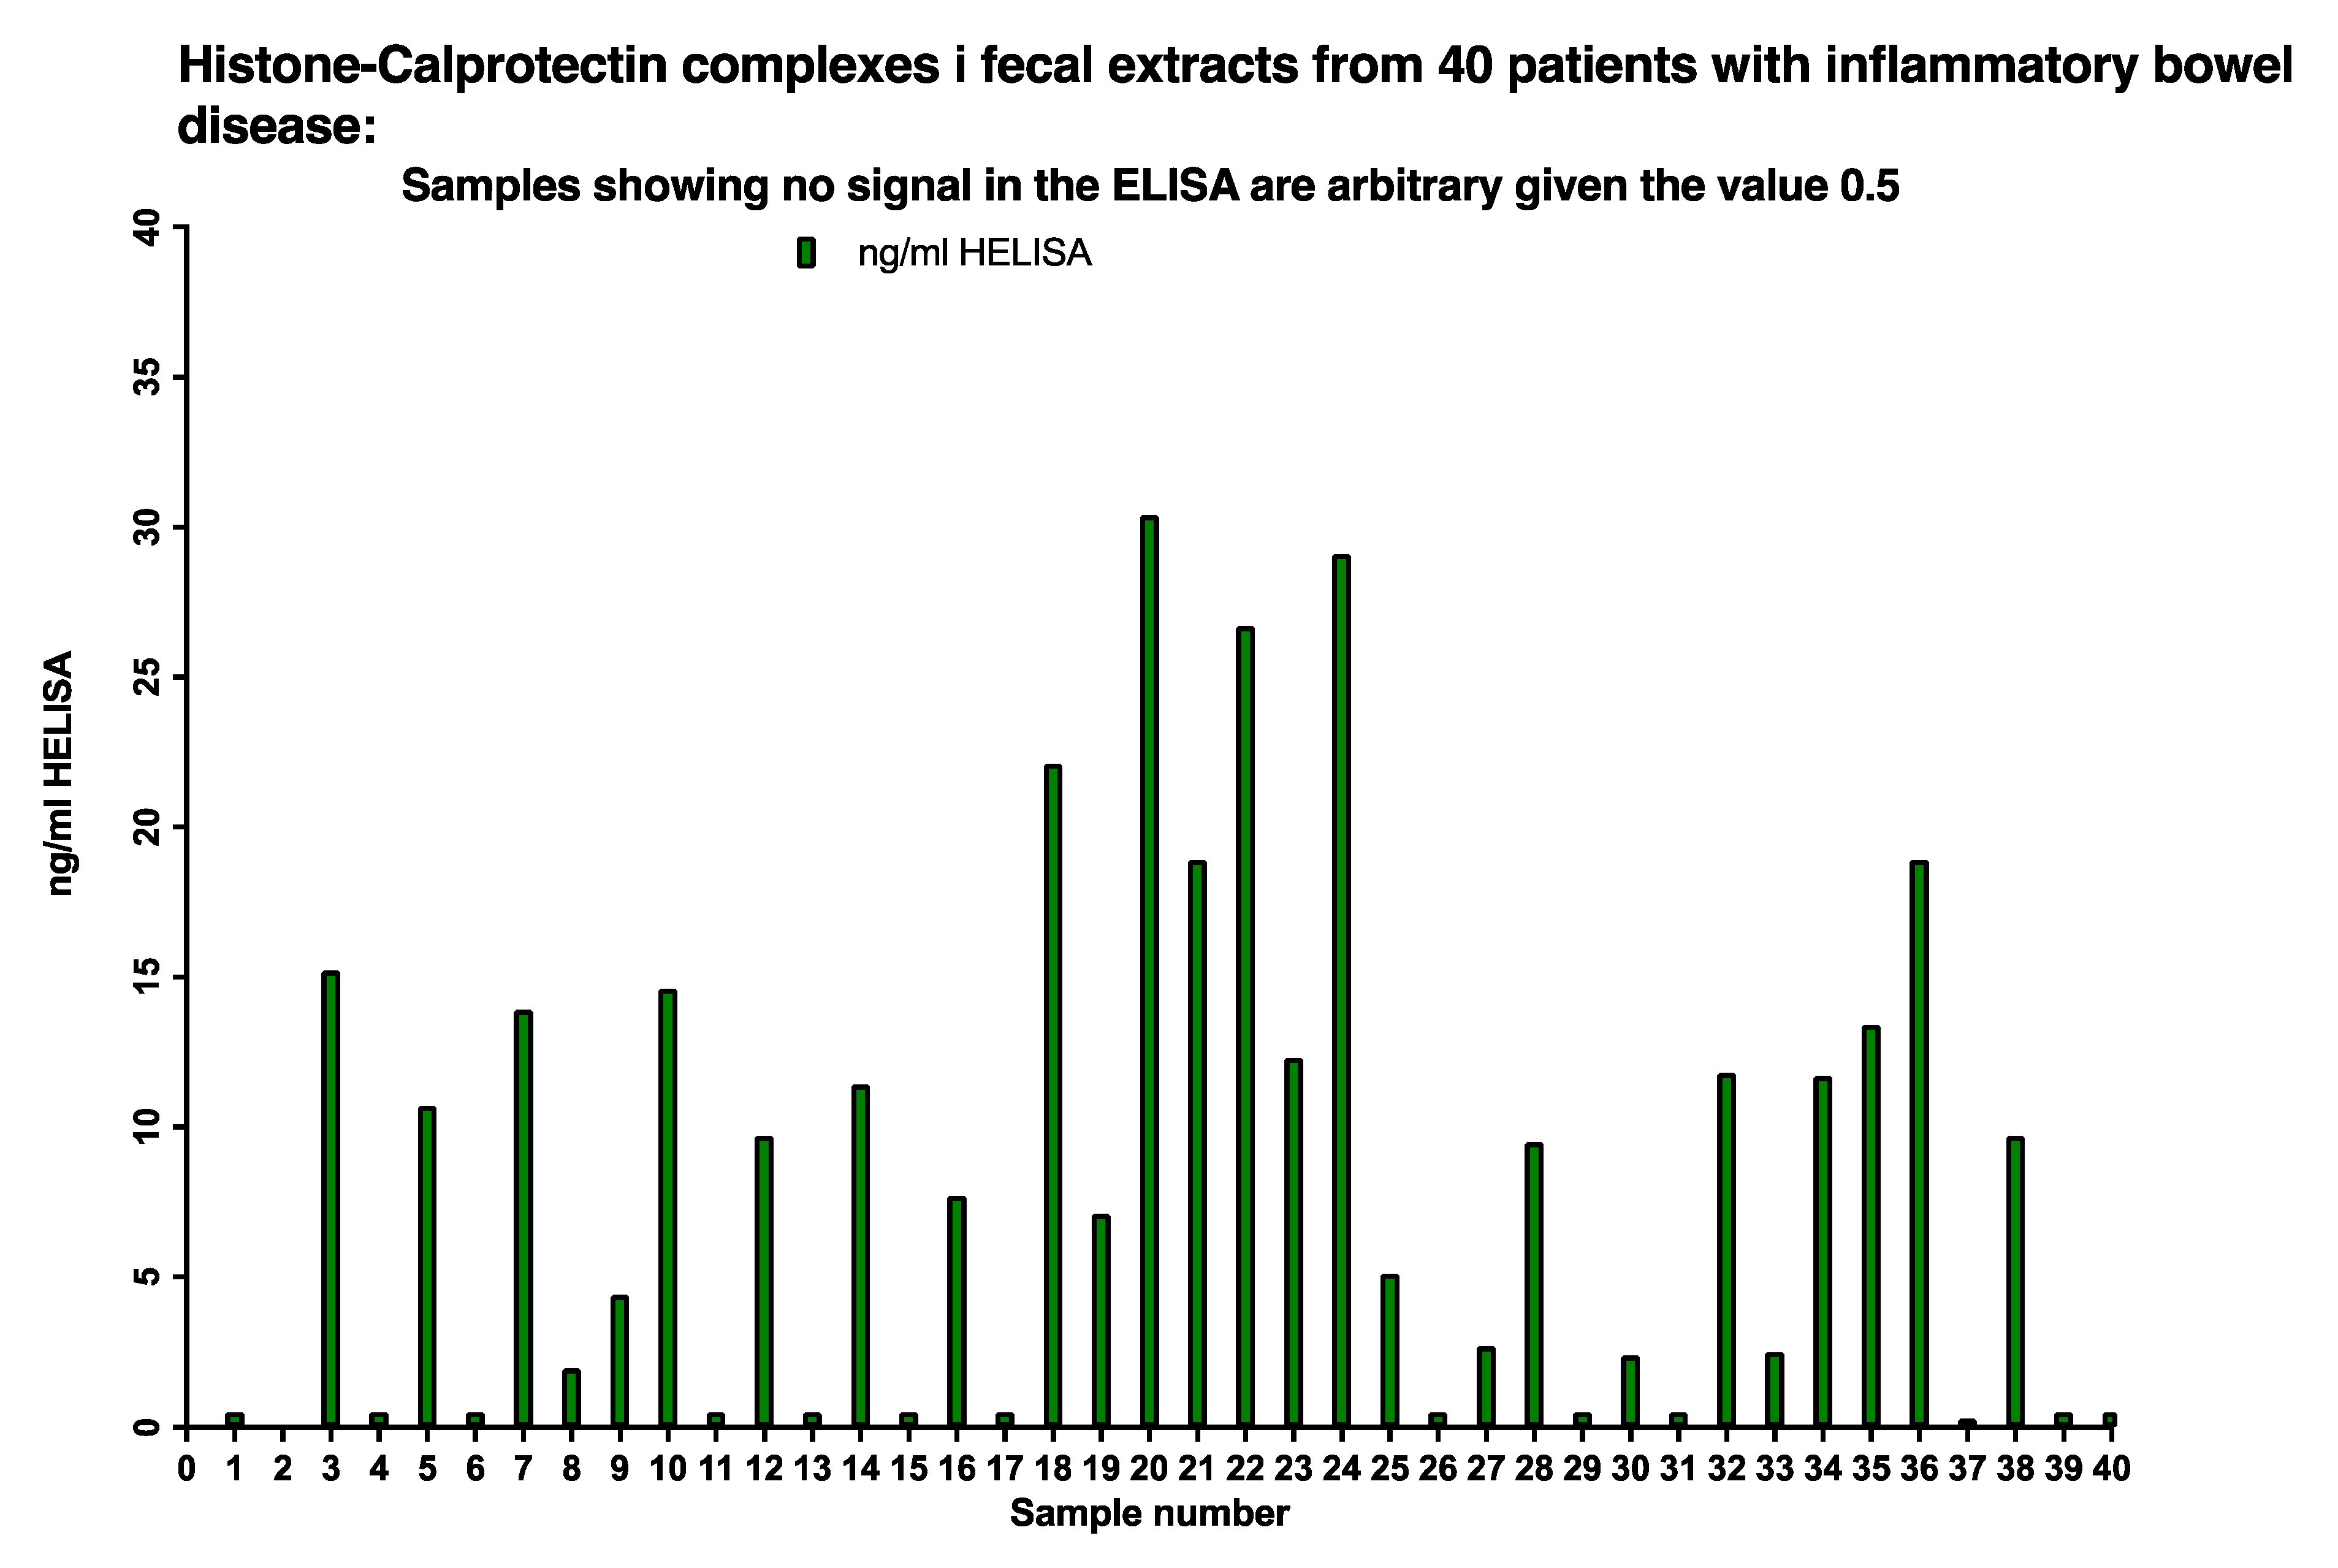
The presence of histone 3/CP complexes (NETs) in stool samples was determined by the HELISA in 40 sequentially included pediatric patients, see
Figure 8. Twenty-six out of 40, i.e., 65 per cent of the patients, had HELISA values between 150 and 1500 ng/mL after correction for the dilution of the faecal extract; the remaining samples gave values below 0.5 ng/mL.
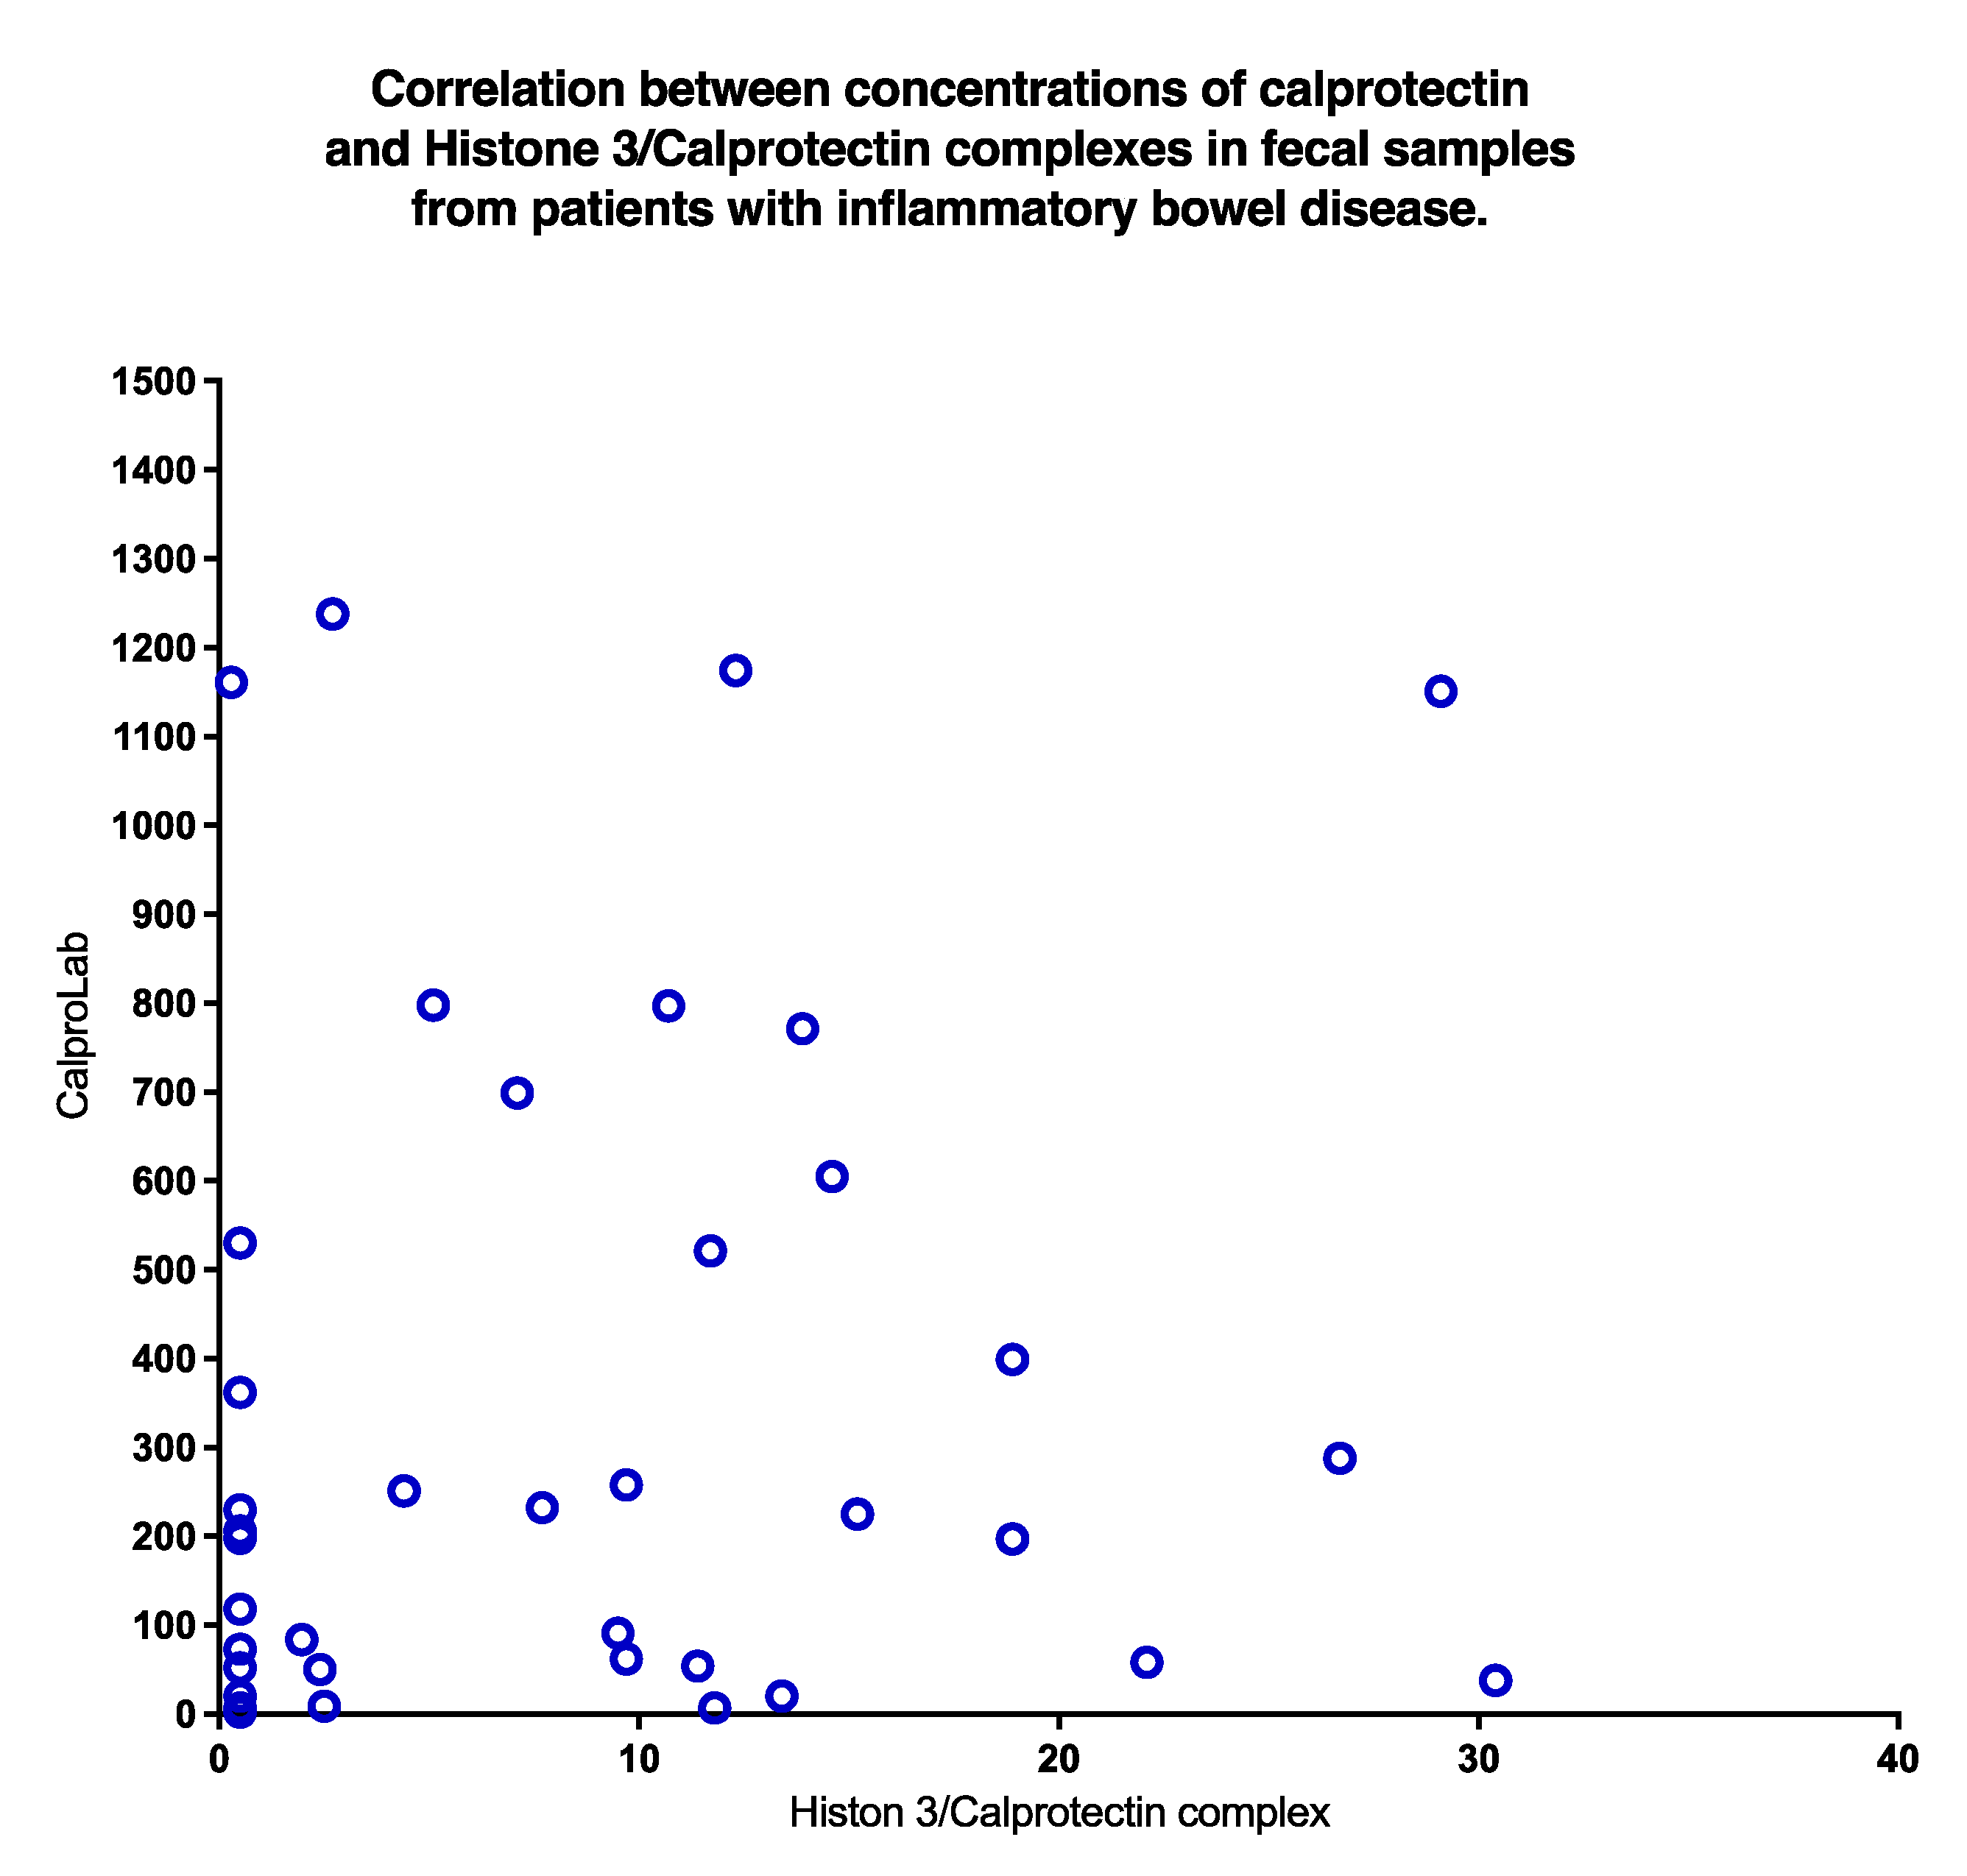
A poor correlation (
p = 0.31) was found between CP and HELISA values, as shown in
Figure 9. Clearly, normal CP may be found even if HELISA levels are high, and vice versa.
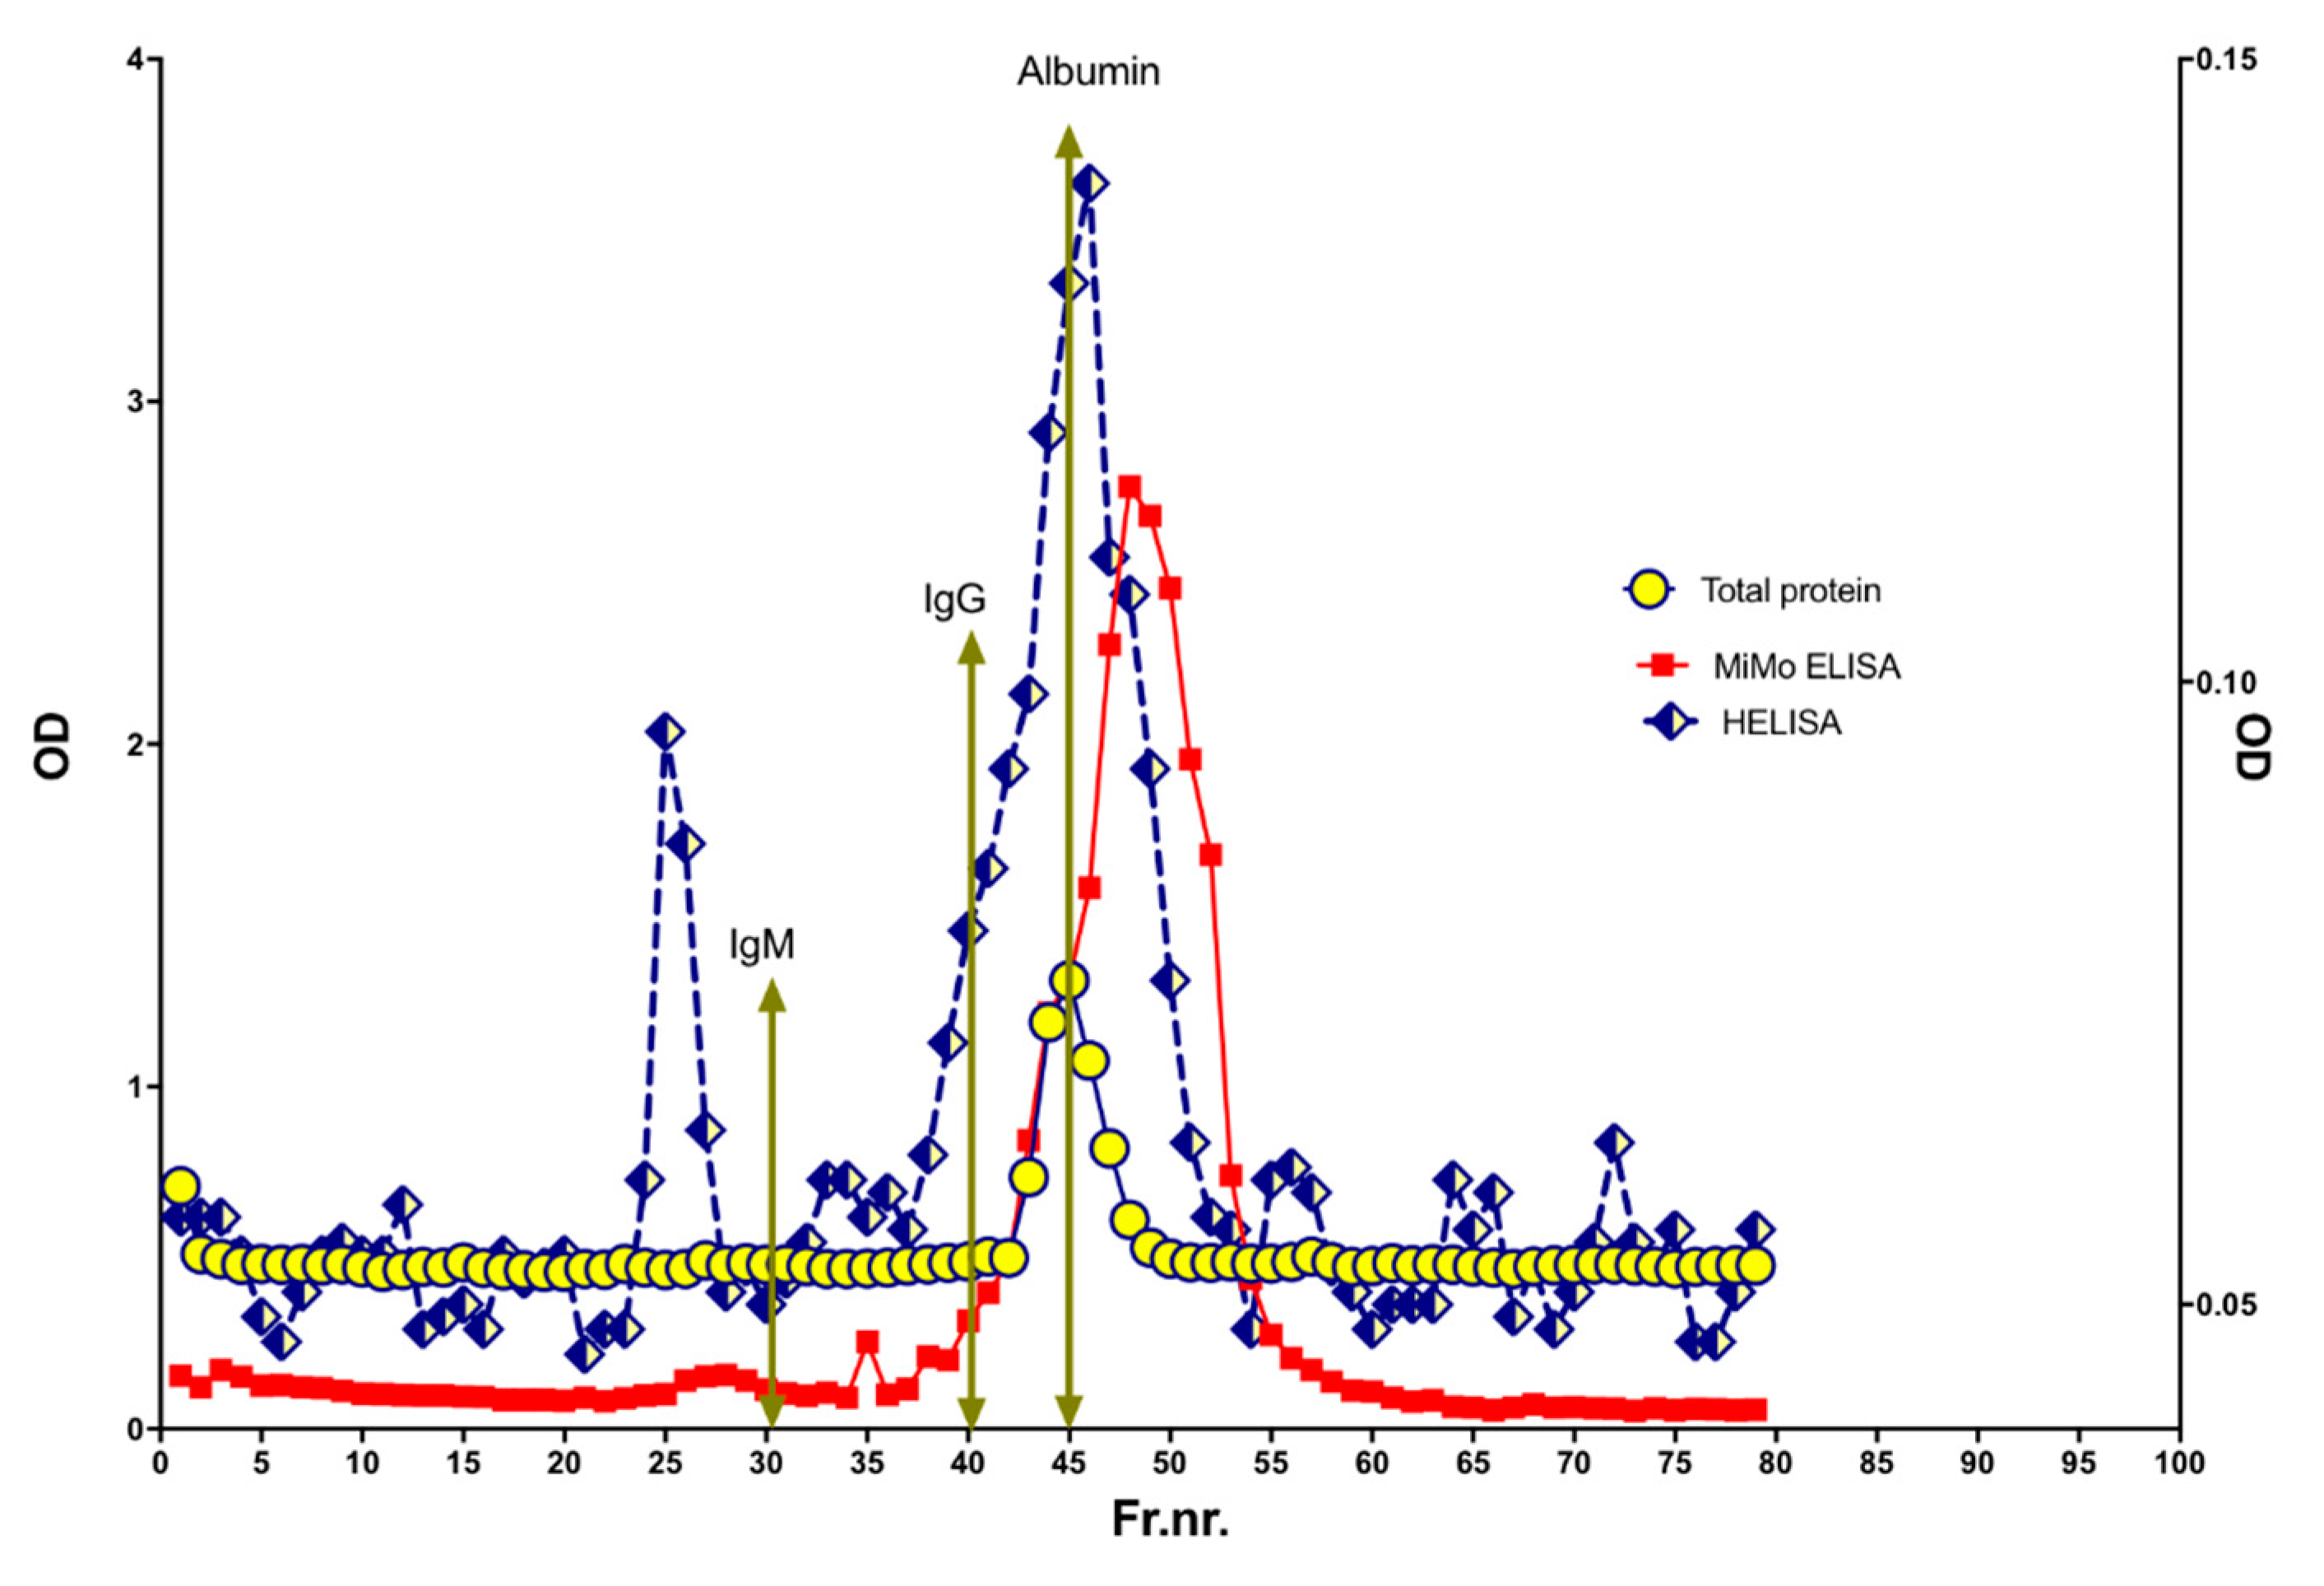
To look for variation in molecular size, a HELISA positive fecal extract was run on a size exclusion chromatography column, see
Figure 10. HELISA reactivity was found in a major peak corresponding to MW from 100 to 200 kDa. In addition, two peaks were eluted at apparent MW larger than 3000 kDa and about 400 kDa, respectively. Finally, four peaks were found in the 10 to two kDa range. The MiMo ELISA showed a peak for CP corresponding to a MW of about 36 kDa. The wide MW distribution of HELISA reactivity may suggest that stool samples contain CP, NETs, and degradation products thereof.
The precision of the FELISA was checked by running triplicates of 20 stool samples, selected to include low, medium, and high concentrations, and diluted in TBS with or without EDTA. The mean CV% was about 7.0 for the latter, but only 2.0 for former.
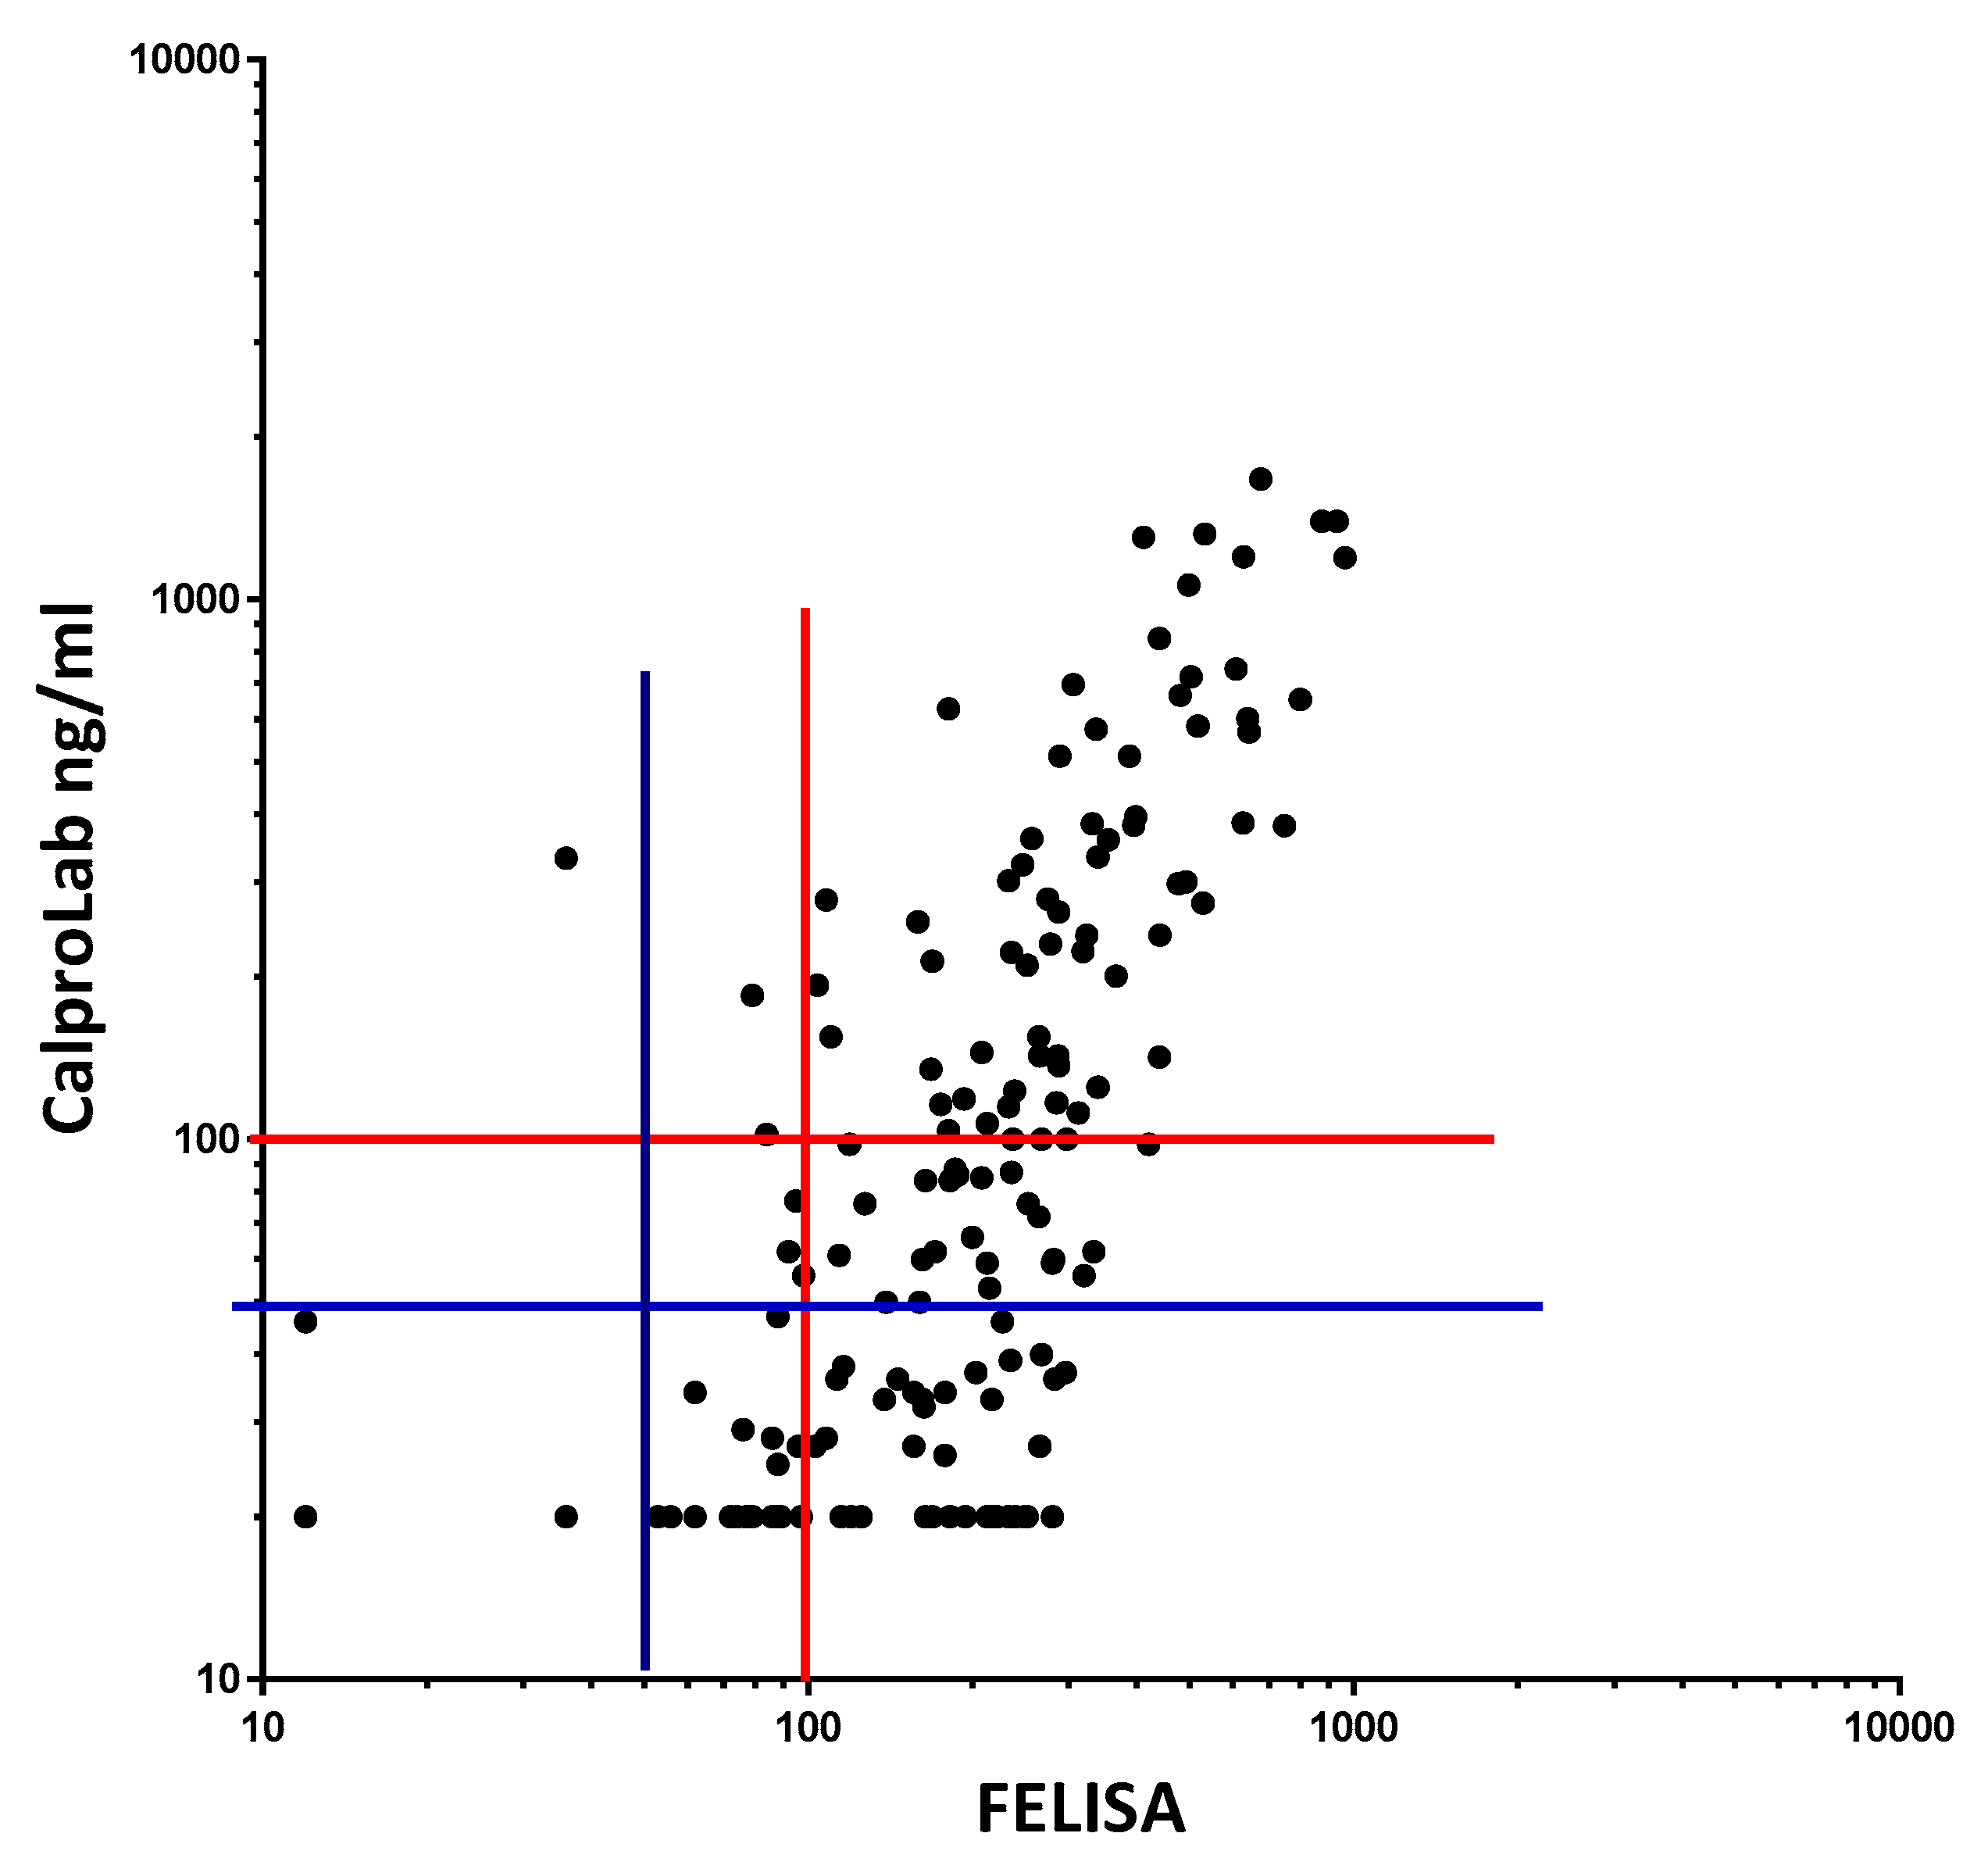
To compare the commonly used CalproLab kit with the new, simpler, and quicker FELISA, 155 samples from the pediatric patients were tested on each method (
Figure 11). A correlation coefficient of 0.7012 was found, with a
p-value of 0.0001. A linear regression analysis gave the equation Y = 1.353 × X – 129.5, suggesting a higher analytical sensitivity for the FELISA. Whether a cut-off value of 50 or 100 ng/mL is used, the CalproLab method gave many falsely normal values despite elevated FELISA results.
A major problem with CP immunoassays is the great difference in the structure of CP in the standard and samples. To check the possibility that fecal CP might be used as a standard, fractions 2 to 80 from the Q sepharose experiments, shown in
Figure 3, were mixed and dialysed against TBS with 0.2% ProClin 300 (SigmaAldrich, USA) before testing on the MiMo ELISA. The concentration of CP in the fecal CP standard was determined by the MiMo ELISA with recombinant CP as standard.
Figure 12 shows the standard curve obtained when singlets of the fecal CP standard were tested. The method may give an assay range between 20 and 3000 ng/mL. The values did not change during storage of the fecal CP standard at 5 °C for four months. Clearly, further studies are needed to determine the performance of ELISA methods where such a fecal CP standard is used on relevant clinical materials.
The yield of the new procedure using TBS with EDTA, pH 5 as extraction buffer was about 90%, i.e., very little additional CP was extracted if the sediment after centrifugation was extracted again with 1.5 mL buffer (data not shown).
4. Discussion
We have shown that fecal CP is very heterogeneous, comprising complexes with chromatin components suggestive of generation of NETs in the gut. The latter must be expected when large numbers of neutrophils enter the gut and meet the microbial flora. Although determinations of fecal CP have been very useful in clinical medicine, problems have been encountered, some of which can be explained and solved by the advances presented here. In particular, it is now possible to document that antibodies intended to be used in commercial kits can detect all fecal CP subfractions. The discussion of whether polyclonal or monoclonal antibodies are better suited can now be put aside. Focus should rather be on the sensitivity of tests, defining cut-off levels, and ability to detect non-IBD organic GI disease. We have shown that the sensitivity of fecal CP tests can be improved significantly by use of the FELISA, or the competitive ELISA presented here and thereby make sure that GI cancers are not overlooked. Early studies [
5] showed that about 90% clinical cancers and about 50% of non-symptomatic CRP had elevated fecal CP [
8]. Also, about 50% of adenoma/polyp patients had elevated fecal CP, but the high proportion of false positives, i.e., low specificity of tests, discouraged their use in screening for cancer. It is, however, certainly not satisfactory for patients that their CRC will not be detected because clinicians do not scope those with falsely low results from a low sensitivity method for fecal CP. It is regrettable that methods used today, for instance the Phadia EliA CP method, from Thermo Fisher Scientific, Germany, has only been validated as an aid in the clinical diagnosis of IBD. This may be partly due to their lower sensitivity in the cut-off range. The efficiency of all methods for detection of non-IBD organic diseases including colorectal cancer should be evaluated, taking advantage of the high yield of the new extraction procedure and by use of the FELISA with a remarkably low CV reported here.
The HELISA method allows assessment of NETs in stool samples. This gives new possibilities for studies on the pathogenesis of IBD where the role of NETs is getting increased attention. These structures have been found in the gut wall of IBD patients [
8], and they are capable of inducing platelet aggregation [
6] and blocking of the microcirculation [
7] resulting in tissue damage.
The induction of pathology by NETs has attracted increasing interest, and published data show that NETs can induce lung injury during influenza virus infection [
9] and contribute to metastases in cancer [
10].
CP has been shown to kill cells in culture; in fact, no cell type has yet been found capable of resisting this effect of CP, which can be prevented by the addition of Zn and Mn. The CP effect does not require close contact between NETs and cells, rather the trace metal ions will diffuse relatively long distances and bind to CP. The concentration of these trace elements in the tissues may drop below levels critical for cell function and survival. Fecal CP concentrations above 1000 mg/kg are often found in active IBD, which is about 200 times the molar concentration of zinc in plasma and tissue fluid. This gives a rationale for trying Zn and Mn as dietary supplements.
The FELISA and competitive ELISA presented here can detect also NET fractions and CP complexes where only one epitope is available for binding to antibodies; they should be validated for clinical use. They give higher sensitivity, particularly in the lower concentration range where reliable results around the cut-off level is important for selecting patients for endoscopy. Many more samples must be run on ion exchange chromatography to see whether the subfraction patterns are related to certain diagnoses; patterns or subfractions of particular interest may, perhaps, be identified by certain antibodies. In this context, the extraction yield may be important: CP containing complexes may also vary with regards to solubility.
Microbes produce DNA degrading enzymes that may protect them from NETs [
11], so it is reasonable to assume that human and/or microbial DNases may be important for the heterogeneity found in fecal CP. Our finding that some extracts contain very few NET/CP complexes despite high CP levels may have such an explanation and reflect a bowel flora rich in DNase producing microorganisms. Degradation of NETs may even be responsible for reduced CP concentrations if stools are stored improperly. Addition of EDTA may inhibit DNases that are dependent upon trace metals like magnesium, and this may improve storage properties and stool handling [
12].
Author Contributions
J.R. provided clinical data and samples for analysis. M.K.F. performed the analyses. Both authors contributed to the analysis and interpretation of the data. The contribution by discussions and advice from Geir Hetland, Department of Immunology and Transfusion Medicine, Oslo University Hospital, Ullevaal is greatly appreciated. All authors have read and agreed to the published version of the manuscript.
Funding
This research received no external funding.
Institutional Review Board Statement
The study was approved by The Institutional Review Board at Ullevål University Hospital, approval number 2012/21432. The study was conducted according to the guidelines of the declaration of Helsinki.
Informed Consent Statement
Not applicable; the fecal material was gained from routinely taken material in the clinic and the diagnosis, but not the patient identification, was made available for the study.
Data Availability Statement
Not applicable.
Conflicts of Interest
The authors declare no conflict of interest.
References
- Fagerhol, M.K.; Dale, I.; Andersson, T. Release and quantitation of a leucocyte derived protein (L1). Scand. J. Haeamatol. 1980, 24, 393–398. [Google Scholar] [CrossRef]
- Steinbakk, M.; Naess-Andresen, C.F.; Fagerhol, M.K.; Lingaas, E.; Dale, I.; Brandtzaeg, P. Antimicrobial actions of calcium binding leucocyte L1 protein, calprotectin. Lancet 1990, 336, 763–765. [Google Scholar] [CrossRef]
- Johne, B.; Fagerhol, M.K.; Lyberg, T.; Prydz, H.; Brandtzaeg, P.; Naess-Andresen, C.F.; Dale, I. Functional and clinical aspects of the myelomonocytic protein calprotectin. Mol. Pathol. 1997, 50, 113–123. [Google Scholar] [CrossRef] [PubMed] [Green Version]
- Yui, S.; Nakatani, Y.; Mikami, M. Calprotectin (S100A8/S100A9), an inflammatory protein complex from neutrophils with a broad apoptosis-inducing activity. Biol. Pharm. Bull. 2003, 26, 53–60. [Google Scholar] [CrossRef] [PubMed] [Green Version]
- Røseth, A.G.; Fagerhol, M.K.; Aadland, E.; Schjønsby, H. Assessment of the neutrophil dominating protein calprotectin in feces: A methodologic study. Scand. J. Gastroenterol. 1992, 27, 793–798. [Google Scholar] [CrossRef] [PubMed]
- Belter, K.; Wartha, F.; Albiger, B.; Normark, S.; Zychlinsky, A.; Henriques-Normark, B. An endonuclease allows Streptococcus pneumoniae to escape from Neutrophil Extracellular Traps. Curr. Biol. 2006, 16, 401–407. [Google Scholar]
- Boneschansker, L.; Inoue, Y.; Oklu, R.; Irinia, D. Capillary plexuses are vulnerable to Neutrophil Extracellular Traps. Integr. Biol. 2016, 8, 149–155. [Google Scholar] [CrossRef] [PubMed] [Green Version]
- Park, J.; Wysocki, R.W.; Amoozgar, Z.; Maiorina, L.; Fein, M.R.; Jorns, J.; Schott, A.F.; Kinugasa-Katayama, Y.; Lee, Y.; Won, N.H.; et al. Cancer cells induce metastasis-supporting neutrophil extracellular DNA. Sci. Transl. Med. 2016, 8, 361ra138. [Google Scholar] [CrossRef] [PubMed] [Green Version]
- Bennike, T.B.; Carlsen, T.G.; Ellingsen, T.; Bonderup, O.K.; Glerup, H.; Bøgsted, M.; Christiansen, G.; Birkelund, S.; Stensballe, A.; Andersen, V. Neutrophil Extracellular Traps in ulcerative colitis: A proteome analysis of intestinal biopsies. Inflamm. Bowel Dis. 2015, 21, 2052–2067. [Google Scholar] [CrossRef] [PubMed] [Green Version]
- Kristinsson, J.; Nygaard, K.; Aadland, E.; Barstad, S.; Sauar, J.; Hofstad, B.; Stray, N.; Stallemo, A.; Haug, B.; Ugstad, M.; et al. Screening of first degree relatives of patients operated for colorectal cancer. Evaluation of fecal calprotectin vs. Hemoccult II. Digestion 2001, 64, 104–110. [Google Scholar] [CrossRef] [PubMed]
- Narasaraju, T.; Yang, E.; Samy, R.P.; Ng, H.H.; Poh, W.P.; Liew, A.A.; Phoon, M.C.; van Rooijen, N.; Chow, V.T. Excessive neutrophils and Neutrophil Extracellular Traps contribute to acute lung injury of influenza pneumonitis. Am. J. Pathol. 2011, 179, 199–210. [Google Scholar] [CrossRef] [PubMed]
- Palmer, L.J.; Chapple, I.L.C.; Wright, H.J.; Roberts, A.; Cooper, P.R. Extracellular deoxyribonuclease production by periodontal bacteria. J. Periodont. Res. 2012, 47, 439–445. [Google Scholar] [CrossRef] [PubMed]
Figure 1.
A typical standard curve for the MiMo sandwich ELISA. Both coating and HRP conjugate were MiMo. Incubation periods: 40 min with samples; 30 min with conjugate and 30 min with substrate. Normally, the assay range is 5 to 1000 ng/mL; CV values for duplicate standards were between 0.1 and 11.9. They are mainly affected by pipetting imprecision. Standard: recombinant calprotectin in TBS with 2 mM calcium chloride. CV for standards were between 0.1 and 11.9.
Figure 2.
Typical standard curve for the FELISA. A total of 50 µL standard and samples diluted in TBS with 5 mM EDTA was added to the wells and shaken at RT for 20 min. After washing, HRP anti-MiMo diluted 1:80,000 in assay buffer was added, and plates were shaken at RT for 30 min. After washing again, 100 microliters of tetramethylbenzidine were added and the plate read after 40 min. The FELISA has an assay range between 20 and 2000 ng/mL and a mean CV for standards of about 1.2% when they are dissolved in TBS with 5 mM EDTA.
Figure 3.
This shows the standard curve for the competitive ELISA. The plate was coated with S100A9 at 5 µg/mL in TBS with 5 mM EDTA pH 7.4, 50 µL per well, overnight at 5C. After washing, 50 µL standard or diluted samples was added to the wells, shaken at RT for 40 min, and washed again. Then, 50 µL HRP-MiMo diluted 1:80,000 was added, left for 20 min at RT, and washed again before adding substrate, and reading at 450 nm after 15 min. CVs were from 1.9 to 4.1.
Figure 4.
This is a chromatogram from running a fecal extract on the Q-sepharose anion exchange column. Some of the CP did not bind to the column and passed directly through or was washed out with the running buffer. At least five fractions eluted with a stepwise sodium chloride gradient from 100 to 2000 mM or the latter mixed with 1 M sodium acetate pH 3.0. The commercial CalproLab ELISA gave, generally, much lower values, symbols in red/white, than the MiMo ELISA, yellow/blue symbols.
Figure 5.
The five monoclonals gave different patterns when the chromatographic fractions (shown in
Figure 3) were tested, suggesting that they bind to different and/or multiple epitopes on CP in the fractions. A mixture of monoclonals (MiMo) should be selected and used for testing of fecal samples.
Figure 6.
The chromatographic fractions (see
Figure 3) contain complexes between CP and chromatin components histone and DNA, suggesting that the stool sample contained intact and partially degraded NETs.
Figure 6.
The chromatographic fractions (see
Figure 3) contain complexes between CP and chromatin components histone and DNA, suggesting that the stool sample contained intact and partially degraded NETs.
Figure 7.
Stool extracts from different patients gave many different CP containing chromatographic patterns, perhaps reflecting degradation of NETs exposed to different concentrations of DNases or microbial endonucleases. Possible relation to diagnosis and disease activity remains to be studied.
Figure 7.
Stool extracts from different patients gave many different CP containing chromatographic patterns, perhaps reflecting degradation of NETs exposed to different concentrations of DNases or microbial endonucleases. Possible relation to diagnosis and disease activity remains to be studied.
Figure 8.
About 65% of IBD patients had between <5 to 30 ng/mL NETs in their stools as evidenced by running a HELISA with anti-histone 3 for capture and anti-calprotectin on top.
Figure 8.
About 65% of IBD patients had between <5 to 30 ng/mL NETs in their stools as evidenced by running a HELISA with anti-histone 3 for capture and anti-calprotectin on top.
Figure 9.
A plot of concentrations of CP and NETs in stools from IBD patients shows a non-significant correlation. High values of CP occurred despite low levels of NETs and vice versa.
Figure 9.
A plot of concentrations of CP and NETs in stools from IBD patients shows a non-significant correlation. High values of CP occurred despite low levels of NETs and vice versa.
Figure 10.
The molecular sizes of CP and NETs in stools were determined by size exclusion chromatography on a HiLoad 26/600 Superdex 200 column. The expected elution volumes of IgM, IgG, and albumin are indicated by arrows. Most of the NET signals were found in fractions corresponding to MW higher and lower than normal CP, suggesting that very little of the fecal CP has a normal structure.
Figure 11.
Fecal extracts from IBD patients gave roughly similar values on a commercial CP and on the FELISA, but the former gave lower values, particularly in the low concentration region. The correlation equation is Y = 1.353*X − 129.5, which means that the FELISA has a higher analytical sensitivity, particularly at and below commonly used cut-off levels. Most samples giving normal values (below cut-off levels at 50 or 100 mg/kg) by the CalproLab method had increased levels by the FELISA assay.
Figure 12.
This shows the standard curve obtained when testing a fecal CP standard prepared by mixing of anion exchange chromatographic fractions 2 to 80, shown in
Figure 3. Most of the salt was removed by dialysis and 0.1% Proclin 300 was added to prevent microbial growth. An assay range of 15 to 1000 ng/mL can be obtained.
| Publisher’s Note: MDPI stays neutral with regard to jurisdictional claims in published maps and institutional affiliations. |
© 2022 by the authors. Licensee MDPI, Basel, Switzerland. This article is an open access article distributed under the terms and conditions of the Creative Commons Attribution (CC BY) license (https://creativecommons.org/licenses/by/4.0/).


