1. Introduction
Digital transformation has fundamentally reshaped the media landscape, positioning the Internet as the primary source of information for audiences worldwide. Digital journalism has played a pivotal role in this process. From the early days of the World Wide Web, news content became one of the key drivers behind users’ migration online, with many seeking rapid access to current events (
Pew Research Center, 1996). In recent years, however, a notable and threatening trend has emerged for websites as a traditional format of digital media: users’ attention is shifting increasingly toward social media platforms, which are becoming dominant sources of news consumption. While this process is global, the pace and scope of change vary significantly by region. For instance, 54% of users in the United States report at least occasional use of social networks for news (
Pew Research Center, 2024) compared to 42.9% in Japan (
Borile, 2024) and 37% in the European Union (
European Parliament, 2023). Despite relatively limited digital infrastructure and lower average levels of technological literacy (
EU4Digital, 2021;
Digital State UA, 2025), Ukraine is significantly outpacing these more developed regions. As of 2024, 84% of Ukrainian users access news through social media or messaging apps, primarily Telegram and Viber (
Troyan, 2024). Another trend where Ukraine leads is the predominance of smartphones in news consumption: 90% of Ukrainians use smartphones to access news content (
Troyan, 2024), while in the U.S., for comparison, all digital devices combined (including smartphones, laptops, and tablets) account for only 86% of news access (
Pew Research Center, 2024). The ongoing war in Ukraine has likely accelerated these shifts: the need for constant and immediate access to reliable information has acted as a catalyst, speeding up the transformation of the Ukrainian media environment and accelerating the decline of traditional digital media websites. Ukraine’s rapid adaptation to global technological change is potentially representative for identifying scenarios for the development of media consumption in other countries.
In the early stages of digital journalism—distinguished by its distribution of editorial content via the Internet (
Richard, 2022)—interactivity was championed by scholars as a defining innovation, promising that audiences could shift from passive readers to co-creators through various forms of engagement with media content (
Chung, 2008;
Kenney et al., 2000). Interactive features—ranging from user feedback and direct communication with editorial teams to personalized news delivery—were seen as tools of media democratization (
Schultz, 2006). These capabilities were expected to foster public dialogue, deepen audience engagement, and strengthen user loyalty. In today’s context, where digital media websites are facing increasing challenges—including audience and platform fragmentation, declining referral traffic, shrinking revenues, and falling trust (
Newman, 2023)—the question of the transformative potential of interactivity is once again gaining relevance. Empirical studies on interactivity in digital journalism have largely focused on the extent to which these features are implemented in practice. The findings have often been “discouraging” (
Chung, 2008), pointing to the limited use of interactive functionalities and a predominantly superficial or formalistic approach by editorial teams (
Stroud et al., 2015;
Schultz, 2006). However, as
Kenney et al. (
2000) insightfully noted, the essence of interactivity is not to fill websites with all possible interactive features, but in their actual use by the audience.
Solvoll and Larsson (
2020) echo this view, critiquing the assumption that audience engagement “will increase almost automatically” simply through the provision of interactive tools. These insights shift the central research question from the availability or technical quality of interactive features to a more fundamental concern: Is the audience of digital media genuinely interested in using them?
This study aims to expand the understanding of interactivity by examining the perspectives, expectations, and needs of digital media consumers with regard to interactive functionalities. Focusing on the Ukrainian digital audience offers unique analytical value—given the country’s accelerated adoption of mobile technologies and social media as dominant news sources, Ukraine presents a compelling case that not only highlights local specificities but may also foreshadow broader global trends in the evolution of digital journalism.
2. Theoretical Background
Audience research has always played a pivotal role in shaping the mass media landscape. With the emergence of digital technologies and the growing influence of the Internet, scholarly attention has increasingly shifted toward understanding online audiences: their needs, expectations, engagement levels, and patterns of interaction with digital media content. As
Thulin (
2022) observes, one of the most common analytical errors is treating the audience as a homogeneous entity, when in reality it comprises individuals with diverse motivations, experiences, and levels of digital literacy. A methodological breakthrough in the field was introduced by
Li (
2007), who proposed the concept of “social technographics.” This framework categorizes users into six distinct types based on their online activity levels: creators, critics, collectors, joiners, spectators, and inactive users. While the model has been partially superseded by technological and behavioral developments and some early predictions, such as fears of a “hysteria about social networks,” did not materialize, it laid a valuable foundation for further research. Later studies have highlighted the increasing convergence of content consumption and production, with interactivity emerging as a key mechanism that enables audiences to participate in content creation—turning the most engaged consumers into active contributors (
Agirre et al., 2016). Contemporary approaches to studying online audiences continue to embrace a user-centered perspective. In this view, interactivity is understood not solely as a set of technical affordances, but also as a subjective, experiential dimension—shaped by users’ perceptions of their capacity to simulate interpersonal communication within digital environments (
Oblak Črnič & Jontes, 2017). This broader conceptualization enables a more nuanced understanding of how interactivity functions in practice and how it contributes to audience engagement in the evolving media ecosystem.
One of the earliest empirical studies into user interaction with digital media was a 1999 survey conducted by the Pew Research Center, which revealed that the primary motivations for choosing online news over legacy media formats included the exclusivity of content, ease of access, and the availability of the search function (
Pew Research Center, 1999). In contrast, features such as embedded audio and video content or opportunities for online discussion were of considerably less interest to users at that time. These findings likely reflect the technical limitations of the era, characterized by costly, relatively slow, and uneven Internet access. As digital technologies advanced, user expectations and levels of engagement evolved. Audiences began to demand greater interactivity, particularly in the form of multimedia features and content-sharing capabilities (
Pew Research Center, 2006;
Rosentiel, 2007). Experimental research by Sundar demonstrated that multimedia elements on news websites act as powerful psychological cues that enhance content recall and engagement (
Sundar, 2000). Similarly,
Song and Zinkhan (
2008) identified the personalization of messages as the most influential factor in how interactivity is perceived by users. However, other scholars caution against an uncritical embrace of interactivity. Bucy, for instance, warns that excessive interactive features may lead to cognitive overload, resulting in confusion, frustration, and reduced information retention (
Bucy, 2003;
Bucy, 2004).
A significant contribution to this field comes from Chung, who highlighted the gap between academic interest in interactivity and the actual demand for interactive features among audiences (
Chung, 2008). Her survey found a relatively low level of interest in high-effort participatory features, such as user commentary and self-expression. Nevertheless, the study noted that certain user segments—particularly politically active and technologically proficient individuals—were more inclined to personalize their media experience and engage in online communication. More recent research has introduced the concept of interpassivity to describe the phenomenon whereby users value the availability of interactive features but prefer passive consumption over active participation (
Chen et al., 2023). Scholars have attributed this tendency to various factors, including shyness, lack of motivation, fear of self-expression (
Spyridou, 2018), or simply a disinterest in contributing to content production (
Kalogeropoulos et al., 2017;
Vanhaeght, 2018). These findings have important implications for digital media strategies: rather than prioritizing tools that encourage content creation by users, many outlets now focus on encouraging content sharing (
Solvoll & Larsson, 2020).
Studies reveal the concept of expected interactivity, suggesting that content featuring higher levels of interactivity is perceived by audiences as more comprehensible and personalized (
Montesi & Rodríguez, 2021). However, digital literacy still remains a barrier to effective engagement. Even among younger users (under 30), there is often hesitation to engage with interactive elements—many do not instinctively “touch the screen” to activate them (
Thulin, 2022). In contrast, older users tend to show interest in low-effort interactions such as expressing reactions to content or engaging in gamified features that evaluate group activity and frequency of communication (
Regalado et al., 2021).
As younger audiences shift toward mobile, en passant media consumption, social networks are gradually overtaking media websites as their primary source of news. In these environments, content is often encountered incidentally while casually browsing feeds, which reduces the likelihood of interaction with media (
Anter & Kümpel, 2023). Boczkowski characterizes such content consumption by fragmentary reading patterns, loss of hierarchy of the news, and coexistence of editorial, algorithmic, and social filtering (
Boczkowski et al., 2018). Although young people are generally interested in news, they express frustration with information overload, repetitive storylines, and poor-quality sources (
Martínez-Costa et al., 2019). Some studies suggest that younger audiences tend to prefer straightforward textual presentation over multimedia formats, noting that audio and video components often “compete with the text instead of supporting it” (
Podara et al., 2019). Younger audiences may exhibit low levels of engagement not only in content co-creation but also in news sharing, fearing that excessive sharing would clutter their online profiles (
Trilling et al., 2016;
García-Perdomo et al., 2017).
The prevailing consensus in the literature is that users are more likely to engage in low-involvement interactivity—such as liking or reposting—than in high-involvement interactivity, including commenting or contributing content (
Solvoll & Larsson, 2020). More complex interactive formats, such as 360-degree video, can increase engagement by offering immersive experiences. However, they also introduce cognitive challenges: users often become distracted by exploring the environment and find it difficult to focus on the main content (
Wang et al., 2018). Contributing factors may include low visual quality due to technical constraints, physical discomfort, or motion sickness. In the Ukrainian context, it is worth mentioning the study by
Husak (
2014). It recorded early evidence of a user demand for “instant interactivity” and the growing role of social media as a primary news source—already preferred by 42% of respondents at the time, a figure that has since doubled (
Husak, 2014). The survey highlighted user expectations for more personalized content, quicker access to information, and a variety of formats for presenting information.
Thus, the theoretical framework of this study builds on prior research in several ways. It conceptualizes the online media audience as heterogeneous, differentiated by socio-demographic characteristics, behavioral patterns in social networks, and levels of media literacy (
Li, 2007;
Thulin, 2022). Interactivity is understood both as a set of technical affordances and as a dimension shaped by users’ perceptions of communication with media (
Oblak Črnič & Jontes, 2017). Furthermore, the framework incorporates distinctions between high- and low-effort participation (
Chung, 2008;
Solvoll & Larsson, 2020), which account for the predominance of minimal or pragmatic engagement. These theoretical perspectives provide the basis for addressing the gap between scholarly expectations and the actual patterns of audience engagement observed in Ukrainian digital media.
3. Objectives and Methodology
While academic literature generally agrees that digital media audiences are participants in the communication process, it also highlights that their engagement often tends to favor low-effort forms of interaction. Building on this premise, the present study focuses on Ukrainian digital media audiences to investigate user attitudes toward specific interactive features, the motivations behind their usage, and the degree to which audience expectations align with the actual implementation of interactive capabilities in digital media. In line with this objective, the study addresses the following research questions:
RQ1: How do Ukrainian digital media users evaluate the interactive features available on media websites?
RQ2: Is there a correlation between users’ age and their attitudes toward interactivity in digital media?
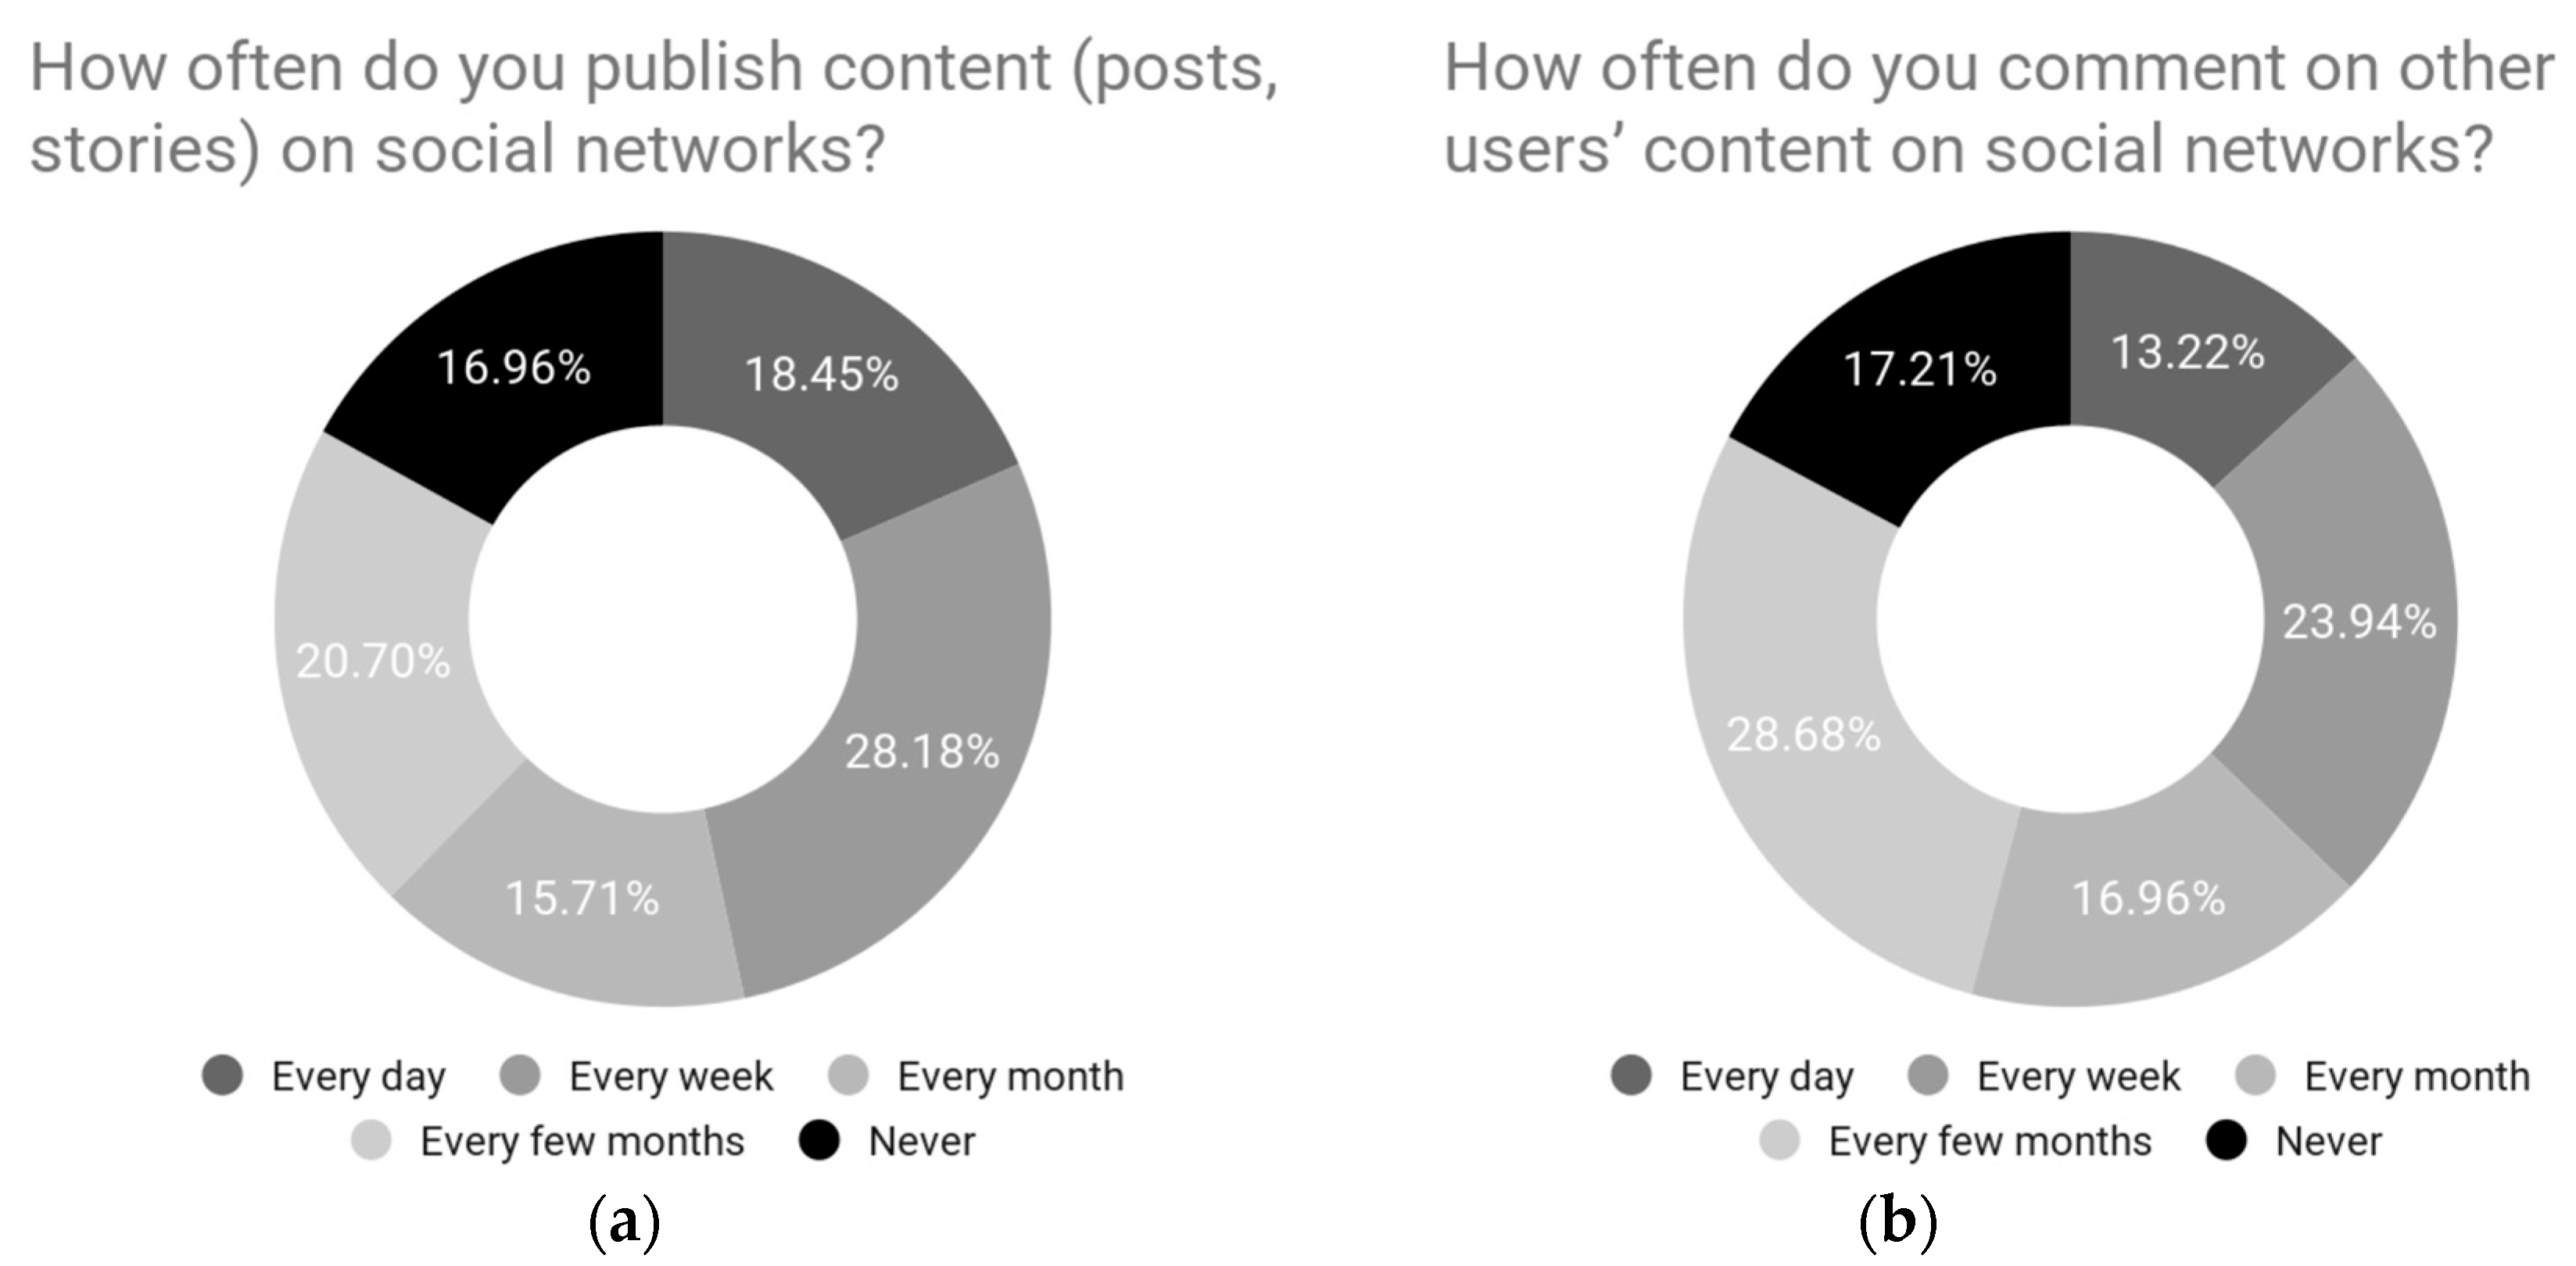
RQ3: How do behavioral patterns on social networks influence users’ attitudes toward interactivity in digital media?
RQ4: How do audience expectations regarding interactive capabilities correspond to their actual implementation in Ukrainian digital media?
To answer these questions, an online survey was conducted using Google Forms. The questionnaire link was distributed via banner advertisements on social media platforms (posted on behalf of a page affiliated with the Educational and Scientific Institute of Journalism) and on the websites of the ten most popular Ukrainian digital media outlets, as ranked by Similarweb. The advertisements were targeted at male and female users aged 18 and older. The fieldwork was carried out from 21 February to 7 April 2025. During this period, the ad link received a total of 1795 clicks. Participation in the survey was voluntary, and the respondents completed the questionnaire independently.
To determine the minimum required sample size, the study applied a standard method used in sociological and communication research for large populations under simple random sampling conditions (
Babbie, 2013). Assuming a 95% confidence level, maximum population variability, and a 5% margin of error, the resulting recommended sample size was 384 respondents, ensuring statistical representativeness.
The survey collected 403 responses, of which 401 were considered valid and included in the final analysis. While the primary objective was to assess the overall attitudes of Ukrainian digital media users toward interactivity, the study also explored age-related differences (RQ2). However, obtaining statistically significant conclusions for each of the age segments requires a wider stratified sample, so the findings related to age groups should be considered exploratory and may serve as a basis for hypothesis generation in future research. Data analysis was conducted using the open-source statistical software JASP 0.19.3. Descriptive statistics and correlation analysis were employed, with results presented in the form of tables and figures.
The questionnaire consisted of 19 items (Q1 … Q19), grouped into four thematic blocks aligned with the logic of the study and specific research questions: (1) general media consumption patterns, (2) patterns of activity on social networks, (3) attitudes toward interactivity in digital media, and (4) socio-demographic characteristics. The complete questionnaire is provided in the
Supplementary Materials. The content of the questionnaire was based on a previously developed typology of interactive features (
Zagorulko, 2024a), which systematized the main forms of interactivity present in digital media at the time of the study. To enhance the validity of the responses in the section addressing interactive content, each interactive feature was accompanied by a brief definition. Furthermore, in order to minimize errors associated with phantom memories, respondents were asked not to evaluate their past experiences but rather to indicate their current level of interest in specific interactive formats. This section also included items designed to identify motivational factors that encourage engagement with interactive elements. Special attention was devoted to online quizzes, recognized as the most widely used interactive content format by both media professionals and audiences (
Zagorulko, 2024a). Their popularity enabled their use as a representative model for analyzing broader trends in audience perception of interactivity. In addition to dependent variables (interest and attitudes toward interactivity), the survey included several independent variables designed to capture technological and behavioral habits relevant to media consumption. For instance, the type of device used to access media content (e.g., smartphone, tablet, or desktop computer) may affect both the technological feasibility and the quality of user interaction, as some formats may not function properly on certain devices. Similarly, the habit of consuming media “on the go” may indicate a reduced level of attention and, consequently, lower engagement with complex or cognitively demanding interactive formats.
To address RQ2 (concerning the relationship between user age and attitudes toward interactivity), Cramér’s V coefficient was employed. This measure is suitable for assessing the strength of association between two nominal variables (
McHugh, 2018), making it appropriate for evaluating potential correlations between age groups and media consumption patterns. Questions related to RQ3 focused on audience behavior in social networks, distinguishing between two principal forms of activity: content creation and content commenting. These dimensions enabled an estimation of the respondents’ overall involvement in digital communication and its potential influence on their perception of interactive features. Finally, to answer RQ4 (concerning the alignment between audience expectations and the actual state of interactive feature implementation in Ukrainian digital media), the results were compared with data from a previously conducted content analysis of Ukrainian media websites (
Zagorulko, 2024b).
4. Results and Discussion
The final sample comprised 401 valid responses from individuals aged 18 to 88, with an average age of 38.2 years. To facilitate further analysis, respondents were grouped into six age segments, following standard media analytics practices: 18–24, 25–34, 35–44, 45–54, 55–64, and 65+ years. In terms of gender distribution, women represented approximately two-thirds of the sample (N = 275), while men constituted one-third (N = 126). Although the sample size does not permit definitive conclusions about the perceptions of interactivity within each age group, preliminary trends observed across segments suggest significant differences in attitudes and behaviors. These tendencies may serve as a basis for hypotheses in future studies employing larger stratified samples.
4.3. Attitude Toward Interactivity
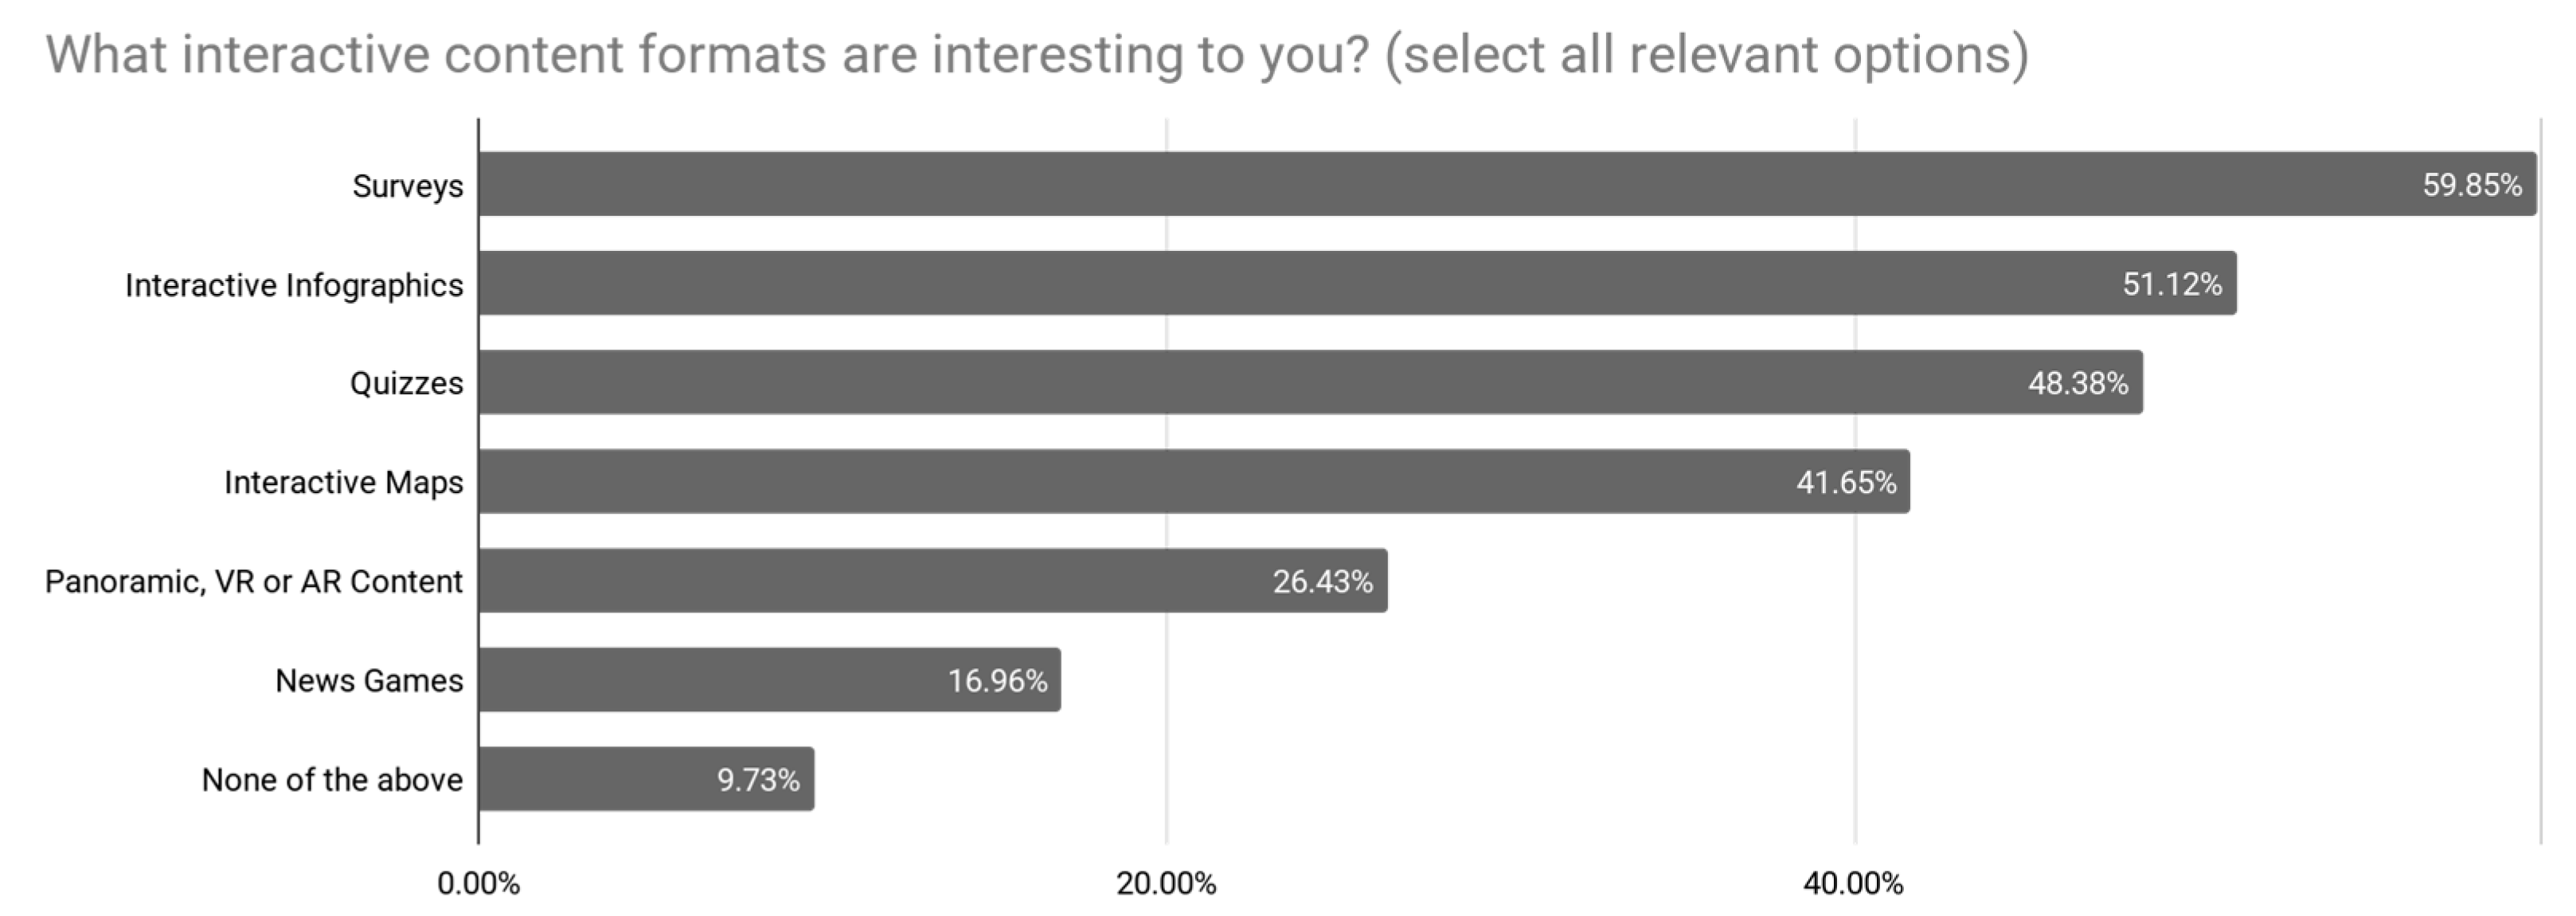
The next block of ten questions focused on the audience’s attitude toward interactive content in digital media. In the first question, respondents were asked to select the formats of interactive publications they found interesting (“What interactive formats of media publications are interesting to you? (select all relevant options)”, Q6). The results indicate a clear preference for the simplest forms of interactivity—those that require minimal effort from the user (
Figure 3). Most popular were formats involving answer selection, such as surveys (59.85%) and quizzes (48.38%), as well as interactive infographics (51.12%) and interactive maps (41.65%). These formats are distinguished by ease of perception, straightforward navigation, and the absence of special technical requirements. This supports a broader trend toward “minimal” interactivity, which aligns with the fast-paced consumption habits of contemporary online audiences. In contrast, immersive formats that demand greater effort or technical capabilities—such as panoramic content, VR or AR experiences (25.94%), and news games (16.96%)—were considerably less popular. This may be explained by a higher entry threshold for users.
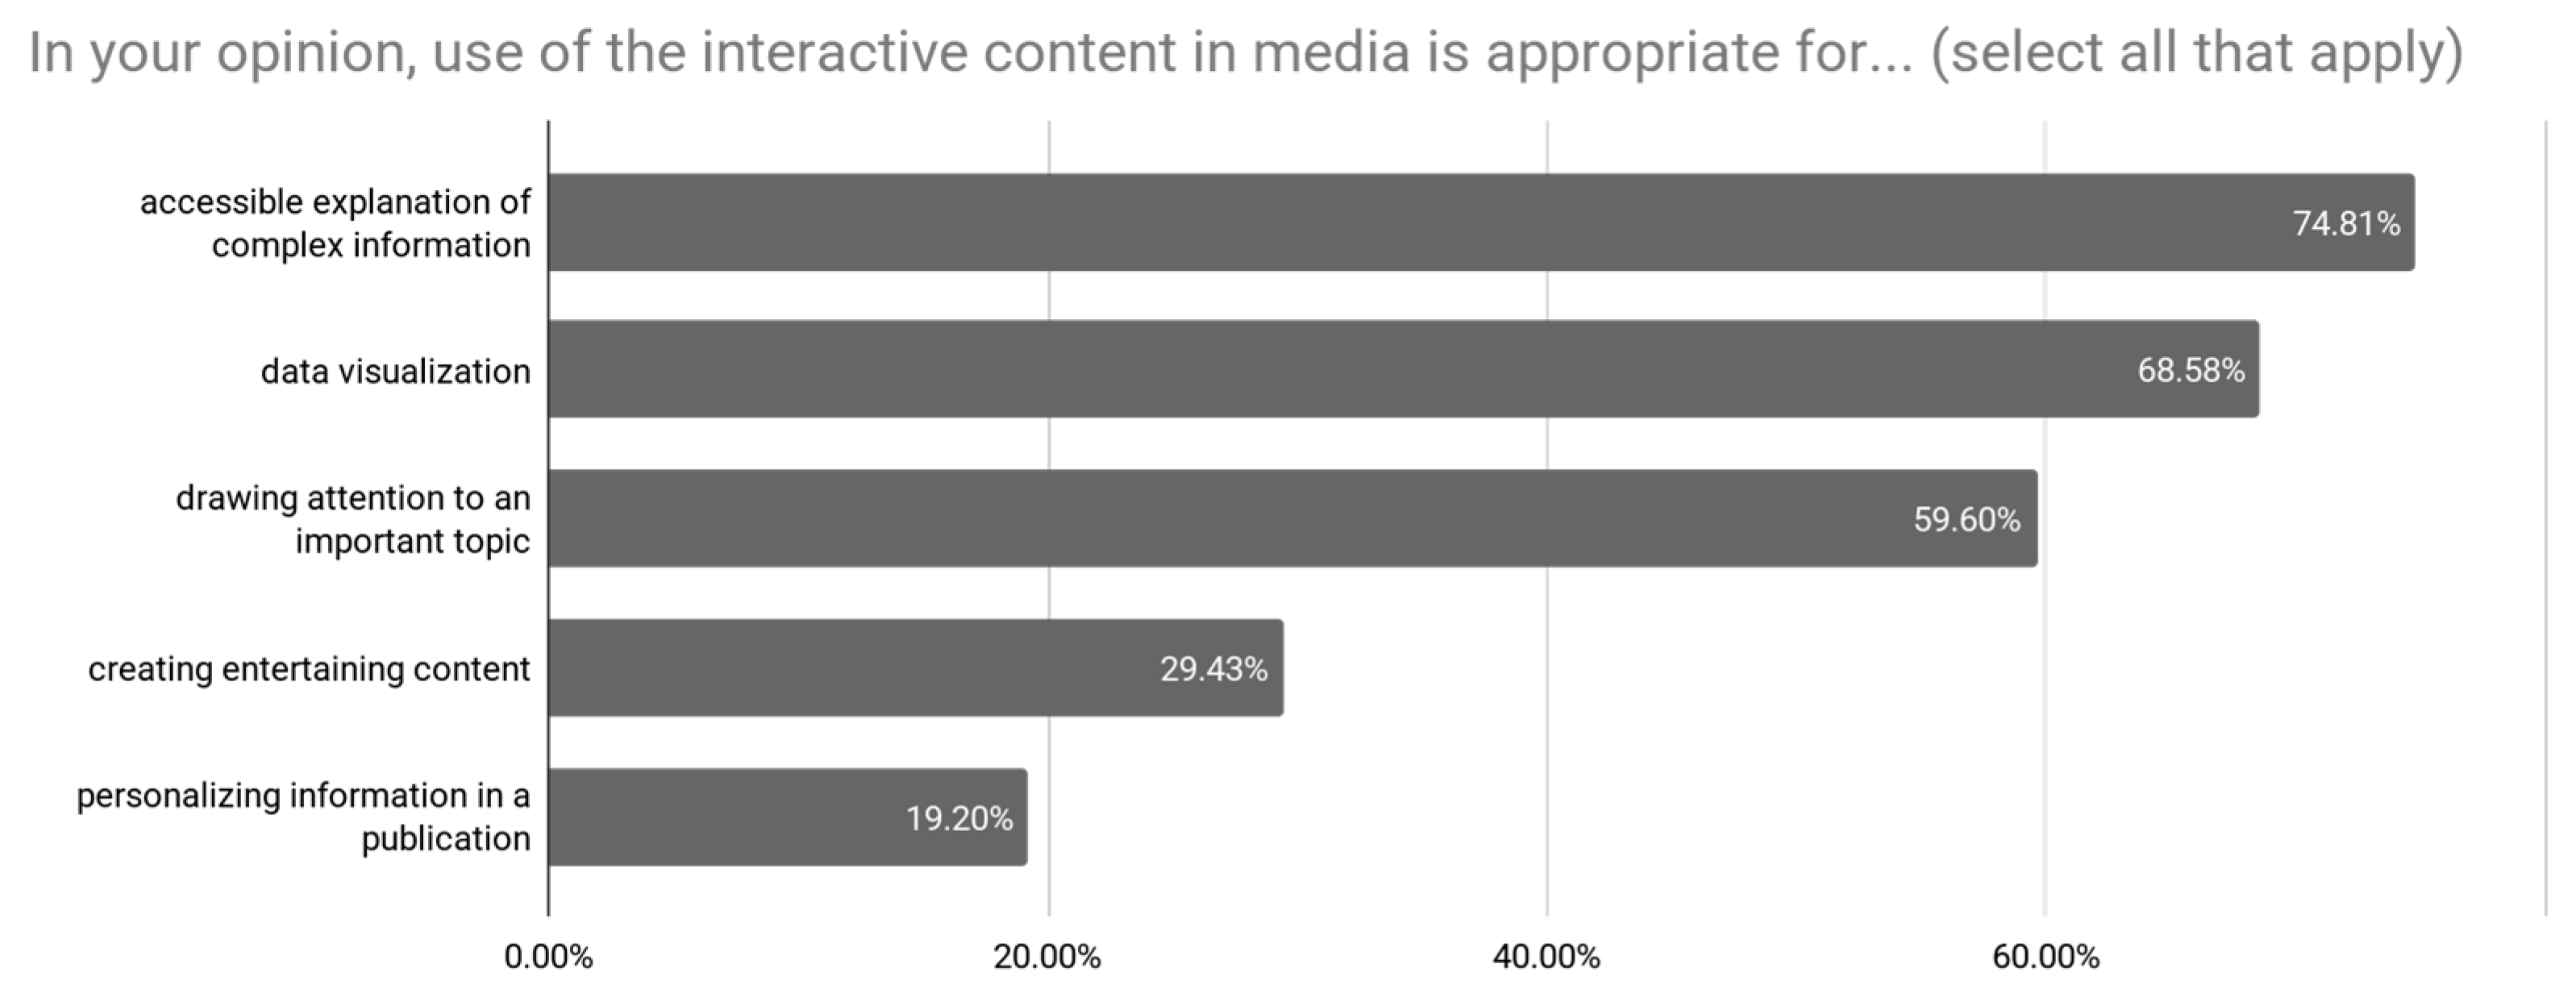
The notion that audiences are more interested in simpler forms of interactivity is further supported by responses to the question about the intended purpose of interactive content (“In your opinion, use of the interactive content in media is appropriate for… (select all that apply)”, Q7). The most frequently chosen answers were “accessible explanation of complex information” (74.81%) and “data visualization” (68.58%). These results indicate a clear audience preference for pragmatic applications of interactivity—tools that aid in the comprehension of complex information. The most popular formats from Q6 (infographics, maps, quizzes) directly correspond to these functions. In contrast, responses such as “creating entertaining content” (29.43%) and “personalizing information in a publication” (19.20%) were notably less common (
Figure 4). This reflects a dominant rational approach in audience expectations of interactivity: rather than being seen as a vehicle for entertainment or gamification, interactivity is primarily valued as a means of structuring, visualizing, and making sense of information.
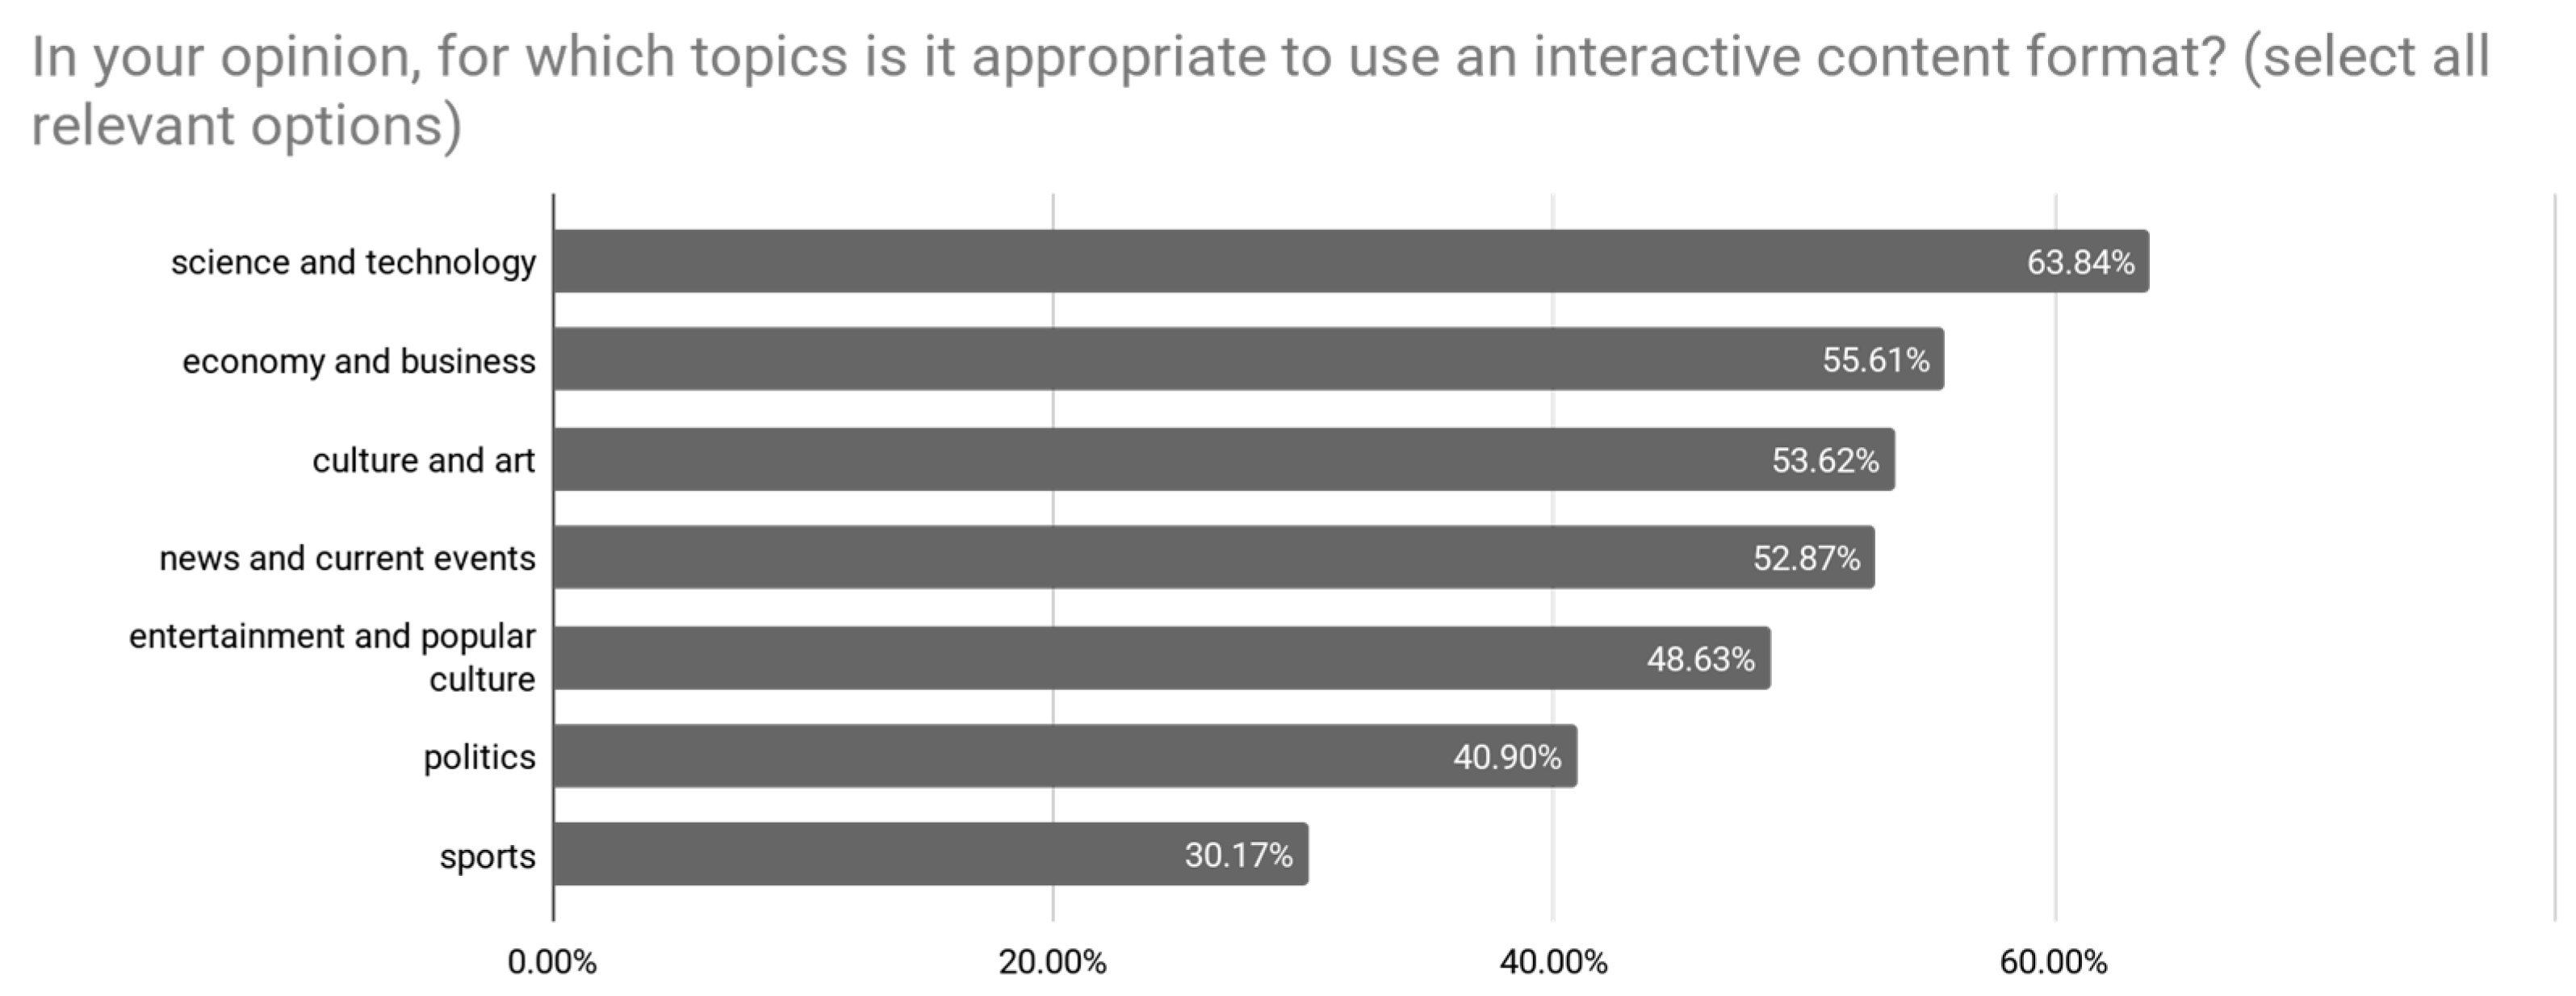
A similar pragmatic approach is reflected in the results of the question regarding the topics in which, according to the respondents, it is appropriate to use interactive formats (“In your opinion, for which topics is it appropriate to use the interactive format of publications?”, Q8). The highest perceived relevance of interactivity was found in the fields of “science and technology” (63.84%) and “economy and business” (55.61%)—areas where explaining complex processes through visualizations, simulations, or explanatory quizzes is particularly relevant. Considerable interest was also expressed in “culture and art” (53.62%) and “news and current events” (52.87%). In contrast, “politics” (40.90%) and “sports” (30.17%) received noticeably lower support, possibly because these topics are seen as either too emotionally charged or traditionally presented in more conventional, non-interactive ways (
Figure 5).
To further explore user motivation for engaging with interactive content, the survey focused on one of the most widespread formats of such content in Ukrainian digital media—quizzes. According to the data, 68.33% of the respondents reported having experience taking such quizzes (“Have you taken quizzes in digital media?”, Q9). The key motivations for this engagement (“What motivates you to take quizzes in digital media?”, Q10) align with previous findings—pragmatic motives prevail. The most frequently selected answers were “knowledge check” (55.61%) and “learning new information” (51.12%), suggesting that regardless of format, interactivity is perceived primarily as a tool for deepening understanding. This preference indicates a demand for accessible tools that minimize user effort while maximizing cognitive return, rather than prioritizing entertainment or social interaction.
Within textual content, interactivity often takes the form of multimedia inserts (audio, video) or hyperlinks. Interest in multimedia is moderate (“If video or audio materials are added to a text publication, how often do you watch them?”, Q11): 31.17% of respondents do so frequently, 61.60% occasionally, and 7.23% never. This moderate engagement may stem from the quality of the content itself: videos often replicate textual information and use generic stock visuals, reducing their perceived value (
Zagorulko, 2025).
The frequency of clicking on hyperlinks is similarly moderate (“When reading media publications, how often do you click on hyperlinks in them?”, Q12). While 92.77% of the users engage with hyperlinks at least occasionally, only 17.71% do so frequently. The respondents showed the highest interest in links that confirm the credibility of the content or provide additional context (“What hyperlinks in Internet media publications do you use? (select all relevant options)”, Q13): 61.60% choose source references, and 57.61%—contextual explanations. Conversely, links to related articles (commonly found under sections like “Read also” or “Reminder”) are significantly less popular (
Figure 6). Despite this, they remain an effective tool for increasing session duration and page views.
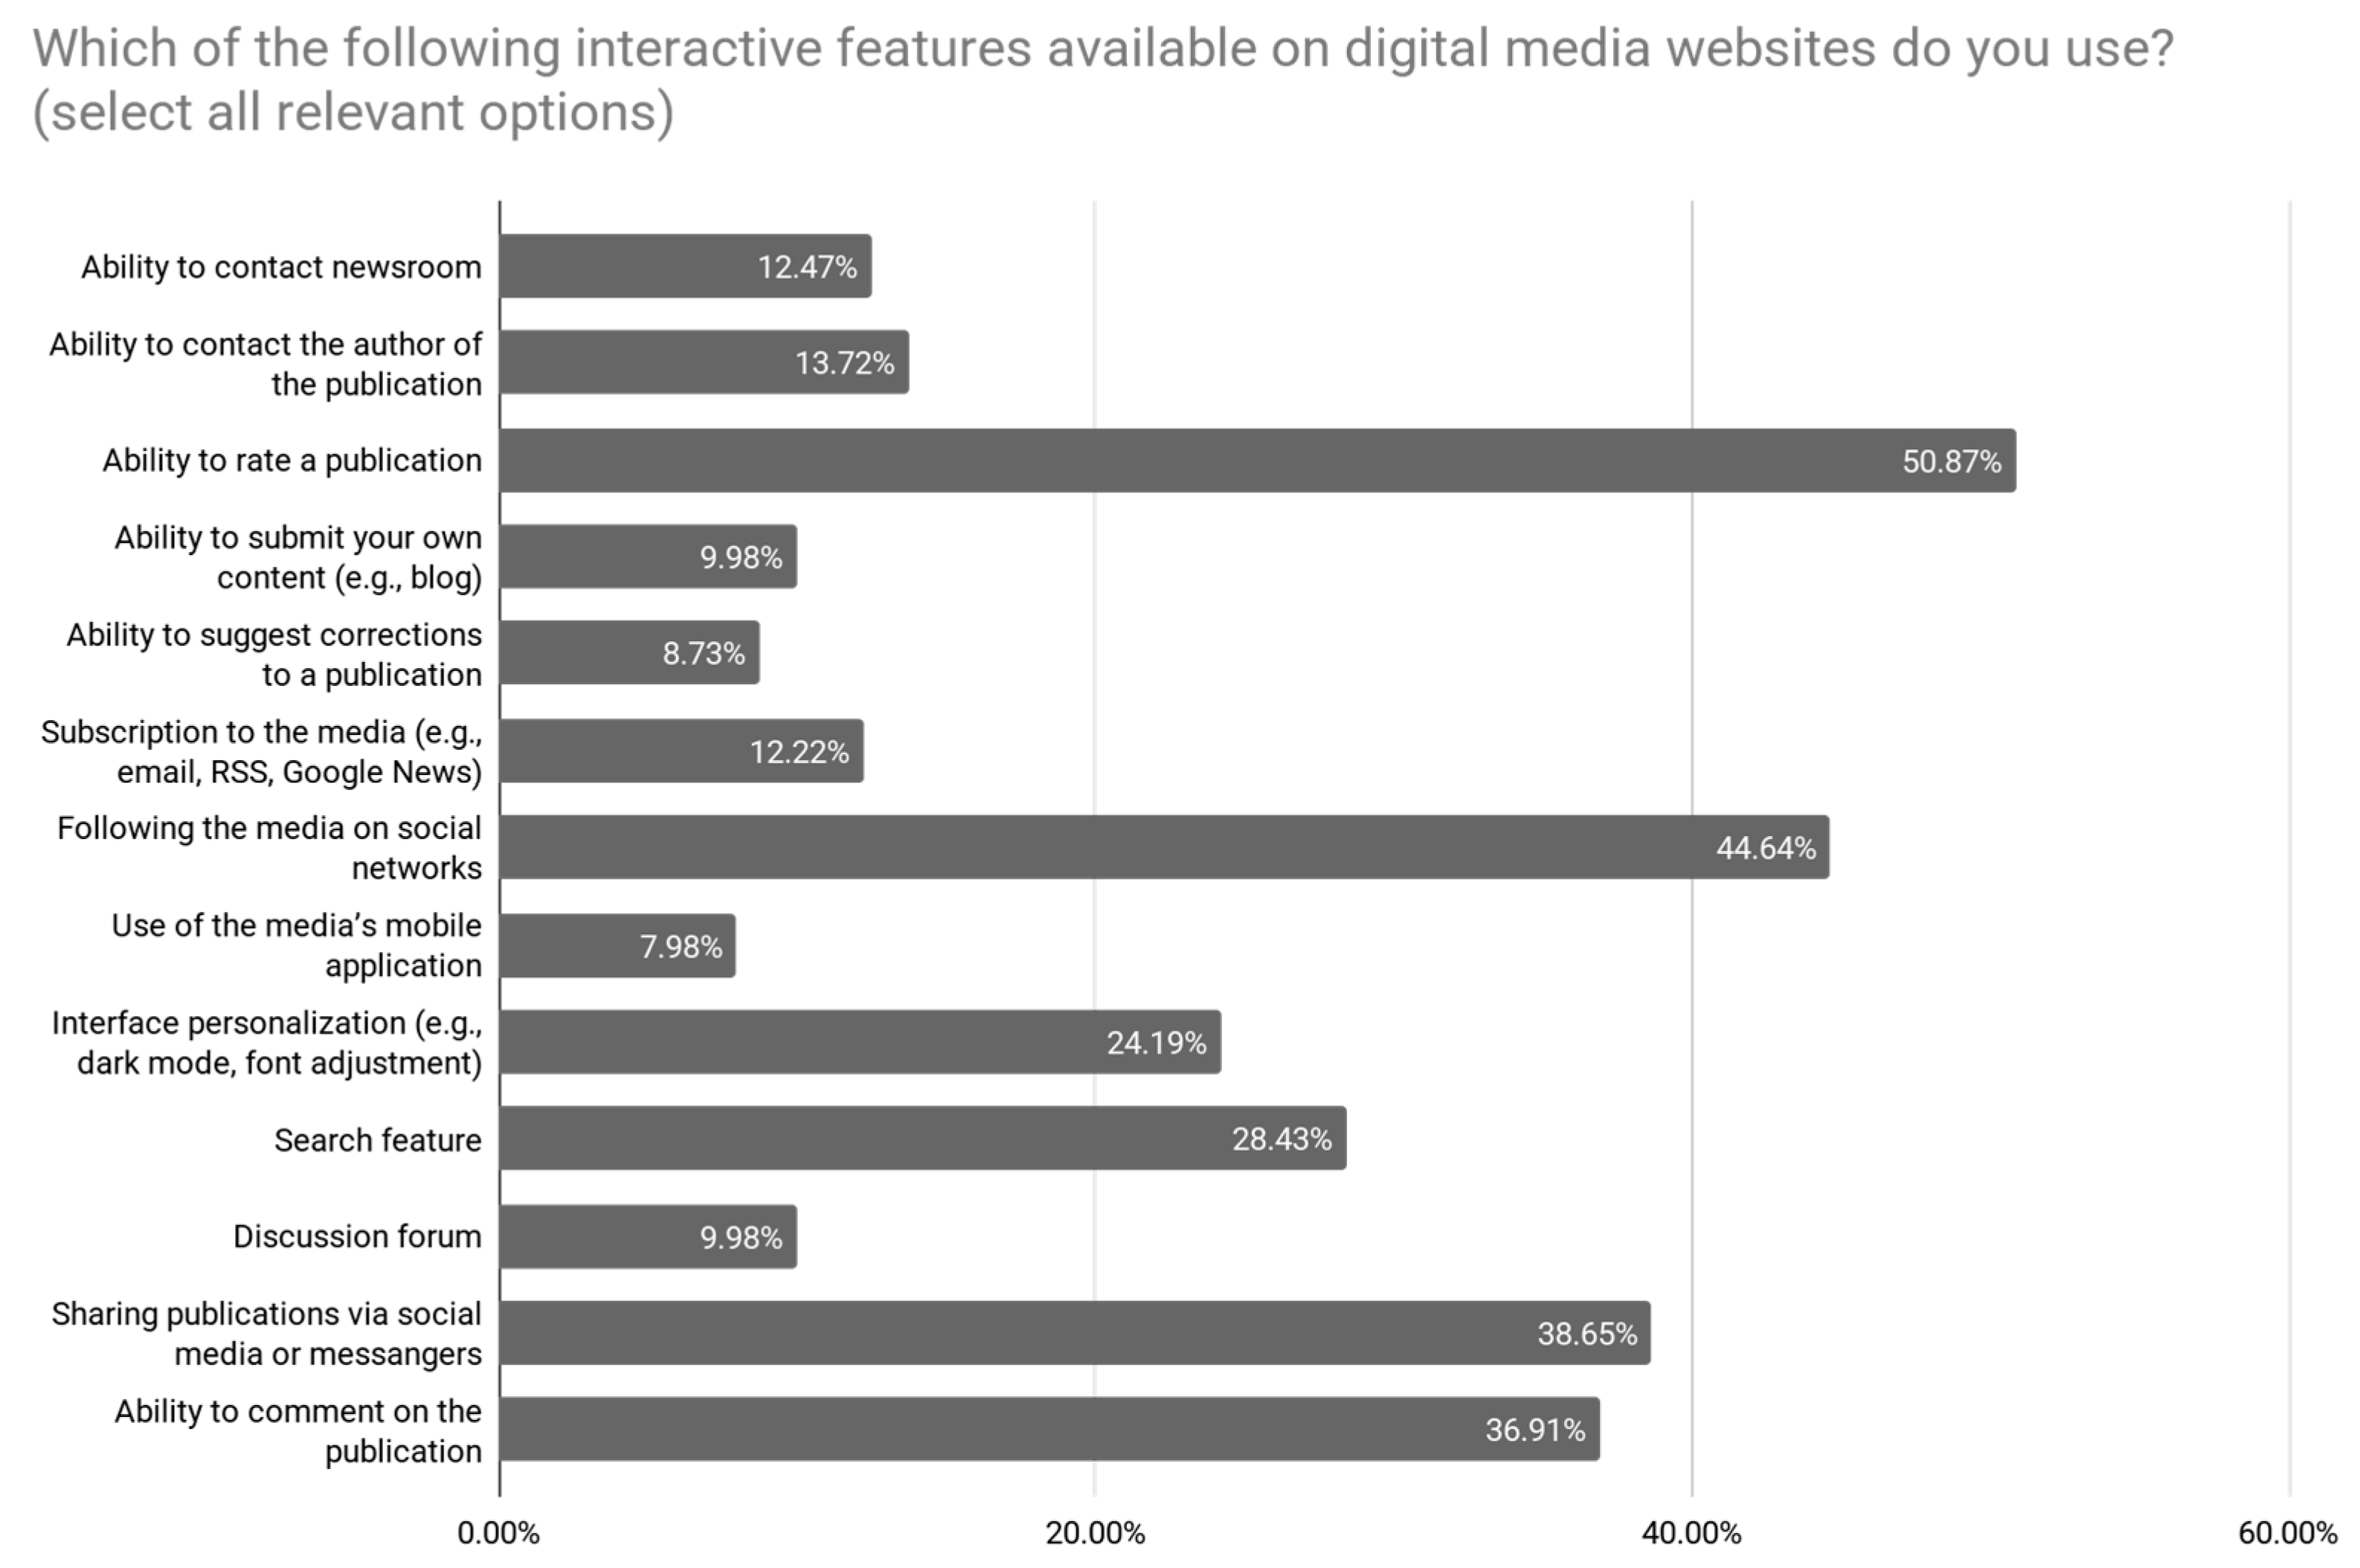
The final five questions of the survey focused on audience engagement with the interactive interface features of digital media websites, particularly the most common ones—commenting and sharing. The answer choices in question Q15 (“Which of the following interactive features of digital media websites do you use?”) were based on the previously proposed typology (
Zagorulko, 2024a), encompassing five categories: feedback, participation, access to updates, personalization, and communication (
Figure 7). Among the feedback features, the most frequently used was the “ability to rate a publication” (50.62%). In contrast, more effort-intensive forms of feedback—such as the “ability to contact newsroom” (12.47%) or the “ability to contact author of publication” (13.72%)—were significantly less popular. These results suggest a preference among Ukrainian users for quick and anonymous forms of interaction that require minimal effort. Interest in participatory features, which allow readers to act as co-creators of media content, was notably low. Only 9.98% of the respondents valued the “ability to submit own content (e.g., blogs)”, while just 8.73% considered the option to “suggest corrections to a publication” important. This reflects limited user demand for active editorial participation.
In terms of features of accessing updates, “following the media on social networks” proved the most popular (44.64%). Traditional subscription methods—such as email, RSS feeds, or Google News—were significantly less favored (12.22%), and mobile apps were chosen by only 7.98%. These findings support the broader trend of platformization and confirm the dominance of social media as the primary gateway to news. For editorial teams, this suggests that developing native mobile apps may no longer be a necessary investment.
Personalization features attracted higher interest: 24.19% of the respondents appreciated options for interface customization (e.g., dark mode, font adjustments), while 28.43% expressed interest in the feature of search among media archives. Communication-related features were also popular: commenting (36.91%) and sharing digital media publications (38.65%) were both used by over a third of the respondents. Although discussion forums are less prominent, they still retain a niche interest (9.98%). These results broadly confirm the earlier hypothesis: users prefer low-effort interaction tools over more involved, participatory functions. While co-creation of content is of limited interest, there is clear demand for tools that facilitate evaluation, commentary, and content dissemination.
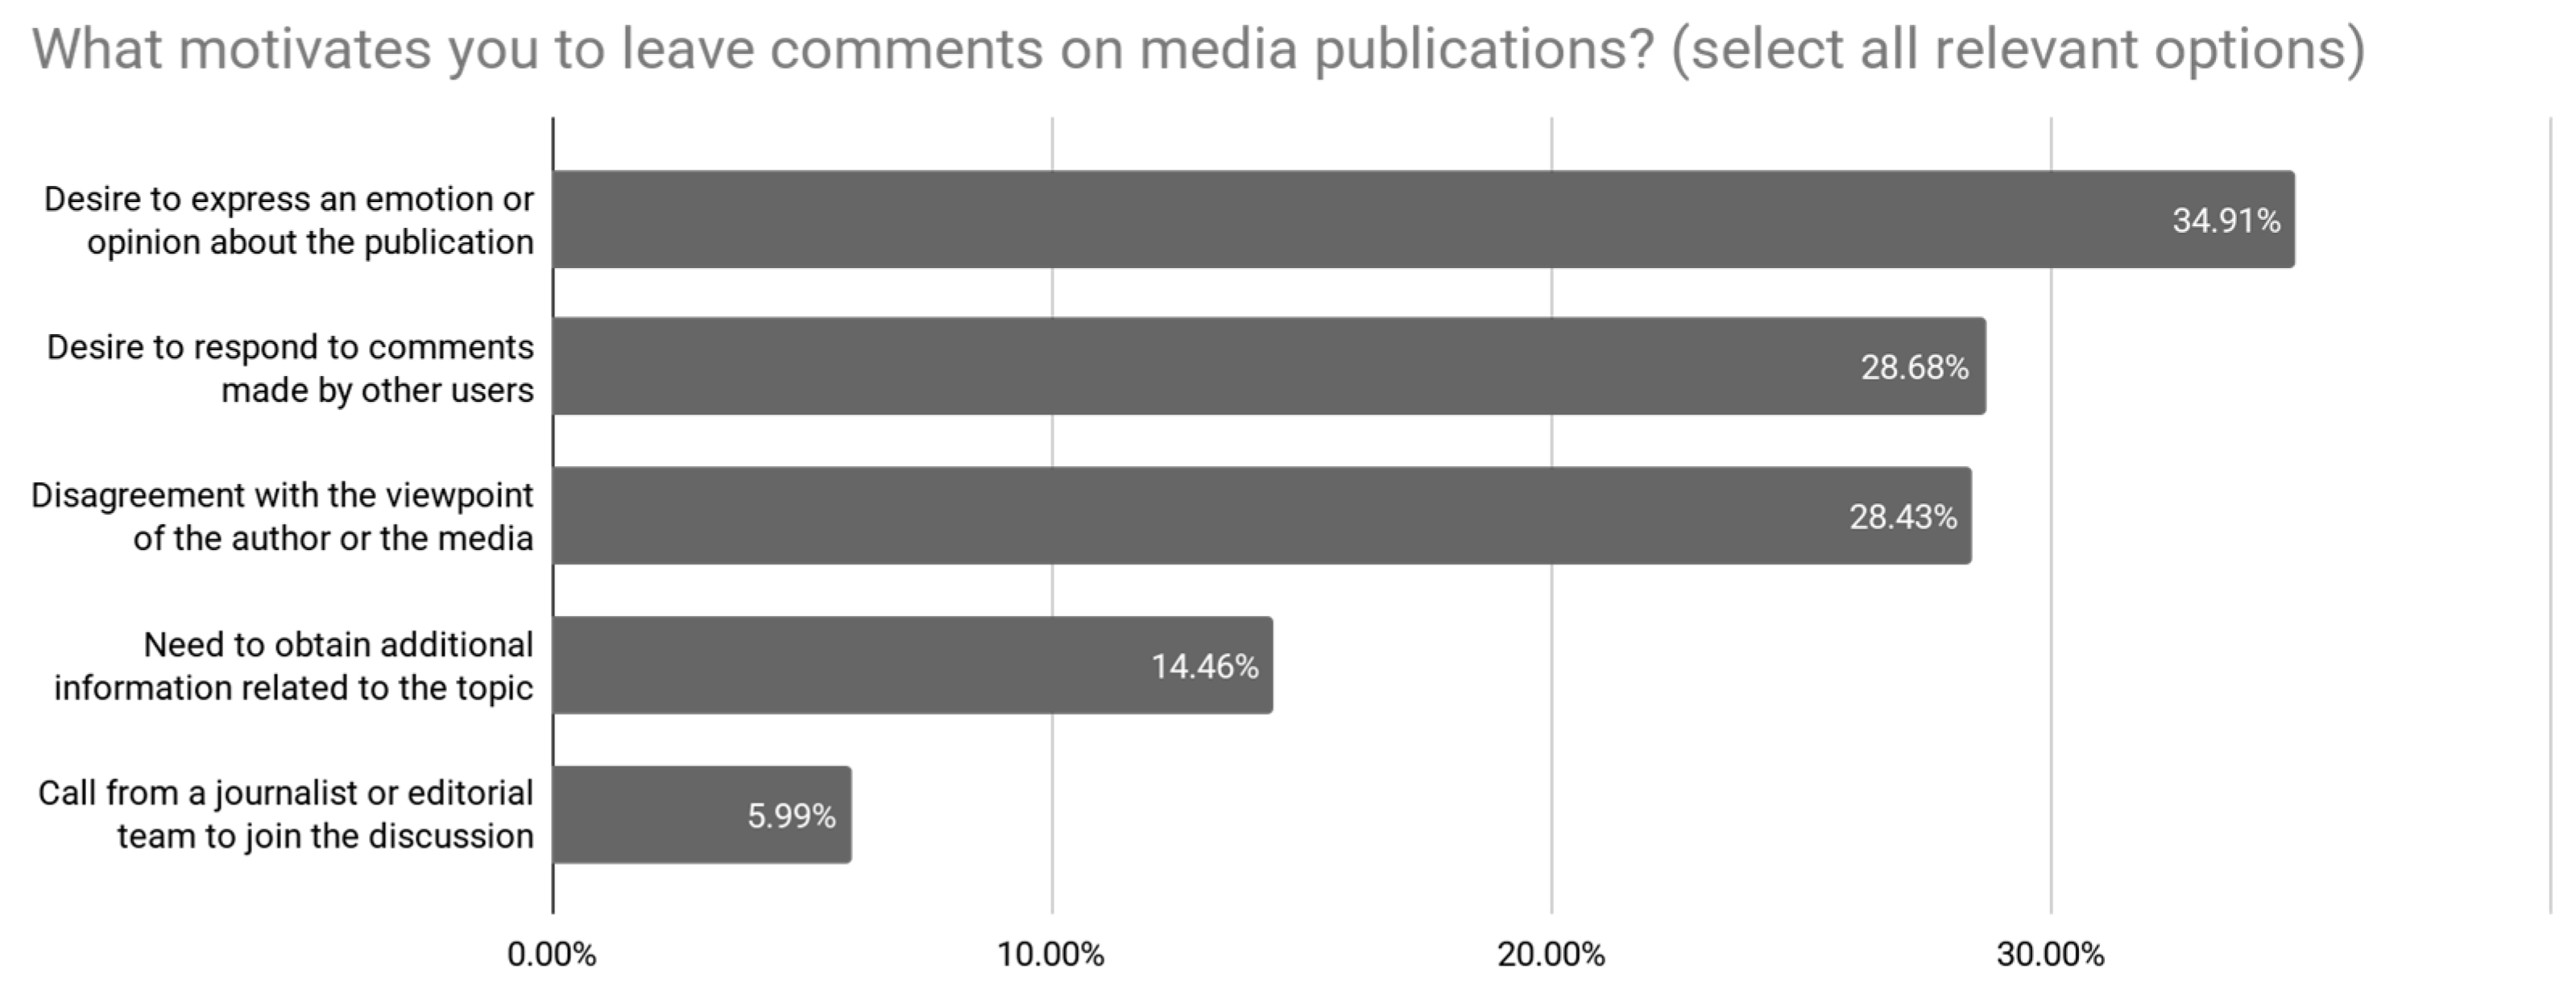
The audience’s approach to commenting was examined in more detail. Question Q16 (“How do you usually comment on media publications?”) revealed low levels of engagement on the media sites themselves: only 7.23% of the respondents comment exclusively on-site. Social networks are far more frequently used for this purpose (45.14%), with an additional 19.95% commenting in both environments. The motivations behind commenting (“What motivates you to comment on media publications? (select all relevant options)”, Q17) are primarily emotionally driven. The leading reasons included the “desire to express emotion or opinion about the publication” (34.91%) and to disagree with the author or editorial team (28.43%). Interaction with fellow readers also plays a role: 28.68% of the respondents cited a “desire to respond to comments made by other users” as a motivating factor. Other influences, such as explicit editorial calls for discussion, were much less impactful (
Figure 8). This points to the organic, self-motivated nature of user engagement in comment sections, shaped more by internal affective triggers than by external prompts.
The findings align with earlier research indicating that commenting on media content is more common among men and older age groups (
Stroud et al., 2015;
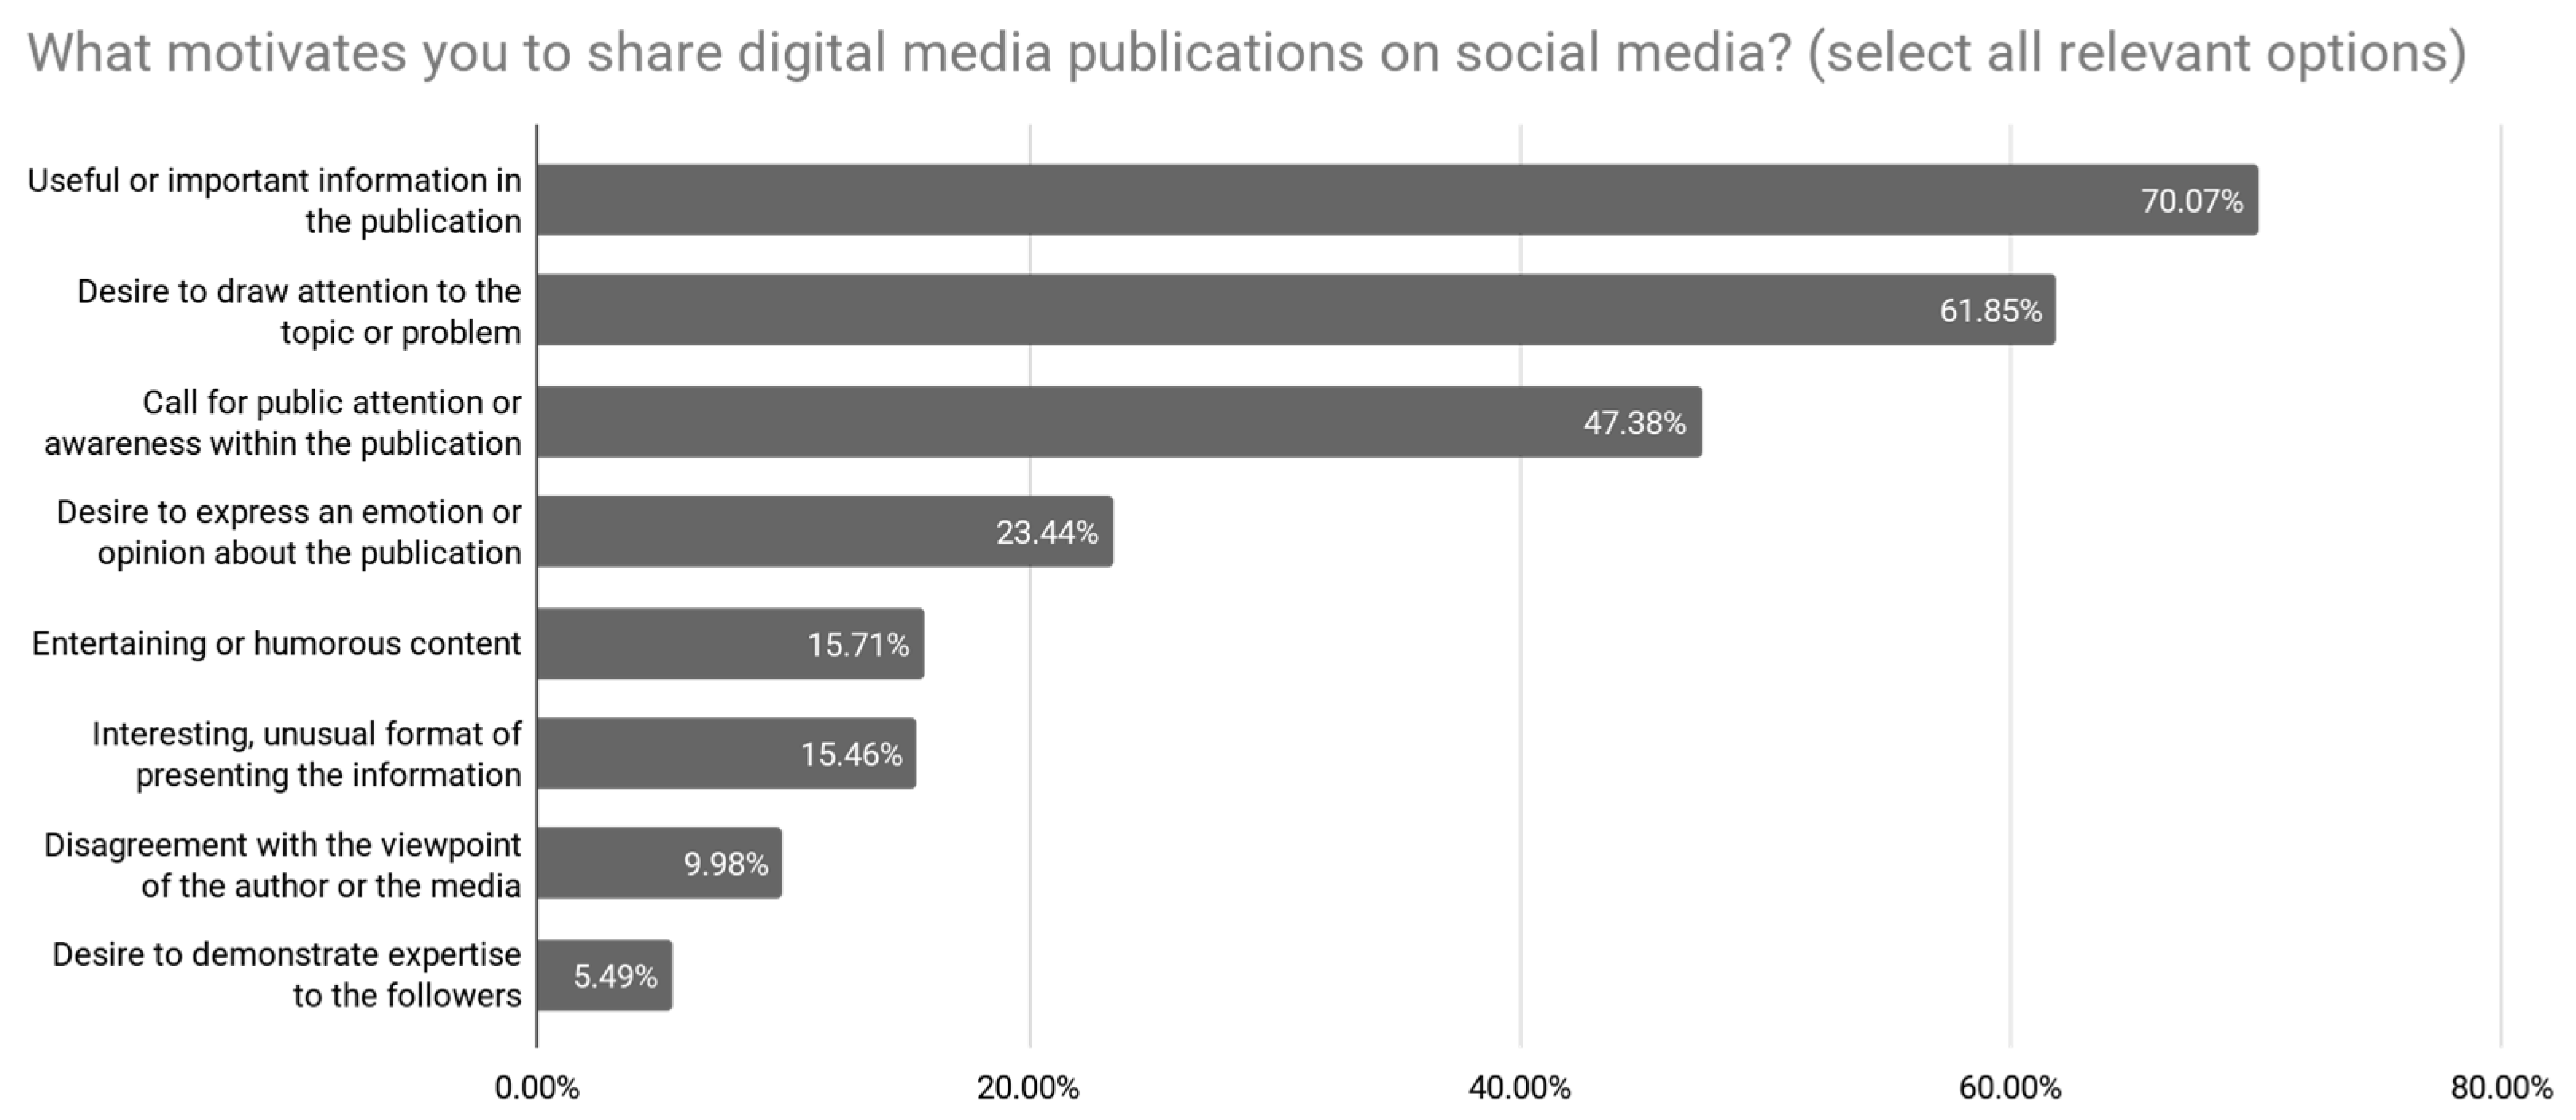
Springer et al., 2015). In the current study, 68.26% of men reported commenting on digital media publications at least occasionally, compared to 45.1% of women. The age-based differences were even more pronounced: 76.67% of the respondents aged 65 and older engage in commenting, while only 41.21% of those aged 18–24 do so. The motivators for sharing content on social networks were also analyzed in detail. While 12.72% of the respondents frequently share media publications on their social networks, a significantly larger proportion—69.58%—do so occasionally (“How often do you share media publications on your social networks?”, Q18). The motivations for sharing were predominantly pragmatic: 70.07% cited the presence of useful or important information in the publication, and 61.85% pointed to the desire to draw attention to a relevant issue as their primary reason for reposting content (“What motivates you to share digital media publications on social networks? (select all relevant options)”, Q19). In contrast to commenting behavior, emotional expression plays a relatively minor role in content sharing—only 23.44% of the respondents identified desire to express emotion or opinion about the digital media publication as a significant motivator (
Figure 9).
5. Conclusions
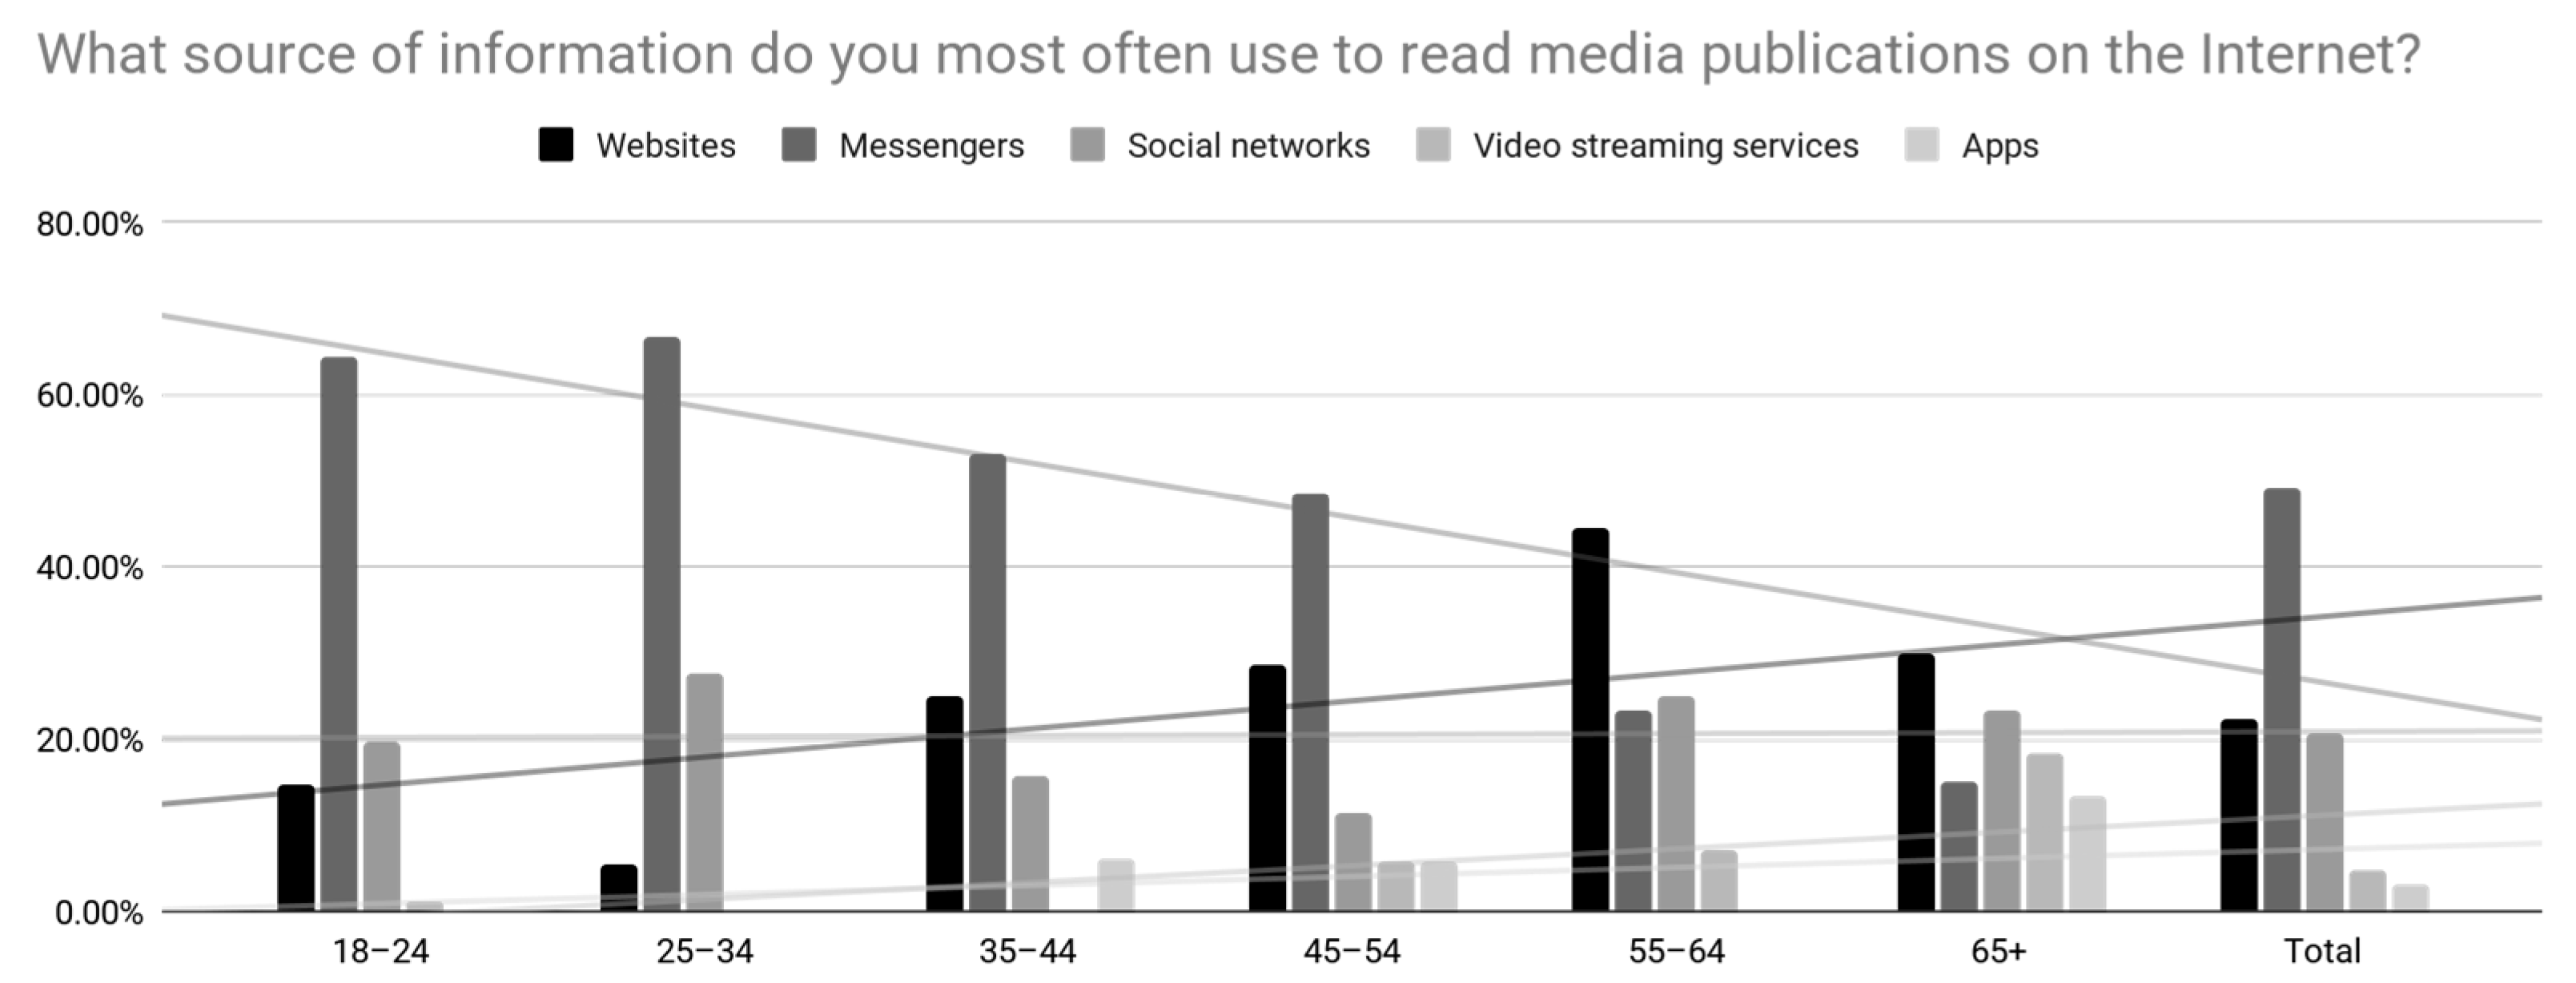
The media landscape is undergoing significant transformation: digital media websites are losing ground, while social networks are increasingly becoming the primary source of news. Simultaneously, the growing prevalence of mobile news consumption contributes to more fragmented and short-term user attention, further limiting opportunities for meaningful engagement with the media. Research focused on the Ukrainian audience, where these changes are occurring more dynamically than in many other technologically developed regions, not only captures local changes, but also offers insight into broader media consumption trends that may be extrapolated to other media markets.
The findings confirm that scholarly expectations regarding interactivity as a form of co-authorship between media and audiences have not materialized in practice. Participatory features related to content creation and correction attract little interest from users. Notably, even behavioral patterns observed on social media do not translate into greater creative engagement with digital media: having convenient opportunities to express their views on other platforms, users perceive digital media primarily as a source of information rather than as a space for self-expression. Similarly, direct communication functions—such as contacting editors or individual journalists—generate limited interest. In contrast, there is consistent audience demand for low-effort interactivity—features that require little effort but still make users feel involved. These include the ability to provide quick feedback, such as rating or commenting on media publications, as well as personalization features, including interface customization and preferred formats for media updates. Age-based correlations were also observed: older users more frequently access media via desktop devices, visit traditional digital media websites, and exhibit greater commenting activity. This suggests that short-term strategies for media outlets should focus on maintaining the loyalty of this core active audience, while long-term approaches must account for the habits and preferences of younger users and adapt accordingly.
Comparing audience expectations and their actual implementation in digital media shows a systemic gap. Editorial strategies tend to prioritize the simplest, least resource-intensive features—those that are also among the least appealing to users. This disconnect is particularly noticeable in the case of interactive content: despite strong audience interest in interactive formats such as surveys, infographics, maps, and quizzes, these are rarely present on Ukrainian digital media websites. The survey results suggest that audiences are primarily interested in interactive content for pragmatic reasons—namely, to improve comprehension and maximize cognitive benefit. These same motivations also encourage users to share media publications on social networks, helping drive traffic back to the website and amplify engagement.
It is important, however, to acknowledge several limitations of the study. First, the current socio-political situation in Ukraine may have influenced the findings. News consumption habits, audience attention, and information needs are likely shaped by the ongoing war, which can affect both the volume and type of interactive engagement. The sample and data collection may have been influenced by the agenda-setting processes of Ukrainian media, meaning that the observed audience behavior could reflect situational or event-driven dynamics rather than stable long-term patterns. Second, the study relied on social media as a recruitment channel, which may bias the sample toward users less likely to engage with high-effort interactive features, as noted in the literature. Finally, while the study captures observable engagement with interactive features, underlying motivations, cognitive processes, and potential barriers to participation remain unexplored, highlighting the need for further qualitative research.
Author Contributions
Conceptualization, D.Z. and K.H.; data curation, D.Z. and K.H.; methodology, K.H. and N.Z.; visualization, D.Z.; writing—original draft, D.Z.; writing—review & editing, D.Z., K.H. and N.Z. All authors have read and agreed to the published version of the manuscript.
Funding
This research received no external funding.
Institutional Review Board Statement
The ethical review and approval were waived for this study, since it relied on voluntary and anonymous online survey responses from adult participants. No personal identifiers, medical data, or other sensitive information were collected. To ensure full confidentiality, all responses were stored securely and were accessible only to the research team.
Informed Consent Statement
The research was conducted via an anonymous online survey distributed to adult participants. Before proceeding to the survey questions, the participants were presented with the informed consent statement.
Data Availability Statement
The original contributions presented in this study are included in the article. Further inquiries can be directed to the corresponding author.
Acknowledgments
During the preparation of this study, the authors used OpenAI’s ChatGPT, powered by the GPT-4o model (May 2024 version), for the purposes of language refinement. The authors have reviewed and edited the output and take full responsibility for the content of this publication.
Conflicts of Interest
The authors declare no conflicts of interest.
References
- Agirre, I. A., Arrizabalaga, A. P., & Espilla, A. Z. (2016). Active audience?: Interaction of young people with television and online video content. Communication & Society, 29(3), 133–147. [Google Scholar] [CrossRef]
- Anter, L., & Kümpel, A. S. (2023). Young adults’ information needs, use, and understanding in the context of instagram: A multi-method study. Digital Journalism, 13, 1112–1130. [Google Scholar] [CrossRef]
- Babbie, E. R. (2013). The practice of social research. Wadsworth Publishing Company. [Google Scholar]
- Boczkowski, P. J., Mitchelstein, E., & Matassi, M. (2018). “News comes across when I’m in a moment of leisure”: Understanding the practices of incidental news consumption on social media. New Media & Society, 20(10), 3523–3539. [Google Scholar] [CrossRef]
- Borile, J. L. (2024). Where do Japanese people get their news in 2024? Aix Post. Available online: https://aixpost.com/trends/japanese-news-consumption-across-generations/ (accessed on 9 September 2025).
- Bucy, E. P. (2003). The interactivity paradox: Closer to the news but confused. In E. P. Bucy, & J. E. Newhagen (Eds.), Media access: Social and psychological dimensions of new technology use (pp. 47–72). Routledge. [Google Scholar] [CrossRef]
- Bucy, E. P. (2004). Interactivity in society: Locating an elusive concept. The Information Society, 20(5), 373–383. [Google Scholar] [CrossRef]
- Chen, C., Lee, S., & Sundar, S. S. (2023). Interpassivity instead of interactivity? The uses and gratifications of automated features. Behaviour and Information Technology, 43(4), 717–735. [Google Scholar] [CrossRef]
- Chung, D. S. (2008). Interactive features of online newspapers: Identifying patterns and predicting use of engaged readers. Journal of Computer-Mediated Communication, 13(3), 658–679. [Google Scholar] [CrossRef]
- Digital State UA. (2025, March 24). Ukraine accelerates e-literacy through public infrastructure. Available online: https://digitalstate.gov.ua/news/govtech/ukraine-accelerates-e-literacy-through-public-infrastructure# (accessed on 9 September 2025).
- EU4Digital. (2021, June 25). Ready for the digital decade? Improving skills to meet the technological challenge in Ukraine. Available online: https://eufordigital.eu/ready-for-the-digital-decade-improving-skills-to-meet-the-technological-challenge-in-ukraine/ (accessed on 9 September 2025).
- European Parliament. (2023, November 17). TV still main source for news but social media is gaining ground. Available online: https://www.europarl.europa.eu/news/en/press-room/20231115IPR11303/tv-still-main-source-for-news-but-social-media-is-gaining-ground (accessed on 9 September 2025).
- García-Perdomo, V., Salaverría, R., Brown, D. K., & Harlow, S. (2017). To share or not to share: The influence of news values and topics on popular social media content in the United States, Brazil, and Argentina. Journalism Studies, 19(8), 1180–1201. [Google Scholar] [CrossRef]
- Husak, O. (2014). Osnovni tendentsii povedinky audytorii suchasnykh internet-ZMI [Main trends in the behavior of the audience of modern online media]. Visnyk Knyzhkovoi Palaty (Bulletin of the Book Chamber), 109(4), 42–45. Available online: http://nbuv.gov.ua/UJRN/vkp_2014_4_13 (accessed on 9 September 2025).
- Kalogeropoulos, A., Negredo, S., Picone, I., & Nielsen, R. K. (2017). Who shares and comments on news?: A cross-national comparative analysis of online and social media participation. Social Media + Society, 3(4). [Google Scholar] [CrossRef]
- Kenney, K., Gorelik, A., & Mwangi, S. (2000). Interactive features of online newspapers. First Monday, 5(1). [Google Scholar] [CrossRef]
- Li, C. (2007, April 19). Social technographics. Forrester Research, Inc. Available online: http://miami.lgrace.com/documents/Li_Web_Demographics.pdf (accessed on 9 September 2025).
- Martínez-Costa, M., Serrano-Puche, J., Portilla, I., & Sánchez-Blanco, C. (2019). Young adults’ interaction with online news and advertising. Comunicar, 27(59), 19–28. [Google Scholar] [CrossRef]
- McHugh, M. (2018). Cramér’s V coefficient. In The SAGE encyclopedia of educational research, measurement, and evaluation (Vol. 4, pp. 417–418). SAGE Publications, Inc. [Google Scholar] [CrossRef]
- Montesi, M., & Rodríguez, I. V. (2021). A interatividade do texto digital na experiência de leitura e capacidade de compreensão. Revista Ibero-Americana De Ciência Da Informação, 14(1), 274–288. [Google Scholar] [CrossRef]
- Newman, N. (2023, June 15). Overview and key findings of the 2023 digital news report. Detector Media. Available online: https://detector.media/infospace/article/213971/2023-06-15-overview-and-key-findings-of-the-2023-digital-news-report/ (accessed on 9 September 2025).
- Oblak Črnič, T., & Jontes, D. (2017). (R)evolution of perspectives on interactivity: From a media-centered to a journalist-centered approach. Medijske studije, 8(15), 39–54. [Google Scholar] [CrossRef]
- Pew Research Center. (1996, December 16). News attracts most internet users. Available online: https://www.pewresearch.org/politics/1996/12/16/online-use/ (accessed on 9 September 2025).
- Pew Research Center. (1999, January 14). The internet news audience goes ordinary. Available online: https://www.pewresearch.org/politics/1999/01/14/the-internet-news-audience-goes-ordinary/ (accessed on 9 September 2025).
- Pew Research Center. (2006, July 30). Online papers modestly boost newspaper readership. Available online: https://www.pewresearch.org/politics/2006/07/30/online-papers-modestly-boost-newspaper-readership/ (accessed on 9 September 2025).
- Pew Research Center. (2024, September 17). News platform fact sheet. Available online: https://www.pewresearch.org/journalism/fact-sheet/news-platform-fact-sheet/ (accessed on 9 September 2025).
- Podara, A., Matsiola, M., Maniou, T. A., & Kalliris, G. (2019). News usage patterns of young adults in the era of interactive journalism. Strategy and Development Review, 9, 61–83. [Google Scholar] [CrossRef]
- Regalado, F., Costa, L. V., & Veloso, A. I. (2021). Online news and gamification habits in late adulthood: A survey. In Q. Gao, & J. Zhou (Eds.), Human aspects of IT for the aged population. Technology design and acceptance: 7th International Conference, ITAP 2021, held as part of the 23rd HCI International Conference, HCII 2021, virtual event, July 24–29, proceedings, Part I (pp. 405–419). Springer. [Google Scholar] [CrossRef]
- Richard, T. (2022). Digital journalism: An overview. Journal of Mass Communication & Journalism, 12, 4. Available online: https://www.hilarispublisher.com/open-access/digital-journalism-an-overview-88530.html (accessed on 9 September 2025).
- Rosentiel, T. (2007, July 25). Online videos go mainstream. Pew Research Center. Available online: https://www.pewresearch.org/2007/07/25/online-videos-go-mainstream/ (accessed on 9 September 2025).
- Schultz, T. (2006). Interactive options in online journalism: A content analysis of 100 U.S. newspapers. Journal of Computer-Mediated Communication, 5(1), JCMC513. [Google Scholar] [CrossRef]
- Solvoll, M. K., & Larsson, A. O. (2020). The (non)use of likes, comments and shares of news in local online newspapers. Newspaper Research Journal, 41(2), 204–217. [Google Scholar] [CrossRef]
- Song, J. H., & Zinkhan, G. M. (2008). Determinants of perceived web site interactivity. Journal of Marketing, 72(2), 99–113. [Google Scholar] [CrossRef]
- Springer, N., Engelmann, I., & Pfaffinger, C. (2015). User comments: Motives and inhibitors to write and read. Information, Communication & Society, 18(7), 798–815. [Google Scholar] [CrossRef]
- Spyridou, L. (2018). Analyzing the active audience: Reluctant, reactive, fearful, or lazy? Forms and motives of participation in mainstream journalism. Journalism, 20(6), 827–847. [Google Scholar] [CrossRef]
- Stroud, N. J., Scacco, J. M., & Curry, A. L. (2015). The presence and use of interactive features on news websites. Digital Journalism, 4(3), 339–358. [Google Scholar] [CrossRef]
- Sundar, S. S. (2000). Multimedia effects on processing and perception of online news: A study of picture, audio, and video downloads. Journalism & Mass Communication Quarterly, 77(3), 480–499. [Google Scholar] [CrossRef]
- Thulin, A. (2022). Polis/LSE Journalistfonden newsroom fellowship. Let’s Play News. Available online: https://blogsmedia.lse.ac.uk/blogs.dir/19/files/2022/02/22_0041-POLIS-Report-Playful-news-V6.pdf (accessed on 9 September 2025).
- Trilling, D., Tolochko, P., & Burscher, B. (2016). From newsworthiness to shareworthiness: How to predict news sharing based on article characteristics. Journalism & Mass Communication Quarterly, 94(1), 38–60. [Google Scholar] [CrossRef]
- Troyan, V. (2024, November 7). Doslidzhennia: Ukraintsi otrymuyut novyny perevazhno iz sotsmerezh i dedali menshe z novynnykh saitiv [Research: Ukrainians mostly get news from social media and increasingly less from news sites]. Institute of Mass Information. Available online: https://imi.org.ua/news/doslidzhennya-ukrayintsi-otrymuyut-novyny-perevazhno-iz-sotsmerezh-i-vse-menshe-z-novynnyh-sajtiv-i64760 (accessed on 9 September 2025).
- Vanhaeght, A.-S. (2018). The need for not more, but more socially relevant audience participation in public service media. Media, Culture & Society, 41(1), 120–137. [Google Scholar] [CrossRef]
- Wang, G., Gu, W., & Suh, A. (2018, June 5). The effects of 360-degree vr videos on audience engagement: Evidence from the New York Times. In HCI in business, government, and organizations (pp. 217–235). Lecture notes in computer science. Springer. [Google Scholar] [CrossRef]
- Zagorulko, D. (2024a). Interactivity in online media: Classification and characteristics of key features. Communications and Communicative Technologies, 24, 112–122. [Google Scholar] [CrossRef]
- Zagorulko, D. (2024b). Engaging the Audience: Interactive Features in Ukrainian Online Media. Current Issues of Mass Communication, 35, 90–102. [Google Scholar] [CrossRef]
- Zagorulko, D. (2025). Interaktyvnist, multymediinist, hipertekstualnist: Spivvidnoshennia kliuchovykh kharakterystyk onlain-media [Interactiv-ity, multimedia, hypertextuality: The correlation between the key characteristics of online media]. Printing Horizon, 1(17), 205–219. [Google Scholar] [CrossRef]
| Disclaimer/Publisher’s Note: The statements, opinions and data contained in all publications are solely those of the individual author(s) and contributor(s) and not of MDPI and/or the editor(s). MDPI and/or the editor(s) disclaim responsibility for any injury to people or property resulting from any ideas, methods, instructions or products referred to in the content. |
© 2025 by the authors. Licensee MDPI, Basel, Switzerland. This article is an open access article distributed under the terms and conditions of the Creative Commons Attribution (CC BY) license (https://creativecommons.org/licenses/by/4.0/).
