Article

Media Output Score, a New Indicator for Measuring Online Media Coverage

1
Faculty of Human and Social Sciences, University Fernando Pessoa, 4249-004 Porto, Portugal
2
ISUS Unit, Faculty of Science and Technology, University Fernando Pessoa, 4249-004 Porto, Portugal
3
Artificial Intelligence and Computer Science Laboratory, LIACC, University of Porto, 4100-000 Porto, Portugal
*
Author to whom correspondence should be addressed.
Journal. Media 2024, 5(1), 31-47; https://doi.org/10.3390/journalmedia5010003
Submission received: 27 November 2023 / Revised: 17 December 2023 / Accepted: 26 December 2023 / Published: 30 December 2023

Abstract

:
Communications professionals have widely recognized the importance of media coverage measurement. Despite having been discredited in measuring media coverage, either by the scientific community or by industry main organizations, advertising value equivalency (AVE) continues, nevertheless, to be a metric used by many communication professionals to measure digital media coverage. We propose a new metric, the Media Output Score (MOS), to automatically measure the online media coverage of brands in real-time, combining brand objectives with target media, media visibility, media favorability, readership, and social amplification of news by individuals. Using the design science research methodology, this research includes a case study analyzing the media coverage of the three main Portuguese telecommunications brands during one year on ten digital media outlets. The use of MOS with the sample data proved to be a comprehensive and valid metric to measure the output performance of brands’ digital media coverage since it effectively combines all variables, providing a single metric that can be used to evaluate and compare the performance in this context. This article presents the development, the application, and the implications of the MOS, providing a new lens through which to view and assess media coverage.

1. Introduction

Media coverage is an omnipresent feature of modern life. It permeates newspapers, magazines, television, and online media and provides a vital source of information for public, corporate, and private audiences alike (Dyck and Zingales 2002).
As the primary conduit for communicating information about a company’s actions, media reports play an important role in reducing information asymmetry and building trust among stakeholders (Deephouse 2000).
Academic research has shown substantial evidence that media coverage is an important strategic asset (Deephouse 2000) that can significantly impact firm performance and valuation (Ahern and Sosyura 2014; Rogers et al. 2016), as well as resource allocation decisions (Desai 2014), investors’ trading patterns (Liu et al. 2014; Pollock and Rindova 2003), and customers’ buying behavior (Berger et al. 2010; Stephen and Galak 2012).
Usually, media coverage measurement involves quantifying the number of news stories about a particular company or estimating the potential number of people who have been exposed to the news (Watson and Noble 2014).
The importance of media coverage measurement has been widely recognized by communications professionals, as evidenced by the findings of a recent report by (PRWeek and Cision 2023). The measurement of media coverage has long been a key practice for public relations practitioners, offering valuable insights into public perceptions and the impact of communication initiatives (Michaelson and Macleod 2007). Studies have shown that media measurement provides valuable insights into how a brand or organization is perceived by the public, is relatively inexpensive and accessible, and has been used to demonstrate the value or influence of public relations activities (Eisenmann 2012).
In a digital context in which news is broadcast every minute, brands need to measure their media coverage in real-time using reliable metrics so that they can evaluate their media reputation, identify crises, and verify the results of their communication and media interaction initiatives.
The Internet has fundamentally changed the context in which people consume news (Messing and Westwood 2012). The evolution of online news consumption behaviors, such as recommending or sharing news articles, encourages scholars and practitioners to take new perspectives on news evaluation in the digital era. Given the important role of perceived news quality in the public’s message acceptance and decision-making (Sundar et al. 2007), understanding the factors that affect online news evaluations, as well as the underlying mechanisms, will provide scholars and practitioners with meaningful insights into how to understand news consumption and manage media messages in the digital era (Chung 2017).
For news organizations, the editorial analytics captured online in real time represent a significant improvement in understanding the media environment in which they operate and an important shift from a time in which newsrooms had far less analytic capability than other parts of their organization (Cherubini and Nielsen 2016). The idea of integrating analytics into daily editorial work and longer-term strategic planning has been central to US-based digital news start-ups like gawker, the Huffington Post, and BuzzFeed for years. These companies have from the start been proud of their ability to use a more data-informed and evidence-based approach to digital publishing than many older media and have drawn extensively on analytics developed in the technology sector, marketing, e-commerce, and advertising (Küng 2015; Petre 2015).
Measuring media coverage comprehensively and effectively poses a significant challenge. Unlike other marketing communications disciplines, public relations practitioners have consistently failed to achieve consensus on what the basic evaluative measures are or how to conduct the underlying research for evaluating and measuring public relations performance (Michaelson and Stacks 2011).
Over the past 40 years, multiple models for PR evaluation have been developed and widely discussed in various scientific articles, such as “Evaluating Public Relations: A Best Practice Guide to Public Relations Planning, Research, and Evaluation” (Watson and Noble 2007) and “Evaluating Public Communication: Exploring New Models, Standards, and Best Practice” (Macnamara 2017).
Academics and practitioners recognize evaluation as a major challenge, and since 2010, several initiatives have been launched to develop standards and best practices in PR evaluation—what one industry article calls the “march to (Marklein and Paine 2012) standards”. Recent significant steps include the adoption and promulgation of the AMEC Barcelona Principles, a set of guiding principles and best practices for measuring and evaluating public relations and communications efforts (AMEC-International Association for Measurement and Evaluation of Communication 2010, 2015, 2020), and the establishment of the Coalition for Public Relations Research Standards and the Social Media Measurement Standards Conclave in 2011 (Conclave on Social Media Measurement Standards 2011). These initiatives involved several professional organizations.
There is a distinction between measuring media coverage using media metrics and analyzing media coverage to extract insights. The scope of this work is the measurement of media coverage rather than analysis or evaluation.
While measurement are concerned with collecting and counting data in a quantifiable or numerical manner (Lindenmann 2003), evaluation is more subjective and requires interpretation and determination of whether communication activities are helping an organization meet its goals (Buhmann and Likely 2018; Lindenmann 2003).
It is not uncommon for public relations professionals to stop at the activity-level measurement stage, exemplifying what has been referred to as the public relations measurement stasis, in which professionals focus on output-level metrics (Macnamara 2017).
Recent studies have attempted to explain the public relations measurement stasis (Nothhaft and Stensson 2019; Romenti et al. 2019), which, without prejudice to requiring communication professionals to seek to evaluate the outcomes of their initiatives, also awakens the relevance of having output metrics that allow for objective and preferably real-time measurement of media coverage.
In the public relations measurement and evaluation literature, outcome metrics could measure:
  • Basic metadata include press clipping counts, target audience reach, and share of voice;
  • The audience action includes views, clickthrough, and tone;
  • The effects of public relations include awareness, attitudes, trust, reputation, and relationships. Those are still the most difficult to measure (Cutlip et al. 1985)
Academic and professional research has found that public relations practitioners measure the success of their communication initiatives through metrics at the level of outputs and outtakes (Arenstein 2019; Buhmann and Likely 2018; Schriner et al. 2017; Zerfass et al. 2017).
Metrics such as Frequency (also known as the number of articles in the media about a company), Reach (also known as the potential number of individuals exposed to articles about a company), Share of voice (also known as the percentage of a company’s articles compared to its competitors), or Tone (also known as whether media coverage is positive, neutral, or negative) are limited because they focus on the intermediary of a message (i.e., the media) and do not account for how the audience feels about the message or what they did after seeing it (Michaelson and Macleod 2007). However, the insights that can be extracted from media measurement are an important part of the public relations process and can be linked to business outcomes (Macnamara 2014).
According to public relations measurement models, such as the preparation, implementation, and impact (PII) model (Cutlip et al. 1985), the public relations effectiveness parameter (Lindenmann 1993), and the AMEC integrated evaluation framework (AMEC-International Association for Measurement and Evaluation of Communication 2016), measurement of public relations activities, such as media placement, is an essential part of the public relations measurement process.
Public relations practitioners often rely on production-level metrics to measure their performance or perceive positive media coverage as evidence of their success or proof of the value of public relations (Buhmann and Likely 2018; Buhmann and Brønn 2018; Zerfass et al. 2017). Even award-winning public relations campaigns emphasize these metrics (Schriner et al. 2017). Recognizing this measurement challenge in the profession, the Barcelona Principles recommend that public relations professionals measure not only the quantity but also the quality of media coverage. Stating that “overall clip counts and overall impressions are generally meaningless”, the Barcelona Principles explain that measurement of traditional media should also take into account “impressions among the stakeholder or target audience, the quality of media coverage, including but not limited to tone, credibility, and relevance of the medium to the stakeholder or audience, message delivery, inclusion of a third party or company spokesperson, and prominence as relevant to the medium” (AMEC-International Association for Measurement and Evaluation of Communication 2015).
Although discredited for measuring media coverage by professional organizations and scientific research, Advertising Value Equivalency (AVE) is still used by a significant number of communication professionals to report the results of their work. AVE is used in PR to measure the dollar value of media coverage of a PR campaign. AVE would measure the size of the media coverage and the space it was put in and calculate the advertising rate for a similar ad. (Pinkowska 2023). The Barcelona Principles, developed by the Association for the Measurement and Evaluation of Communication as a comprehensive model for measuring communications, state that AVEs “do not measure the value of PR or communication, media content, media achievement, etc.” (AMEC-International Association for Measurement and Evaluation of Communication 2010, 2015, 2020). Macnamara (2011), in the article “PR Metrics: How to measure Public Relations and Corporate Communication,” exposes the fundamental practical and ethical flaws in using equivalents to advertising value.
Despite extensive research illustrating the fundamental practical and ethical flaws in AVEs and condemnation from academics and practitioners, public relations professionals continue to use AVEs to supposedly measure the value of their work. This has led to a pressing need for a more robust, reliable, and standardized metric to measure the output of media coverage. In response to this need, this paper proposes the Media Output Score (MOS), a novel metric designed to objectively measure the digital media coverage output of brands in near real-time, as the central research problem.
MOS aims to help communication professionals measure on output-level their online media coverage, combining in one metric:
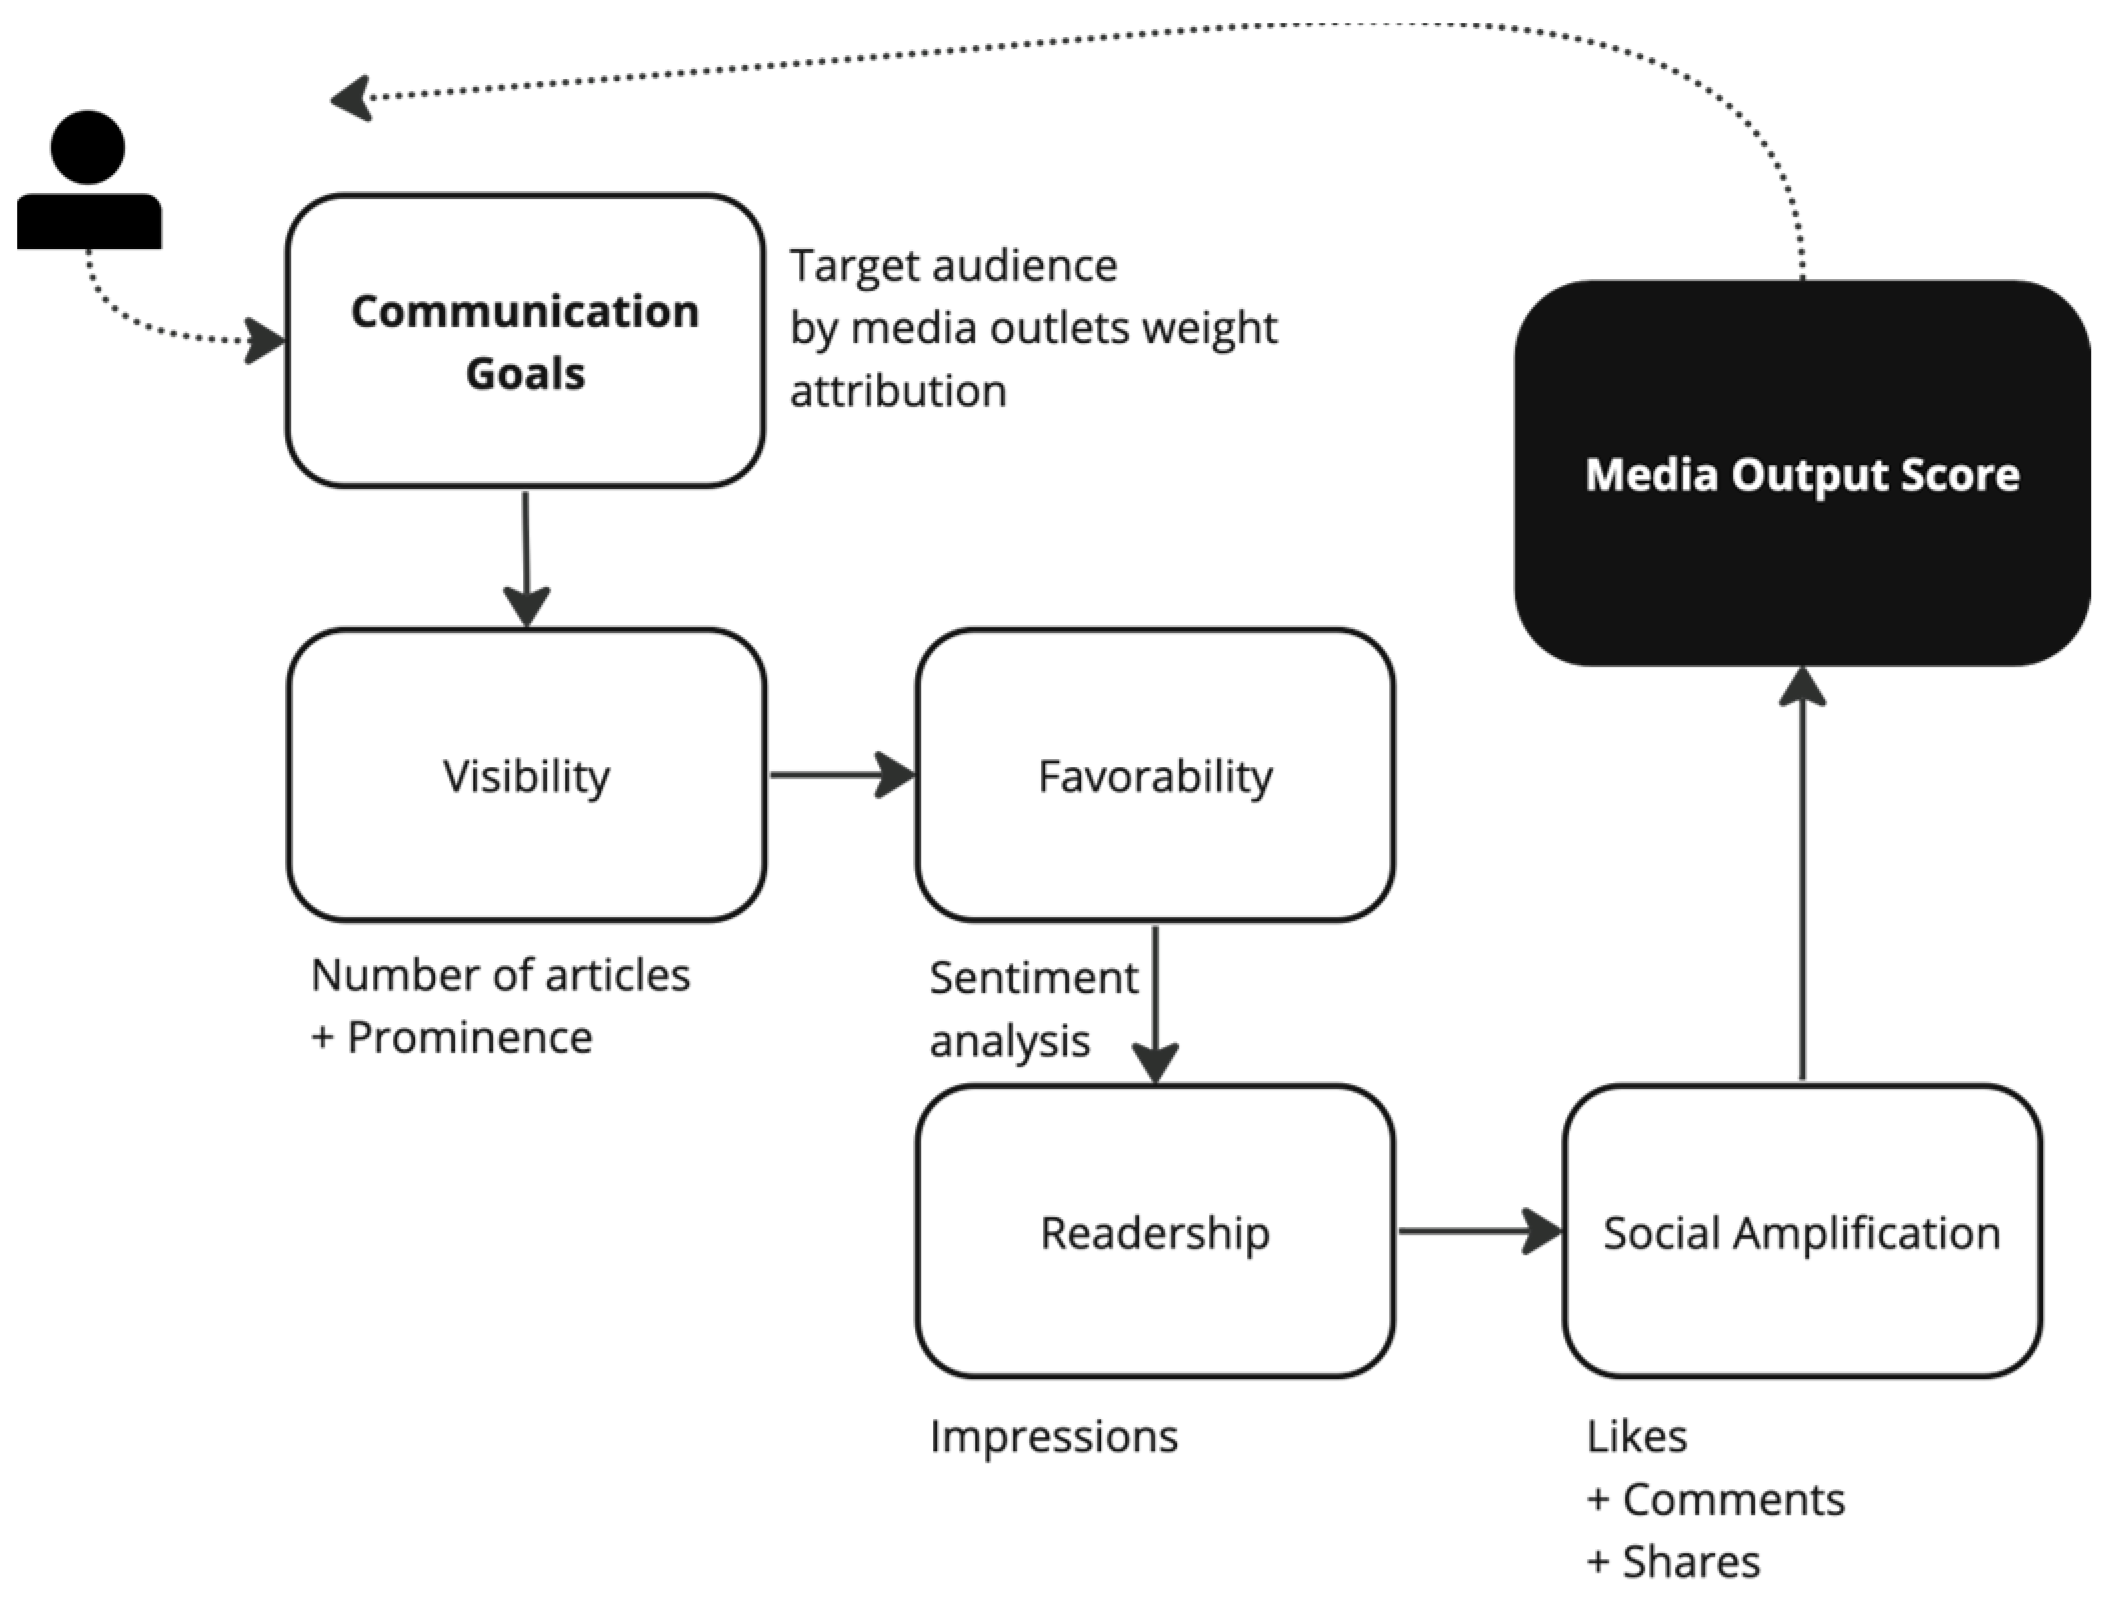
  • The brand and/or the communication objectives reflected in the target media definition and classification;
  • The analysis of media coverage takes into account the factors that, according to Zhang (2014), determine media reputation: media visibility and media favorability;
  • The readership of online media;
  • The social amplification of news by individuals through likes, comments, and shares on social networks.
The prototype metric will be tested by comparing the results of measuring the media performance of the three main Portuguese Telco brands during one year on the top ten digital media outlets that published more articles about the telecommunications industry.
This research will be conducted to answer the question: Can the output performance of digital media coverage of brands be measured with MOS?
We used Design Science Research (DSR) methodology to design a prototype to test the new metric to measure media coverage. Design Science Research (DSR) is a methodological approach focused on building artifacts to serve human purposes (Dresch et al. 2015). The prototype metric will be tested by comparing the results of measuring the media performance of the three main Portuguese Telecommunications brands during one year on the top ten digital media outlets that published more articles about the telecommunications industry.
This research aims to establish a connection between current scientific knowledge on the subject under study and the needs of the market, particularly for communication and marketing professionals.
The introduction of the MOS represents a significant step forward in the field of digital media coverage measurement. By providing a standardized measure, it offers a valuable tool for businesses to make informed decisions, develop effective communication strategies, and better understand the impact of their public relations activities. This paper will delve into the development and application of the Media Score, exploring its potential to transform the way we view and assess digital media coverage.

2. Materials and Methods

We adopted the Design Science Research (DSR) methodology to design the Media Output Score (MOS) algorithm. Design Science Research is a methodological approach focused on building artifacts to serve human purposes (Dresch et al. 2015). It is a problem-solving approach, a way of producing scientific knowledge involving the development of innovative solutions to solve real-world problems while also making a prospective scientific contribution. To solve the identified problem, our methodology involves a cyclical/agile design process, implementation, and evaluation, which allows for continuous improvement of the solution.
  • We identified a pertinent need for communication professionals to have a consensual and scientifically proven metric to measure the media coverage of brands. We conducted a thorough literature review to understand the existing research on media coverage measurement of brands connected with media reputation, as Deephouse (2000) defined it as the global evaluation of a company by the media.
  • We developed a set of design requirements for the algorithm. These requirements were based on our understanding of the problem and the existing research.
  • Based on the design requirements, we developed a prototype metric. We implemented the metric and tested it using real-world data. We collected data on media coverage for the telecommunications companies in Portugal for one year and submitted this sample to be measured by the new metric to measure their media coverage.
  • We evaluated the effectiveness of our metric by analyzing the results of the digital media coverage of the companies and, to substantiate the consistency of the metric, performing a regression analysis.

2.1. The Media Output Score Formulation Metrics

We formulated the Media Score based on the communication goals defined by targeting the media outlets depending on the message objectives and using the dimensions of media visibility, media favorability, media readership, and social engagement. Each of these dimensions was measured using a combination of traditional media metrics and social media metrics.

2.1.1. Communication Goals

The most recognized modern communication evaluation models, such as the evaluation model developed and used by the European Commission Directorate-General for Communication (European Commission 2015), the UK Government Communication Service Evaluation Framework (UK Government Communication Service 2015), or the AMEC Integrated Evaluation Framework (AMEC-International Association for Measurement and Evaluation of Communication 2016), are based on an initial definition of the communication objectives. Depending on each brand or organization’s strategy, the professional must define its communication objectives. These should be defined according to the scope of the analysis to be performed. This may have as its scope the evaluation of the brand’s annual communication plan, the launch of a certain product, a communication initiative, a crisis, etc. The maximum point to reach will thus be defined considering the communication objectives, and since it is a media coverage evaluation, it should focus on a prior classification of the relevance of each media outlet for the brand strategy, considering its influence, reach, and relevance to communicating the message intended by the brand.
The relevance of each media outlet varies depending on the target of the communication. Considering the brand’s communication objectives, communication professionals must pre-classify the relevance that each media outlet will have for the brand based on a detailed knowledge of its target audiences in conjunction with the target audiences that the brand proposes to reach. This way, the weight of each media outlet determined by each potential reach will be resized through a percentage allocation previously determined by the communication professional, who will establish which part of the potential audience of each media outlet should be considered as a measurement variable for the readership calculation.

2.1.2. Media Visibility

Manheim (2011) held that media visibility consists of two factors: attention and prominence. Attention will be measured based on frequency—the number of news stories about the brand.
Prominence will be measured per article using the scales of Bowen et al. (2005) and Distaso (2007):
  • is three when the subject appears in the title;
  • is two when the subject appears in the first paragraph;
  • is one when the subject appears in other parts of the text.

2.1.3. Media Favorability

Kiousis (2004) argued that media attention, prominence, and valence/tonality are three facets of media salience. Some studies have shown that media salience and tonality are interconnected. For example, Kiousis et al. (1999) argued that the tonality of news stories can affect the overall salience of objects. Zyglidopoulos and Georgiadis (2006) argued that media favorability must combine two key factors of news relevance: attention and prominence.
Zhang (2014) argues that, as defined by Deephouse (2000), media reputation is an overall assessment of companies’ media coverage, so media favorability should be only one of the aspects to consider for the assessment of media coverage; media visibility and recency are the other aspects to consider. Agenda-setting and Priming theories argue that these three factors will influence people’s perceptions simultaneously. Based on the interaction between media favorability, media visibility, and recency, Zhang (2014) developed a new measure of media reputation and used this measure to test the associations between media reputation and corporate reputation.
Content analysis is “the systematic, objective, and quantitative analysis of message characteristics” (Neuendorf 2017). It is one of the fundamental methods used in this study of agenda setting since media agendas can be perceived through this type of analysis (Mcquail and Windahl 1993).
From a detailed analysis of news content, media analysts can produce descriptive information about the main issues reported, the main sources cited, the main messages communicated to the public, and so on (Macnamara 2011).
Although most of the media reputation analysis studies consulted have used the human coding method in the content analysis process (Deephouse 1997, 2000; Einwiller et al. 2010; Fombrun and Shanley 1990; Kiousis et al. 2007; Meijer and Kleinnijenhuis 2006; Lee and Carroll 2011), some have also used computer-aided text analysis software to perform content analysis (Carroll 2004, 2009).
The media favorability index will be based on the measure developed by Meijer and Kleinnijenhuis (2006) that combines media favorability and media visibility. Depending on tone, the authors assigned +1, +0.5, 0, −0.5, and −1 when the news was positive, partially positive, neutral or balanced, partially negative, or negative, respectively, and summed the values as measures of media reputation.
To determine the favorability of each news item, we used an algorithm for sentiment analysis made available by the company Cision on its platform and later human-reviewed.
While trying to examine the causal impact of emotional language on news consumption through an analysis of a large dataset of more than 105,000 headlines that encompassed more than 370 million impressions of news stories from the website Upworthy.com, Robertson et al. (2023) found supporting evidence for a negativity bias hypothesis: news headlines containing negative language are significantly more likely to be clicked on, even after adjusting for the corresponding content of the news story. For a headline of average length (~15 words), the presence of a single negative word increased the clickthrough rate by 2.3%. In contrast, they found that news headlines containing positive language are significantly less likely to be clicked on. For a headline of average length, the presence of positive words in a news headline significantly decreases the likelihood of a headline being clicked on by around 1.0% (Robertson et al. 2023).
Based on these conclusions and to capture the increase in potential audience for negative news and decrease for positive news, the following correction was made to the scale initially proposed by Meijer and Kleinnijenhuis (2006): +0.98, +0.48, 0, −0.53, and −1.04, when the news was positive, partially positive, neutral, or balanced, partially negative, or negative.

2.1.4. Readership

Given the existing limitations to obtaining the reach of a particular online news story, a metric that would be extremely relevant to assessing its real impact on the audience, we chose to work with the potential reach of each media outlet to determine the potential reach of each published article. Thus, we used the Similar Web platform, which provides an API that allows us to collect, among other indicators, the number of monthly visits to a given website and the average number of pages visited by each user per visit.
Similar Web combines a mix of digital signals obtained from a variety of unique sources, allowing us to measure and map the digital world in a timely and comprehensive way. It uses data directly measured through first-party analytics (e.g., Google Analytics) of millions of websites and apps, publicly available data (e.g., Wikipedia, census data, etc.) algorithmically captured and indexed from billions of websites and apps, anonymous traffic data collected from Similar Web products installed on millions of devices worldwide, and Rich data pre-analyzed by global partners like DPSs, ISPs, measurement companies, and corporate intelligence firms (Similar Web n.d.).
To calculate the minimal potential readership of each news item, we combined the average number of visits to the website in a day divided by the total number of news items produced on average in a day by the website and multiplied by the average number of pages visited by each visitor, resulting in the following formula:
R e a d e r h i p = d v d a · p v
where dv = Media Outlet daily visits, da = Number of articles produced by the media outlet daily, and pv = number of pages per visit.

2.1.5. Social Engagement

The public plays a key role in the dissemination and evaluation of news content, and one of the big questions facing news organizations is what elements make content viral in the digital environment. Over the past 20 years, the digital revolution has changed distribution and communication practices between news organizations and the public. Social media platforms have played a prominent role in connecting news outlets to increasingly social and participatory online audiences (García-Perdomo et al. 2018).
Social media metrics (i.e., how many people recommended or shared a news story) serve as a good example for other readers’ feedback on specific news stories. Many people indeed view social media metrics as an indication of other readers’ endorsements of a specific news story (Chung 2017). Typically displayed alongside online news stories, social media metrics provide indications of the popularity or virality of a specific news story (Stavrositu and Kim 2014; Lee-Won et al. 2016).
Clicking, sharing, liking, and commenting on social media are powerful forms of distribution (Tenenboim and Cohen 2015) that privilege and challenge news values, as one-third of Internet users participate in the creation of news dissemination through social media (Purcell et al. 2010).
For this reason, we decided to add to the Readership Potential a surcharge that could oversize its final score, depending on the social engagement achieved.
To calculate social engagement, we used the Buzzsumo software, which provides social amplification metrics for news articles in real-time. Buzzsumo software allows to obtain in real time the number of total interactions with a given online news story, adding engagement within multiple social networks such as X/Twitter, Facebook, Pinterest, and other social networks (BuzzSumo n.d.). We considered the total interactions (Likes, Comments, and Shares) during the seven days after the article’s publication as the reference metric.
The total engagement will be used as an oversizing factor multiplied by 10.

2.2. The Media Output Score (MOS)

Conjugating the objectives of media outlet tier classification, media visibility, media favorability, readership, and social engagement, MOS will be attributed linearly to each news item and cumulatively to a set of news items, being the metric that will be the basis of the digital media coverage measurement that this work intends to present (see Figure 1).
To allow MOS to be compared across multiple geographies and compare the impact on different target audiences according to their demographic reach, we chose to scale the potential number of individuals who read the news story and the social interaction oversizing factor.
The sum of readership and social engagement must also be scaled according to the objectives defined for communication through the percentage weights previously assigned by the communication professional.
So that the MOS can be used and cross-referenced in multiple geographies and compare the impact on different target audiences according to their demographic reach, we chose to dimension the potential number of individuals who read the news considering the dominant target population of the media organization under analysis. Thus, the Potential Readership on target, after being oversized with Social Engagement and weighted accordingly to the communication goals, is divided by the target population of the country under analysis and multiplied by 100.
The MOS per article is then calculated using the following formula:
M O S = p · ( r + s ) · o w c p · f · 100
where p = prominence (1, 2, or 3), r = readership, s = social engagement, ow = media outlet weight, f = favorability (+0.98, +0.48, 0, −0.53, and −1.04), and cp = target country population.
To calculate the MOS for a group of articles, the formula should be multiplied by the number of articles.

3. Results

To demonstrate the Media Score metric with a practical case, we used a dataset with all the news broadcasted on Portuguese websites with mentions of the brands Altice, NOS, and Vodafone (the largest operators in the Telco market in Portugal). The dataset was selected by Cision, a worldwide leader company providing software and services for communication professionals (Cision n.d.), using keyword search and artificial intelligence (AI) to identify relevant coverage about these brands from a database containing all articles published by online Portuguese media in the period between 1 January and 31 December 2022.

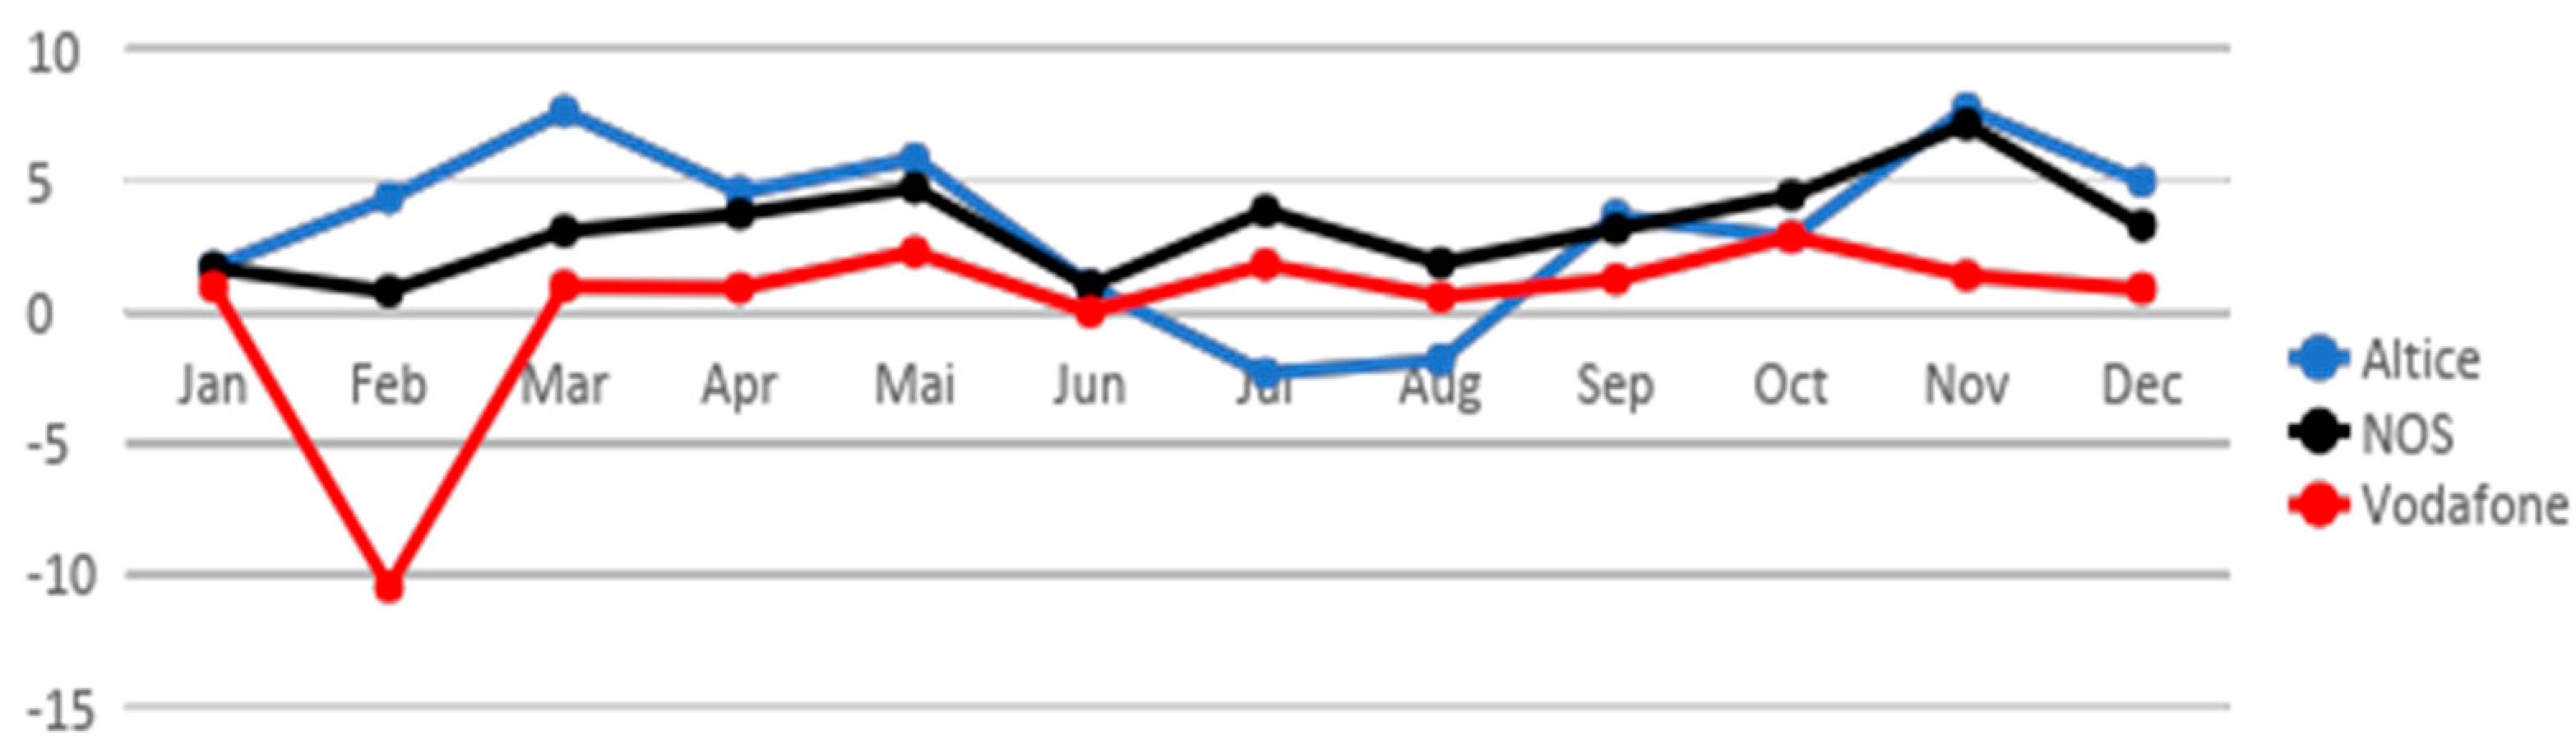
3.1. Sample Definition

During the year 2022, a total of 36,937 records of references to these brands were identified and distributed as follows:
  • Altice, 13,877 mentions;
  • NOS, 13,279 mentions;
  • Vodafone, 9781 mentions.
For the case study, the 10 online media outlets that carried the most news about the three operators were selected to be the sample and returned:
  • Altice, 2673 mentions;
  • NOS, 2556 mentions;
  • Vodafone, 1668 mentions.

3.2. Communication Goals and Target Audience

The target geographic scope of this study, considering the Telecom industry, was defined as the Portuguese population over 14 years of age, in a total universe of 8,988,124 individuals.
The brand’s communication goals were defined as contact with the target population, and weights were assigned to the media, considering their ability to influence the target population, particularly regarding decision makers for the choice of the telecom operator in Portugal.
In this way, the attribution of weights was defined based on prior knowledge of the influence of each media outlet selected for the sample by a Cision specialist in communication analysis of the telecommunications sector in Portugal.
The readership of each of the selected media outlets was determined based on total monthly visits, the average number of news articles consulted, and the average number of news articles published daily.
In Table 1, we can see the results from the media analyzed and their respective weights according to the following variables:
Media Outlets. Media selected for the analysis sample according to the criteria of the 10 media outlets that made the most mentions to the three telecommunication market players.
Number of articles. Number of articles with mentions to the three brands under analysis (Altice, NOS, and Vodafone) during the year 2022.
Daily Visitors. Number of daily visitors to the media website according to Similar Web.
Pages per visit. The average number of pages visited on each website by its total visitors.
Average daily articles published. Number of articles published on average per day on each website based on the count of total posts shared in the week between 1 and 7 May 2023, a random week selected to calculate the average post frequency per website.
Readership. Estimated number of impressions per news item according to the methodology described above.
Weight for Telco. Percentage weight of each website for the industry according to industry information analysis specialists.
Telco Readership on Target. Readership that will be considered for MOS calculation, considering the relevance of the media outlet to the Telecommunications industry in Portugal.

3.3. Results Report

The results of applying the variables under study to the dataset can be seen in the results summary table (Table 2), with the key performance indicators resulting from each of the metrics under analysis, namely:
  • Brands. Major telecommunications brand players are operating in Portugal.
  • Frequency. The total number of news items with mentions of each brand was analyzed.
  • Share your Voice. Percentage share of each brand, based on frequency.
  • Readership. The total number of impressions of each brand is based on the sum of all news items in which it was mentioned.
  • Engaged. Total number of interactions (Likes, Shares, and Comments) on social networks verified from the news where each one of the brands was mentioned.
  • Favorability. Average favorability is determined according to the sentiment of each news item towards the brand, on a scale between −1.04 and +0.98. The news sentiment towards the brands was determined through a classification of +0.98, +0.48, 0, −0.53, and −1.04 when the news was positive, partially positive, neutral, balanced, partially negative, or negative.
  • Media Output Score. The new quantitative and qualitative metric is projected to measure the effect on the Portuguese population, considering that this is an analysis of the Telco market in Portugal, the media outlets tier classification, media visibility, media favorability, readership, and social engagement, according to the formula presented in the section before.
Comparing individually all the metrics, it is possible to verify that the introduction of the qualitative component marked by Favorability in the MOS calculation basis allows demonstrating the effects of negative favorability on the brands’ performance.
In linear observation, it is possible to establish total parallelism between frequency, share of voice, readership, and engagement.
When introducing the qualitative effect of favorability that underlies the MOS metric, it is possible to see a strong penalization of the Vodafone brand result determined by the effect of the negative sentiment news in which it was mentioned, which caused its MOS to drop to a much lower result than the other brands.
This combination gives this new metric a fundamental qualitative dimension to evaluate the output of media coverage and to understand that negative news has a penalizing effect on the communicational performance of brands.
In the following table, we can better understand in detail the effect of each of the favorability brands on their total performance.
In Table 3, it is possible to understand that despite all brands having considerable unfavorable MOS and Altice being the most penalized brand with negative information, both Altice and NOS managed to counteract this trend by creating favorable stories that allowed them to achieve considerable positive results. On the other hand, Vodafone, despite also creating positive stories, was not as effective in countering the inherent negative trend, which gave it the worst performance result among the three brands.
In a monthly evolution for each brand (see Figure 2), the Media Output Score reveals a great capacity to highlight and follow negative and positive trends, as can be seen in the crisis identified in February with the Vodafone brand and with the excellent communicational performance of the Altice brand in March and the Altice and NOS brands in November.
In an analysis of the MOS of the brands in each of the media outlets studied (see Table 4), it is possible to see the relevance of Sapo to the performance of the Altice brand. This media clearly reveals a great attention towards the Altice brand, visible through a MOS of 39 only in this media outlet and a clearly favorable trend.
This fact does not reveal that it is casual, since we know that the Sapo media outlet is owned by the company Altice, so this result clearly reveals the strategy of the brand Altice to communicate in a favorable way through this medium, where it can control its message.
This conclusion gives the new MOS a great capacity to identify communication strategies through the evaluation of the detailed performance of each brand.
In an article-by-article analysis, MOS allows you to demonstrate the relevance of each news item compared to the others, which is very useful to have an immediate perception of the impact of an individual news item.
Through the multiplication of the absolute value that results from the quantitative formula by the defined qualitative weights, news of neutral or balanced favorability results in a 0 MOS, which makes the neutral/balanced effect nullified in terms of media coverage value.
Comparing the news item with the highest MOS with the news item with the lowest MOS in this study, it is possible to understand the pre-classification weight of the media outlets according to their relevance to the industry, the prominence, readership, and engagement achieved, and their positive or negative tone-dependent determination (see Table 5).

4. Discussion

The goal of this research is to propose a new output-level metric that would allow the integration of quantitative and qualitative variables and that was based on the bibliographic research carried out on the most recent works with output evaluation metrics of media coverage measurement and media reputation.
As an answer to this research question, “Can the output performance of online media coverage of brands be measured with one metric that combines brand objectives, media targeting, visibility, favorability, readership, and social amplification?” based on the analysis presented, we can conclude that the MOS metric is a comprehensive approach for measuring the online output performance of brands’ digital media coverage, as it effectively combines brand objectives, media targeting, visibility, favorability, readership, and social amplification, providing a single metric that can be used to evaluate and compare the performance of brands in this context. The MOS metric demonstrates consistency in combining the quantitative and qualitative performance of brands, bringing a combination between media performance and media reputation and offering a coherent and simple measure of media coverage performance, either news by news item or in an integrated way for a set of news items.
The MOS addresses the limitations of traditional metrics such as AVE, providing a more holistic understanding of media coverage. By enabling businesses to make informed decisions and develop effective communication strategies, the Media Output Score can significantly contribute to brand management and public relations practices.
Stronger metrics and the use of insights generated through strategic media coverage monitoring are key challenges in the public relations profession (Zerfass et al. 2017) because they will enable public relations practitioners to contribute more meaningful and actionable recommendations to their stakeholders.
However, reflecting on the findings of this research, it is important to note that communication professionals must accept and understand that output-level metrics are only one part of measuring the effects of media coverage. They should take a reading of these metrics that explores the narrative behind the numbers.
All communication output-level metrics should be complemented with metrics evaluating outcomes and outtakes. Only in this way will it be possible to establish an integrated evaluation matrix that allows for effective management of the results of media coverage on corporate reputation.
This study had several limitations. The first limitation is the generalizability of the findings. It was focused on the Portuguese Telco industry. The applicability of the new metric may vary across industries and geographies, and further testing is necessary to generalize the findings of this study. Therefore, conclusions for other industries do not start from verified assumptions. The second limitation is related to the determination of the media weights for the industry. Even if it was determined by a professional with experience in information analysis, it is considered that for better framing of objectives, this assignment should be made by each user of the metric, adapting their communication objectives to the measurement.
The third limitation is related to the automatic sentiment analysis attribution. Sometimes sentiment algorithms lead to incorrect attributions of news sentiment towards brands. To overcome this limitation, the analysis was reviewed and improved by the researchers, changing the automatically assigned sentiment whenever it was not correct. This revision allowed for greater reliability in the results, but in the context of automatic and real-time evaluation of the communication, it would not be possible.
The fourth limitation was the readership estimation. Readership was calculated using a weighting based on the website audience and not necessarily on the actual impressions of each news item, which did not allow us to determine exactly what the readership of each news item was but only its potential. Similar Web recently made available a feature that allows you to know the number of impressions per URL, which may improve this limitation for future research.
As the first research using the Media Output Score, the last limitation is that its support base for the new metric is limited, which leaves room for future research.
Further research and application in diverse contexts will be necessary to fully understand and optimize MOS potential, and it could be focused on testing the statistical consistency of MOS across variables using a regression analysis and applying the MOS to different communication objectives, industries, geographical locations, and media platforms to further validate its effectiveness and versatility.
The possible integration of this new metric into media coverage measurement software to be available to communication professionals could quickly provide a credible test background that would allow for consolidation of the new metric, benchmarking, and feedback from professionals.
In a rapidly evolving media landscape, the Media Score represents a significant step forward, offering a new lens through which to view and assess media coverage. We hope that this metric will be widely adopted by communication professionals, contributing to more effective and impactful communication strategies.

Author Contributions

Conceptualization, U.O.; methodology, U.O.; software, U.O.; validation, U.O., C.S. and M.R.T.; for-mal analysis, U.O.; investigation, U.O.; resources, U.O.; data curation, U.O.; writing—original draft preparation, U.O.; writing—review and editing, U.O., C.S. and M.R.T.; visualization, U.O.; supervision, C.S. and M.R.T.; project administration, M.R.T.; funding acquisition, U.O. All authors have read and agreed to the published version of the manuscript.

Funding

This research received no external funding.

Informed Consent Statement

Not applicable.

Data Availability Statement

Due to privacy concerns data cannot be shared.

Acknowledgments

This research was enriched by a researcher from the Intelligent Sensing and Ubiquitous Systems (ISUS) at Fundação Ensino e Cultura Fernando Pessoa, in collaboration with the Artificial Intelligence and Computer Science Laboratory (LIACC).

Conflicts of Interest

The authors declare no conflict of interest.

References

  1. Ahern, Kenneth R., and Denis Sosyura. 2014. Who Writes the News? Corporate Press Releases during Merger Negotiations. The Journal of Finance 69: 241–91. [Google Scholar] [CrossRef]
  2. AMEC-International Association for Measurement and Evaluation of Communication. 2010. Barcelona Declaration of Measurement Principles. AMEC (Blog). Available online: https://amecorg.com/2012/06/barcelona-declaration-of-measurement-principles/ (accessed on 1 October 2023).
  3. AMEC-International Association for Measurement and Evaluation of Communication. 2015. Barcelona Principles 2.0. AMEC (Blog). Available online: https://amecorg.com/barcelona-principles-2-0/ (accessed on 1 October 2023).
  4. AMEC-International Association for Measurement and Evaluation of Communication. 2016. AMEC’s New Integrated Evaluation Framework. AMEC Integrated Evaluation Framework. Available online: https://amecorg.com/amecframework/ (accessed on 1 October 2023).
  5. AMEC-International Association for Measurement and Evaluation of Communication. 2020. Barcelona Principles 3.0. AMEC (Blog). Available online: https://amecorg.com/barcelona-principles-3-0-translations/ (accessed on 1 October 2023).
  6. Arenstein, Seth. 2019. Measurement’s Biggest Obstacle? Getting Budget for Analytics Tools. PRNEWS. October 1. Available online: https://www.prnewsonline.com/measurement-Intrado-survey/ (accessed on 1 October 2023).
  7. Berger, Jonah, Alan T. Sorensen, and Scott J. Rasmussen. 2010. Positive Effects of Negative Publicity: When Negative Reviews Increase Sales. Marketing Science 29: 815–27. [Google Scholar] [CrossRef]
  8. Bowen, Robert M., Angela K. Davis, and Dawn A. Matsumoto. 2005. Emphasis on Pro Forma versus GAAP Earnings in Quarterly Press Releases: Determinants, SEC Intervention, and Market Reactions. The Accounting Review 80: 1011–38. [Google Scholar] [CrossRef]
  9. Buhmann, Alexander, and Fraser Likely. 2018. Evaluation and Measurement in Strategic Communication. In The International Encyclopedia of Strategic Communication. Malden: Wiley-Blackwell. Available online: https://www.academia.edu/download/55887108/Buhmann_Likely_2018_Evaluation_in_Strategic_Communication.pdf (accessed on 1 October 2023).
  10. Buhmann, Alexander, and Peggy Simcic Brønn. 2018. Applying Ajzen’s Theory of Planned Behavior to Predict Practitioners’ Intentions to Measure and Evaluate Communication Outcomes. Corporate Communications: An International Journal 23: 377–91. [Google Scholar] [CrossRef]
  11. BuzzSumo. n.d. BuzzSumo Chrome Extension|Performance Data As You Browse. BuzzSumo.Com. Available online: https://buzzsumo.com/blog/chrome-extension/ (accessed on 12 November 2023).
  12. Carroll, Craig E. 2004. How the Mass Media Influence Perceptions of Corporate Reputation: Exploring Agenda-setting Effects within Business News Coverage—ProQuest. Available online: https://www.proquest.com/openview/78909c3e696337a7a0befca7b1b15483/1?pq-origsite=gscholar&cbl=18750&diss=y (accessed on 1 October 2023).
  13. Carroll, Craig E. 2009. The Relationship between Firms’ Media Favorability and Public Esteem. Public Relations Journal 3: 1–32. [Google Scholar]
  14. Cherubini, Federica, and Rasmus Kleis Nielsen. 2016. Editorial Analytics: How News Media Are Developing and Using Audience Data and Metrics. SSRN Scholarly Paper. Rochester: Reuters Institute for Study of Journalism, University of Oxfordublic Relations Society of America. [Google Scholar] [CrossRef]
  15. Chung, Myojung. 2017. The Role of Social Media Metrics in Online News Evaluation. Computers in Human Behavior. [Google Scholar] [CrossRef]
  16. Cision. n.d. Cision—Global Cloud-Based Communications and PR Solutions Leader. Cision. Available online: https://www.cision.com/about/ (accessed on 12 November 2023).
  17. Conclave on Social Media Measurement Standards. 2011. Reach & Impressions. Smmstandards. Available online: https://smmstandards.wixsite.com/smmstandards/reach-and-impressions (accessed on 1 October 2023).
  18. Cutlip, Scott M., Allen H. Cente, and G. Broom. 1985. Effective Public Relations. Englewood Cliffs: Prentice-Hall International. [Google Scholar]
  19. Deephouse, David L. 1997. How Do Reputations Affect Corporate Performance?: The Effect of Financial and Media Reputations on Performance. Corporate Reputation Review 1: 68–72. [Google Scholar] [CrossRef]
  20. Deephouse, David L. 2000. Media Reputation as a Strategic Resource: An Integration of Mass Communication and Resource-Based Theories. Journal of Management 26: 1091–112. [Google Scholar] [CrossRef]
  21. Desai, Vinit M. 2014. The Impact of Media Information on Issue Salience Following Other Organizations’ Failures. Journal of Management 40: 893–918. [Google Scholar] [CrossRef]
  22. Distaso, Marcia. 2007. Corporate Intermedia Agenda-Setting Power: Impression Management Use of pro Forma Earnings and Tone—University of Miami. University of Miami. Available online: https://scholarship.miami.edu/esploro/outputs/doctoral/Corporate-intermedia-agenda-setting-power-Impression-management-use-of-pro-forma-earnings-and-tone/991031447587202976 (accessed on 1 October 2023).
  23. Dresch, Aline, Daniel Pacheco Lacerda, and José Antônio Valle Antunes. 2015. Design Science Research. In Design Science Research: A Method for Science and Technology Advancement. Edited by Aline Dresch, Daniel Pacheco Lacerda and José Antônio Valle Antunes Jr. Cham: Springer International Publishing, pp. 67–102. [Google Scholar] [CrossRef]
  24. Dyck, Alexander, and Luigi Zingales. 2002. The Corporate Governance Role of the Media. Working Paper, Working Paper Series; Cambridge, MA: National Bureau of Economic Research. [Google Scholar] [CrossRef]
  25. Einwiller, Sabine A., Craig E. Carroll, and Kati Korn. 2010. Under What Conditions Do the News Media Influence Corporate Reputation? The Roles of Media Dependency and Need for Orientation. Corporate Reputation Review 12: 299–315. [Google Scholar] [CrossRef]
  26. Eisenmann, Marianne. 2012. Proposed Interim Standards for Metrics in Traditional Media Analysis. Institute for Public Relations. Measurement Comission. Available online: https://instituteforpr.org/wp-content/uploads/Traditional-media-standards-6-12-12-v-2.pdf (accessed on 1 October 2023).
  27. European Commission. 2015. Toolkit for the Evaluation of Communication Activities. Available online: https://commission.europa.eu/system/files/2019-10/communication-evaluation-toolkit_en.pdf (accessed on 1 October 2023).
  28. Fombrun, Charles, and Mark Shanley. 1990. What’s in a Name? Reputation Building and Corporate Strategy. Academy of Management Journal 33: 233–58. [Google Scholar] [CrossRef]
  29. García-Perdomo, Víctor, Ramón Salaverría, Danielle K. Brown, and Summer Harlow. 2018. To Share or Not to Share. Journalism Studies 19: 1180–201. [Google Scholar] [CrossRef]
  30. Kiousis, Spiro. 2004. Explicating Media Salience: A Factor Analysis of New York Times Issue Coverage During the 2000 U.S. Presidential Election. Journal of Communication 54: 71–87. [Google Scholar] [CrossRef]
  31. Kiousis, Spiro, Cristina Popescu, and Michael Mitrook. 2007. Understanding Influence on Corporate Reputation: An Examination of Public Relations Efforts, Media Coverage, Public Opinion, and Financial Performance From an Agenda-Building and Agenda-Setting Perspective. Journal of Public Relations Research 19: 147–65. [Google Scholar] [CrossRef]
  32. Kiousis, Spiro, Philemon Bantimaroudis, and Hyun Ban. 1999. Candidate Image Attributes: Experiments on the Substantive Dimension of Second Level Agenda Setting. Communication Research 26: 414–28. [Google Scholar] [CrossRef]
  33. Küng, Lucy. 2015. Innovators in Digital News. I.B. Tauris & Co. Ltd. in association with the Reuters Institute for the Study of Journalism. London: University of Oxford. [Google Scholar]
  34. Lee, Sun Young, and Craig E. Carroll. 2011. The Emergence, Variation, and Evolution of Corporate Social Responsibility in the Public Sphere, 1980–2004: The Exposure of Firms to Public Debate. Journal of Business Ethics 104: 115–31. [Google Scholar] [CrossRef]
  35. Lee-Won, Roselyn J., Melissa M. Abo, Kilhoe Na, and Tiffany N. White. 2016. More Than Numbers: Effects of Social Media Virality Metrics on Intention to Help Unknown Others in the Context of Bone Marrow Donation. Cyberpsychology, Behavior, and Social Networking 19: 404–11. [Google Scholar] [CrossRef]
  36. Lindenmann, Walter K. 1993. An ‘Effectiveness Yardstick’ to Measure Public Relations Success. Public Relations Quarterly 38: 7. [Google Scholar]
  37. Lindenmann, Walter K. 2003. Guidelines for Measuring the Effectiveness of PR Programs and Activities; Institute for Public Relations. Available online: https://www.instituteforpr.org/wpcontent/uploads/2002_MeasuringPrograms.pdf (accessed on 1 October 2023).
  38. Liu, Laura Xiaolei, Ann E. Sherman, and Yong Zhang. 2014. The Long-Run Role of the Media: Evidence from Initial Public Offerings. Management Science 60: 1945–64. [Google Scholar] [CrossRef]
  39. Macnamara, Jim. 2011. PR Metrics: How to Measure Public Relations and Corporate Communication. AMEC (International Association for Measurement and Evaluation of Communication). Available online: https://www.researchgate.net/publication/265317712_PR_Metrics_How_to_Measure_Public_Relations_and_Corporate_Communication (accessed on 1 October 2023).
  40. Macnamara, Jim. 2014. The ‘Toe Bone to the Head Bone’ Logic Model to Connect Public Relations and Corporate Communication to Organisation Outcomes. Available online: https://opus.lib.uts.edu.au/handle/10453/36217 (accessed on 1 October 2023).
  41. Macnamara, Jim. 2017. Evaluating Public Communication: Exploring New Models, Standards, and Best Practice. New York: Routledge. [Google Scholar]
  42. Manheim, Jarol. 2011. A Model of Agenda Dynamics. In Communication Yearbook 10. New York: Routledge. [Google Scholar] [CrossRef]
  43. Marklein, Tim, and Katie Paine. 2012. The March to Standards. Paper Presented at the 4th European Summit on Measurement, Dublin, Ireland, June 13–15; Available online: http://amecorg.com/downloads/dublin2012/The-March-to-Social-Standards-Tim-Marklein-and-Katie-Paine.pdf (accessed on 1 October 2023).
  44. Mcquail, Denis, and Sven Windahl. 1993. Communication Models for the Study of Mass Communications. London: Routledge. [Google Scholar]
  45. Meijer, May-May, and Jan Kleinnijenhuis. 2006. Issue News and Corporate Reputation: Applying the Theories of Agenda Setting and Issue Ownership in the Field of Business Communication. Journal of Communication 56: 543–59. [Google Scholar] [CrossRef]
  46. Messing, Solomon, and Sean Westwood. 2012. How Social Media Introduces Biases in Selecting and Processing News Content. ResearchGate. Available online: https://www.researchgate.net/profile/Solomon-Messing/publication/265673993_How_Social_Media_Introduces_Biases_in_Selecting_and_Processing_News_Content/links/54d8e9620cf2970e4e7a399b/How-Social-Media-Introduces-Biases-in-Selecting-and-Processing-News-Content.pdf (accessed on 1 October 2023).
  47. Michaelson, David, and Don W. Stacks. 2011. Standardization in Public Relations Measurement and Evaluation. Public Relations Journal 5.2: 1–22. [Google Scholar]
  48. Michaelson, David, and Sandra Macleod. 2007. The Application of ‘Best Practices’ In Public Relations Measurement and Evaluation Systems. Public Relations Journal 1: 1–14. [Google Scholar]
  49. Neuendorf, Kimberly A. 2017. The Content Analysis Guidebook. Thousand Oaks: SAGE. [Google Scholar]
  50. Nothhaft, Howard, and Hanna Stensson. 2019. Explaining the Measurement and Evaluation Stasis: A Thought Experiment and a Note on Functional Stupidity. Journal of Communication Management 23: 213–27. [Google Scholar] [CrossRef]
  51. Petre, Caitlin. 2015. The Traffic Factories: Metrics at Chartbeat, Gawker Media, and The New York Times. New York: Tow Center for Digital Journalism, Columbia University. [Google Scholar] [CrossRef]
  52. Pinkowska, Marta. 2023. How to Calculate Advertising Value Equivalency (AVE)?|Brand24. Brand24 (Blog). January 21. Available online: https://brand24.com/blog/advertisement-value-equivalency/ (accessed on 1 October 2023).
  53. Pollock, Timothy G., and Violina P. Rindova. 2003. Media Legitimation Effects in the Market for Initial Public Offerings. Academy of Management Journal 46: 631–42. [Google Scholar] [CrossRef]
  54. PRWeek and Cision. 2023. 2023 PRWeek/Cision Global Comms Report, Free Cision eBook. Available online: https://pr-resources.prweek.com/free/w_cisi16/ (accessed on 1 October 2023).
  55. Purcell, Kristen, Lee Rainie, Amy Mitchell, Tom Rosenstiel, and Kenny Olmstead. 2010. Understanding the Participatory News Consumer. Pew Research Center 1: 19–21. [Google Scholar]
  56. Robertson, Claire E., Nicolas Prõllochs, Kaoru Schwarzenegger, Philip Pãrnamets, Jay Bavel, and Stefan Feuerriegel. 2023. Negativity Drives Online News Consumption. Nature Human Behaviour 7: 812–22. [Google Scholar] [CrossRef]
  57. Rogers, Jonathan L., Douglas J. Skinner, and Sarah L. C. Zechman. 2016. The Role of the Media in Disseminating Insider-Trading News. Review of Accounting Studies 21: 711–39. [Google Scholar] [CrossRef]
  58. Romenti, Stefania, Grazia Murtarelli, Angelo Miglietta, and Anne Gregory. 2019. Investigating the Role of Contextual Factors in Effectively Executing Communication Evaluation and Measurement: A Scoping Review. Journal of Communication Management 23: 228–45. [Google Scholar] [CrossRef]
  59. Schriner, Maureen, Rebecca Swenson, and Nathan Gilkerson. 2017. Outputs or Outcomes? Accessing Public Relations Evaluation Practices in Award-Winning PR Campaigns. Public Relations Journal. Available online: https://prjournal.instituteforpr.org/wp-content/uploads/Outputs-OutcomesSilver-Anvil-1.pdf (accessed on 1 October 2023).
  60. Similar Web. n.d. Our Data|Similarweb. Available online: https://www.similarweb.com/corp/ourdata/ (accessed on 12 November 2023).
  61. Stavrositu, Carmen D., and Jinhee Kim. 2014. Social Media Metrics: Third-Person Perceptions of Health Information. Computers in Human Behavior 35: 61–67. [Google Scholar] [CrossRef]
  62. Stephen, Andrew T., and Jeff Galak. 2012. The Effects of Traditional and Social Earned Media on Sales: A Study of a Microlending Marketplace. Journal of Marketing Research 49: 624–39. [Google Scholar] [CrossRef]
  63. Sundar, S. Shyam, Silvia Knobloch-Westerwick, and Matthias R. Hastall. 2007. News Cues: Information Scent and Cognitive Heuristics. Journal of the American Society for Information Science and Technology 58: 366–78. [Google Scholar] [CrossRef]
  64. Tenenboim, Ori, and Akiba Cohen. 2015. What Prompts Users to Click and Comment: A Longitudinal Study of Online News. Journalism 16: 198–217. [Google Scholar] [CrossRef]
  65. UK Government Communication Service. 2015. Monitoring and Evaluating Government Communications Activity. GCS. Available online: https://gcs.civilservice.gov.uk/guidance/strategic-communication/evaluation/ (accessed on 1 October 2023).
  66. Watson, Tom, and Paul Noble. 2007. Evaluating Public Relations: A Best Practice Guide to Public Relations Planning, Research and Evaluation. London: Kogan Page Publishers. [Google Scholar]
  67. Watson, Tom, and Paul Noble. 2014. Evaluating Public Relations: A Guide to Planning, Research and Measurement. London: Kogan Page Publishers. [Google Scholar]
  68. Zerfass, Ansgar, Dejan Verčič, and Sophia Charlotte Volk. 2017. Communication Evaluation and Measurement: Skills, Practices and Utilization in European Organizations. Corporate Communications: An International Journal 22: 2–18. [Google Scholar] [CrossRef]
  69. Zhang, Xiaoqun. 2014. Measurements of Media Reputation of Firms. College of Bowling Green. Available online: https://www.proquest.com/openview/913c1a021e9de73ed7075fef0529aa6d/1?pq-origsite=gscholar&cbl=18750 (accessed on 1 October 2023).
  70. Zyglidopoulos, Stelios C., and Andreas P. Georgiadis. 2006. Media Visibility as a Driver of Corporate Social Performance. Available online: https://www.jbs.cam.ac.uk/wp-content/uploads/2020/08/wp0616.pdf (accessed on 1 October 2023).
Figure 1. The MOS metric formulation.
Journalmedia 05 00003 g001
Figure 2. Monthly Media Output Score during 2022.
Journalmedia 05 00003 g002
Table 1. Data from the Media analyzed and respective weights.
Media OutletNumber of ArticlesDaily VisitorsPages per VisitAverage Daily Articles PublishedReadershipWeight for TelcoTelco Readership on Target
Sapo 2699282,0864.65147892340%3569
Notícias ao Minuto 1913960,3711.92500368830%1106
Jornal Económico 1644182,4902.6795512970%3590
Dinheiro Vivo 153969,3091.9850274580%2196
ECO—Economia 1534143,5011.6959411080%3288
Negócios 1348210,2612.0394454180%3633
Observador 859440,9542.26210474690%4271
Expresso 856499,8621.91178117100%8117
Executive Digest 77867,9821.9648277680%2221
RTP 763436,5472.99247528560%3171
Visão 736119,1141.93125183970%1287
Table 2. Key Performance Indicators were calculated for the period between 1 January and 1 December 2022.
BrandsFrequency (Articles)Share of Voice (%)Readership
(Impressions)
Engaged (Interactions)Favorability (Avg)MOS
Altice267339%17,159,197139,6370.2140
NOS255637%14,367,16584,0100.2239
Vodafone166824%10,190,63451,1550.043
Total6897100%41,716,996274,8020.1782
Table 3. Media output scores by Favorability.
BrandsFavorable MOSUnfavorable MOSMOS
Altice69−2940
NOS53−1439
Vodafone24−203
Table 4. Media Output Score by Media Outlet.
Media OutletsAlticeNOSVodafone
Dinheiro Vivo 1.431.271.07
ECO—Economia 1.251.090.57
Executive Digest 0.310.170.22
Expresso 0.021.800.01
Jornal Económico 0.970.480.28
Negócios 0.320.000.29
Notícias ao Minuto 0.344.551.70
Observador −1.856.172.05
RTP −1.989.15−3.01
Sapo 39.0413.880.16
Table 5. Article analysis examples.
Media Outlet: ObservadorMedia Outlet: Sapo
Date: 15 July 2022Date: 25 February 2022
Headline: Cartão Vermelho. MP também investiga Porto, família Pinto da Costa e empresa AlticeHeadline: MEO oferece chamadas gratuitas para a Ucrânia e acesso à Ukrainian TV
Brand:AlticeBrand: Altice
MOS: −1.07MOS: 1.42
Prominence: 3Prominence: 3
Tone: −1.04Tone: 0.98
Readership: 4746Readership: 8923
Readership after targeting: 4271Readership after targeting: 3569
Engaged: 2650Engaged: 3982
Disclaimer/Publisher’s Note: The statements, opinions and data contained in all publications are solely those of the individual author(s) and contributor(s) and not of MDPI and/or the editor(s). MDPI and/or the editor(s) disclaim responsibility for any injury to people or property resulting from any ideas, methods, instructions or products referred to in the content.

